Embed Size (px)
Citation preview
A discrete-event computer model of feline herpes
virus within cat populations
C. Cohena,*, M. Artoisb, D. Pontierc
aInstitute for Animal Neurology, Berne University and Monitoring Group, Federal Veterinary Office,
BVET-Monitoring, Scharzenburgstrasse 161, 3097 Liebefeld, Bern, SwitzerlandbCNEVA-Nancy Laboratoire d'eÂtudes sur la Rage et la Pathologie des Animaux Sauvages,
Domaine de PixeÂreÂcourt, BP-9, 54220 MalzeÂville, FrancecUMR 5558 BiomeÂtrie, GeÂneÂtique et Biologie des Populations, Universite Claude Bernard Lyon I,
43 Boulevard du 11 Novembre 1918, 69622 Villeurbanne Cedex, France
Received 6 April 1999; accepted 4 March 2000
Abstract
The purpose of this work was to study the epidemiology of feline herpes virus (FHV), which
causes a respiratory disease within natural populations of domestic cats. A stochastic model was
constructed using discrete-events simulation. Two habitats (rural vs. urban) were simulated,
featuring different demographic, spatial and social patterns. The evolution of immunity in
individuals was reproduced, allowing for the random recrudescence of latent infections (influenced
by environment and reproduction). Hypotheses concerning the circulation of FHV were examined
regarding the role of host density and the possibility of reinfection of host. Uncertainty analyses
were performed on the basis of replicated Monte Carlo sampling. The results were in good
agreement with serologic data from a long-term study conducted on five populations in France. The
model satisfactorily reproduced the variability of natural immunity, and the epidemic features
observed. The simulations have shown that FHV can persist in small populations (because of its
capacity of reactivation leading to epidemics). However, the impact on demography was not
dramatic. The most important parameters in determining change in epidemiology of FHV were:
transmission rate corresponding to `friendly' contacts, and the recrudescence rate of FHV. However,
an interaction between these two parameters did not allow estimation of their values. # 2000
Elsevier Science B.V. All rights reserved.
Keywords: Cat; Discrete-events simulation; Modeling; Feline herpes virus; Feline rhinotracheitis virus
Preventive Veterinary Medicine 45 (2000) 163±181
* Corresponding author. Tel.: �41-31-323-9549; fax: �41-31-323-9543.
E-mail address: [email protected] (C. Cohen)
0167-5877/00/$ ± see front matter # 2000 Elsevier Science B.V. All rights reserved.
PII: S 0 1 6 7 - 5 8 7 7 ( 0 0 ) 0 0 1 3 2 - X
1. Introduction
Herpes viruses are difficult to eradicate (Hickman et al., 1994), and vaccination is
not always satisfactory. Their persistence in populations is achieved in two ways:
the sequential spread of the virus from clinical case to clinical cases; and the existence
of a carrier state (characterized by a dormant phase with only intermittent episodes
of virus shedding). Recrudescence is induced by a `stress' Ð an incompletely under-
stood mechanism. In this phenomenon, an individual sheds the virus after a period
without shedding. Although herpes viruses have medical and economic consequences,
few models have been proposed to study such a specific circulation pattern (Badger
et al., 1987; Tudor, 1990; Garnett and Grenfell, 1992a,b; Ferguson et al., 1996;
Garnett and Ferguson, 1996; Blower et al., 1998; Greenhalgh et al., 2000). To our
knowledge, no model has accounted for the random nature of recrudescence Ð
which is crucial in small or isolated populations, or if contacts are highly heteroge-
neous (as in genital herpes) and for the effects of recrudescence on immunity in
individuals.
Here, a simulation model of the circulation of feline herpes virus (FHV) within
populations of domestic cats (Felis catus) is proposed. FHV causes infectious feline
rhinotracheitis (IFR), which is most severe in kittens (and typically affects young cats).
IFR represents 40% of coryza cases (a syndrome of the upper respiratory tract
representing 80% of the respiratory pathology in cats). In the model, a decrease in
immunity was induced by stochastic stimuli of recrudescence; such stimuli included
environment (e.g. climate), lactation, migration, and fights. These stimuli were applied to
an individual, a social group of cats, or the whole population.
Demography of cat populations depends on their social organization (Pontier, 1993).
Population size varies across subpopulations and can be very small (e.g. 50 cats), and
contacts between cats are determined by the social and spatial organization of the
population, which in turn depends on habitat and season (Pontier, 1993; Pontier et al.,
1995; Fromont et al., 1998). Thus, because transmission of FHV requires direct and
close contact, modeling the circulation of FHV within the host population required a
detailed representation of their social structures. Field data provided a measure of
immunity in cats. Individuals were represented to model the variability of immunity.
Discrete-events simulation was adopted. The events related to the evolution of the system
were recorded by date of occurrence in a daily diary. Such models have been constructed
to reproduce the behavior of foxes in a study of the spatio-temporal transmission of
rabies (Garnerin, 1984; Garnerin and Valleron, 1985), and to study the dynamics of
HIV infection and the impact of sexual behavior on the AIDS epidemic (Le Pont, 1991;
Le Pont and Valleron, 1993). These are models for experimentation rather than for
prediction. On average, half of the cats sampled in the field study were naturally immune.
Because FHV has a dramatic impact on demography in catteries (Hickman et al., 1994),
we used discrete-events simulation of FHV to address whether FHV has a dramatic
impact also on the demography of populations in natural habitats. Additionally, the
model was used to test whether FHV leads to epidemics in natural populations, which
was suggested because the observed proportion of immune cats could take a large range
of values.
164 C. Cohen et al. / Preventive Veterinary Medicine 45 (2000) 163±181
2. Materials and methods
2.1. The host populations
Two urban populations and three rural populations have been monitored in France
(Pontier, 1993; Courchamp, 1996; XeÂmar, 1997): Lyon, since 1991 (middle-east of
France); Nancy, since 1995 (north-east); Saint-Just Chaleyssin, since 1982 (near Lyon);
Barisey-la-coÃte, since 1990 (near Nancy); and Aimargues, since 1982 (south-east). The
survey was conducted on a sample of cats each year, and representiveness was assessed
by extensive observational studies (Courchamp, 1996). During a trapping session, we
marked animals using a colored collar and an electronic device (Transpondeur TROVAN)
was injected under the shoulder skin for a permanent individual identification. We
visually recognized all individuals by their coat-color pattern and hair length or colored
collar. During each trapping session, all cats were anesthezied; they were then sexed,
weighed, and had several morphometric variables recorded. Age was known for most
cats. The cats were not vaccinated.
These sites are characterized by their demographic, reproductive, social and spatial
patterns (Liberg and Sandell, 1988; Natoli and De Vito, 1988; Pontier, 1993). The queen's
spatial distribution depends on feeding resources. In rural areas, females are associated
with human shelters, and the male's spatial organization is determined by receptive
females. Cats live alone or in small groups of two cats per house, and have individual
territories. In urban areas, stray cats form large social groups (called `̀ matrilineal
groups''), which are lineages of 4±6 maternally related cats. Density is high in these
groups (up to 2000 kmÿ2), and much lower in rural areas (<250 kmÿ2). Different mating
systems are related to this organization, from promiscuity in urban sites, to polygyny with
monopolization of females in rural sites (Liberg, 1981; Natoli and De Vito, 1991; Pontier
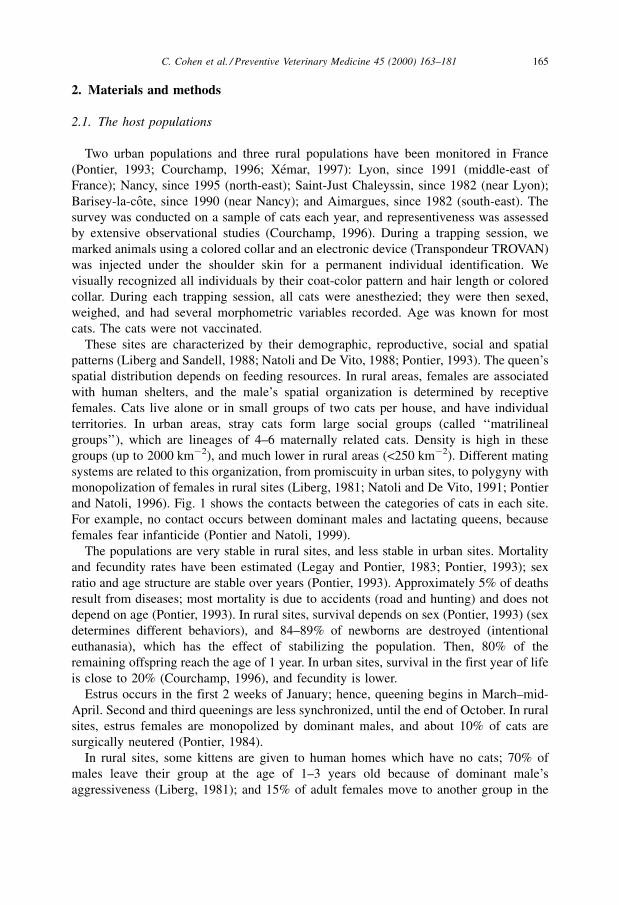
and Natoli, 1996). Fig. 1 shows the contacts between the categories of cats in each site.
For example, no contact occurs between dominant males and lactating queens, because
females fear infanticide (Pontier and Natoli, 1999).
The populations are very stable in rural sites, and less stable in urban sites. Mortality
and fecundity rates have been estimated (Legay and Pontier, 1983; Pontier, 1993); sex
ratio and age structure are stable over years (Pontier, 1993). Approximately 5% of deaths
result from diseases; most mortality is due to accidents (road and hunting) and does not
depend on age (Pontier, 1993). In rural sites, survival depends on sex (Pontier, 1993) (sex
determines different behaviors), and 84±89% of newborns are destroyed (intentional
euthanasia), which has the effect of stabilizing the population. Then, 80% of the
remaining offspring reach the age of 1 year. In urban sites, survival in the first year of life
is close to 20% (Courchamp, 1996), and fecundity is lower.
Estrus occurs in the first 2 weeks of January; hence, queening begins in March±mid-
April. Second and third queenings are less synchronized, until the end of October. In rural
sites, estrus females are monopolized by dominant males, and about 10% of cats are
surgically neutered (Pontier, 1984).
In rural sites, some kittens are given to human homes which have no cats; 70% of
males leave their group at the age of 1±3 years old because of dominant male's
aggressiveness (Liberg, 1981); and 15% of adult females move to another group in the
C. Cohen et al. / Preventive Veterinary Medicine 45 (2000) 163±181 165
neighborhood when they are disturbed. In urban areas, dispersion is much lower, and
males and females are philopatric (Pontier, 1993).
2.2. The microparasite
The populations and the virus have long been present in the sites studied. The sera of
all captured cats were tested by seroneutralisation on cell culture for evidence of FHV-
specific antigen (at 2-fold dilutions from 2 to 256). During the entire study, 1005 cats
were tested and 413 had detectable antibodies (216 of 611 in rural areas; 197 of 394 in
urban areas). Except for the 12 cats in Lyon in 1994, immune cats were found in every
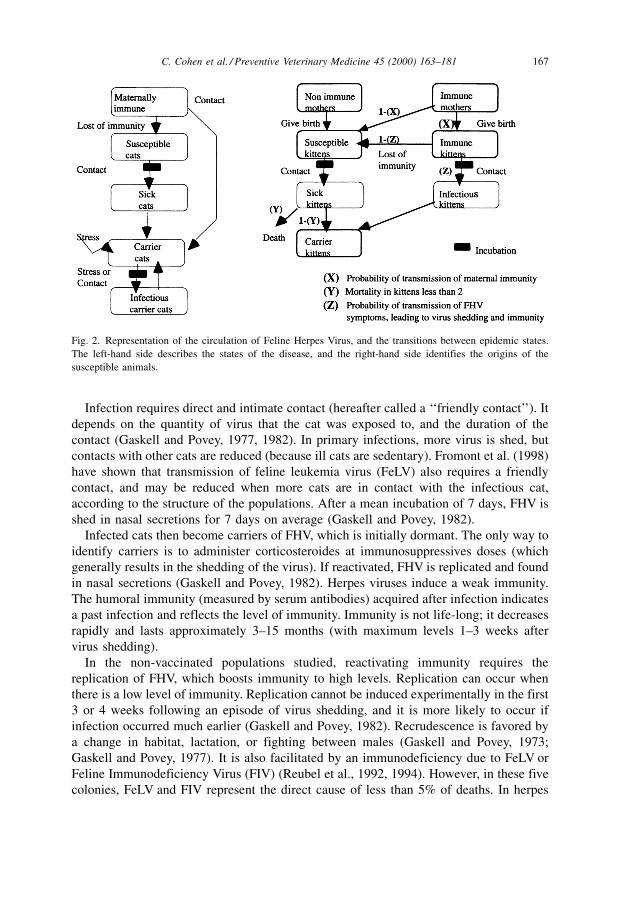
site (maximum prevalence 70% in 27 cats) (Fromont et al., 1996). Fig. 2 gives the
transitions between disease's stages, and the susceptible cat's origin.
Fig. 1. Representation of the social and spatial organization of the populations. Plain circles stand for
matrilineal groups associated with human shelters; and the lines indicate the possibilities of contacts between the
different categories of free-roaming cats.
166 C. Cohen et al. / Preventive Veterinary Medicine 45 (2000) 163±181
Infection requires direct and intimate contact (hereafter called a `̀ friendly contact''). It
depends on the quantity of virus that the cat was exposed to, and the duration of the
contact (Gaskell and Povey, 1977, 1982). In primary infections, more virus is shed, but
contacts with other cats are reduced (because ill cats are sedentary). Fromont et al. (1998)
have shown that transmission of feline leukemia virus (FeLV) also requires a friendly
contact, and may be reduced when more cats are in contact with the infectious cat,
according to the structure of the populations. After a mean incubation of 7 days, FHV is
shed in nasal secretions for 7 days on average (Gaskell and Povey, 1982).
Infected cats then become carriers of FHV, which is initially dormant. The only way to
identify carriers is to administer corticosteroides at immunosuppressives doses (which
generally results in the shedding of the virus). If reactivated, FHV is replicated and found
in nasal secretions (Gaskell and Povey, 1982). Herpes viruses induce a weak immunity.
The humoral immunity (measured by serum antibodies) acquired after infection indicates
a past infection and reflects the level of immunity. Immunity is not life-long; it decreases
rapidly and lasts approximately 3±15 months (with maximum levels 1±3 weeks after
virus shedding).
In the non-vaccinated populations studied, reactivating immunity requires the
replication of FHV, which boosts immunity to high levels. Replication can occur when
there is a low level of immunity. Replication cannot be induced experimentally in the first
3 or 4 weeks following an episode of virus shedding, and it is more likely to occur if
infection occurred much earlier (Gaskell and Povey, 1982). Recrudescence is favored by
a change in habitat, lactation, or fighting between males (Gaskell and Povey, 1973;
Gaskell and Povey, 1977). It is also facilitated by an immunodeficiency due to FeLV or
Feline Immunodeficiency Virus (FIV) (Reubel et al., 1992, 1994). However, in these five
colonies, FeLV and FIV represent the direct cause of less than 5% of deaths. In herpes
Fig. 2. Representation of the circulation of Feline Herpes Virus, and the transitions between epidemic states.
The left-hand side describes the states of the disease, and the right-hand side identifies the origins of the
susceptible animals.
C. Cohen et al. / Preventive Veterinary Medicine 45 (2000) 163±181 167
infections, there are no controlled experiments to suggest whether contacts with cases
increase, decrease, or do not affect the likelihood of reactivating the virus and/or being
reinfected. In Aujeszky's disease (an herpes infection in pigs), immunity to reinfection is
brief. Reinfected pigs show only mild clinical signs and a reduced virus shedding
(Greenhalgh et al., 2000). In cats, the lack of variability of FHV does not allow us to
distinguish between strains (Herrmann et al., 1984; Pratelli et al., 1999). Therefore, the
hypothesis of reinfection has not been challenged experimentally.
Rhinotracheitis results in a high case-fatality risk in kittens. In the first week of life, all
infected kittens die; however, after 2 months, <10% die. The average case-fatality risk is
62% (Hickman et al., 1994). To get maternal antibodies, newborns must ingest sufficient
colostrum. Depending on the queen's levels, maternal immunity lasts <3 months, with a
half-life of 18.5 days (Gaskell and Povey, 1982; Gaskell and Goddard, 1984). A kitten
with low (but present) levels of maternal antibodies can be infected. In that case, it
becomes a carrier without showing clinical symptoms (Povey, 1979; Gaskell and Povey,
1982).
2.3. The computer model of simulation
2.3.1. Program of discrete event simulation
Our model was based on the methodology first developed by Garnerin (Garnerin, 1984;
Garnerin and Valleron, 1985) and Le Pont (Le Pont, 1991; Le Pont and Valleron, 1993).
The individuals, social groups, events, and dates were represented by data structures,
using the language C. An individual was characterized by several descriptors: age, sex,
neutering status, reproduction cycle (estrus, pregnancy, lactation, or none of these),
epidemiological status (maternally immune, susceptible, infected, infectious, non-
infectious carrier), stress, immunity (nine values representing the dilutions used in
antibody titration: 256, 128, 64, 32, 16, 8, 4, 2, or 0; 0 corresponds to the susceptible
state); time for a decrease of one value in immunity, or half-life of immunity; number of
recrudescences; number of contacts; other counters used for debugging; and pointers.
These pointers were used to represent the relations between cats (Fig. 1), and thereby the
possibilities of virus transmission.
A simulation consisted of executing events every day. The execution of an event could
lead to a plan to execute a specific new event at a future date in the diary. These events
were functions that modified the variables concerning an individual, a group, or the whole
population (e.g. age was incremented by the day). Some events used random numbers
sampled from a distribution that was exponential (age at death), Poisson (e.g. infectious
period in days), or uniform (for proportions, or if there were no data to estimate a
distribution) (Tables 1 and 2). The random number generator was from Numerical
Recipes in C (Press et al., 1992).
2.3.2. Demographic functions
Demographic parameters are listed in Table 1. The values used for the average duration
of oestrus, average duration of pregnancy, and average duration of lactation were taken
from literature. The cat studies (Legay and Pontier, 1983; Pontier, 1984, 1993;
Courchamp, 1996; Pontier and Natoli, 1996; Fromont, 1997; XeÂmar, 1997) were used to
168 C. Cohen et al. / Preventive Veterinary Medicine 45 (2000) 163±181
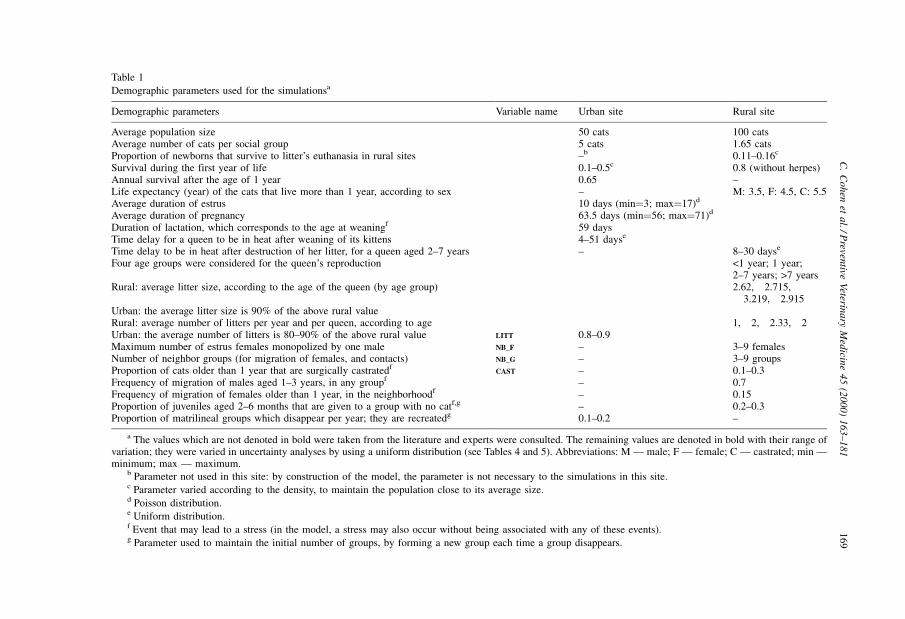
Table 1
Demographic parameters used for the simulationsa
Demographic parameters Variable name Urban site Rural site
Average population size 50 cats 100 catsAverage number of cats per social group 5 cats 1.65 catsProportion of newborns that survive to litter's euthanasia in rural sites ±b 0.11±0.16c
Survival during the first year of life 0.1±0.5c 0.8 (without herpes)Annual survival after the age of 1 year 0.65 ±Life expectancy (year) of the cats that live more than 1 year, according to sex ± M: 3.5, F: 4.5, C: 5.5Average duration of estrus 10 days (min�3; max�17)d
Average duration of pregnancy 63.5 days (min�56; max�71)d
Duration of lactation, which corresponds to the age at weaningf 59 daysTime delay for a queen to be in heat after weaning of its kittens 4±51 dayse
Time delay to be in heat after destruction of her litter, for a queen aged 2±7 years ± 8±30 dayse
Four age groups were considered for the queen's reproduction <1 year; 1 year;2±7 years; >7 years
Rural: average litter size, according to the age of the queen (by age group) 2.62, 2.715,3.219, 2.915
Urban: the average litter size is 90% of the above rural valueRural: average number of litters per year and per queen, according to age 1, 2, 2.33, 2Urban: the average number of litters is 80±90% of the above rural value LITT 0.8±0.9Maximum number of estrus females monopolized by one male NB_F ± 3±9 femalesNumber of neighbor groups (for migration of females, and contacts) NB_G ± 3±9 groupsProportion of cats older than 1 year that are surgically castratedf
CAST ± 0.1±0.3Frequency of migration of males aged 1±3 years, in any groupf ± 0.7Frequency of migration of females older than 1 year, in the neighborhoodf ± 0.15Proportion of juveniles aged 2±6 months that are given to a group with no catf,g ± 0.2±0.3Proportion of matrilineal groups which disappear per year; they are recreatedg 0.1±0.2 ±
a The values which are not denoted in bold were taken from the literature and experts were consulted. The remaining values are denoted in bold with their range ofvariation; they were varied in uncertainty analyses by using a uniform distribution (see Tables 4 and 5). Abbreviations: M Ð male; F Ð female; C Ð castrated; min Ðminimum; max Ð maximum.
b Parameter not used in this site: by construction of the model, the parameter is not necessary to the simulations in this site.c Parameter varied according to the density, to maintain the population close to its average size.d Poisson distribution.e Uniform distribution.f Event that may lead to a stress (in the model, a stress may also occur without being associated with any of these events).g Parameter used to maintain the initial number of groups, by forming a new group each time a group disappears.
C.
Co
hen
eta
l./Preven
tiveV
eterina
ryM
edicin
e45
(2000)
163±181
169
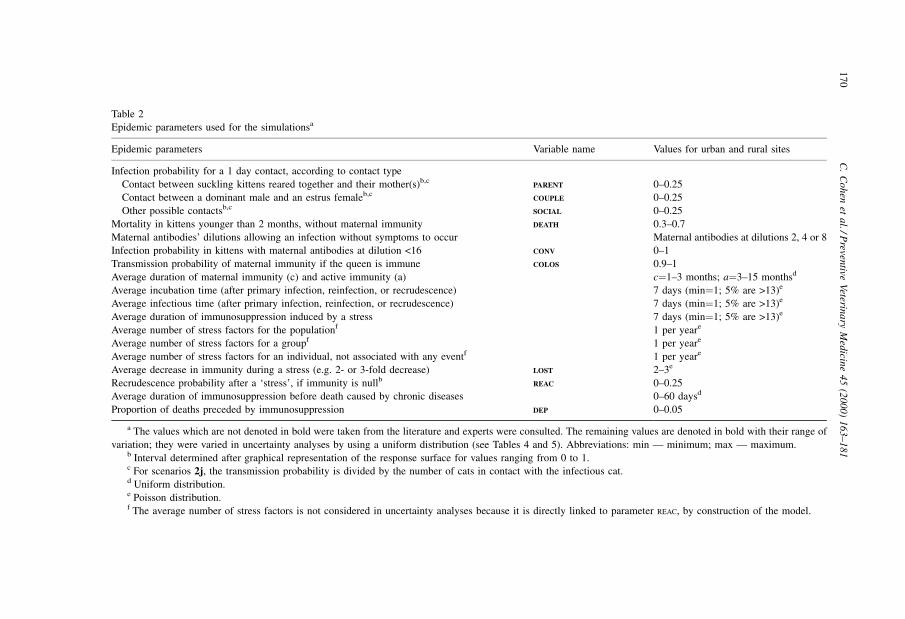
Table 2
Epidemic parameters used for the simulationsa
Epidemic parameters Variable name Values for urban and rural sites
Infection probability for a 1 day contact, according to contact type
Contact between suckling kittens reared together and their mother(s)b,cPARENT 0±0.25
Contact between a dominant male and an estrus femaleb,cCOUPLE 0±0.25
Other possible contactsb,cSOCIAL 0±0.25
Mortality in kittens younger than 2 months, without maternal immunity DEATH 0.3±0.7
Maternal antibodies' dilutions allowing an infection without symptoms to occur Maternal antibodies at dilutions 2, 4 or 8
Infection probability in kittens with maternal antibodies at dilution <16 CONV 0±1
Transmission probability of maternal immunity if the queen is immune COLOS 0.9±1
Average duration of maternal immunity (c) and active immunity (a) c�1±3 months; a�3±15 monthsd
Average incubation time (after primary infection, reinfection, or recrudescence) 7 days (min�1; 5% are >13)e
Average infectious time (after primary infection, reinfection, or recrudescence) 7 days (min�1; 5% are >13)e
Average duration of immunosuppression induced by a stress 7 days (min�1; 5% are >13)e
Average number of stress factors for the populationf 1 per yeare
Average number of stress factors for a groupf 1 per yeare
Average number of stress factors for an individual, not associated with any eventf 1 per yeare
Average decrease in immunity during a stress (e.g. 2- or 3-fold decrease) LOST 2±3e
Recrudescence probability after a `stress', if immunity is nullb REAC 0±0.25
Average duration of immunosuppression before death caused by chronic diseases 0±60 daysd
Proportion of deaths preceded by immunosuppression DEP 0±0.05
a The values which are not denoted in bold were taken from the literature and experts were consulted. The remaining values are denoted in bold with their range of
variation; they were varied in uncertainty analyses by using a uniform distribution (see Tables 4 and 5). Abbreviations: min Ð minimum; max Ð maximum.b Interval determined after graphical representation of the response surface for values ranging from 0 to 1.c For scenarios 2j, the transmission probability is divided by the number of cats in contact with the infectious cat.d Uniform distribution.e Poisson distribution.f The average number of stress factors is not considered in uncertainty analyses because it is directly linked to parameter REAC, by construction of the model.
17
0C
.C
oh
enet
al./P
reventive
Veterin
ary
Med
icine
45
(2000)
163±181
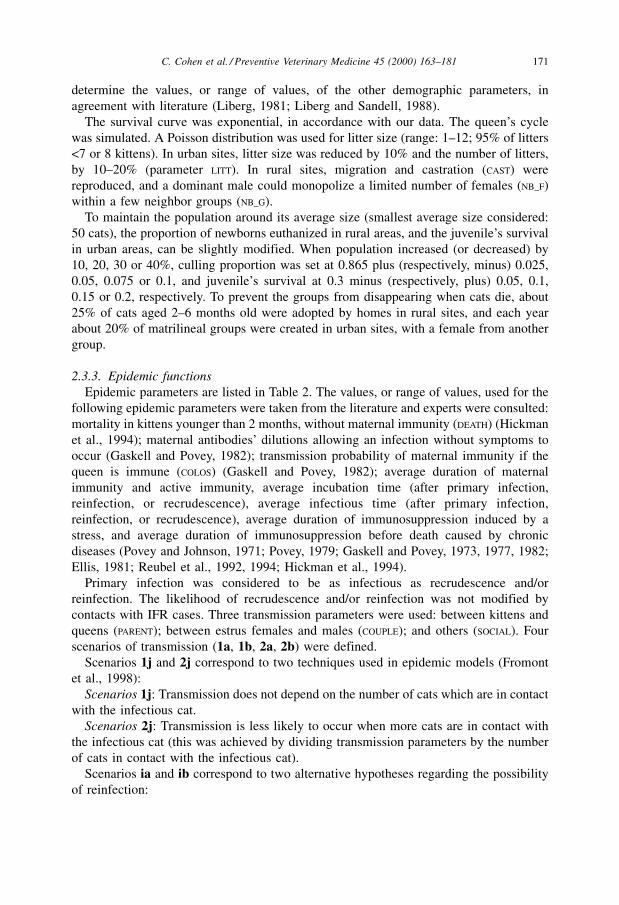
determine the values, or range of values, of the other demographic parameters, in
agreement with literature (Liberg, 1981; Liberg and Sandell, 1988).
The survival curve was exponential, in accordance with our data. The queen's cycle
was simulated. A Poisson distribution was used for litter size (range: 1±12; 95% of litters
<7 or 8 kittens). In urban sites, litter size was reduced by 10% and the number of litters,
by 10±20% (parameter LITT). In rural sites, migration and castration (CAST) were
reproduced, and a dominant male could monopolize a limited number of females (NB_F)
within a few neighbor groups (NB_G).
To maintain the population around its average size (smallest average size considered:
50 cats), the proportion of newborns euthanized in rural areas, and the juvenile's survival
in urban areas, can be slightly modified. When population increased (or decreased) by
10, 20, 30 or 40%, culling proportion was set at 0.865 plus (respectively, minus) 0.025,
0.05, 0.075 or 0.1, and juvenile's survival at 0.3 minus (respectively, plus) 0.05, 0.1,
0.15 or 0.2, respectively. To prevent the groups from disappearing when cats die, about
25% of cats aged 2±6 months old were adopted by homes in rural sites, and each year
about 20% of matrilineal groups were created in urban sites, with a female from another
group.
2.3.3. Epidemic functions
Epidemic parameters are listed in Table 2. The values, or range of values, used for the
following epidemic parameters were taken from the literature and experts were consulted:
mortality in kittens younger than 2 months, without maternal immunity (DEATH) (Hickman
et al., 1994); maternal antibodies' dilutions allowing an infection without symptoms to
occur (Gaskell and Povey, 1982); transmission probability of maternal immunity if the
queen is immune (COLOS) (Gaskell and Povey, 1982); average duration of maternal
immunity and active immunity, average incubation time (after primary infection,
reinfection, or recrudescence), average infectious time (after primary infection,
reinfection, or recrudescence), average duration of immunosuppression induced by a
stress, and average duration of immunosuppression before death caused by chronic
diseases (Povey and Johnson, 1971; Povey, 1979; Gaskell and Povey, 1973, 1977, 1982;
Ellis, 1981; Reubel et al., 1992, 1994; Hickman et al., 1994).
Primary infection was considered to be as infectious as recrudescence and/or
reinfection. The likelihood of recrudescence and/or reinfection was not modified by
contacts with IFR cases. Three transmission parameters were used: between kittens and
queens (PARENT); between estrus females and males (COUPLE); and others (SOCIAL). Four
scenarios of transmission (1a, 1b, 2a, 2b) were defined.
Scenarios 1j and 2j correspond to two techniques used in epidemic models (Fromont
et al., 1998):
Scenarios 1j: Transmission does not depend on the number of cats which are in contact
with the infectious cat.
Scenarios 2j: Transmission is less likely to occur when more cats are in contact with
the infectious cat (this was achieved by dividing transmission parameters by the number
of cats in contact with the infectious cat).
Scenarios ia and ib correspond to two alternative hypotheses regarding the possibility
of reinfection:
C. Cohen et al. / Preventive Veterinary Medicine 45 (2000) 163±181 171
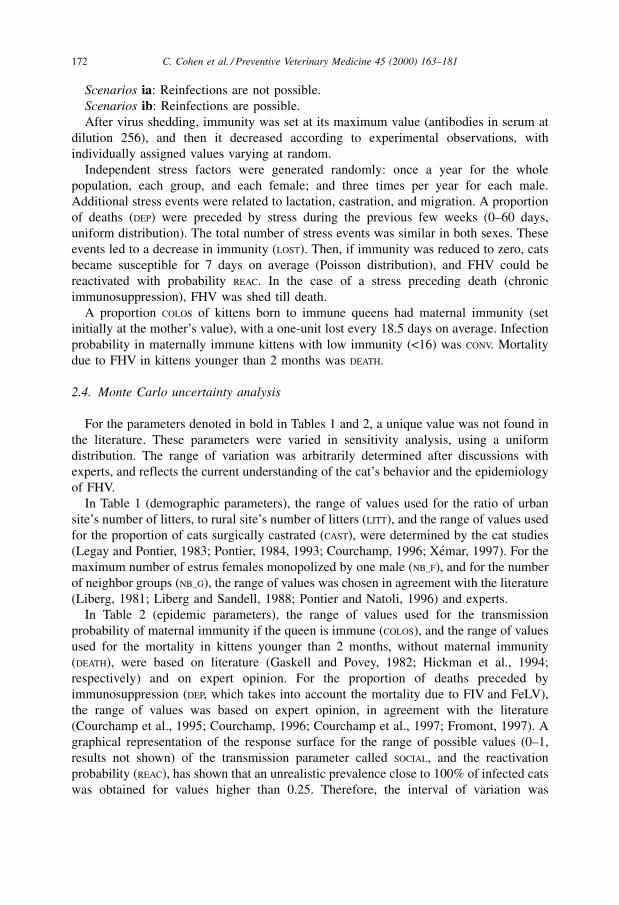
Scenarios ia: Reinfections are not possible.
Scenarios ib: Reinfections are possible.
After virus shedding, immunity was set at its maximum value (antibodies in serum at
dilution 256), and then it decreased according to experimental observations, with
individually assigned values varying at random.
Independent stress factors were generated randomly: once a year for the whole
population, each group, and each female; and three times per year for each male.
Additional stress events were related to lactation, castration, and migration. A proportion
of deaths (DEP) were preceded by stress during the previous few weeks (0±60 days,
uniform distribution). The total number of stress events was similar in both sexes. These
events led to a decrease in immunity (LOST). Then, if immunity was reduced to zero, cats
became susceptible for 7 days on average (Poisson distribution), and FHV could be
reactivated with probability REAC. In the case of a stress preceding death (chronic
immunosuppression), FHV was shed till death.
A proportion COLOS of kittens born to immune queens had maternal immunity (set
initially at the mother's value), with a one-unit lost every 18.5 days on average. Infection
probability in maternally immune kittens with low immunity (<16) was CONV. Mortality
due to FHV in kittens younger than 2 months was DEATH.
2.4. Monte Carlo uncertainty analysis
For the parameters denoted in bold in Tables 1 and 2, a unique value was not found in
the literature. These parameters were varied in sensitivity analysis, using a uniform
distribution. The range of variation was arbitrarily determined after discussions with
experts, and reflects the current understanding of the cat's behavior and the epidemiology
of FHV.
In Table 1 (demographic parameters), the range of values used for the ratio of urban
site's number of litters, to rural site's number of litters (LITT), and the range of values used
for the proportion of cats surgically castrated (CAST), were determined by the cat studies
(Legay and Pontier, 1983; Pontier, 1984, 1993; Courchamp, 1996; XeÂmar, 1997). For the
maximum number of estrus females monopolized by one male (NB_F), and for the number
of neighbor groups (NB_G), the range of values was chosen in agreement with the literature
(Liberg, 1981; Liberg and Sandell, 1988; Pontier and Natoli, 1996) and experts.
In Table 2 (epidemic parameters), the range of values used for the transmission
probability of maternal immunity if the queen is immune (COLOS), and the range of values
used for the mortality in kittens younger than 2 months, without maternal immunity
(DEATH), were based on literature (Gaskell and Povey, 1982; Hickman et al., 1994;
respectively) and on expert opinion. For the proportion of deaths preceded by
immunosuppression (DEP, which takes into account the mortality due to FIV and FeLV),
the range of values was based on expert opinion, in agreement with the literature
(Courchamp et al., 1995; Courchamp, 1996; Courchamp et al., 1997; Fromont, 1997). A
graphical representation of the response surface for the range of possible values (0±1,
results not shown) of the transmission parameter called SOCIAL, and the reactivation
probability (REAC), has shown that an unrealistic prevalence close to 100% of infected cats
was obtained for values higher than 0.25. Therefore, the interval of variation was
172 C. Cohen et al. / Preventive Veterinary Medicine 45 (2000) 163±181
arbitrarily set to 0±0.25 for these two parameters, as well as for the other transmission
parameters (PARENT and COUPLE, similar to SOCIAL).
For each of the four scenarios, 500 replicates were run; values were chosen randomly
by Latin Hypercube sampling (a type of stratified Monte Carlo sampling) (Iman and
Helton, 1988; Seaholm et al., 1988). The correlations between these values were
satisfactorily low (r<0.15). Each run was for 30 years. The virus was introduced during
the 10th year of simulation. The simulations were described for 10 years, after the virus
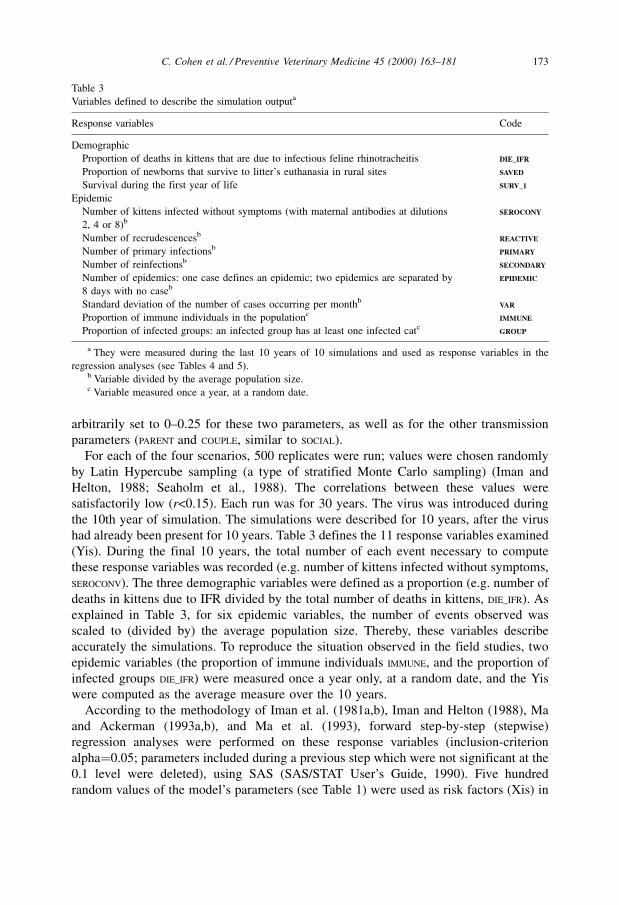
had already been present for 10 years. Table 3 defines the 11 response variables examined
(Yis). During the final 10 years, the total number of each event necessary to compute
these response variables was recorded (e.g. number of kittens infected without symptoms,
SEROCONV). The three demographic variables were defined as a proportion (e.g. number of
deaths in kittens due to IFR divided by the total number of deaths in kittens, DIE_IFR). As
explained in Table 3, for six epidemic variables, the number of events observed was
scaled to (divided by) the average population size. Thereby, these variables describe
accurately the simulations. To reproduce the situation observed in the field studies, two
epidemic variables (the proportion of immune individuals IMMUNE, and the proportion of
infected groups DIE_IFR) were measured once a year only, at a random date, and the Yis
were computed as the average measure over the 10 years.
According to the methodology of Iman et al. (1981a,b), Iman and Helton (1988), Ma
and Ackerman (1993a,b), and Ma et al. (1993), forward step-by-step (stepwise)
regression analyses were performed on these response variables (inclusion-criterion
alpha�0.05; parameters included during a previous step which were not significant at the
0.1 level were deleted), using SAS (SAS/STAT User's Guide, 1990). Five hundred
random values of the model's parameters (see Table 1) were used as risk factors (Xis) in
Table 3
Variables defined to describe the simulation outputa
Response variables Code
Demographic
Proportion of deaths in kittens that are due to infectious feline rhinotracheitis DIE_IFR
Proportion of newborns that survive to litter's euthanasia in rural sites SAVED
Survival during the first year of life SURV_1
Epidemic
Number of kittens infected without symptoms (with maternal antibodies at dilutions
2, 4 or 8)b
SEROCONY
Number of recrudescencesbREACTIVE
Number of primary infectionsbPRIMARY
Number of reinfectionsbSECONDARY
Number of epidemics: one case defines an epidemic; two epidemics are separated by
8 days with no caseb
EPIDEMIC
Standard deviation of the number of cases occurring per monthbVAR
Proportion of immune individuals in the populationcIMMUNE
Proportion of infected groups: an infected group has at least one infected catc GROUP
a They were measured during the last 10 years of 10 simulations and used as response variables in the
regression analyses (see Tables 4 and 5).b Variable divided by the average population size.c Variable measured once a year, at a random date.
C. Cohen et al. / Preventive Veterinary Medicine 45 (2000) 163±181 173
the regression analyses (see Tables 4 and 5). Given that the main effects of each
parameter were included, no 2-way interaction appeared significant. The relations were
linear; including quadratic effects did not lead to a higher adjusted R2. The ranges of
variation of recrudescence and transmission parameters (REAC, SOCIAL, PARENT, COUPLE)
were arbitrary, and different distributions were used in preliminary analyses. The resultant
partial R2 were modified, but their ranks remained unchanged (results not shown).
3. Results
3.1. Simulation results
The results presented in the next two paragraphs were directly recorded from the 500
replicates for each scenario, and were similar for the four scenarios.1
3.1.1. The impact of FHV on demography is limited
In both sites, FHV killed <10% of kittens, and did not show a dramatic impact on
demography. Indeed, in rural sites, the estimated survival in the first year of life was 80%
without rhinotracheitis and remained >77% when the virus was present. In urban sites, the
simulations have shown that a stable population size was obtained with a survival of 22%
in the first year of life, similar with and without FHV. As expected, infections occurred at
an older age in rural sites (12±18 months on average) than in urban sites (about 6
months), where kittens were not euthanized and had more contacts (see Fig. 1).
Additional results were: <5% of kittens were born in the same group with no more than
Table 4
R2 statistic of the regression performed for each response variable, per scenario and per site
Response
variablesa
Scenario 1a Scenario 2a Scenario 1b Scenario 2b
Urban
site
Rural
site
Urban
site
Rural
site
Urban
site
Rural
site
Urban
site
Rural
site
DIE_IFR 0.76 0.80 0.79 0.76 0.57 0.76 0.68 0.62
SAVED ±b 0.41 ± 0.45 ± 0.33 ± 0.41
SURV_1 0.55 0.70 0.50 0.71 0.34 0.64 0.34 0.55
SEROCONV 0.72 0.69 0.63 0.66 0.66 0.71 0.69 0.75
REACTIVE 0.88 0.92 0.86 0.85 0.88 0.91 0.81 0.72
PRIMARY 0.68 0.28 0.81 0.69 0.53 0.17 0.70 0.54
SECONDARY ± ± ± ± 0.61 0.47 0.76 0.80
EPIDEMIC 0.68 0.62 0.72 0.69 0.51 0.57 0.55 0.53
VAR 0.42 0.35 0.72 0.53 0.56 0.42 0.60 0.54
IMMUNE 0.81 0.81 0.85 0.81 0.63 0.45 0.75 0.73
GROUP 0.78 0.72 0.82 0.70 0.56 0.33 0.69 0.57
a Variables defined in Table 3.b Response variable not tested in this model.
1 Point estimates of the b's from the models are available from the first author upon request.
174 C. Cohen et al. / Preventive Veterinary Medicine 45 (2000) 163±181
one day of delay (which is necessary to benefit from antibodies of other females); and, in
rural areas, one-third of the queens aged 2±7 years had three litters per year, and a male
monopolized <1.1 estrus females on average.
3.1.2. Due to recrudescence, FHV persists in these socially structured populations and
leads to epidemics
Notably, simulations have shown that when this herpes virus was introduced in a
population, infection inevitably developed and was maintained. Also, the introduction of
FHV did not lead to the extinction of susceptible or infected cats, but to a highly variable
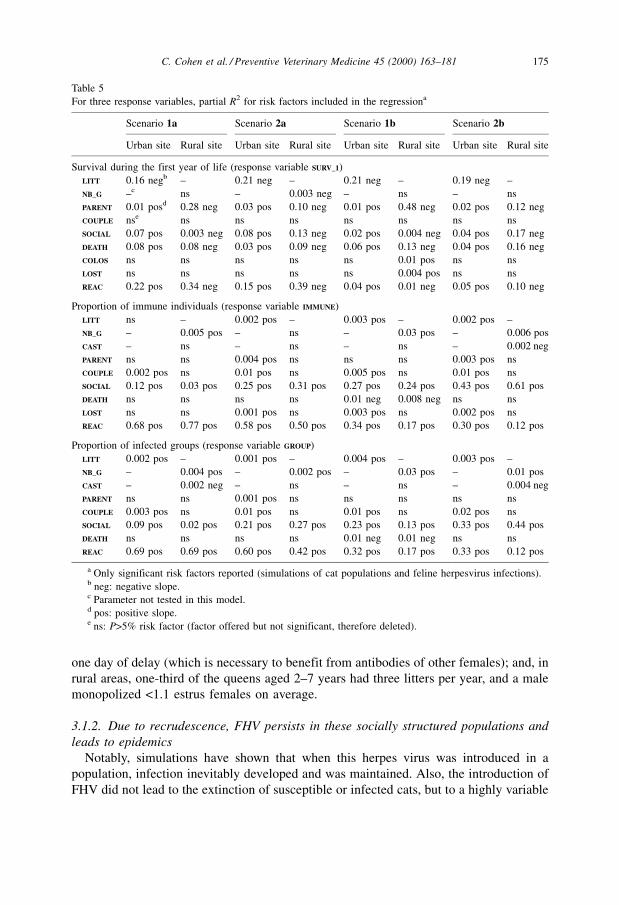
Table 5
For three response variables, partial R2 for risk factors included in the regressiona
Scenario 1a Scenario 2a Scenario 1b Scenario 2b
Urban site Rural site Urban site Rural site Urban site Rural site Urban site Rural site
Survival during the first year of life (response variable SURV_1)
LITT 0.16 negb ± 0.21 neg ± 0.21 neg ± 0.19 neg ±
NB_G ±c ns ± 0.003 neg ± ns ± ns
PARENT 0.01 posd 0.28 neg 0.03 pos 0.10 neg 0.01 pos 0.48 neg 0.02 pos 0.12 neg
COUPLE nse ns ns ns ns ns ns ns
SOCIAL 0.07 pos 0.003 neg 0.08 pos 0.13 neg 0.02 pos 0.004 neg 0.04 pos 0.17 neg
DEATH 0.08 pos 0.08 neg 0.03 pos 0.09 neg 0.06 pos 0.13 neg 0.04 pos 0.16 neg
COLOS ns ns ns ns ns 0.01 pos ns ns
LOST ns ns ns ns ns 0.004 pos ns ns
REAC 0.22 pos 0.34 neg 0.15 pos 0.39 neg 0.04 pos 0.01 neg 0.05 pos 0.10 neg
Proportion of immune individuals (response variable IMMUNE)
LITT ns ± 0.002 pos ± 0.003 pos ± 0.002 pos ±
NB_G ± 0.005 pos ± ns ± 0.03 pos ± 0.006 pos
CAST ± ns ± ns ± ns ± 0.002 neg
PARENT ns ns 0.004 pos ns ns ns 0.003 pos ns
COUPLE 0.002 pos ns 0.01 pos ns 0.005 pos ns 0.01 pos ns
SOCIAL 0.12 pos 0.03 pos 0.25 pos 0.31 pos 0.27 pos 0.24 pos 0.43 pos 0.61 pos
DEATH ns ns ns ns 0.01 neg 0.008 neg ns ns
LOST ns ns 0.001 pos ns 0.003 pos ns 0.002 pos ns
REAC 0.68 pos 0.77 pos 0.58 pos 0.50 pos 0.34 pos 0.17 pos 0.30 pos 0.12 pos
Proportion of infected groups (response variable GROUP)
LITT 0.002 pos ± 0.001 pos ± 0.004 pos ± 0.003 pos ±
NB_G ± 0.004 pos ± 0.002 pos ± 0.03 pos ± 0.01 pos
CAST ± 0.002 neg ± ns ± ns ± 0.004 neg
PARENT ns ns 0.001 pos ns ns ns ns ns
COUPLE 0.003 pos ns 0.01 pos ns 0.01 pos ns 0.02 pos ns
SOCIAL 0.09 pos 0.02 pos 0.21 pos 0.27 pos 0.23 pos 0.13 pos 0.33 pos 0.44 pos
DEATH ns ns ns ns 0.01 neg 0.01 neg ns ns
REAC 0.69 pos 0.69 pos 0.60 pos 0.42 pos 0.32 pos 0.17 pos 0.33 pos 0.12 pos
a Only significant risk factors reported (simulations of cat populations and feline herpesvirus infections).b neg: negative slope.c Parameter not tested in this model.d pos: positive slope.e ns: P>5% risk factor (factor offered but not significant, therefore deleted).
C. Cohen et al. / Preventive Veterinary Medicine 45 (2000) 163±181 175
situation characterized by outbreaks of rhinotracheitis. By graphical examination of the
simulations, IFR outbreaks appeared to occur at random, with no difference among sites.
For instance, the average number of days when at least one cat was sick was similar in
both sites (e.g. with scenario 2b: 58 days per year in urban sites; 56 days per year in rural
sites). Moreover, scenarios allowing for reinfections (scenarios ib) and scenarios not
allowing for reinfections (scenarios ia) did not lead to a different range of output values;
e.g. in urban sites, the number of new outbreaks per year (EPIDEMIC) ranged from 0.16 to
3.69 (average 2.34, standard deviation 1.08) with scenario 2b and from 0.15 to 3.71
(average 2.09, standard deviation 1.16) with scenario 2a.
However, without recrudescence (REAC set to 0), infection was not maintained in these
populations Ð even with high transmission rates. This may be explained by the small size
of these isolated populations, and by their social structure (see Fig. 1). Indeed, in urban
sites, the simulations have shown that an individual was related to an average of five cats
for contacts between queens and kittens (PARENT), five for contacts between males and
estrus females (COUPLE), and 10 for other contacts (SOCIAL); in rural sites, these figures
were 1 or 2 cats (PARENT, COUPLE), and <7 (SOCIAL).
3.2. Results of the uncertainty analyses
3.2.1. Three variables (DIE_IFR, SEROCONV, REACTIVE) satisfactorily assessed the models
consistency
Three response variables typically had high R2 (Table 4) because they were, by design
of the simulation model, directly related to a risk factor: the death rate of kittens as a
consequence of rhinotracheitis (DIE_IFR) depends directly on mortality due to
rhinotracheitis in kittens (DEATH); the number of maternally immune kittens that were
infected (SEROCONV), on the probability that such a transmission occurs (CONV); and the
number of recrudescences (REACTIVE), on recrudescence rate (REAC).
3.2.2. Uncertainty analyses were consistent with the simulation results presented in
Section 3.1
Poor R2 (<0.56) were found for the proportion of newborns not euthanized (SAVED) in
rural sites, and for juvenile's survival (SURV_1) in urban sites. Because these variables were
used to regulate the population, this result indicates that the impact of FHV on
populations was limited in the two habitats.
The habitats sometimes appeared to have different R2 (by inspection); e.g. in urban
sites, there were higher R2 for the number of new infections (PRIMARY). However, the
temporal variability of the number of cases (VAR) typically had poor R2. This is consistent
with simulation results and graphical examination of the simulations, showing a similar
situation characterized by IFR outbreaks for most runs.
3.2.3. Uncertainty analyses have shown how the three selected response variables
depend on input parameters
Three variables can be measured in the field and had high R2: juvenile's survival
(SURV_1); proportion of immune cats (IMMUNE); and proportion of infected groups (GROUP).
For these three regression models, Table 5 provides the partial R2 by risk factor. These
176 C. Cohen et al. / Preventive Veterinary Medicine 45 (2000) 163±181
analyses aim to describe the complex relations between stochastic outputs and input
parameters.
By design, some parameters were not influential: the maximum number of estrus
females monopolized by one male (NB_F); and the average decrease in immunity due to a
stress (LOST), which is redundant with the reactivation rate (REAC) in the simulations.
Other infections (DEP) were not significant. This means that it is not necessary to model
the random variations of these parameters. To simplify the model, the contributions of
maternal immunity (COLOS) to juvenile's survival (SURV_1), and of castration (CAST) to the
proportions of immune cats (IMMUNE) and infected groups (GROUP), may also be
considered as negligible.
Finally, recrudescence (REAC) and the main transmission parameter (SOCIAL) were the
most influential, as expected. When reinfections occurred (scenarios ib), transmission
was more influential, and recrudescence less influential but still significant. This was
because the effects of transmission and recrudescence were not independent, as shown by
graphical examination (figures not shown): in each scenario and site, the proportion of
immune cats (IMMUNE) took similar values with high transmission values (SOCIAL) and low
recrudescence values (REAC), or the converse.
More precisely, juvenile's survival (SURV_1) was mainly determined by recrudescence
(REAC), transmission (PARENT, SOCIAL), mortality due to the disease (DEATH), and fecundity
(LITT). In rural sites, the positive sign of the relations came from the link between culling
of newborns and density. The proportions of immune cats (IMMUNE) and infected groups
(GROUP) were mainly explained by recrudescence (REAC), transmission (SOCIAL, COUPLE),
spatial distribution of the groups (NB_GR), and fecundity (LITT). In urban sites, the
contribution of fecundity (LITT) may result from the relation between juvenile's survival
and density, and the contribution of transmission between males and estrus females
(COUPLE) may result from the fact that estrus females have contacts with more males (see
Fig. 1).
Whereas transmission between females and kittens (PARENT) had an influence on
survival during the first year of life (SURV_1), this risk factor had no significant effect on
the proportions of immune cats (IMMUNE) and infected groups (GROUP), which were
measured at the population level. Hence, whereas some of the kittens were killed by the
virus, prevalence of immunity in the population and spatial clustering of infection among
social groups did not appear to be directly determined by transmission within litters. This
appears consistent with the fact that a similar range of simulation results was found in
both sites although the number of kittens was much lower in rural sites (where >80% of
newborns were culled).
4. Discussion
Because they live in a variety of ecological conditions, domestic cat's populations
show a high degree of variability in their spatial and social structures. The wide
prevalence of FHV infection in populations of domestic cats provides an opportunity to
analyze the consequences of population structures on the virus circulation. Although
rhinotracheitis killed up to 10% of kittens, the impact on demography was not dramatic.
C. Cohen et al. / Preventive Veterinary Medicine 45 (2000) 163±181 177
This was due to the prolificity and the rapid turnover rate of these populations, with a
mean life expectancy of approximately 3 years (Pontier, 1993). Indeed, the mortality due
to FHV in kittens may be compared to the mortality due to other reasons during the first
year of life, which was close to 20% in rural sites and almost 80% in urban sites. And,
these simulation results were in full agreement with field data (Pontier, 1984, 1993;
Fromont, 1997; XeÂmar, 1997; Fromont et al., 1998).
The effect of recrudescence on immunity was reproduced, and four scenarios of
transmission were examined. The patterns of the disease were satisfactorily simulated:
this virus led to epidemics, and never disappeared from the populations. This agrees with
observations from a long-term study conducted on several natural populations of
domestic cats in France (Fromont et al., 1996) and with other surveys (Povey and
Johnson, 1971; Ellis, 1981; Harbour et al., 1991). Moreover, simulations have shown that,
after their immunity has declined to undetectable levels, carrier cats spend on average less
than 1 year before a recrudescence or a reinfection occurs. Such a short interval is
consistent with the fact that in experimental and field data, recrudescence or reinfection
does not lead to severe clinical symptoms. Notably, our stochastic model has shown that,
without recrudescence, FHV would disappear in a closed population. The ability of this
herpes virus to persist in small populations depends on recrudescence (whereby carriers
shed FHV several months or years after an outbreak). This is consistent with the field
survey, where infected cats were found in every site (except in a sample of 12 cats). For
comparison, FeLV has a similar transmission to that of FHV (close friendly contacts) but
no recrudescence. FeLV may disappear in the studied populations Ð notably in rural sites
where the number of contacts is lower (Fromont et al., 1998). Hence, recrudescence
appears to be an efficient strategy for FHV to persist in small and socially structured
populations.
Uncertainty analyses allowed us to identify parameters of little influence, such as the
impact of other diseases (DEP). Therefore, the model can be simplified by setting these
parameters to a constant value. Influential parameters were also identified: transmission
probability (SOCIAL) and recrudescence probability (REAC). However, similar results were
achieved with either high values of SOCIAL and low values of REAC, or the converse; such a
relationship would not allow us to estimate these parameters. Regarding the question of
reinfection, another limitation was that it was impossible to differentiate the scenarios of
transmission, although we examined two areas (urban and rural) and two simulation
techniques (scenarios 1j and 2j: scenarios 2j led to higher R2 for some variables but lower
R2 for other variables). This is because the proportion of immune cats took a wide range
of values in the field survey, and outputs were realistic for almost any set of parameter's
values. Consequently, the simulations could not be classified as `good' or `bad' (Spear
et al., 1994; Spear, 1997; Eisenberg et al., 1998). Indeed, rather than estimation of
parameters, the aim of this work was the conceptualization of a complex epidemiological
system. Here, the model indicates that extensive epidemiological data would not enable to
test the possibility of reinfection, and observational studies may be useless for this
purpose.
To conclude, modeling heterogeneity in contact patterns was crucial to the study of
FHV circulation, where transmission requires intimate contact. Our model was derived
from Le Pont's model of sexual networks and HIV (1991); her model led to estimate the
178 C. Cohen et al. / Preventive Veterinary Medicine 45 (2000) 163±181
risk of HIV in blood transfusion and may also be helpful for genital herpes in humans.
Moreover, our program can represent familial links, and thereby the genetic structure of
the populations (which may be useful in future work, Pontier et al., 1995). Finally,
because FHV has been found in several wild felids (Pratelli et al., 1999) such as wild cats
(Felis silvestris) in Europe (Artois and Remond, 1994) Ð the model can be adapted to
address questions relevant to the impact of FHVon these populations, where the turn-over
rate may be lower, and the impact of FHV more important.
Acknowledgements
The authors thank the CNEVA, CNRS and INSERM, Heather Allore, Michel Aubert,
Eveline CaõÈn, SteÂphane Chaffaux, Gilles Chappuis, Marguerite Guiguet, Franc,oise Le
Pont, MicheÁle Remond, Etienne Thiry, Alain-Jacques Valleron, and an anonymous
referee, for their help.
References
Artois, M., Remond, M., 1994. Viral diseases as a threat to free-living wild cats (Felis silvestris) in Continental
Europe. Vet. Rec. 134, 651±652.
Badger, G., Vacek, P., Reichman, R., 1987. A Markov model for a clinical episode of recurrent Genital Herpes.
Biometrics 43, 399±408.
Blower, S., Porco, T., Darby, G., 1998. Predicting and preventing the emergence of antiviral drug resistance in
HSV-2. Nat. Med. 4, 673±678.
Courchamp, F., 1996. Epidemiological study of Feline Iimmunodeficiency Virus in domestic cat populations
(Felis catus). Ph.D. Thesis. Lyon I University, France, 212 p.
Courchamp, F., Pontier, D., Fromont, E., Artois, M., 1995. Impact of two feline retroviruses on natural
populations of domestic cats. Mammalia 59, 589±598.
Courchamp, F., Suppo, C., Fromont, E., Bouloux, C., 1997. Dynamics of two feline retroviruses (FIV and FeLV)
within one population of domestic cats. Proc. R. Soc. London B 264, 785±794.
Eisenberg, J., Seto, E., Colford, J., Olivieri, A., Spear, R., 1998. An analysis of the Milwaukee Cryptosporidiosis
outbreak based on a dynamic model of the infection process. Epidemiology 9, 255±263.
Ellis, T., 1981. Feline respiratory virus carriers in clinically healthy cats. Aust. Vet. J. 57, 115±118.
Ferguson, N., Anderson, R., Garnett, G., 1996. Mass vaccination to control chickenpox: the influence of zoster.
Proc. Natl. Acad. Sci. USA 93, 7231±7235.
Fromont, E., 1997. Comparative analysis of the transmission of five viruses in populations of domestic cats
(Felis catus). Ph.D. Thesis. Lyon I University, France, 213 p.
Fromont, E., Artois, M., Pontier, D., 1996. Cat population structure and circulation of feline viruses. Acta
Oecologia 17, 609±620.
Fromont, E., Pontier, D., Langlais, M., 1998. Dynamics of feline retrovirus (FeLV) in host populations with
variable spatial structures. Proc. R. Soc. London B 265, 1097±1104.
Garnerin, P., 1984. ModeÂlisation de la dynamique spatio-temporelle d'une eÂpi-enzootie de rage vulpine. Ph.D.
Thesis. Paris VII University, France, 65 pp.
Garnerin, P., Valleron, A.-J., 1985. Un modeÁle informatique eÂveÂnementiel de la rage vulpine. Revue
d'EpideÂmiologie et Sante Publique 33, 29±38.
Garnett, G., Ferguson, N., 1996. Predicting the effect of varicella vaccine on subsequent cases of zoster and
varicella. Rev. Med. Virol. 6, 151±161.
Garnett, G., Grenfell, B., 1992a. The epidemiology of varicella-zoster virus infections: a mathematical model.
Epidemiol. Infect. 108, 495±511.
C. Cohen et al. / Preventive Veterinary Medicine 45 (2000) 163±181 179
Garnett, G., Grenfell, B., 1992b. The epidemiology of varicella-zoster virus infections: the influence of varicella
on the prevalence of herpes zoster. Epidemiol. Infect. 108, 513±528.
Gaskell, R., Goddard, L., 1984. The epizootiology of feline viral rhinotracheitis with particular reference of the
nature and role of the carrier state. In: Wittmann, G., Gaskell, R., Rziha, H. (Eds.), Latent Herpes Virus
Infections in Veterinary Medicine. Marunus Nijhoff, Dordrecht, pp. 337±349.
Gaskell, R., Povey, R., 1973. Re-excretion of feline viral rhinotracheitis following corticosteroid treatment. Vet.
Rec. 93, 204±205.
Gaskell, R., Povey, R., 1977. Experimental induction of feline rhinotracheitis virus re-excretion in FVR-
recovered cats. Vet. Rec. 100, 128±133.
Gaskell, R., Povey, R., 1982. Transmission of feline rhinotracheitis virus. Vet. Rec. 111, 359±362.
Greenhalgh, D., Diekmann, O., De Jong, M., 2000. Subcritical endemic steady states in mathematical models for
animal diseases with incomplete immunity. Math. Biosci., in press.
Harbour, D., Howard, P., Gaskell, R., 1991. Isolation of Feline Calicivirus and Feline Herpesvirus from domestic
cats 1980 to 1989. Vet. Rec. 128, 77±80.
Herrmann, S., Gaskell, R., Ehlers, B., Ludwig, H., 1984. Characterization of the Feline Herpesvirus genome and
molecular epidemiology of isolates from natural outbreaks and latent infections. In: Wittmann, G., Gaskell,
R., Rziha, H. (Eds.), Latent Herpes Virus Infections in Veterinary Medicine. Marunus Nijhoff, Dordrecht,
pp. 321±335.
Hickman, M., Reubel, G., Hoffman, D., Morris, J., Rogers, Q., Pedersen, N., 1994. An epizootic of Feline
Herpesvirus type 1 in a large specific pathogen-free cat colony and attemps to eradicate the infection by
identification and culling of carriers. Lab. Animals 28, 320±329.
Iman, R., Helton, J., 1988. An investigation of uncertainty and sensitivity analysis techniques for computer
models. Risk Anal. 8, 71±90.
Iman, R., Helton, J., Campbell, J., 1981a. An approach to sensitivity analysis of computer models: Part I.
Introduction, input variable selection and preliminary variable assessment. J. Qual. Technol. 13, 174±183.
Iman, R., Helton, J., Campbell, J., 1981b. An approach to sensitivity analysis of computer models: Part II.
Ranking of input variables, response surface validation, distribution effect and technique synopsis. J. Qual.
Technol. 13, 232±240.
Le Pont, F., 1991. ModeÂlisation appliqueÂe aÁ l'eÂtude de l'eÂpideÂmiologie de l'infection aÁ VIH: estimation des
risques de transmission du VIH et de l'impact du comportement sexuel sur l'eÂpideÂmie. Ph.D. Thesis. Paris
VII University, France, 235 pp.
Le Pont, F., Valleron, A.J., 1993. ModeÂlisation eÂveÂnementielle de la dynamique de la transmission de l'infection
aÁ virus de l'immunodeÂficience humaine: un exemple pour l'eÂpideÂmiologie animale. Revue Scientifique et
Technique de l'Office International des Epizooties 12, 75±82.
Legay, J., Pontier, D., 1983. Age, courbe de survie et taille des groupes dans les populations de Chats. Comptes
Rendus de l'AcadeÂmie des Sciences de Paris, SeÂrie III 296 (17), 33±36.
Liberg, O., 1981. Predation and social behaviour in a population of domestic cat: an evolutionary perspective.
Ph.D. Thesis. University of Lund, Sweden, 133 p.
Liberg, O., Sandell, M., 1988. Spatial organisation and reproductive tactics in the domestic cat and other
felids. In: The Domestic Cat: The Biology of its Behaviour. Cambridge University Press, Cambridge, pp.
83±98.
Ma, J., Ackerman, E., Yang, J., 1993. Parameter sensitivity of a model of viral epidemics simulated with Monte
Carlo techniques. I. Illness attack rates. Int. J. Biomed. Comput. 32, 237±253.
Ma, J., Ackerman, E., 1993a. Parameter sensitivity of a model of viral epidemics simulated with Monte Carlo
techniques. II. Durations and peaks. Int. J. Biomed. Comput. 32, 255±268.
Ma, J., Ackerman, E., 1993b. Parameter sensitivity of a model of viral epidemics simulated with Monte Carlo
techniques. III. Optimization strategies. Int. J. Biomed. Comput. 33, 93±107.
Natoli, E., De Vito, E., 1988. The mating system of feral cats living in a group. In: The Domestic Cat: The
Biology of its Behaviour. Cambridge University Press, Cambridge, pp. 89±108.
Natoli, E., De Vito, E., 1991. Agonistic behaviour, dominance rank and copulatory success in a large multi-male
feral cat (Felis catus L.) colony in central Rome. Anim. Behaviour 42, 227±242.
Pontier, D., 1984. Contribution aÁ la biologie et aÁ la geÂneÂtique des populations de chats domestiques (Felis catus).
Ph.D. Thesis. Lyon I University, France, 145 p.
180 C. Cohen et al. / Preventive Veterinary Medicine 45 (2000) 163±181
Pontier, D., 1993. Analyse de la variabilite des traits d'histoire de vie chez les mammifeÁres. MeÂmoire
d'habilitation aÁ diriger des recherches. Lyon I University, France, 90 p.
Pontier, D., Natoli, E., 1996. Reproductive success of male domestic cats (Felis catus L.): a case history.
Behavioural Process. 37, 85±88.
Pontier, D., Rioux, N., Heizmann, A., 1995. Evidence of selection on the orange allele in domestic cat Felis
catus: the role of social structure. Oikos 73, 299±308.
Pontier, D., Natoli, E., 1999. Infanticide in rural male cats (Felis catus L.) as a reproductive mating tactic.
Aggressive Behaviour 25, 445±449.
Povey, R., 1979. A review of Feline Viral Rhinotracheitis (Feline Herpes Virus-I infection). Comp. Immunol.
Microbiol. Infect. Dis. 2, 373±387.
Povey, R., Johnson, R., 1971. A survey of Feline Viral Rhinotracheitis and Feline Picornavirus Infection in
Britain. J. Small Anim. Practice 12, 233±247.
Pratelli, A., Tempesta, M., De Palma, M., Martella, V., Buonavoglia, C., 1999. Restriction endonuclease analysis
of feline herpesvirus 1 DNA isolated from wild felids. Vet. Rec. 144, 537±538.
Press, W., Teukolsky. S., Vetterling, W., Flannery, B., 1992. Numerical Recipies in C. The Art of Scientific
Computing. Random Numbers. Cambridge University Press, Cambridge, pp. 274±328 (Chapter 7).
Reubel, G., Dean, G., George, J., Barlough, J., Pedersen, N., 1994. Effects of incidental infections and immune
activation on disease progression in experimentally Feline Immunodeficiency Virus-infected cats. J.
Acquired Immune Deficiency Syndromes 7, 1003±1015.
Reubel, G., George, J., Barlough, J., Higgins, J., Grant, C., Pedersen, N., 1992. Interaction of acute feline
herpesvirus-1 and chronic immunodeficiency virus infections in experimentally infected specific pathogen
free cats. Vet. Immunol. Immunopathol. 35, 95±119.
SAS/STAT User's Guide, 1990. The GLM Procedure, Vol. 2. SAS Institute, Cary, NC, pp. 891±996 (Chapter 24).
Seaholm, S., Ackerman, E., Wu, S., 1988. Latin Hypercube sampling and sensitivity analysis of a Monte Carlo
epidemic model. Int. J. Biomed. Comput. 23, 97±112.
Spear, R., 1997. Large simulation models: calibration, uniqueness and goodness of fit. Environ. Model. Software
12, 219±228.
Spear, R., Grieb, T., Shang, N., 1994. Parameter uncertainty and interaction in complex environmental models.
Water Resour. Res. 30, 3159±3169.
Tudor, D., 1990. A deterministic model for herpes infections in human and animal populations. Soc. Ind. Appl.
Math. 1, 136±139.
XeÂmar, V., 1997. Le chat errant urbain: controÃle des populations et eÂtat sanitaire. Veterinary Thesis. Lyon I
University, France, 184 p.
C. Cohen et al. / Preventive Veterinary Medicine 45 (2000) 163±181 181


![cours HERPESVIRIDAE [Mode de compatibilité] Superieures/Medecine... · Herpes simplex virus1 – Pathologie humaine HSV-1 – Herpès oral: • Enfance (++) avec disparition des](https://img.pdfslide.fr/doc/110x75/5e5d8374f72baf223d4f346b/cours-herpesviridae-mode-de-compatibilit-superieuresmedecine-herpes-simplex.jpg)