Embed Size (px)
Citation preview
A Voyage of DiscoveryAuthor(s): Lynne BillardSource: Journal of the American Statistical Association, Vol. 92, No. 437 (Mar., 1997), pp. 1-12Published by: American Statistical AssociationStable URL: http://www.jstor.org/stable/2291444 .
Accessed: 14/06/2014 04:42
Your use of the JSTOR archive indicates your acceptance of the Terms & Conditions of Use, available at .http://www.jstor.org/page/info/about/policies/terms.jsp
.JSTOR is a not-for-profit service that helps scholars, researchers, and students discover, use, and build upon a wide range ofcontent in a trusted digital archive. We use information technology and tools to increase productivity and facilitate new formsof scholarship. For more information about JSTOR, please contact [email protected].
.
American Statistical Association is collaborating with JSTOR to digitize, preserve and extend access to Journalof the American Statistical Association.
http://www.jstor.org
This content downloaded from 185.2.32.14 on Sat, 14 Jun 2014 04:42:17 AMAll use subject to JSTOR Terms and Conditions
A Voyage of Discovery
Lynne BILLARD
1. INTRODUCTION
Babson (1912) declared that "the future of this country depends on the preacher and the statistician." We are not preachers gathered together tonight but statisticians, and it is the role of the statistician that will be our focus. I came across Babson while reading early issues of the Journal of the American Statistical Association (JASA). Recall that our Association was founded in 1839, the first issue of JASA was not published until 1888. Therefore, it did not take long to read the journal writings of our first 50 years-those of the second 50 did take longer! I now invite you to travel on a journey through the records of our first 100 years, 1839- 1939, in an attempt to discover our past as a prelude to our future.
For the first 30-odd years, JASA contained almost ex- clusively nonmathematical papers. Many were mere repos- itories of extensive data sets, including many compilations from census counts with interpretations of what these data purportedly revealed. Others were from investigations un- dertaken by sociologists, economists, political scientists, and historians. Yes, historians appeared frequently; the per- ception that statistics was history and history was statistics was unquestioned in the 1800s. Although there are numer- ous papers full of theoretical developments in these substan- tive areas dominated primarily by economic including ac- countancy theorists, there is little to no such theory in statis- tical science. To be fair, we must remember we are talking about the period from 1888, when our journal started, until 1915-1920. Nevertheless, there was an abiding yet elusive sense that significant mathematical developments were oc- curing across the Atlantic by, most notably, Francis Galton
Lynne Billard is University Professor, University of Georgia, Athens, GA 30602-1952. This article is the Presidential Address delivered to the American Statistical Association in Chicago, Illinois, on August 6, 1996.
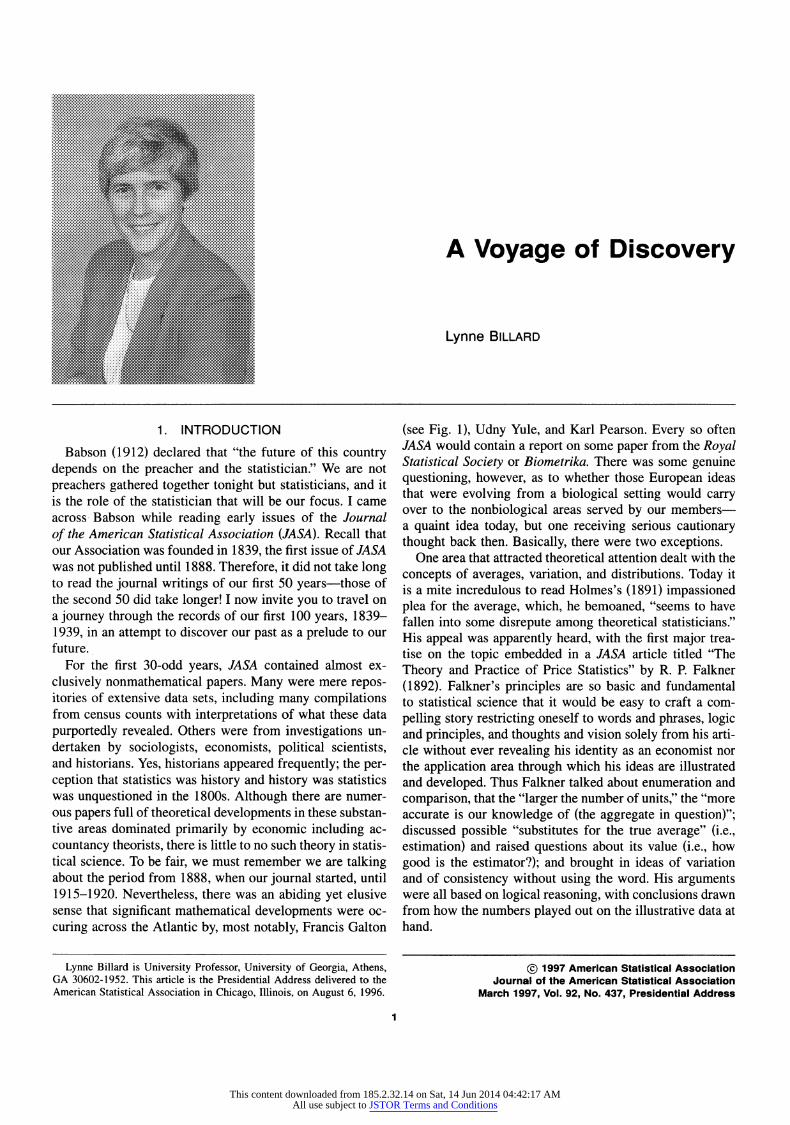
(see Fig. 1), Udny Yule, and Karl Pearson. Every so often JASA would contain a report on some paper from the Royal Statistical Society or Biometrika. There was some genuine questioning, however, as to whether those European ideas that were evolving from a biological setting would carry over to the nonbiological areas served by our members- a quaint idea today, but one receiving serious cautionary thought back then. Basically, there were two exceptions.
One area that attracted theoretical attention dealt with the concepts of averages, variation, and distributions. Today it is a mite incredulous to read Holmes's (1891) impassioned plea for the average, which, he bemoaned, "seems to have fallen into some disrepute among theoretical statisticians." His appeal was apparently heard, with the first major trea- tise on the topic embedded in a JASA article titled "The Theory and Practice of Price Statistics" by R. P. Falkner (1892). Falkner's principles are so basic and fundamental to statistical science that it would be easy to craft a com- pelling story restricting oneself to words and phrases, logic and principles, and thoughts and vision solely from his arti- cle without ever revealing his identity as an economist nor the application area through which his ideas are illustrated and developed. Thus Falkner talked about enumeration and comparison, that the "larger the number of units," the "more accurate is our knowledge of (the aggregate in question)"; discussed possible "substitutes for the true average" (i.e., estimation) and raised questions about its value (i.e., how good is the estimator?); and brought in ideas of variation and of consistency without using the word. His arguments were all based on logical reasoning, with conclusions drawn from how the numbers played out on the illustrative data at hand.
? 1997 American Statistical Association Journal of the American Statistical Association
March 1997, Vol. 92, No. 437, Presidential Address
1
This content downloaded from 185.2.32.14 on Sat, 14 Jun 2014 04:42:17 AMAll use subject to JSTOR Terms and Conditions
2 Journal of the American Statistical Association, March 1997
. . . . . . . . . . . . . . . . . . . ............... . . . . . . . . . . . . . . . . . . . . . . ............-- ................:. :-3'', ,,,,f.;.. .. . . ... . . . . . . 2 .... .. .. .. .. .. . . .. .. ..
.........., tN. X- X-?X- L'-X-'S E ... .. .. .. .. .. .. .. .. . . .'......,., , ,..,.. ... ... .... .. *****************.....AP..
~~~~~~~~~. . . . . .. , . , . . . . . . . . . . . . . . . . . . . .... ,,.,,,,,,.,,
. . -.'. '. .- . . . . . . . . ................. . .. . . ............. . . . . . . . . . . . . . . . . . . .
Figure 1. Francis Ga/ton.
Even Falkner's opening paragraph can serve as admon- ishing words to many of us today:
There has often been noted in the development of statistical science a wide divergence between the theoretical, professional treatment of the subject and the views of practical statisticians ... At times ... the connection between the work of the theorist and the practical man has been wanting ... Theory and practice have developed side by side ... (But) theory is not . .. distinct from practice . .. If. however, there is any distinct theory of statistics, it should accord not only with the practice of working statis- ticians, but should indicate clearly and distinctly the general lines along which all statistical effort should be conducted.
Keep in mind, this was written in 1892! How far have we come more than 100 years later? The words may be the same, though we would concede that what constitutes the definitions of theoretical and practical statistician have changed somewhat.
Falkner practiced what he preached, in that he developed his theory to address a practical application. In fact, we could have relabelled his article identically but without the word "price." As an interesting aside, we observe that an upshot of Falkner's ruminations was that for price statis- tics, it was relative variations, not absolute amounts, that should be compared. This, he suggested, should be done by "tak[ing] the price of some one year, as 100, and ex- press[ing] the other prices of the same series in percent- ages of this price"; that is, the Consumer Price Index so familiar to us today was born out of a theoretical develop- ment fundamental to our science.
Falkner's article sparked a slew of activity. Holmes (1892) suggested that an average alone was inadequate. His vehicle was wealth (or, more correctly, wealth disparity), and he even brought in the concept of mixtures of popu- lations. His article elicited the first letter to the editor, by one Francis Galton (1892), acknowledged by Holmes in his reply as "the most eminent authority on mathematical mea- sures of distribution."
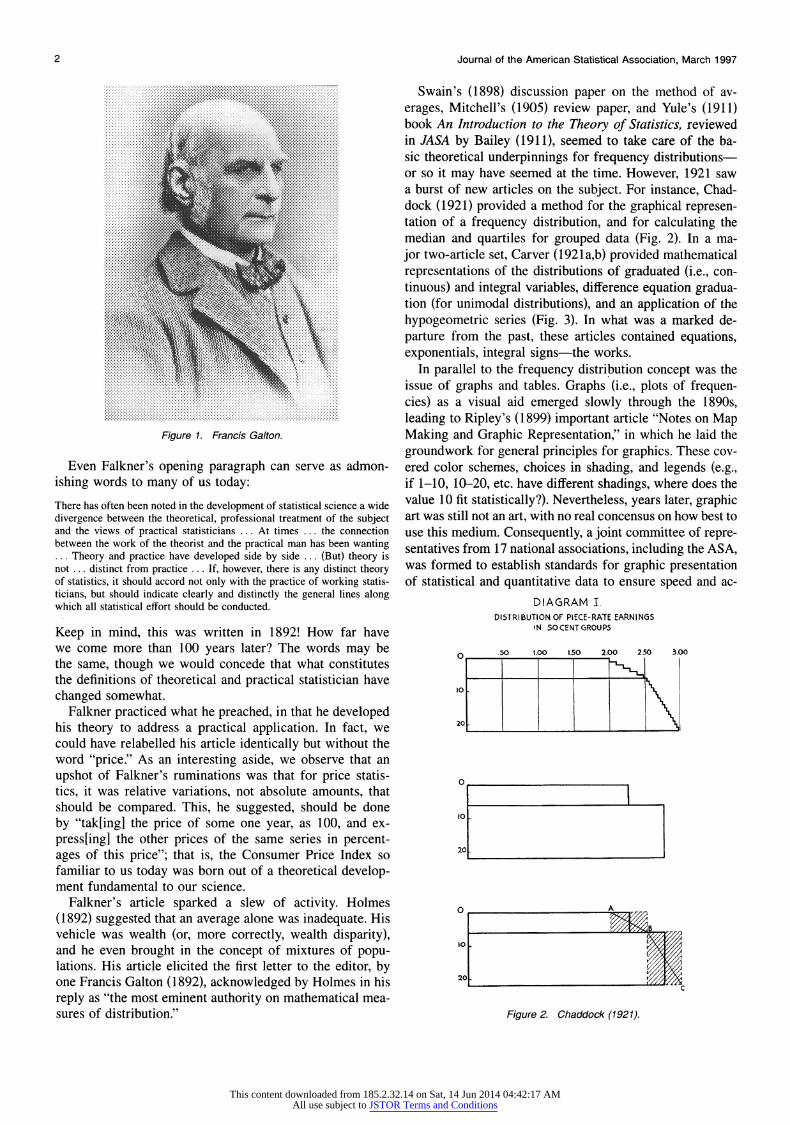
Swain's (1898) discussion paper on the method of av- erages, Mitchell's (1905) review paper, and Yule's (1911) book An Introduction to the Theory of Statistics, reviewed in JASA by Bailey (191 1), seemed to take care of the ba- sic theoretical underpinnings for frequency distributions- or so it may have seemed at the time. However, 1921 saw a burst of new articles on the subject. For instance, Chad- dock (1921) provided a method for the graphical represen- tation of a frequency distribution, and for calculating the median and quartiles for grouped data (Fig. 2). In a ma- jor two-article set, Carver (1921a,b) provided mathematical representations of the distributions of graduated (i.e., con- tinuous) and integral variables, difference equation gradua- tion (for unimodal distributions), and an application of the hypogeometric series (Fig. 3). In what was a marked de- parture from the past, these articles contained equations, exponentials, integral signs-the works.
In parallel to the frequency distribution concept was the issue of graphs and tables. Graphs (i.e., plots of frequen- cies) as a visual aid emerged slowly through the 1890s, leading to Ripley's (1899) important article "Notes on Map Making and Graphic Representation," in which he laid the groundwork for general principles for graphics. These cov- ered color schemes, choices in shading, and legends (e.g., if 1-10, 10-20, etc. have different shadings, where does the value 10 fit statistically?). Nevertheless, years later, graphic art was still not an art, with no real concensus on how best to use this medium. Consequently, a joint committee of repre- sentatives from 17 national associations, including the ASA, was formed to establish standards for graphic presentation of statistical and quantitative data to ensure speed and ac-
DIAGRAM I DISTRIBUTION OF PIECE-RATE EARNINGS
IN SO CENT GROUPS
o .50 1.00 150 2.00 250 3.00
10
20[
O ~~~~~. ____ 20 -
20 F
O A
~B 7/2
10
This content downloaded from 185.2.32.14 on Sat, 14 Jun 2014 04:42:17 AMAll use subject to JSTOR Terms and Conditions
Billard: A Voyage of Discovery 3
TABLE I
Differential values Const. Difference values
_3 (2+3) a ->( 2 -) 1
2(5132 - 6#1 -9) 2k5 2 6-119F-)
P2(4 2-331- -a 2(402-30,) bo - t -a
2(532-6131-9) 2 5(2-6g3-9+1)
-a bi b2-a
2,02-3/31-6+4 2032-3013-6 b2 P2
2(5132-6813-9) 2(5132-691-9+1)
Figure 3. Carver (1921b).
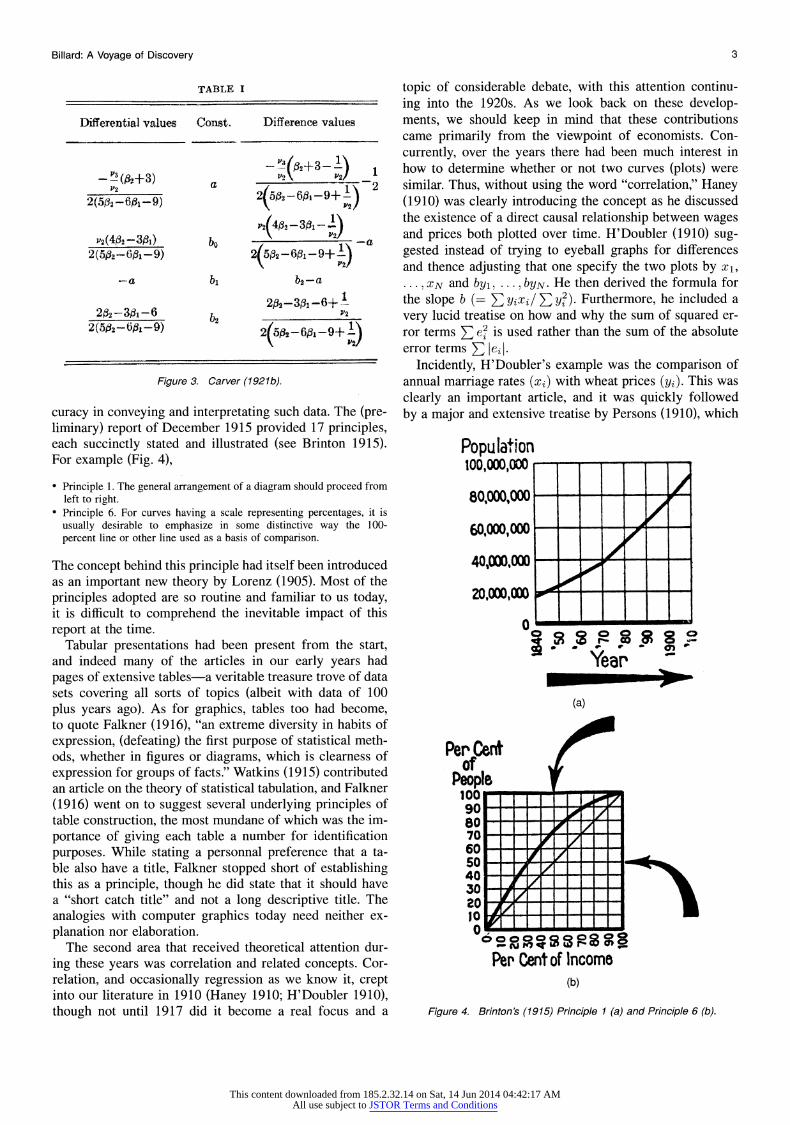
curacy in conveying and interpretating such data. The (pre- liminary) report of December 1915 provided 17 principles, each succinctly stated and illustrated (see Brinton 1915). For example (Fig. 4),
* Principle 1. The general arrangement of a diagram should proceed from left to right.
* Principle 6. For curves having a scale representing percentages, it is usually desirable to emphasize in some distinctive way the 100- percent line or other line used as a basis of comparison.
The concept behind this principle had itself been introduced as an important new theory by Lorenz (1905). Most of the principles adopted are so routine and familiar to us today, it is difficult to comprehend the inevitable impact of this report at the time.
Tabular presentations had been present from the start, and indeed many of the articles in our early years had pages of extensive tables-a veritable treasure trove of data sets covering all sorts of topics (albeit with data of 100 plus years ago). As for graphics, tables too had become, to quote Falkner (1916), "an extreme diversity in habits of expression, (defeating) the first purpose of statistical meth- ods, whether in figures or diagrams, which is clearness of expression for groups of facts." Watkins (1915) contributed an article on the theory of statistical tabulation, and Falkner (1916) went on to suggest several underlying principles of table construction, the most mundane of which was the im- portance of giving each table a number for identification purposes. While stating a personnal preference that a ta- ble also have a title, Falkner stopped short of establishing this as a principle, though he did state that it should have a "short catch title" and not a long descriptive title. The analogies with computer graphics today need neither ex- planation nor elaboration.
The second area that received theoretical attention dur- ing these years was correlation and related concepts. Cor- relation, and occasionally regression as we know it, crept into our literature in 1910 (Haney 1910; H'Doubler 1910), though not until 1917 did it become a real focus and a
topic of considerable debate, with this attention continu- ing into the 1920s. As we look back on these develop- ments, we should keep in mind that these contributions came primarily from the viewpoint of economists. Con- currently, over the years there had been much interest in how to determine whether or not two curves (plots) were similar. Thus, without using the word "correlation," Haney (1910) was clearly introducing the concept as he discussed the existence of a direct causal relationship between wages and prices both plotted over time. H'Doubler (1910) sug- gested instead of trying to eyeball graphs for differences and thence adjusting that one specify the two plots by xi,
X XN and by,, . . ., byN. He then derived the formula for the slope b (= E yixil E /y). Furthermore, he included a very lucid treatise on how and why the sum of squared er- ror terms E el is used rather than the sum of the absolute error terms E e4
Incidently, H'Doubler's example was the comparison of annual marriage rates (xi) with wheat prices (yi). This was clearly an important article, and it was quickly followed by a major and extensive treatise by Persons (1910), which
Popu le.ioon 100,000,00 __ -m
80,1000,000
60,000,000 --- -
40,00000---
20,000,000
Year'
(a)
Per Cent ofv
People 100 I 1 90- 80 70 _ 7 60-
30 _ - I
20-
0o E. _UI
_ _ __ E
oM 4 m
Per Cent of Incoms (b)
Figure 4. Brinton's (1915) Principle 1 (a) and Principle 6 (b).
This content downloaded from 185.2.32.14 on Sat, 14 Jun 2014 04:42:17 AMAll use subject to JSTOR Terms and Conditions
4 Journal of the American Statistical Association, March 1997
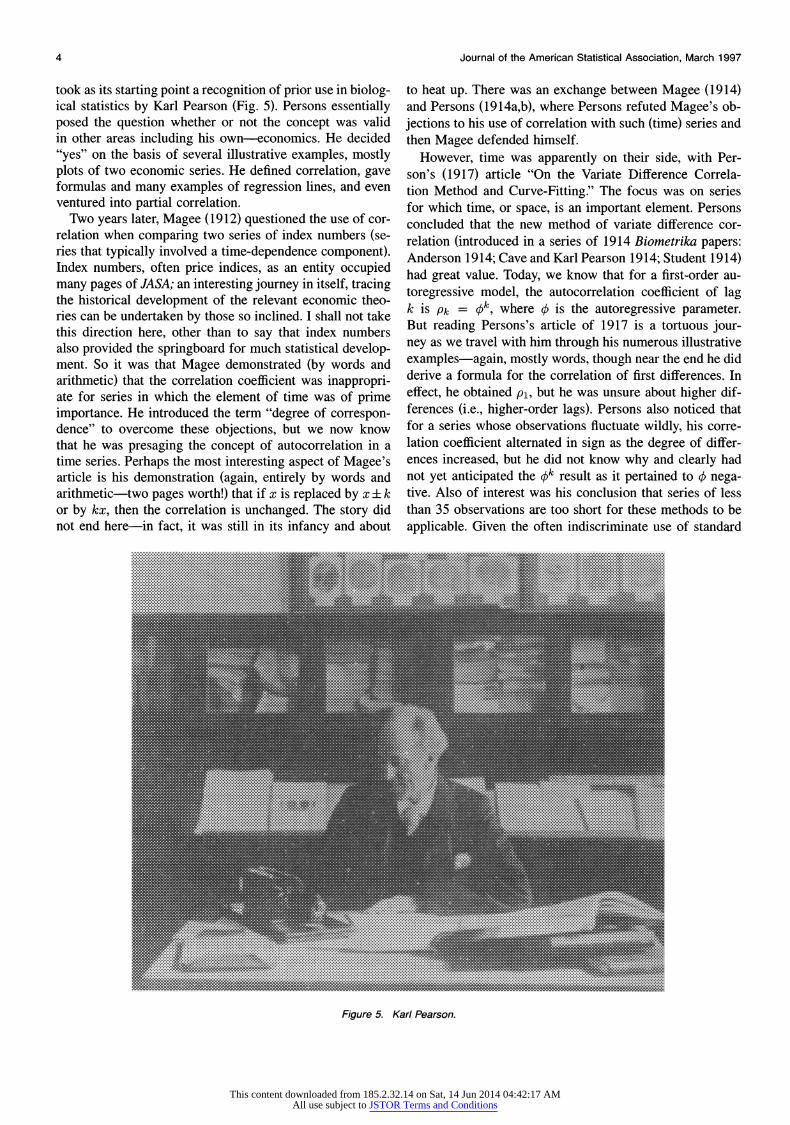
took as its starting point a recognition of prior use in biolog- ical statistics by Karl Pearson (Fig. 5). Persons essentially posed the question whether or not the concept was valid in other areas including his own-economics. He decided "yes" on the basis of several illustrative examples, mostly plots of two economic series. He defined correlation, gave formulas and many examples of regression lines, and even ventured into partial correlation.
Two years later, Magee (1912) questioned the use of cor- relation when comparing two series of index numbers (se- ries that typically involved a time-dependence component). Index numbers, often price indices, as an entity occupied many pages of JASA; an interesting journey in itself, tracing the historical development of the relevant economic theo- ries can be undertaken by those so inclined. I shall not take this direction here, other than to say that index numbers also provided the springboard for much statistical develop- ment. So it was that Magee demonstrated (by words and arithmetic) that the correlation coefficient was inappropri- ate for series in which the element of time was of prime importance. He introduced the term "degree of correspon- dence" to overcome these objections, but we now know that he was presaging the concept of autocorrelation in a time series. Perhaps the most interesting aspect of Magee's article is his demonstration (again, entirely by words and arithmetic-two pages worth!) that if x is replaced by x ? k or by kx, then the correlation is unchanged. The story did not end here-in fact, it was still in its infancy and about
to heat up. There was an exchange between Magee (1914) and Persons (1914a,b), where Persons refuted Magee's ob- jections to his use of correlation with such (time) series and then Magee defended himself.
However, time was apparently on their side, with Per- son's (1917) article "On the Variate Difference Correla- tion Method and Curve-Fitting." The focus was on series for which time, or space, is an important element. Persons concluded that the new method of variate difference cor- relation (introduced in a series of 1914 Biometrika papers: Anderson 1914; Cave and Karl Pearson 1914; Student 1914) had great value. Today, we know that for a first-order au- toregressive model, the autocorrelation coefficient of lag k is Pk = qk, where q is the autoregressive parameter. But reading Persons's article of 1917 is a tortuous jour- ney as we travel with him through his numerous illustrative examples-again, mostly words, though near the end he did derive a formula for the correlation of first differences. In effect, he obtained pl, but he was unsure about higher dif- ferences (i.e., higher-order lags). Persons also noticed that for a series whose observations fluctuate wildly, his corre- lation coefficient alternated in sign as the degree of differ- ences increased, but he did not know why and clearly had not yet anticipated the qk result as it pertained to X nega- tive. Also of interest was his conclusion that series of less than 35 observations are too short for these methods to be applicable. Given the often indiscriminate use of standard
...C. . .111 1 .............
I .. ... ... ...
l~~~~~Fgr 5Kal Pear_son_
This content downloaded from 185.2.32.14 on Sat, 14 Jun 2014 04:42:17 AMAll use subject to JSTOR Terms and Conditions
Billard: A Voyage of Discovery 5
PREDICTED HEIG3HT Or THE HIGHER HIGH WATER FOR EACH DAY AFTER NEW MOON WrrIH RE4tAI(MV TO ?ALAN M4iO WATER (M1W),AT OLD POINT COM Q 0 v
U*s. CS S, 0,?0000 70'0 4 f'i M* )_ to" o
mmf w
- <t
S2 o <, f- f ^ . . ~L-AW
DAYS AFTER NEW MOON -JJJLY 291916
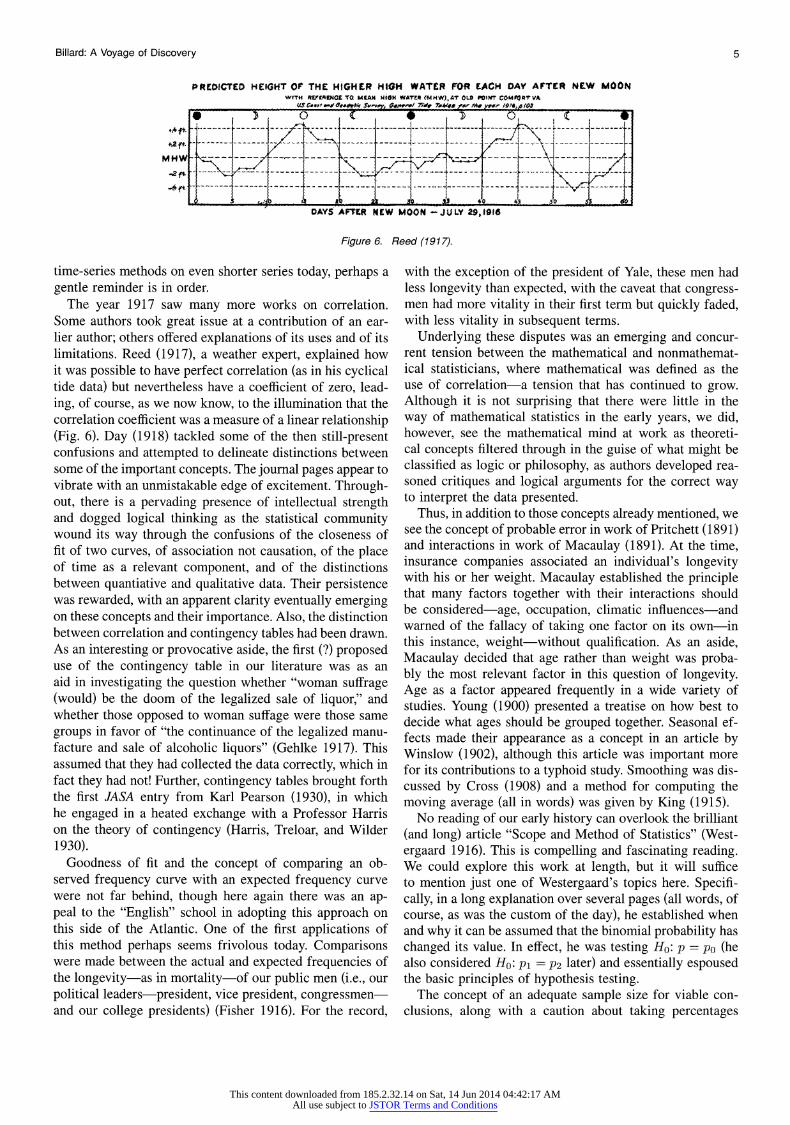
Figure 6. Reed (1917).
time-series methods on even shorter series today, perhaps a gentle reminder is in order.
The year 1917 saw many more works on correlation. Some authors took great issue at a contribution of an ear- lier author; others offered explanations of its uses and of its limitations. Reed (1917), a weather expert, explained how it was possible to have perfect correlation (as in his cyclical tide data) but nevertheless have a coefficient of zero, lead- ing, of course, as we now know, to the illumination that the correlation coefficient was a measure of a linear relationship (Fig. 6). Day (1918) tackled some of the then still-present confusions and attempted to delineate distinctions between some of the important concepts. The journal pages appear to vibrate with an unmistakable edge of excitement. Through- out, there is a pervading presence of intellectual strength and dogged logical thinking as the statistical community wound its way through the confusions of the closeness of fit of two curves, of association not causation, of the place of time as a relevant component, and of the distinctions between quantiative and qualitative data. Their persistence was rewarded, with an apparent clarity eventually emerging on these concepts and their importance. Also, the distinction between correlation and contingency tables had been drawn. As an interesting or provocative aside, the first (?) proposed use of the contingency table in our literature was as an aid in investigating the question whether "woman suffrage (would) be the doom of the legalized sale of liquor," and whether those opposed to woman suffage were those same groups in favor of "the continuance of the legalized manu- facture and sale of alcoholic liquors" (Gehlke 1917). This assumed that they had collected the data correctly, which in fact they had not! Further, contingency tables brought forth the first JASA entry from Karl Pearson (1930), in which he engaged in a heated exchange with a Professor Harris on the theory of contingency (Harris, Treloar, and Wilder 1930).
Goodness of fit and the concept of comparing an ob- served frequency curve with an expected frequency curve were not far behind, though here again there was an ap- peal to the "English" school in adopting this approach on this side of the Atlantic. One of the first applications of this method perhaps seems frivolous today. Comparisons were made between the actual and expected frequencies of the longevity-as in mortality-of our public men (i.e., our political leaders-president, vice president, congressmen- and our college presidents) (Fisher 1916). For the record,
with the exception of the president of Yale, these men had less longevity than expected, with the caveat that congress- men had more vitality in their first term but quickly faded, with less vitality in subsequent terms.
Underlying these disputes was an emerging and concur- rent tension between the mathematical and nonmathemat- ical statisticians, where mathematical was defined as the use of correlation-a tension that has continued to grow. Although it is not surprising that there were little in the way of mathematical statistics in the early years, we did, however, see the mathematical mind at work as theoreti- cal concepts filtered through in the guise of what might be classified as logic or philosophy, as authors developed rea- soned critiques and logical arguments for the correct way to interpret the data presented.
Thus, in addition to those concepts already mentioned, we see the concept of probable error in work of Pritchett (1891) and interactions in work of Macaulay (1891). At the time, insurance companies associated an individual's longevity with his or her weight. Macaulay established the principle that many factors together with their interactions should be considered-age, occupation, climatic influences-and warned of the fallacy of taking one factor on its own-in this instance, weight-without qualification. As an aside, Macaulay decided that age rather than weight was proba- bly the most relevant factor in this question of longevity. Age as a factor appeared frequently in a wide variety of studies. Young (1900) presented a treatise on how best to decide what ages should be grouped together. Seasonal ef- fects made their appearance as a concept in an article by Winslow (1902), although this article was important more for its contributions to a typhoid study. Smoothing was dis- cussed by Cross (1908) and a method for computing the moving average (all in words) was given by King (1915).
No reading of our early history can overlook the brilliant (and long) article "Scope and Method of Statistics" (West- ergaard 1916). This is compelling and fascinating reading. We could explore this work at length, but it will suffice to mention just one of Westergaard's topics here. Specifi- cally, in a long explanation over several pages (all words, of course, as was the custom of the day), he established when and why it can be assumed that the binomial probability has changed its value. In effect, he was testing Ho: p = po (he also considered Ho: P1 = P2 later) and essentially espoused the basic principles of hypothesis testing.
The concept of an adequate sample size for viable con- clusions, along with a caution about taking percentages
This content downloaded from 185.2.32.14 on Sat, 14 Jun 2014 04:42:17 AMAll use subject to JSTOR Terms and Conditions
6 Journal of the American Statistical Association, March 1997
L E ^
. B.
d L .i i |
. | i
J ^ E I i
a l | z _l E . B @ >.:' E .,
^ E0oE , S ; ; | g g _laB :.::..gD S E Q ,
_.@.:-:RO.:.B..X::i | . | S I : S... >. | -. .-.. . | S i -FR: .:.g.: ........ | , .: ... : : : :5 | S i
_E..:?....?S2- S | | i R
:.&:.:..-:Ws S . g ES B .t.B.:
|w1 |I_ .B..B.KS.;...Ne. | | X g .... ..B...-S.s.... | | | g R.g
.8 W | , | E gN ...... . | - "
_SQ. I _! E E B 1|_ . S . ;; a BS 2 _
g_El ? ..):. :ffi3 i S 3
.__ S.. _I S S | _ _N | _-11 | | I _ | s I _
I _I | | l __ _ | __ | 181 | s _ --_l B S S E
__ W _! S X | _ ____-S GE | E SE | | I | | - I
_ ......... ; I g g E
a..F | .,w,. Q -
'W ' w
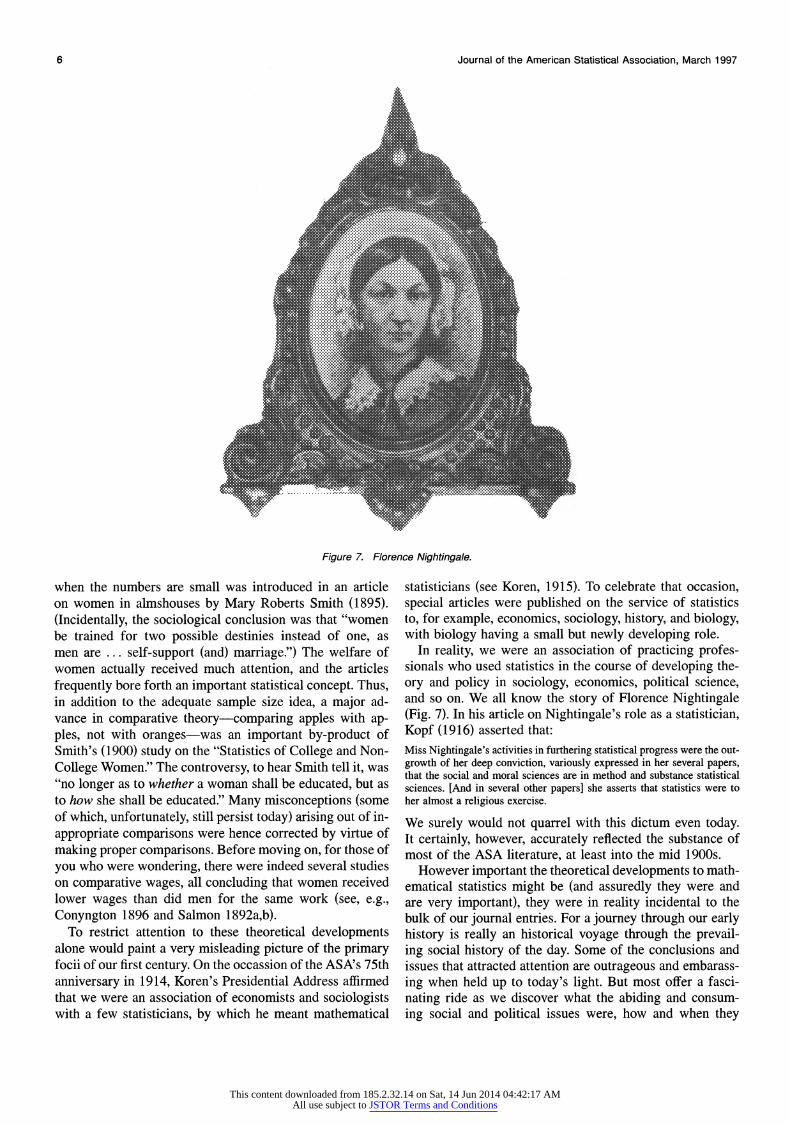
Figure 7. Florence Nightingale.
when the numbers are small was introduced in an article on women in almshouses by Mary Roberts Smith (1895). (Incidentally, the sociological conclusion was that "women be trained for two possible destinies instead of one, as men are ... self-support (and) marriage.") The welfare of women actually received much attention, and the articles frequently bore forth an important statistical concept. Thus, in addition to the adequate sample size idea, a major ad- vance in comparative theory-comparing apples with ap- ples, not with oranges-was an important by-product of Smith's (1900) study on the "Statistics of College and Non- College Women." The controversy, to hear Smith tell it, was "no longer as to whether a woman shall be educated, but as to how she shall be educated." Many misconceptions (some of which, unfortunately, still persist today) arising out of in- appropriate comparisons were hence corrected by virtue of making proper comparisons. Before moving on, for those of you who were wondering, there were indeed several studies on comparative wages, all concluding that women received lower wages than did men for the same work (see, e.g., Conyngton 1896 and Salmon 1892a,b).
To restrict attention to these theoretical developments alone would paint a very misleading picture of the primary focii of our first century. On the occassion of the ASA's 75th anniversary in 1914, Koren's Presidential Address affirmed that we were an association of economists and sociologists with a few statisticians, by which he meant mathematical
statisticians (see Koren, 1915). To celebrate that occasion, special articles were published on the service of statistics to, for example, economics, sociology, history, and biology, with biology having a small but newly developing role.
In reality, we were an association of practicing profes- sionals who used statistics in the course of developing the- ory and policy in sociology, economics, political science, and so on. We all know the story of Florence Nightingale (Fig. 7). In his article on Nightingale's role as a statistician, Kopf (1916) asserted that: Miss Nightingale's activities in furthering statistical progress were the out- growth of her deep conviction, variously expressed in her several papers, that the social and moral sciences are in method and substance statistical sciences. [And in several other papers] she asserts that statistics were to her almost a religious exercise.
We surely would not quarrel with this dictum even today. It certainly, however, accurately reflected the substance of most of the ASA literature, at least into the mid 1900s.
However important the theoretical developments to math- ematical statistics might be (and assuredly they were and are very important), they were in reality incidental to the bulk of our journal entries. For a journey through our early history is really an historical voyage through the prevail- ing social history of the day. Some of the conclusions and issues that attracted attention are outrageous and embarass- ing when held up to today's light. But most offer a fasci- nating ride as we discover what the abiding and consum- ing social and political issues were, how and when they
This content downloaded from 185.2.32.14 on Sat, 14 Jun 2014 04:42:17 AMAll use subject to JSTOR Terms and Conditions
Billard: A Voyage of Discovery 7
emerged, and how (if at all) they were resolved. For ex- ample, there were many articles on mineral production and on farm yields. One can almost smell and feel the gently blowing breezes of the frontier nation with an unmistak- able flavor of the homesteading west filtering through. But then suddenly one is jolted askew by a stuffy argument on whether Vermont or Massachusetts has produced more dis- tinguished men (Rossiter 1911; Woods 1911)-each state claimed victory, but really who cares! Back in the east, as would be expected, the articles focused on issues of an es- tablishment, but still of course on the urban developments of a century ago, when, for instance, roads were being paved not for cars, but for bicycles. There are dozens of papers on immigrants, from where they came and into what parts of the country they settled, and of their impact. Starting with work of Holmes (1890), mortgage statistics were featured often, as farmers and bankers tried to reconcile records with what was clearly a new phenomenon.
The crucial role of railways is reflected by an appropri- ately large number of entries-statistics on freight, mileage, passengers, revenues and expenses, and so on (see, e.g., Adams 1893 and Riebenack 1893). At the turn of the cen- tury came a realization that perhaps there were too many railway accidents, so Doten (1905) collected data and made recommendations as to how to reduce the potential for acci- dents. Ten years later, counterpart warnings were issued for the future potential of highway accidents to a still largely unaware public (Case 1916).
The "first scientific classification on accidents" in fac- tories, according to Woods (1895), led to a recommenda- tion to increase the number of factory safety inspectors. This, along with numerous other articles on working con- ditions in factories and elsewhere, was a forerunner of to- day's field of occupational safety. Many of these articles including Woods', provide vivid and detailed descriptions of working conditions for the day (see Chaddock 1912; Har- ris 1912). Many of these concerns emanated from insurance companies. Worker's compensation, pensions and annuities were being threaded into the fabric of "safety nets" increas- ingly being woven into the working man's life. Understand- ably, from the insurance companies' perspective, improved working conditions meant lower insurance claims (see, e.g., Balwin 1910, Hoffman 1909a,b, 1911, and Lescohier 1911). Indeed, the emergence of demography as a discipline was quite evident in the journals of the day.
Concurrently, there was an enormous body of work deal- ing with diseases, again emanating from a concern for working conditions and also living conditions, that led in- evitably to what we refer to today as environmental con- cerns. For example, Chaddock (1914) demonstrated that the death rate for tuberculosis for the entire population of a city obscured a higher death rate for persons in certain sec- tions of the city that had poor sanitation or bad housing conditions or for persons working in dangerous occupa- tions under inadequate conditions, thus leading to remedies for better housing and workplace environments. For anyone desirous of tracing this story, there are data in plentitude. Tuberculosis, pneumonia, influenza, diarrhea, typhoid fever,
dysentry, cholera, scarlet fever, whooping cough, measles, and so on-all were pervasive and persistent. There was a heated debate on the relevance of and the effect of age co- horts on the analysis of cancer incidence; but sadly, the ba- sic underlying tenet was that the observed increase in cases was not real and that it was only an apparent increase due to the way the data were grouped, as argued by, for example, King and Newsholme (1893) and by Winslow (1901), with Willcox's (1917) article telling the story in its title, "On the Alleged Increase of Cancer."
Tied in with this work on diseases was the attendant issue of birth and death rates. Hoffman (1906) studied death rates from the perspective of improving health and sanitary con- ditions. He was the first to suggest that death rates should be determined with respect to age, gender, race, occupa- tion, and other factors. In an article that lays out plenty to digest even today regarding social policies, Willcox (1916) observed that a decline in death rates over the previous 20 years compared with the previous 80 to 100 years co- incided with a decrease in fluctuations, and likewise for birth rates. Appeal to the Englishmen Farr, Galton, and Karl Pearson was frequent and sincere (see, e.g., Doten 1906 and Winslow 1900). Those who have worked in these ar- eas know, however, that mathematically this is not an easy problem. The census folk also wrestled with these ques- tions, though their focus was a concern with ascertaining population trends.
Well, the aforementioned were application areas that re- ceived much attention. Numerous other areas received at- tention as well. We could spend some time looking at work on poverty, divorce, vital statistics of every shade, anthropology, government budgets (as in "the growing dis- parity between revenues and expenditures (of the public purse)" [Ford 1899]), churches and religions, suicide, crim- inal statistics (including an entertaining entry by Pettigrove [1892] imprinted on my mind for his delightful insight that "out of the shock of controversy comes the spark of truth"), alcohol, law, gunshot wounds, living conditions (with a rec- ommendation that people live in separate apartments [Perry 1913]), food (even the call for free lunches at school was first recommended in our journal [New York Committee Report, Burlingham 1907]), forestry (an entry on forestry statistics by Fernow [1898] is a wonderful exposition on principles to be practiced by the consulting statistician), and so on.
This then is the story essentially up to about 1920. Sur- prisingly, there was no appreciable change in the landscape through the 1920s and 1930s. Correlation or its associated entities dominated the mathematical publications. There were articles coping with the difficulties of calculating the correlation coefficient and/or deviations, a task deemed so daunting that many workers still shied away from it. Thus we see, for example, the following set of articles
* "An Automatic Correlation Calculating Machine" (Hull 1925)
* "An Apparatus to Assist in the Calculation of the Stan- dard Deviation of a Grouped Frequency Distribution" (Croxton 1925)
This content downloaded from 185.2.32.14 on Sat, 14 Jun 2014 04:42:17 AMAll use subject to JSTOR Terms and Conditions
8 Journal of the American Statistical Association, March 1997
* "Apparatus to Facilitate the Calculation of the Mo- ments of a Distribution" (Jenkins 1928)
* "The Use of Machine Factoring in Multiple Correla- tion" (Brandt 1928).
Another set of papers dealt with time series. Most of these appeared in the 1920s, and most dealt with seasonality is- sues, essentially developing the embryonic concepts ges- tated by the Persons (1917) work mentioned earlier.
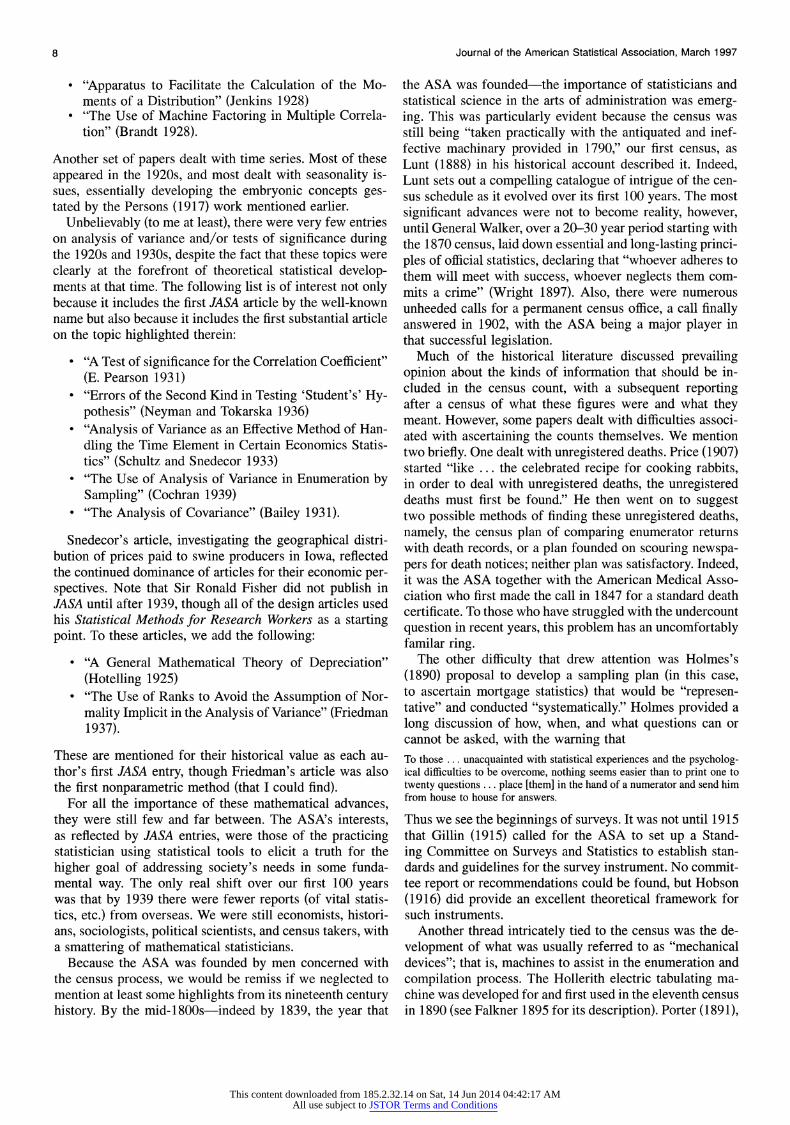
Unbelievably (to me at least), there were very few entries on analysis of variance and/or tests of significance during the 1920s and 1930s, despite the fact that these topics were clearly at the forefront of theoretical statistical develop- ments at that time. The following list is of interest not only because it includes the first JASA article by the well-known name but also because it includes the first substantial article on the topic highlighted therein:
* "A Test of significance for the Correlation Coefficient" (E. Pearson 1931)
* "Errors of the Second Kind in Testing 'Student's' Hy- pothesis" (Neyman and Tokarska 1936)
* "Analysis of Variance as an Effective Method of Han- dling the Time Element in Certain Economics Statis- tics" (Schultz and Snedecor 1933)
* "The Use of Analysis of Variance in Enumeration by Sampling" (Cochran 1939)
* "The Analysis of Covariance" (Bailey 1931).
Snedecor's article, investigating the geographical distri- bution of prices paid to swine producers in Iowa, reflected the continued dominance of articles for their economic per- spectives. Note that Sir Ronald Fisher did not publish in JASA until after 1939, though all of the design articles used his Statistical Methods for Research Workers as a starting point. To these articles, we add the following:
* "A General Mathematical Theory of Depreciation" (Hotelling 1925)
* "The Use of Ranks to Avoid the Assumption of Nor- mality Implicit in the Analysis of Variance" (Friedman 1937).
These are mentioned for their historical value as each au- thor's first JASA entry, though Friedman's article was also the first nonparametric method (that I could find).
For all the importance of these mathematical advances, they were still few and far between. The ASA's interests, as reflected by JASA entries, were those of the practicing statistician using statistical tools to elicit a truth for the higher goal of addressing society's needs in some funda- mental way. The only real shift over our first 100 years was that by 1939 there were fewer reports (of vital statis- tics, etc.) from overseas. We were still economists, histori- ans, sociologists, political scientists, and census takers, with a smattering of mathematical statisticians.
Because the ASA was founded by men concerned with the census process, we would be remiss if we neglected to mention at least some highlights from its nineteenth century history. By the mid-1800s-indeed by 1839, the year that
the ASA was founded-the importance of statisticians and statistical science in the arts of administration was emerg- ing. This was particularly evident because the census was still being "taken practically with the antiquated and inef- fective machinary provided in 1790," our first census, as Lunt (1888) in his historical account described it. Indeed, Lunt sets out a compelling catalogue of intrigue of the cen- sus schedule as it evolved over its first 100 years. The most significant advances were not to become reality, however, until General Walker, over a 20-30 year period starting with the 1870 census, laid down essential and long-lasting princi- ples of official statistics, declaring that "whoever adheres to them will meet with success, whoever neglects them com- mits a crime" (Wright 1897). Also, there were numerous unheeded calls for a permanent census office, a call finally answered in 1902, with the ASA being a major player in that successful legislation.
Much of the historical literature discussed prevailing opinion about the kinds of information that should be in- cluded in the census count, with a subsequent reporting after a census of what these figures were and what they meant. However, some papers dealt with difficulties associ- ated with ascertaining the counts themselves. We mention two briefly. One dealt with unregistered deaths. Price (1907) started "like ... the celebrated recipe for cooking rabbits, in order to deal with unregistered deaths, the unregistered deaths must first be found." He then went on to suggest two possible methods of finding these unregistered deaths, namely, the census plan of comparing enumerator returns with death records, or a plan founded on scouring newspa- pers for death notices; neither plan was satisfactory. Indeed, it was the ASA together with the American Medical Asso- ciation who first made the call in 1847 for a standard death certificate. To those who have struggled with the undercount question in recent years, this problem has an uncomfortably familar ring.
The other difficulty that drew attention was Holmes's (1890) proposal to develop a sampling plan (in this case, to ascertain mortgage statistics) that would be "represen- tative" and conducted "systematically." Holmes provided a long discussion of how, when, and what questions can or cannot be asked, with the warning that To those . . . unacquainted with statistical experiences and the psycholog- ical difficulties to be overcome, nothing seems easier than to print one to twenty questions ... place [them] in the hand of a numerator and send him from house to house for answers.
Thus we see the beginnings of surveys. It was not until 1915 that Gillin (1915) called for the ASA to set up a Stand- ing Committee on Surveys and Statistics to establish stan- dards and guidelines for the survey instrument. No commit- tee report or recommendations could be found, but Hobson (1916) did provide an excellent theoretical framework for such instruments.
Another thread intricately tied to the census was the de- velopment of what was usually referred to as "mechanical devices"; that is, machines to assist in the enumeration and compilation process. The Hollerith electric tabulating ma- chine was developed for and first used in the eleventh census in 1890 (see Fatkner 1895 for its description). Porter (1891),
This content downloaded from 185.2.32.14 on Sat, 14 Jun 2014 04:42:17 AMAll use subject to JSTOR Terms and Conditions
Billard: A Voyage of Discovery 9
as superintendent of the eleventh census, reported there were 100 machines with 100 clerks each handling 1 mil- lion cards per day. Porter also provided a discussion of the types of nonstatistical errors encountered and their impact. His proposal to address the issue of recording errors was to compare the schedule with 25-50 cards selected at ran- dom. If the Europeans were leading the way in mathemati- cal theoretical developments, according to Knight (1915), it was the Americans who "practically preempted the field" in tabulating, counting, and adding machines, unquestionably spurred on by the demands of the census process. In con- trast, at that time Europe was ahead in the development of computing machines, most notably the Brunsviga and Mil- lionaire machines (most familiar to us from Pearson and Fisher photographs).
Because this is the centenary year of the Washington Sta- tistical Society (WSS), it is perhaps appropriate to pause a moment to reflect on that occasion and its impact then and now. We recall that the ASA had been founded in Boston, primarily as a local association, with the purpose of providing "purely statistical information." In addressing the WSS on its inauguration and noting that the Ameri- can people were, in his words, "intensely and passionately devoted to statistics," ASA's President Walker (of census fame) lamented the fact that as a nation we collected vast quantities of statistics (i.e., numbers, counts, data) at consid- erable expense (Walker 1897). Further, in making a striking analogy with the relatively substantial funds readily avail- able to train men in preparation for military duties, Walker emphatically urged that the nation should be supporting the analysis of such data and the training of statisticians to do such analyses if we were not going to waste this expenditure from the national budget. The ASA had recognized the im- portance of a close relationship between the makers of the statistics (i.e., the government statistician) in Washington and consumers throughout the land, thereby prompting the establishment of the WSS. Thus members were exhorted to "promot[e] the discussion of statistical methods, statisti- cal results, and statistical principles" among the local body (i.e., the government).
Although Walker had plenty of advice and impatient urg- ings for those in the WSS, his words ring true for statisti- cians anywhere and in any enterprise. His opinion that
It is desirable that the persons who are to use statistics-and every writer of history, economics, or sociology must use statistics-should be taught to observe the limitation necessarily imposed upon the validity and authority of the figures they use, and be encouraged by association, by correspon- dence, and by acquaintance, through a body like the American Statistical Association, to confer together (Walker 1897)
is as applicable today as it was in 1896. Walker was a giant in the 1800s. He was so because he
passionately believed in the power of the statistical method and he advocated its use vigorously, to "save ... from mak- ing great errors of judgement and sometimes monstrous errors in their conclusions." To borrow from syndicated columnist George Will (1989), "history is the history of the mind, and great events invariably are beads on a thin, strong thread of ideas"; Walker was one of those beads.
The statistical machinary may have changed, and perhaps the arsenal of tools has multiplied a thousandfold, but his principles are still beacons calling across the waves. Before closing, it behooves us, I believe, to ponder deeply Walker's ethos, as it applies to our own historical future.
Today, where do we stand? Are we standing on the river- bank looking downstream at what has already gone be- fore us, or are we straining our eyes upstream with hope- ful and excited anticipation at what the future will bring? Are we restlessly poised readying ourselves to grasp the new world coming? If we gaze only downstream, we will rapidly disappear into oblivion, for the world is changing around us at a mind boggling rate. We are historical cogs privileged to live in the electronic revolution equivalent of the printing press revolution (of 500 years ago) and the in- dustrial revolution (of 200 years ago) simultaneously. One aspect of this-the "information superhighway"-has al- ready brought great changes to our daily working lives. We have adjusted to email, the World-Wide Web, and ftp's (file transfer protocols) at a pace that we would have been hard- pressed to believe even 5 years ago. There are, of course, vast changes still awaiting us and treacherous shoals to navi- gate, but it would be fair to say that most of us today believe that these challenges and their successive technical devel- opments will be met even if we ourselves have only to em- brace them. This is, however, the easy part, somewhat akin to the introduction of the Hollerith machine in the 1890s or the Monroe calculating machines of the 1960s. These are but contemporary vehicles for executing established prac- tices in a new way. Thus today we exchange information as email messages or manuscript volumes by electronic ex- press as we head into the next century instead of the Pony Express of the last century; likewise, statistical packages ease the computational burden of some statistical analyses.
The much more difficult challenges deal with the sub- stance of our profession-what we do, those whom we impact, and our educational enterprises. It was not by co- incidence that I earlier quoted Koren's 1914 Presidential Address. On that occasion, on our 75th anniversary, the discipline stood on a threshold, a door opening wide to the radicalization of the approach to our game. We speak of the then-impending explosive developments of what be- came the mathematical statistical method. We all know the discoveries that ensued following the march through that door.
Today, some 80 years later, it is easy to see that we too are in the throes of another explosion, one intricately tied to technology and electronic capabilities. In a period of shrinking budgets and diminishing resources, we so often hear that we need more time and more money. However, I believe that the greatest challenges today are not lack of time and money, but rather organizational and conceptual challenges-challenges centered on the substance of our discipline.
The organizational issues can be compared with devel- opments surrounding the frequency distributions a century ago. Information and data are being generated at a bewil- dering pace-satellite data, health care data in its myriad forms, government statistics, environmental data, metero-
This content downloaded from 185.2.32.14 on Sat, 14 Jun 2014 04:42:17 AMAll use subject to JSTOR Terms and Conditions
10 Journal of the American Statistical Association, March 1997
logical data, genetic information, experimental data gener- ated from computer hookups, and so on. Interpreting some of these data will involve the redevelopment of "known" techniques necessitated by the sheer size of the problem at hand. More generally, the challenge is that we do not know how to organize or even how to access most of the data, let alone how to interpret it.
Conceptual problems involve new ways of thinking, new ways of approaching our art. These will require research in new methodologies that never could have been conceived or could have emerged without the computational power and capability of the computer itself. Recent new developments in imaging, bootstrap, and so on, are but the vanguard, in much the same way as correlation opened the door to math- ematical developments.
As we take on these challenges, it is essential that we remember why we are doing so. In this context we have a client-a client who is primarily a social scientist, a biol- ogist, an engineer, a government agency, a pharmaceutical company, Detroit, an educator, or another nonstatistician- and it is our responsibility to foster useful and appropriate statistical analyses to shed light on worthwhile scientific problems. In another echo from our past, Ayres in his Pres- idential Address, asserted that
(the new statistics) should (not) continue to be obscured by cryptic math- ematical symbolism and abridged complexities of verbiage involving in- ferential leaps in the dark.
Our dilemma (and Ayres's words are still relevant)
lies between the recondite treatment of the difficult problems on the one hand, and the means of communicating the results intelligibly on the other.
That was in 1926; and today we dismiss Ayres's words of caution at our peril; Ayres (1927). To quote Ayres again, our science should not be
a collection of Greek letters [to which we add computer imaging, e.g.] that are incomprehensible to the uninitiated, but a source of deep satisfaction to those of the inner cult. (Ayres 1927).
Instead, we must dismantle the shroud of mystery that threatens to engulf our new statistics.
It is equally true that our educational programs are in dire need of reexamination. Too often our graduate programs are a 1990s version of the same programs being offered for the last 40 years, fine-tuned to add new topics and with the computer doing what was previously done by calcula- tors and "times tables" before that. Traditionally, we have trained our graduates in our own image to go into (aca- demic) jobs that no longer exist. Employment opportuni- ties in nonacademic sectors are beckoning enticingly. If we do not prepare our students adequately, then these oppor- tunities will be quickly taken up by nonstatistical experts. Therefore, to prepare our future graduates, we must make radical changes in our thinking. Certainly, some fundamen- tals must be mastered, but it is not necessary to master in 5 years an entire field that developed over a 100-year period. Instead, programs should be structured to build a platform that stimulates creativity and teaches the essential skill of how to garner and how to use information, a platform that
provides the basic skills and mechanisms and a training for a life-long versatility that will be essential for the twenty- first century.
Perhaps the greater challenge is with our introductory service statistics courses offered to non-statistics majors. Wright (1908), in the first ASA Presidential Address, chal- lenged those who thought statistics were as "dry bones," by joining with North in asserting that
there is nothing dry about them, that they are moist, juicy, fragrant as all the 'perfumes of Arabia.' They are more poetic than poetry, more artistic than art, more musical than music, more philosophical than philosophy.
When most students who take these courses claim to "hate" them, we are clearly doing something wrong. Yet for years we have persisted with basically the same syllabus, starting with descriptive statistics with the aim of reaching the two- sample t-test with a pooled variance, or minor variations thereof. The valiant efforts of the few dedicated instruc- tors who have labored mightily to dress up the course in various contemporary guises are transitory and have made hardly a dent, however much their efforts are applauded. It would seem that we need an entirely different approach, one that instills in the student an appreciation of statistics (as the juicy morsels, poetry, art, music, and philosophy of North's refrain). This is especially true for those who take this course as part of their basic core curriculum. Rather than an introduction to a few specific methods, what we need is a course on "Statistics in Society." A course that is remembered by students as a "great" course will have a much more lasting and positive influence on how our sub- ject is viewed. We are one of the few specialized disciplines privileged to have the opportunity to educate the nation's future leaders and future lawmakers through the core gen- eral studies program. We have squandered this opportunity in past decades. The responsibility is ours to redress this situation.
Statistics as a discipline cannot exist by itself. Yet, with obvious exceptions of course, many of us as individuals and certainly as an association have of late withdrawn within ourselves. We must ask, "Are we addressing the needs of audiences that seek us out?"; "Are we even connected to these audiences?" What constituted good statistical practice occupied the minds of our nineteenth century members. Yet to read our journals today, serious questions about our des- tiny jump out-not from what is published, but rather from what is not published. History has amply demonstrated that great empires, and cultures, that have drawn within them- selves have found that their power and influence quickly ebbed away. With apologies to playwright Elmer Rice ("The Adding Machine," 1923), we ask, "Are we counting ma- chines?" Or, "Can we count?" However, the question should not be "Can we count?," but rather "Do we count?" Do pub- lic servants, government officials, industrial managers, sci- entists of all persuasions, and others immediately embrace the statistical method as an integral thread in the fabric of their own enterprises and decision making ventures, or have we become isolated and irrelevant? If we do not adjust to the new realities, we will be discounted and discarded just as Mr. Zero, the moribund accountant in Rice's play, was
This content downloaded from 185.2.32.14 on Sat, 14 Jun 2014 04:42:17 AMAll use subject to JSTOR Terms and Conditions
Billard: A Voyage of Discovery 11
ignominiously dismissed for his failure to adapt to his new environment.
Thus we need to muster our intellectual energies and abil- ities, to refocus our mental telescopes as we seek our des- tiny and a future that will be productive and fitting for the inevitable societal problems that cross our paths. We live in turbulent times, with the established boundaries of how we go about our art crumbling before us. New paradigms, not only of our subject matter, but also of our relation- ships across government, industry, and academia and of collaborations with other disciplines, must be developed. We are many parts just as an orchestra comprises many instruments. Whether we jar as a cacophonous clatter or harmonize together as a beautiful (Beethoven) symphony is our choice. We are setting out across uncharted territories, in much the same way as Abraham, Columbus, the Pilgrims, and Captain Cook before us set out for distant lands and new opportunities. Our past sparkles with the deeds of great men and brilliant achievements. The present and future are full of promise. This is an exciting time to live. It is up to us as an Association to chart a course that focuses on the unique strengths inherent to statistics and its boundless opportunities to play pivotal and indispensible roles in re- solving contemporary issues, a course that guarantees the success of our profession and of statistical science. "Do we count?", We like to think we do. The crucial question is: "Do others think that we count?" That answer and our response to it will fashion our future. Thank you.
REFERENCES
Adams, H. C. (1893), "Some Recent Results in Railway Statistics in the United States," Journal of the American Statistical Association, 3, 501- 512.
Anderson, V. 0. (1914), "Nochmals Uber 'The Elimination of Spurious Correlation due to Position in Time and Space," Biometrika, 10, 269- 279.
Ayres, L. P. (1927), "The Dilemma of the New Statistics," Journal of the American Statistical Association, 22, 1-8.
Babson, R. W. (1912), "Ascertaining and Forecasting Business Conditions by the Study of Statistics," Journal of the American Statistical Associ- ation, 13, 36-44.
Bailey, A. L. (1931), "The Analysis of Covariance," Journal of the Amer- ican Statistical Association, 26, 424-435.
Bailey, W. B. (1911), "Review of An Introduction to the Theory of Statis- tics" by G. U. Yale, Journal of the American Statistical Association, 12, 765.
Balwin, F. S. (1910), "The Findings of the Massachusetts Commission on Old Age Pensions," Journal of the American Statistical Association, 12, 1-27.
Brandt, A. E. (1928), "The Use of Machine Factoring in Multiple Corre- lation," Journal of the American Statistical Association, 23, 291-295.
Brinton, W. C. (Chair) (1915), "Joint Committee on Standards for Graphic Presentations," Journal of the American Statistical Association, 14, 790- 797.
Burlingham, C. C. (Chair) (1907), "Physical Welfare of Children: An Ex- amination of the Home Conditions of 1,400 New York School Children Found by School Physicians to Have Physical Defects," Journal of the American Statistical Association, 10, 271-316.
Carver, H. C. (1921a), "The Mathematical Representation of Frequency Distributions," Journal of the American Statistical Association, 17, 720- 731.
(1921b), "The Mathematical Representation of Frequency Distri- butions," Journal of the American Statistical Association, 17, 885-892.
Case, M. E. (1916), "Highway Accidents in New York City in 1915,"
Journal of the American Statistical Association, 15, 318-323. Cave, B. M., and Pearson, K. (1914), "Numerical Illustrations of The
Variate-Difference Correlation Method," Biometrika, 10, 340-355. Chaddock, R. E. (1912), "Reporting of Industrial Accidents," Journal of
the American Statistical Association, 13, 107-138. (1914), "Records of Health and Sanitary Progress," Journal of the
American Statistical Association, 14, 319-334. (1921), "The Graphic Representation of a Frequency Distribution,"
Journal of the American Statistical Association, 17, 769-775. Cochran, W. G. (1939), "The Use of Analysis of Variance in Enumeration
by Sampling," Journal of the American Statistical Association, 34, 492- 510.
Conyngton, M. K. (1896), "Review: Graduates of Colleges for Women, Massachusetts Bureau of Statistics of Labor Report," Journal of the American Statistical Association, 5, 44-47.
Cross, I. (1908), "Strike Statistics," Journal of the American Statistical Association, 11, 168-194.
Croxton, F. E. (1925), "An Apparatus to Assist in the Calculation of the Standard Deviation of a Grouped Frequency Distribution," Journal of the American Statistical Association, 20, 532-536.
Day, E. E. (1918), A Note on "The Correlation of Historical Economic Variables and Their Misuse of Coefficients in this Connection," by W. I. King, Journal of the American Statistical Association, 16, 115- 118.
Doten, C. W. (1905), "Recent Railway Accidents in the United States," Journal of the American Statistical Association, 9, 155-181.
(1906), "Methods of Dealing with Birth Rate Statistics," Journal of the American Statistical Association, 10, 156-197.
Falkner, R. P. (1892), "The Theory and Practice of Price Statistics," Journal of the American Statistical Association, 3, 119-140.
(1895), "The International Statistical Institute," Journal of the American Statistical Association, 4, 358-365.
(1916), "Statistical Tabulation and Practice," Journal of the Amer- ican Statistical Association, 15, 192-200.
Fernow, B. E. (1898), "Considerations in Gathering Forestry Statistics," Journal of the American Statistical Association, 6, 155-168.
Fisher, I. (1916), "Mortality of our Public Men," Journal of the American Statistical Association, 15, 35-49.
Ford, W. C. (1899), "A Year of State Deficits," Journal of the American Statistical Association, 6, 219-224.
Friedman, M. (1937), "The Use of Ranks to Avoid the Assumption of Normality Implicit in the Analysis of Variance," Journal of the American Statistical Association, 32, 675-701.
Galton, F. (1892), "Note From Mr. Francis Galton to Mr. George K. Holmes on the Subject of Distribution," Journal of the American Statis- tical Association, 3, 271-273.
Gehlke, C. E. (1917), "On the Correlation Between the Vote for Suffrage and the Vote on the Liquor Questions: A Preliminary Study," Journal of the American Statistical Association, 15, 524-532.
Gillin, J. L. (1915), "The Social Survey and Its Further Developments," Journal of the American Statistical Association, 14, 603-610.
H'Doubler, F. T. (1910), "A Formula for Drawing Two Correlated Curves so as to Make the Resemblance as Close as Possible," Journal of the American Statistical Association, 12, 165-167.
Haney, L. H. (1910), "Organized Labor and the Recent Advance in Prices," Journal of the American Statistical Association, 12, 154-164.
Harris, H. J. (1912), "The Increase in Industrial Accidents," Journal of the American Statistical Association, 13, 1-27.
Harris, J. A., Treloar, A. E., and Wilder, M. (1930), "Professor Pearson's Note on Our Papers on Contingency," Journal of the American Statistical Association, 25, 323-327.
Hobson, A. (1916), "The Use of the Correspondence Method in Original Research," Journal of the American Statistical Association, 15, 210-218.
Hoffman, F. L. (1906), "The General Death Rate of Large American Cities, 1871-1904," Journal of the American Statistical Association, 10, 1-75.
(1909a), "State Pensions and Annuities in Old Age," Journal of the American Statistical Association, 11, 363-416.
(1 909b), "Industrial Accidents and Industrial Diseases," Journal of the American Statistical Association, 11, 567-603.
(1911), "Fifty Years of American Life Insurance," Journal of the American Statistical Association, 12, 667-760.
This content downloaded from 185.2.32.14 on Sat, 14 Jun 2014 04:42:17 AMAll use subject to JSTOR Terms and Conditions
12 Journal of the American Statistical Association, March 1997
Holmes, G. K. (1890), "Mortgage Statistics," Journal of the American Sta- tistical Association, 2, 1-21.
(1891), "A Plea for the Average," Journal of the American Statis- tical Association, 2, 421-426.
(1892), "Measures of Distribution," Journal of the American Sta- tistical Association, 3, 141-157.
Hotelling, H. (1925), "A General Mathematical Theory of Depreciation," Journal of the American Statistical Association, 20, 340-353.
Hull, C. L. (1925), "An Automatic Correlation Calculating Machine," Jour- nal of the American Statistical Association, 20, 522-531.
Jenkins, T. N. (1928), "Apparatus to Facilitate the Calculation of the Mo- ments of a Distribution," Journal of the American Statistical Association, 23, 58-60.
King, W. I. (1915), "New Method for Computing the Moving Average," Journal of the American Statistical Association, 14, 798-800.
Knight, F. H. (1915), "Mechanical Devices in European Statistical Work," Journal of the American Statistical Association, 14, 596-599.
Kopf, E. W. (1916), "Florence Nightingale as Statistician," Journal of the American Statistical Association, 15, 388-404.
Koren, J. (1915), "Presidential Address: Some Statistical Ideals," Journal of the American Statistical Association, 14, 351-357.
Lescohier, D. D. (1911), "Industrial Accidents, Employer's Liability, and Workmen's Compensation in Minnesota," Journal of the American Sta- tistical Association, 12, 647-660.
Lorenz, M. 0. (1905), "Methods of Measuring the Concentration of Wealth," Journal of the American Statistical Association, 9, 209-219.
Lunt, E. C. (1888), "Key to the Publications of the United States Census, 1790-1887, With Occasional References to Other Statistical Works," Journal of the American Statistical Association, 1, 65-125.
Macaulay, T. B. (1891), "Weight and Longevity," Journal of the American Statistical Association, 2, 287-296.
Magee, J. D. (1912), "The Degree of Correspondence Between Two Series of Index Numbers," Journal of the American Statistical Association, 13, 174-181.
(1914), "Note," Journal of the American Statistical Association, 14, 345-346.
Mitchell, W. C. (1905), "Methods of Presenting Statistics of Wages," Jour- nal of the American Statistical Association, 9, 325-343.
Neyman, J., and Tokarska, B. (1936), "Errors of the Second Kind in Testing 'Student's' Hypothesis," Journal of the American Statistical Association, 31, 318-326.
Pearson, E. S. (1931), "The Test of Significance for the Correlation Coef- ficient," Journal of the American Statistical Association, 26, 128-134.
Pearson, K. (1930), "On the Theory of Contingency I. Note on Professor J. Arthur Harris' Papers on the Limitation in the Applicability of the Con- tingency Coefficient," Journal of the American Statistical Association, 25, 320-327.
Perry, C. A. (1913), "A Measure of the Manner of Living," Journal of the American Statistical Association, 13, 398-403.
Persons, W. M. (1910), "The Correlation of Economic Statistics," Journal of the American Statistical Association, 12, 287-322.
(1914a), Review of "Money Prices: A Statistical Study of Price Movements" (dissertation, University of Chicago), by J. D. Magee, Jour- nal of the American Statistical Association, 14, 79-82.
(1914b), "Rejoinder," Journal of the American Statistical Associa- tion, 14, 347-350.
(1917), "On the Variate Difference Correlation Method and Curve- Fitting," Journal of the American Statistical Association, 15, 602-642.
Pettigrove, F. G. (1892), "Statistics of Crime in Massachusetts," Journal of the American Statistical Association, 3, 1-17.
Porter, R. P. (1891), "The Eleventh Census," Journal of the American Sta- tistical Association, 2, 321-379.
Price, M. L. (1907), "A Method for Dealing With Unregistered Deaths," Journal of the American Statistical Association, 10, 491-492.
Pritchett, H. S. (1891), "A Formula for Predicting the Population of the United States," Journal of the American Statistical Association, 2, 278- 286.
Reed, W. G. (1917), "The Coefficient of Correlation," Journal of the Amer- ican Statistical Association, 15, 670- 684.
Riebenack, M. (1893), "Railway Statistics as Applicable to Earnings of Passenger Trains," Journal of the American Statistical Association, 3, 519-532.
Ripley, W. Z. (1899), "Notes on Map Making and Graphics Representa- tion," Journal of the American Statistical Association, 1, 318-326.
Rossiter, W. S. (1911), "Vermont: An Historical and Statistical Study of the Progress of the State," Journal of the American Statistical Association, 12, 387-454.
Salmon, L. M. (1892a), "A Statistical Enquiry Concerning Domestic Ser- vice," Journal of the American Statistical Association, 3, 89-118.
(1892b), "Earnings of Women in Michigan," Journal of the Amer- ican Statistical Association, 3, 235-238.
Schultz, T. W., and Snedecor, G. W. (1933), "Analysis of Variance as an Effective Method of Handling the Time Element in Certain Economic Statistics," Journal of the American Statistical Association, 28, 14-30.
Smith, M. R. (1895), "Almshouse Women," Journal of the American Sta- tistical Association, 4, 219-262.
(1900), "Statistics of College and Non-College Women," Journal of the American Statistical Association, 7, 1-26.
"Student" (1914), "The Elimination of Spurious Correlation Due to Posi- tion in Time and Space," Biometrika, 10, 179-180.
Swain, H. H. (1898), "Comparative Statistics of Railroad Rates," Journal of the American Statistical Association, 6, 115-145.
Walker, F. A. (1897), "Remarks of President Walker at Washington," Jour- nal of the American Statistical Association, 5, 179-197.
Watkins, G. P. (1915), "Theory of Statistical Tabulation," Journal of the American Statistical Association, 14, 742-757.
Westergaard, H. (1916), "Scope and Method of Statistics," Journal of the American Statistical Association, 15, 225-291.
Will, G. (1989), "Europe's Second Reformation," Newsweek, November 20, 90.
Willcox, W. F. (1916), "The Nature and Significance of Changes in the Birth and Death Rates in Recent Years," Journal of the American Sta- tistical Association, 15, 1-15.
(1917), "On the Alleged Increase of Cancer," Journal of the Amer- ican Statistical Association, 15, 701-782.
Winslow, C.-E. A. (1900), "A Mathematical Analysis of the Curve of Deaths at Different Ages," Journal of the American Statistical Asso- ciation, 7, 195-197.
(1901), "Statistics of Diseases," Journal of the American Statistical Association, 7, 452-461.
(1902), "A Statistical Study of the Fatality of Typhoid Fever at Different Seasons," Journal of the American Statistical Association, 8, 103-125.
Woods, F. A. (1911), "The Share of Vermont in the Production of Dis- tinguished Men," Journal of the American Statistical Association, 12, 761-764.
Woods, K. P. (1895), "Accidents in Factories and Elsewhere," Journal of the American Statistical Association, 4, 303-321.
Wright, C. D. (1897), "Francis Amasa Walker," Journal of the American Statistical Association, 5, 245-290.
(1908), "Address of Carroll D. Wright, President of the American Statistical Association, at Its Annual Meeting in Boston, Jan. 17, 1908," Journal of the American Statistical Association, 11, 1-16.
Young, A. A. (1900), "The Comparative Accuracy of Different Forms of Quinquennial Age Groups," Journal of the American Statistical Associ- ation, 7, 27-39.
Yule, G. U. (1911), "An Introduction to the Theory of Statistics," London: Charles Griffin.
This content downloaded from 185.2.32.14 on Sat, 14 Jun 2014 04:42:17 AMAll use subject to JSTOR Terms and Conditions