Embed Size (px)
Citation preview
Adaptive networks: Coevolution of disease and topology
Vincent Marceau, Pierre-André Noël, Laurent Hébert-Dufresne, Antoine Allard, and Louis J. DubéDépartement de Physique, de Génie Physique, et d’Optique, Université Laval, Québec, Québec, Canada G1V 0A6
�Received 20 May 2010; published 27 September 2010�
Adaptive networks have been recently introduced in the context of disease propagation on complex net-works. They account for the mutual interaction between the network topology and the states of the nodes. Untilnow, existing models have been analyzed using low complexity analytical formalisms, revealing neverthelesssome novel dynamical features. However, current methods have failed to reproduce with accuracy the simul-taneous time evolution of the disease and the underlying network topology. In the framework of the adaptivesusceptible-infectious-susceptible �SIS� model of Gross et al. �Phys. Rev. Lett. 96, 208701 �2006��, we intro-duce an improved compartmental formalism able to handle this coevolutionary task successfully. With thisapproach, we analyze the interplay and outcomes of both dynamical elements, process and structure, onadaptive networks featuring different degree distributions at the initial stage.
DOI: 10.1103/PhysRevE.82.036116 PACS number�s�: 89.75.Fb, 89.75.Hc, 87.10.Ed
I. INTRODUCTION
The vast majority of network-based models of diseasepropagation rely on the paradigm of static networks �1,2�. Inthis framework, the assumption is made that the time scalewhich characterizes the disease propagation is much shorterthan the time scale with which the network structurechanges. In contrast to static networks, some researchershave investigated the phenomenon of disease propagation ondynamically evolving networks and have revealed new per-spectives on the effects of concurrent or casual partnerships�3–6�, contact mixing �7–9�, and demographic changes �10�.In these models, however, the rules which govern the evolu-tion of the network are independent of what happens on thenetwork. Mutual interactions between the network topologyand the states of the nodes are not taken into account.
Recently, interest has grown for a new class of networksknown under the name of adaptive networks �11,12�. Theyare characterized by the existence of a feedback loop be-tween the dynamics on the network and the dynamics of thenetwork. Among other applications, adaptive networks havebeen introduced in the study of contact processes, such as thestudy of opinion formation �13–22� and epidemic spreading�23–27�. In epidemiological settings, the main idea behindmodels featuring adaptive networks is that individuals maychange their behavior under the threat of an emerging dis-ease �28�. For example, healthy individuals may try to reducetheir chance of catching the disease by adaptively replacingtheir contacts with infectious individuals by contacts withnoninfectious ones. This may significantly alter the structureof the contact network, thus influencing the way the diseasewill spread.
Being an emerging field of research, the study of contactprocesses on adaptive networks still lacks strong theoreticalfoundations. Until now, the analytical treatment of epidemicmodels on adaptive networks has been limited to low-ordermoment-closure approximations �23,25–27�. Despite theirlow complexity, these approaches were able to predict noveldynamical features, such as bistability, hysteresis, and first-order transitions. However, their simple design does not gen-erally allow for accurate predictions about the time evolution
of the system. An integrated analytical formalism able toaccount for the complete time evolution of both dynamicalelements, i.e., the spreading disease and the evolving net-work topology, is still lacking.
In this paper, we present an analytical approach with thepurpose of filling this important gap. Using for its simplicitythe epidemic model of Gross et al. �23� as the basic frame-work, we develop an improved compartmental formalism inwhich nodes are categorized not only by their state of infec-tiousness, but also by the state of their neighbors. With thistool, we study the interplay and outcomes of disease andtopology on adaptive networks with various initial configu-rations. Even if we restrict ourselves to one particular model,the approach presented here is quite general and could easilybe applied to the study of other contact processes on adaptivenetworks.
The paper is organized as follows. In Sec. II, we recall themodel of Gross et al. and introduce our formalism in Sec. III.Analytical predictions are compared with the results obtainedfrom numerical simulations in Secs. IV and V. More pre-cisely, we concentrate on the time evolution of the system inSec. IV, while its stationary states are investigated in Sec. V.Finally, we give further remarks on the endemic stationarystate of the system in Sec. VI and summarize our conclusionsin Sec. VII.
II. SUSCEPTIBLE-INFECTIOUS-SUSCEPTIBLEDYNAMICS ON ADAPTIVE NETWORKS
We will focus on a simple epidemic model on adaptivenetworks introduced by Gross et al. �23�. We consider a ran-dom dynamical network consisting of a fixed number ofnodes N and undirected links M = �k�N /2, where �k� is de-fined as the average degree �number of links per node� of thenetwork. The nodes of the network represent the individualsof a given population, while the links stand for potentialdisease-causing contacts between pairs of individuals. Twonodes are said to be neighbors if they are joined by a link.Neither can a node be linked to itself �no self-loops� norshare more than one link with another node �no repeatedlinks�. The set of probabilities �pk�t�� that a node chosen at
PHYSICAL REVIEW E 82, 036116 �2010�
1539-3755/2010/82�3�/036116�10� ©2010 The American Physical Society036116-1
random at time t is of degree k, called the degree distribu-tion, characterizes the topology of the network at this par-ticular time. The mean degree of a network corresponds tothe first moment of its degree distribution, �k�=kkpk�t�=2M /N.
We consider a case of susceptible-infectious-susceptible�SIS� dynamics. At any time, each node is in a specific state,either susceptible �S� or infectious �I�. Infectious individualscontaminate their susceptible neighbors at rate �, while theyrecover and become susceptible again at rate �. The couplingbetween disease and topology is implemented by adding anadaptive rewiring rule. Susceptible individuals are allowed toreplace at rate � their infectious neighbors for individualschosen at random in the susceptible population. These rulesguarantee that N and M remain constant over time. Even ifthe system contains three dynamical parameters, its behavioris characterized by two independent dimensionless ratios,e.g., � /� and � /�, since time can always be rescaled accord-ing to one parameter.
To perform Monte Carlo simulations of epidemic propa-gation on a network, one requires explicit knowledge of thenetwork structure. Our networks are generated according tothe following algorithm �29�. We first generate a randomdegree sequence �ki� of length N subjected to the initial de-gree distribution specified by �pk�0��. In this process, wemake sure that iki is even since each link consists of two“stubs.” For each node i, a node with ki stubs is produced,then pairs of unconnected stubs are randomly chosen andconnected together until all unconnected stubs are exhausted.Afterward, we test for the presence of self-loops and re-peated links. All faulty links are removed by randomlychoosing a pair of connected stubs and rewiring them to theformer stubs.
Monte Carlo simulations of SIS dynamics on adaptivenetworks are carried out using discrete time steps of length�t. At each step, the recovery, infection, and rewiring eventsare tested with probabilities ��t, ��t, and ��t respectively.Self-loops and repeated links are explicitly forbidden duringthe rewiring process. All simulations start with the randominfection of a fraction � of the individuals in the network. Weuse the parameters �t=0.1 and N=25 000 in all simulations.The recovery rate �=0.005 is used unless explicitly noted.
In what follows, we perform simulations on adaptive net-works featuring different initial degree distributions. The firstdistribution to be used is given by the Kronecker �,
pkDR = �k,k0
, �1�
which produces a degree-regular �DR� network where eachnode has the same degree k0. The second type of distributionconsidered is the Poisson distribution,
pkP =
zke−z
k!, �2�
which corresponds, in the limit N�1, to networks in whichthe presence of a link between two nodes is governed by thesame probability, independent of the links already present inthe network. We will refer to them as Poisson �P� networks,
and their mean degree is given by �k�P=z. Finally, we willalso use a truncated power-law distribution,
pkPL = 1
Ck−�, 0 k kc
0, k � kc,� �3�
where ��0 and C=k=1kc k−�, so that the distribution is prop-
erly normalized. This produces power-law-distributed �PL�networks, where highly connected hubs and individuals withfew connections coexist. The mean degree of networks gen-erated by Eq. �3� is given by �k�PL=C−1k=1
kc k1−�. To obtain anetwork with �k�PL=2, we use �=2.161 04 and kc=20.
III. IMPROVED COMPARTMENTAL FORMALISM
In order to describe the complete time evolution of themodel defined in the last section, we introduce an improvedcompartmental formalism in the spirit of the formalism pre-sented in the Appendix of Noël et al. �30�.
A. Dynamical equations
Let Skl�t� and Ikl�t� be the fractions of nodes of total de-gree k and infectious degree lk that are, respectively, sus-ceptible and infectious at time t �31�. Here, by total degreewe mean the total number of links that belong to a node andby infectious degree the number of those links shared withinfectious individuals. We define the zeroth-order momentsof the Skl and Ikl distributions by
S � kl
Skl, I � kl
Ikl, �4�
the first-order moments by
SS � kl
�k − l�Skl, SI � kl
lSkl,
IS � kl
�k − l�Ikl, II � kl
lIkl, �5�
and the second-order moments by
SSI � kl
�k − l�lSkl, SII � kl
l�l − 1�Skl, etc. �6�
Physically, the zeroth-order moments correspond to the den-sity of S and I nodes, the first-order moments to the densityper node of the various types of arcs, and the second-ordermoments to the density per node of the various types oftriplets in the network �32�.
As mentioned in the last section, our model is constrainedby two conservation relations, namely, the conservation ofnodes,
S + I = 1, �7�
and the conservation of links,
SS + SI + IS + II = �k� , �8�
which must hold at any time t. Moreover, since the networkunder consideration is undirected, the density of SI links
MARCEAU et al. PHYSICAL REVIEW E 82, 036116 �2010�
036116-2
must always equal the density of IS links. This yields theadditional constraint
SI = IS. �9�
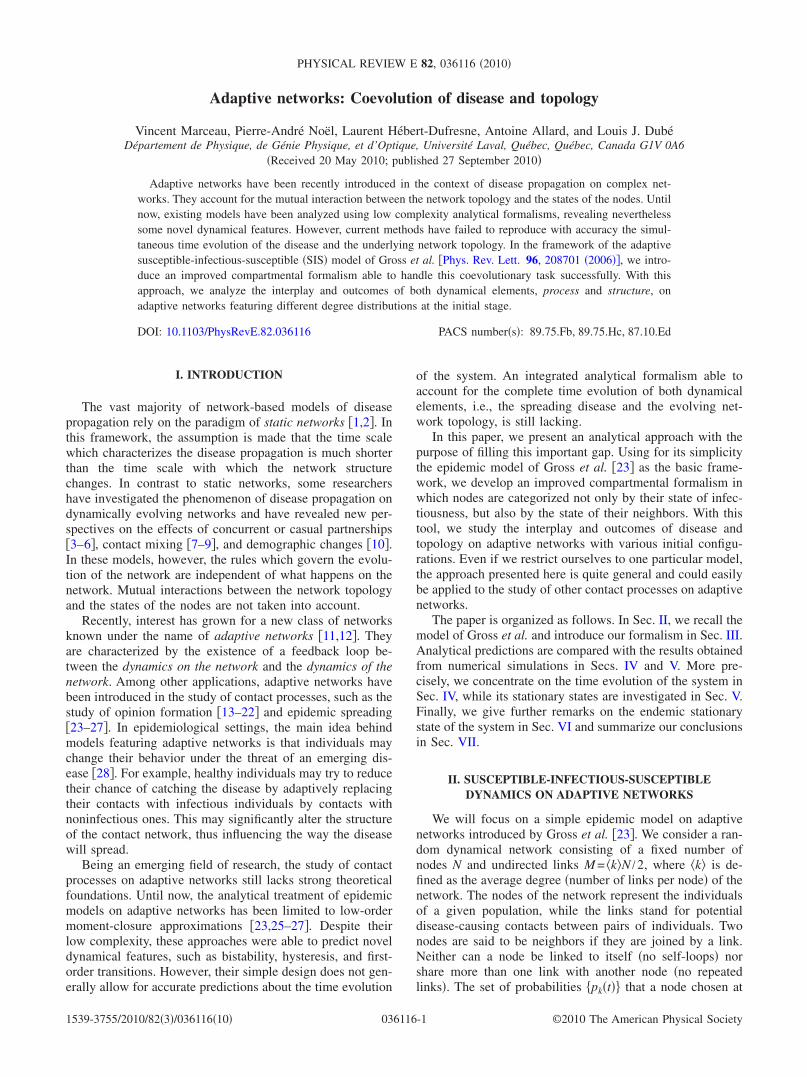
We now derive an ordinary differential equation �ODE� foreach compartment of the system. Let us illustrate the reason-ing for Skl. First, nodes can change compartment accordingto a change in their own state. Nodes are added to Skl at rate�Ikl as nodes from Ikl recover and become susceptible again�Fig. 1�a�� and are removed from Skl at rate �lSkl as they getinfected �Fig. 1�b��.
Second, we have to account for a change in the state ofnode’s neighbors. Nodes from Skl are transferred to Sk�l−1�when one of their infectious neighbors becomes susceptibleagain �Fig. 1�c��, which occurs at rate �lSkl. On the opposite,nodes from Skl are moved to Sk�l+1� when one of their sus-ceptible neighbors catches the disease �Fig. 1�d��. Since wedo not know the exact number of infectious neighbors con-nected to each of the �k− l� susceptible neighbors of nodes inthe Skl compartment, our best option is to take an averageover the entire network. In doing so, we make the assump-tion of zero degree correlation: we assume that nodes, be-yond the knowledge of the state of infection of each neigh-bor, are connected at random in the network. Hence, a nodein compartment Sk�l� with l� infectious neighbors will bereached by following a SS link with a probability equal to�k�− l��Sk�l� /SS. Thus, SSI /SS gives the average number ofinfectious neighbors that a susceptible node reached by fol-lowing a SS link has. The rate associated with the Skl→Sk�l+1� transition is therefore ��SSI /SS��k− l�Skl.
Finally, we have to account for the effects of rewiring.Nodes from Skl become labeled as Sk�l−1� at rate �lSkl as theybreak connections with their infectious neighbors �Fig. 1�e��.Moreover, a node from Skl is moved to the compartmentS�k+1�l if it is chosen as the “new neighbor” in a rewiringevent �Fig. 1�f��. Since the strength of rewiring events is �SIand a node from Skl is randomly chosen with a probabilitySkl /S, this occurs at a rate ��SI /S�Skl. By summing all con-tributions, we obtain the following ODE governing the timeevolution of the Skl compartment:
dSkl
dt= �Ikl − �lSkl + ���l + 1�Sk�l+1� − lSkl� + �
SSI
SS��k − l + 1�Sk�l−1� − �k − l�Skl� + ���l + 1�Sk�l+1� − lSkl� + �
SI
S�S�k−1�l − Skl� . �10�
A similar reasoning for the Ikl compartment yields the following ODE:
dIkl
dt= − �Ikl + �lSkl + ���l + 1�Ik�l+1� − lIkl� + � 1 +
SII
SI���k − l + 1�Ik�l−1� − �k − l�Ikl� + ���k − l + 1�I�k+1�l − �k − l�Ikl� . �11�
It is straightforward to show that the infinite system of ODEsconsisting of Eqs. �10� and �11� satisfies the constraints givenby Eqs. �7�–�9�.
B. Initial conditions
In order for the dynamics to be completely specified, weneed to write an initial condition for each compartment. Inthe case where a fraction � of the nodes is initially infected atrandom, they are given by
Skl�0� = �1 − ��pk�0� k
l��l�1 − ��k−l, �12�
Ikl�0� = �pk�0� k
l��l�1 − ��k−l. �13�
Again, we easily verify that this set satisfies Eqs. �7�–�9�.The complete time evolution of the system is obtained by
integrating numerically the set of ODEs given by Eqs. �10�and �11� truncated at kmax, together with the initial conditions�12� and �13�. Constraints �7�–�9� can be used to check theprecision of the numerical integration. The complexity of thesystem of equations is O�kmax
2 �.
IV. TIME EVOLUTION: INTERPLAY BETWEEN DISEASEAND TOPOLOGY
As stated previously, we initialize the dynamics of themodel by infecting a fraction � of the nodes in the network at
...
... ...
...
... ...
...
... ...
...
... ...
...
... ...
...
... ...
...
... ...
...
... ...
...
... ...
...
... ...
...
... ...
...
... ...
(c)(b)(a)
(d) (e) (f)
FIG. 1. Schematic illustration of the events described in the textwhich result in changing a node from one compartment to another.Susceptible nodes are represented by open symbols ��� and infec-tious nodes by filled symbols ���.
ADAPTIVE NETWORKS: COEVOLUTION OF DISEASE AND… PHYSICAL REVIEW E 82, 036116 �2010�
036116-3
random. Afterward, the states of the nodes and the topologyof the network coevolve according to the rules prescribed inSec. II. In this section, we analyze the time evolution of thesystem, both from the perspectives of the spreading diseaseand of the evolving network topology.
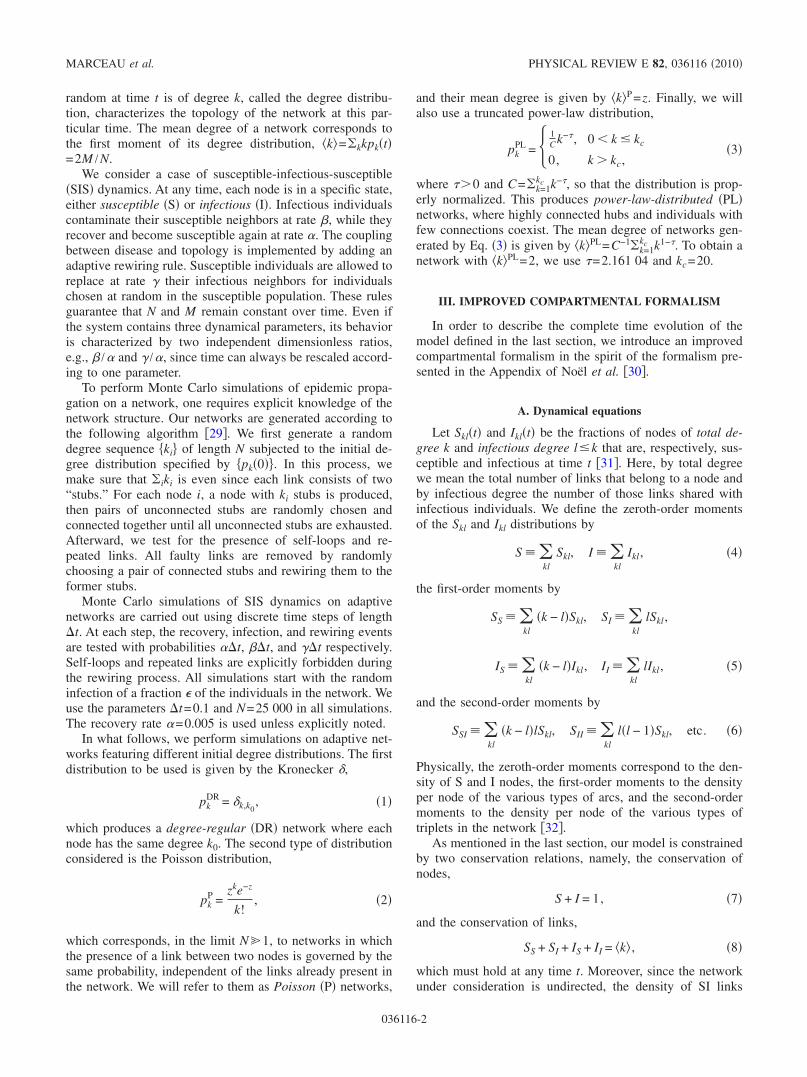
A first quantity of interest is the evolution of the diseaseprevalence, defined as the fraction of infectious individualsat time t. According to our previous definitions, it is simplygiven by I. In Fig. 2, we illustrate the evolution of I fornetworks with different initial topologies, namely, DR, P, andPL networks featuring a mean degree �k�=2. In Fig. 2�a�, allsystems reach an endemic steady state where the diseaseprevalence seems to stabilize at the same value. However,the time evolution of I follows very different patterns de-pending on the initial configuration of the system. In Fig.2�b�, we show that for another set of parameters, the P andthe PL networks converge toward an endemic state, whereasthe rewiring is sufficiently strong to hinder the initial propa-gation in the DR network and, consequently, the system con-verges to a disease-free state. This indicates that the initialnetwork topology may also influence the global outcome of aparticular epidemic scenario.
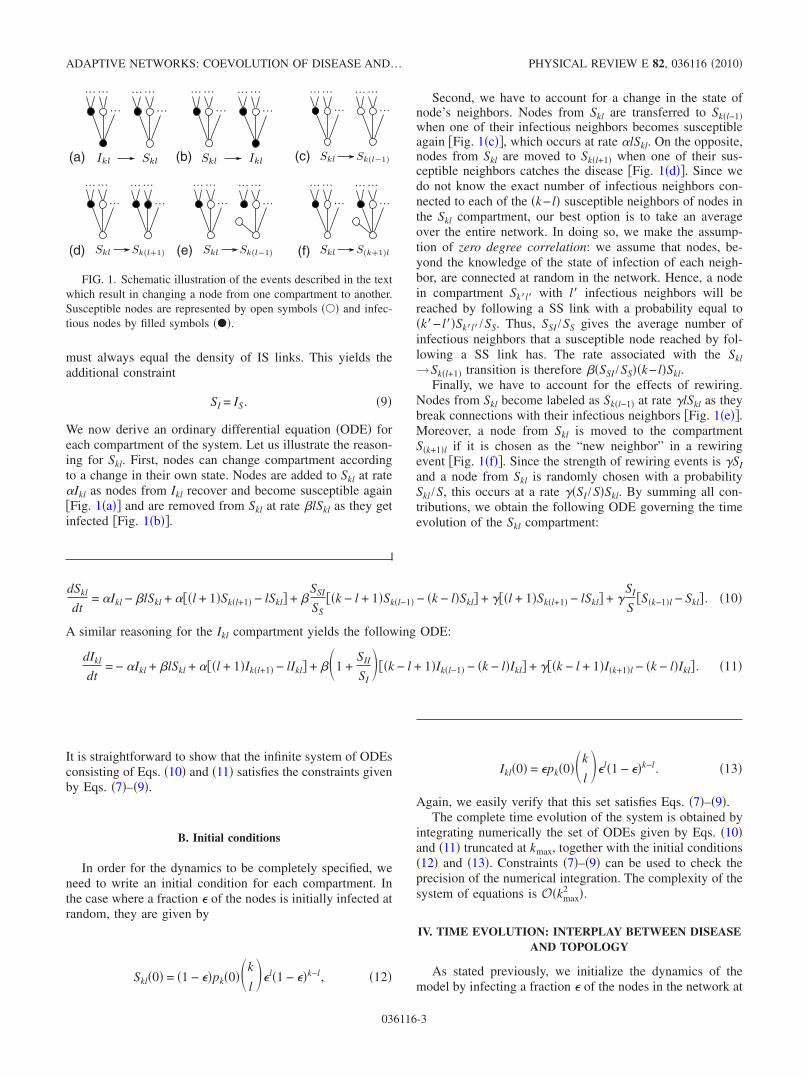
As the disease propagates, connections between individu-als are being adaptively rewired, which affects the degreedistribution of the network. The normalized degree distribu-
tions of susceptible and infectious individuals are given inour formalism by sk�lSkl /S and ik�lIkl / I.
We consider the simplest example of a population initiallyconnected via a DR network with �k�=2. For the same pa-rameters as in Fig. 2�a�, we show in Fig. 3 the time evolutionof the probabilities sk and ik for low-degree �k=0,1 ,2� andhigh-degree �k=3,4 ,5� nodes. At t=0, all nodes are of de-gree 2. When the disease starts to propagate, both degreedistributions are rapidly modified. The fraction of degree 1infectious nodes quickly increases, because the susceptibleneighbor of a degree 2 node who has just been infected willtry to rewire its connection. This result in an increase ofdegree 3 and higher susceptible nodes. During this first phaseof infection, we observe in Fig. 3�b� that the fraction of high-degree susceptible nodes smoothly increases, with each de-gree probability lagging behind the preceding one. Shortlyafter t=200, the fraction of susceptibles that are of degree 3and higher suddenly drops, while the fraction of them thatare either of degree 0 or 1 increases. Since susceptible nodescannot lose connections, this means that the infection reachesan important number of high-degree susceptible nodes thathave formed during the initial stage of infection. Afterward,the topology settles slowly toward its stationary state.
In order to investigate further the interplay between dis-ease and topology, it is useful to look at the evolution of
0
0.2
0.4
0.6
0.8
1
0 200 400 600 800 1000
I
t
DR at t = 0P at t = 0
PL at t = 0
0
0.2
0.4
0.6
0.8
1
0 200 400 600 800 1000
I
t
DR at t = 0P at t = 0
PL at t = 0
(a) (b)
FIG. 2. �Color online� Disease prevalence I against time t on networks featuring the same mean degree �k�=2 but different initial degreedistributions �pk
DR, pkP, and pk
PL�. Parameters are �a� �=0.06, �=0.02 and �b� �=0.04, �=0.04. We use �=0.005 and �=0.1 in all simulations.Points and error bars �if larger than marker size� correspond to the mean and standard deviation computed over 10 000 Monte Carlosimulations; solid lines are the predictions of our analytical approach.
0
0.2
0.4
0.6
0.8
1
0 200 400 600 800 1000
s k,i k
t
s0s1s2i0i1i2
10−2
10−1
100
0 200 400 600 800 1000
s k,i k
t
s3s4s5i3i4i5
(a) (b)
FIG. 3. �Color online� Degree probability sk and ik for susceptible �open symbols, dashed lines� and infectious �filled symbols, solid lines�individuals against time t on an adaptive networks with a DR initial degree distribution �k0=2�. The parameters of the system are �=0.005, �=0.06, �=0.02, and �=0.1, as in Fig. 2�a�. Points and error bars �if larger than marker size� correspond to the mean and standarddeviation computed over 10 000 Monte Carlo simulations; curves are the predictions of our analytical approach. �a� Low-degree nodes �k�0,1, and 2�. �b� High-degree nodes �k�3, 4, and 5�.
MARCEAU et al. PHYSICAL REVIEW E 82, 036116 �2010�
036116-4
some important observables of the system. First, we considerthe fraction of SI links in the network. This quantity, givenby SI �or IS�, is directly proportional to the number of newinfections at a given moment in time. While SI is a goodmeasure of the instantaneous dangerousness of the situation,it does not yield any information about the potential of thedisease to spread further. To quantify the latter effect, we usethe effective branching factor IS
S �SSI /SI, which is the aver-age number of susceptible neighbors of a susceptible indi-vidual reached by following an IS link. Since IS
S is related tothe degree of correlation between susceptible individuals, wealso compute the average fraction CSS�SS / �SS+SI� of con-nections that susceptible individuals share with other suscep-tible individuals.
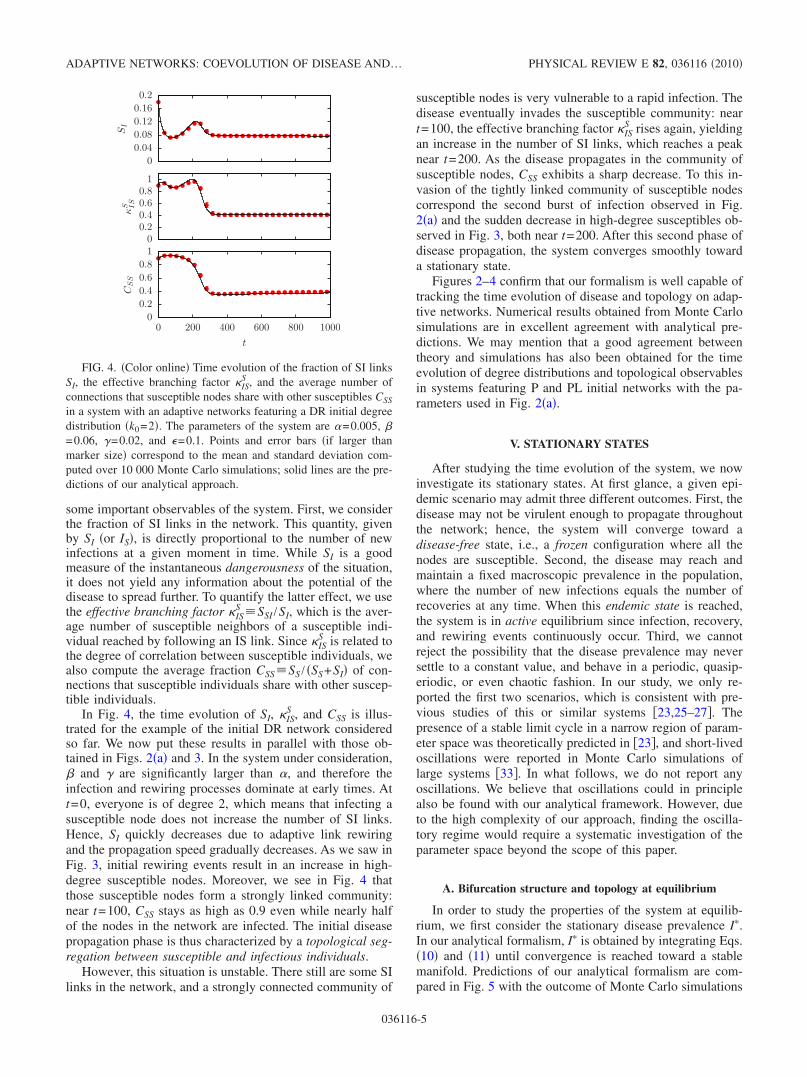
In Fig. 4, the time evolution of SI, ISS , and CSS is illus-
trated for the example of the initial DR network consideredso far. We now put these results in parallel with those ob-tained in Figs. 2�a� and 3. In the system under consideration,� and � are significantly larger than �, and therefore theinfection and rewiring processes dominate at early times. Att=0, everyone is of degree 2, which means that infecting asusceptible node does not increase the number of SI links.Hence, SI quickly decreases due to adaptive link rewiringand the propagation speed gradually decreases. As we saw inFig. 3, initial rewiring events result in an increase in high-degree susceptible nodes. Moreover, we see in Fig. 4 thatthose susceptible nodes form a strongly linked community:near t=100, CSS stays as high as 0.9 even while nearly halfof the nodes in the network are infected. The initial diseasepropagation phase is thus characterized by a topological seg-regation between susceptible and infectious individuals.
However, this situation is unstable. There still are some SIlinks in the network, and a strongly connected community of
susceptible nodes is very vulnerable to a rapid infection. Thedisease eventually invades the susceptible community: neart=100, the effective branching factor IS
S rises again, yieldingan increase in the number of SI links, which reaches a peaknear t=200. As the disease propagates in the community ofsusceptible nodes, CSS exhibits a sharp decrease. To this in-vasion of the tightly linked community of susceptible nodescorrespond the second burst of infection observed in Fig.2�a� and the sudden decrease in high-degree susceptibles ob-served in Fig. 3, both near t=200. After this second phase ofdisease propagation, the system converges smoothly towarda stationary state.
Figures 2–4 confirm that our formalism is well capable oftracking the time evolution of disease and topology on adap-tive networks. Numerical results obtained from Monte Carlosimulations are in excellent agreement with analytical pre-dictions. We may mention that a good agreement betweentheory and simulations has also been obtained for the timeevolution of degree distributions and topological observablesin systems featuring P and PL initial networks with the pa-rameters used in Fig. 2�a�.
V. STATIONARY STATES
After studying the time evolution of the system, we nowinvestigate its stationary states. At first glance, a given epi-demic scenario may admit three different outcomes. First, thedisease may not be virulent enough to propagate throughoutthe network; hence, the system will converge toward adisease-free state, i.e., a frozen configuration where all thenodes are susceptible. Second, the disease may reach andmaintain a fixed macroscopic prevalence in the population,where the number of new infections equals the number ofrecoveries at any time. When this endemic state is reached,the system is in active equilibrium since infection, recovery,and rewiring events continuously occur. Third, we cannotreject the possibility that the disease prevalence may neversettle to a constant value, and behave in a periodic, quasip-eriodic, or even chaotic fashion. In our study, we only re-ported the first two scenarios, which is consistent with pre-vious studies of this or similar systems �23,25–27�. Thepresence of a stable limit cycle in a narrow region of param-eter space was theoretically predicted in �23�, and short-livedoscillations were reported in Monte Carlo simulations oflarge systems �33�. In what follows, we do not report anyoscillations. We believe that oscillations could in principlealso be found with our analytical framework. However, dueto the high complexity of our approach, finding the oscilla-tory regime would require a systematic investigation of theparameter space beyond the scope of this paper.
A. Bifurcation structure and topology at equilibrium
In order to study the properties of the system at equilib-rium, we first consider the stationary disease prevalence I�.In our analytical formalism, I� is obtained by integrating Eqs.�10� and �11� until convergence is reached toward a stablemanifold. Predictions of our analytical formalism are com-pared in Fig. 5 with the outcome of Monte Carlo simulations
00.040.080.120.160.2
SI
00.20.40.60.8
1
κS IS
00.20.40.60.8
1
0 200 400 600 800 1000
CS
S
t
FIG. 4. �Color online� Time evolution of the fraction of SI linksSI, the effective branching factor IS
S , and the average number ofconnections that susceptible nodes share with other susceptibles CSS
in a system with an adaptive networks featuring a DR initial degreedistribution �k0=2�. The parameters of the system are �=0.005, �=0.06, �=0.02, and �=0.1. Points and error bars �if larger thanmarker size� correspond to the mean and standard deviation com-puted over 10 000 Monte Carlo simulations; solid lines are the pre-dictions of our analytical approach.
ADAPTIVE NETWORKS: COEVOLUTION OF DISEASE AND… PHYSICAL REVIEW E 82, 036116 �2010�
036116-5
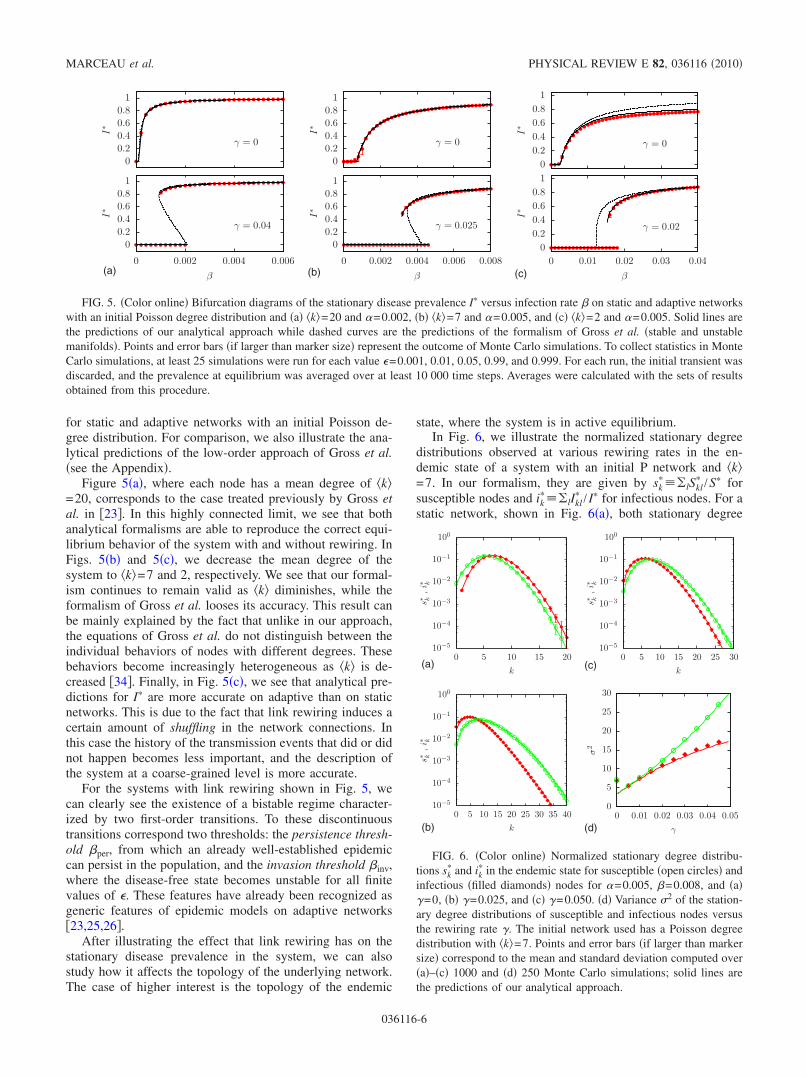
for static and adaptive networks with an initial Poisson de-gree distribution. For comparison, we also illustrate the ana-lytical predictions of the low-order approach of Gross et al.�see the Appendix�.
Figure 5�a�, where each node has a mean degree of �k�=20, corresponds to the case treated previously by Gross etal. in �23�. In this highly connected limit, we see that bothanalytical formalisms are able to reproduce the correct equi-librium behavior of the system with and without rewiring. InFigs. 5�b� and 5�c�, we decrease the mean degree of thesystem to �k�=7 and 2, respectively. We see that our formal-ism continues to remain valid as �k� diminishes, while theformalism of Gross et al. looses its accuracy. This result canbe mainly explained by the fact that unlike in our approach,the equations of Gross et al. do not distinguish between theindividual behaviors of nodes with different degrees. Thesebehaviors become increasingly heterogeneous as �k� is de-creased �34�. Finally, in Fig. 5�c�, we see that analytical pre-dictions for I� are more accurate on adaptive than on staticnetworks. This is due to the fact that link rewiring induces acertain amount of shuffling in the network connections. Inthis case the history of the transmission events that did or didnot happen becomes less important, and the description ofthe system at a coarse-grained level is more accurate.
For the systems with link rewiring shown in Fig. 5, wecan clearly see the existence of a bistable regime character-ized by two first-order transitions. To these discontinuoustransitions correspond two thresholds: the persistence thresh-old �per, from which an already well-established epidemiccan persist in the population, and the invasion threshold �inv,where the disease-free state becomes unstable for all finitevalues of �. These features have already been recognized asgeneric features of epidemic models on adaptive networks�23,25,26�.
After illustrating the effect that link rewiring has on thestationary disease prevalence in the system, we can alsostudy how it affects the topology of the underlying network.The case of higher interest is the topology of the endemic
state, where the system is in active equilibrium.In Fig. 6, we illustrate the normalized stationary degree
distributions observed at various rewiring rates in the en-demic state of a system with an initial P network and �k�=7. In our formalism, they are given by sk
��lSkl� /S� for
susceptible nodes and ik��lIkl
� / I� for infectious nodes. For astatic network, shown in Fig. 6�a�, both stationary degree
00.20.40.60.8
1I∗
γ = 0
00.20.40.60.8
1
0 0.002 0.004 0.006
I∗
β
γ = 0.04
00.20.40.60.8
1
I∗
γ = 0
00.20.40.60.8
1
0 0.01 0.02 0.03 0.04
I∗
β
γ = 0.02
00.20.40.60.8
1
I∗
γ = 0
00.20.40.60.8
1
0 0.002 0.004 0.006 0.008
I∗
β
γ = 0.025
(a) (b) (c)
FIG. 5. �Color online� Bifurcation diagrams of the stationary disease prevalence I� versus infection rate � on static and adaptive networkswith an initial Poisson degree distribution and �a� �k�=20 and �=0.002, �b� �k�=7 and �=0.005, and �c� �k�=2 and �=0.005. Solid lines arethe predictions of our analytical approach while dashed curves are the predictions of the formalism of Gross et al. �stable and unstablemanifolds�. Points and error bars �if larger than marker size� represent the outcome of Monte Carlo simulations. To collect statistics in MonteCarlo simulations, at least 25 simulations were run for each value �=0.001, 0.01, 0.05, 0.99, and 0.999. For each run, the initial transient wasdiscarded, and the prevalence at equilibrium was averaged over at least 10 000 time steps. Averages were calculated with the sets of resultsobtained from this procedure.
10−5
10−4
10−3
10−2
10−1
100
0 5 10 15 20
s∗ k,i∗ k
k
10−5
10−4
10−3
10−2
10−1
100
0 5 10 15 20 25 30
s∗ k,i∗ k
k
10−5
10−4
10−3
10−2
10−1
100
0 5 10 15 20 25 30 35 40
s∗ k,i∗ k
k
0
5
10
15
20
25
30
0 0.01 0.02 0.03 0.04 0.05
σ2
γ
(a)
(b)
(c)
(d)
FIG. 6. �Color online� Normalized stationary degree distribu-tions sk
� and ik� in the endemic state for susceptible �open circles� and
infectious �filled diamonds� nodes for �=0.005, �=0.008, and �a��=0, �b� �=0.025, and �c� �=0.050. �d� Variance �2 of the station-ary degree distributions of susceptible and infectious nodes versusthe rewiring rate �. The initial network used has a Poisson degreedistribution with �k�=7. Points and error bars �if larger than markersize� correspond to the mean and standard deviation computed over�a�–�c� 1000 and �d� 250 Monte Carlo simulations; solid lines arethe predictions of our analytical approach.
MARCEAU et al. PHYSICAL REVIEW E 82, 036116 �2010�
036116-6
distributions follow a Poisson distribution. The peak of ik� is
found at higher degree than the peak of sk� because high-
degree nodes are more likely to get infected. For adaptivenetworks, shown in Figs. 6�b� and 6�c�, both stationary de-gree distributions get significantly broader, particularly forsusceptible nodes. In Fig. 6�d�, the variance �2 of both dis-tributions is plotted versus the rewiring rate �. �2 is asmoothly increasing function of � for both distributions, withits increasing rate being greater for susceptible nodes. Forcomparison, we also indicated the variance of the stationarydistributions on a static network ��=0�. Our results show noapparent continuous transition between the degree distribu-tions at equilibrium on static and adaptive networks. Startingfrom the equilibrium topology in the adaptive regime, it istherefore impossible to recover the initial topology by slowlydecreasing the rewiring rate of the system. We will return tothe implication of this observation in more details in Sec. VI.
The results presented in Fig. 6 confirm that link rewiringhas two main effects of opposite epidemiological conse-quences �23�. On one hand, it locally promotes the isolationof infectious individuals; but, on the other hand, it triggersthe formation of highly connected individuals, which acts assuperspreaders of the disease. This dual effect may be re-sponsible for the apparition of a bistable regime in parameterspace, which is not observed in static networks.
The effects of link rewiring on the topology of adaptivenetworks have been previously observed in stochastic simu-lations �23,26�, but until now, no analytical approach wasable to model them correctly. A previous attempt by Shawand Schwartz �26� has been unsuccessful, basically becausetheir formalism was not able to account for the correlationsbetween the states of neighboring nodes. The results shownin Fig. 6 highlight that our improved compartmental formal-ism is able to capture with great accuracy the degree distri-butions of the system at equilibrium. By characterizing nodesby their total and infectious degree, we are able to overcomethe correlation problems faced in �26�.
B. Comparison of phase diagrams for different initialnetworks
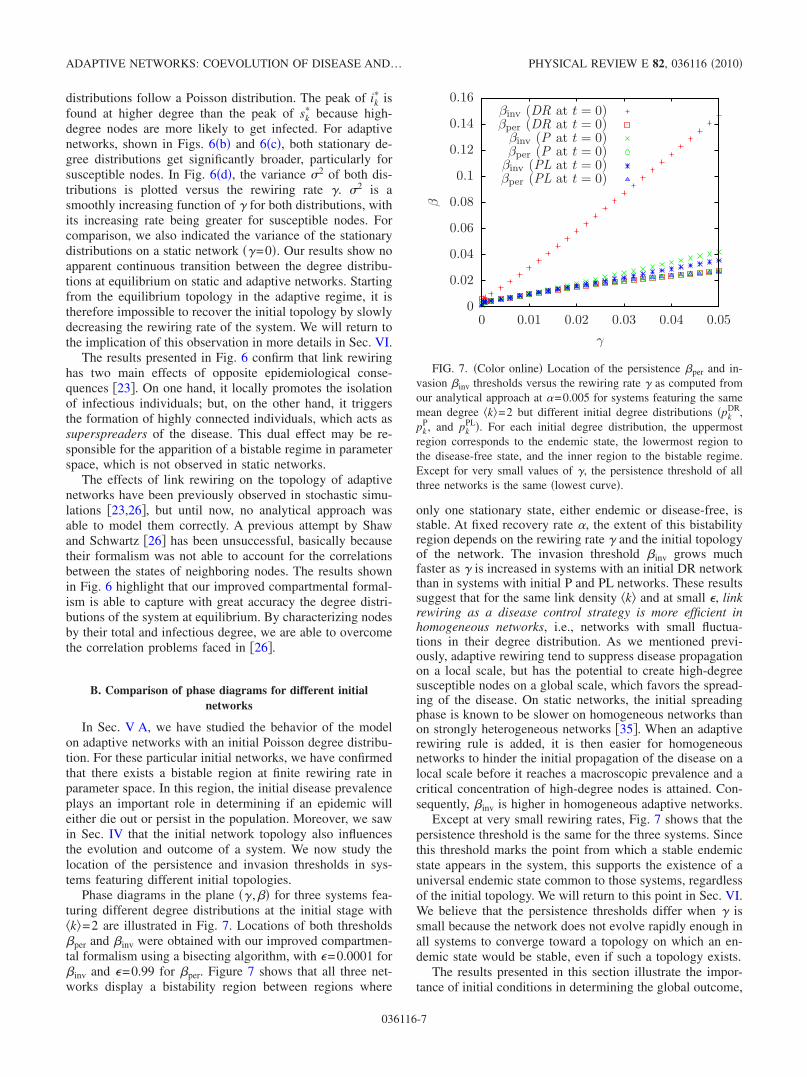
In Sec. V A, we have studied the behavior of the modelon adaptive networks with an initial Poisson degree distribu-tion. For these particular initial networks, we have confirmedthat there exists a bistable region at finite rewiring rate inparameter space. In this region, the initial disease prevalenceplays an important role in determining if an epidemic willeither die out or persist in the population. Moreover, we sawin Sec. IV that the initial network topology also influencesthe evolution and outcome of a system. We now study thelocation of the persistence and invasion thresholds in sys-tems featuring different initial topologies.
Phase diagrams in the plane �� ,�� for three systems fea-turing different degree distributions at the initial stage with�k�=2 are illustrated in Fig. 7. Locations of both thresholds�per and �inv were obtained with our improved compartmen-tal formalism using a bisecting algorithm, with �=0.0001 for�inv and �=0.99 for �per. Figure 7 shows that all three net-works display a bistability region between regions where
only one stationary state, either endemic or disease-free, isstable. At fixed recovery rate �, the extent of this bistabilityregion depends on the rewiring rate � and the initial topologyof the network. The invasion threshold �inv grows muchfaster as � is increased in systems with an initial DR networkthan in systems with initial P and PL networks. These resultssuggest that for the same link density �k� and at small �, linkrewiring as a disease control strategy is more efficient inhomogeneous networks, i.e., networks with small fluctua-tions in their degree distribution. As we mentioned previ-ously, adaptive rewiring tend to suppress disease propagationon a local scale, but has the potential to create high-degreesusceptible nodes on a global scale, which favors the spread-ing of the disease. On static networks, the initial spreadingphase is known to be slower on homogeneous networks thanon strongly heterogeneous networks �35�. When an adaptiverewiring rule is added, it is then easier for homogeneousnetworks to hinder the initial propagation of the disease on alocal scale before it reaches a macroscopic prevalence and acritical concentration of high-degree nodes is attained. Con-sequently, �inv is higher in homogeneous adaptive networks.
Except at very small rewiring rates, Fig. 7 shows that thepersistence threshold is the same for the three systems. Sincethis threshold marks the point from which a stable endemicstate appears in the system, this supports the existence of auniversal endemic state common to those systems, regardlessof the initial topology. We will return to this point in Sec. VI.We believe that the persistence thresholds differ when � issmall because the network does not evolve rapidly enough inall systems to converge toward a topology on which an en-demic state would be stable, even if such a topology exists.
The results presented in this section illustrate the impor-tance of initial conditions in determining the global outcome,
0
0.02
0.04
0.06
0.08
0.1
0.12
0.14
0.16
0 0.01 0.02 0.03 0.04 0.05
β
γ
βinv (DR at t = 0)βper (DR at t = 0)
βinv (P at t = 0)βper (P at t = 0)
βinv (PL at t = 0)βper (PL at t = 0)
FIG. 7. �Color online� Location of the persistence �per and in-vasion �inv thresholds versus the rewiring rate � as computed fromour analytical approach at �=0.005 for systems featuring the samemean degree �k�=2 but different initial degree distributions �pk
DR,pk
P, and pkPL�. For each initial degree distribution, the uppermost
region corresponds to the endemic state, the lowermost region tothe disease-free state, and the inner region to the bistable regime.Except for very small values of �, the persistence threshold of allthree networks is the same �lowest curve�.
ADAPTIVE NETWORKS: COEVOLUTION OF DISEASE AND… PHYSICAL REVIEW E 82, 036116 �2010�
036116-7
either endemic or disease-free, of a given epidemic scenario.The initial network topology determines the size of the bi-stability region, and inside the latter, the initial disease preva-lence determines which stationary state will be reached.
VI. FURTHER REMARKS ON THE ENDEMICSTATE
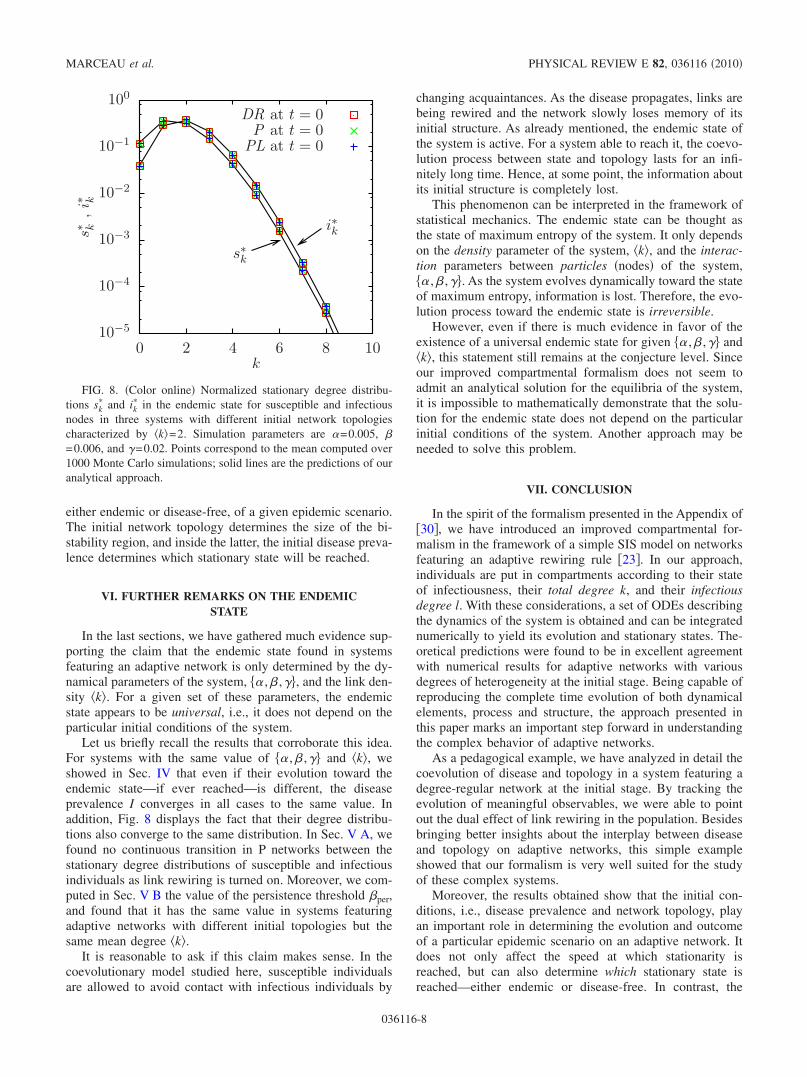
In the last sections, we have gathered much evidence sup-porting the claim that the endemic state found in systemsfeaturing an adaptive network is only determined by the dy-namical parameters of the system, �� ,� ,��, and the link den-sity �k�. For a given set of these parameters, the endemicstate appears to be universal, i.e., it does not depend on theparticular initial conditions of the system.
Let us briefly recall the results that corroborate this idea.For systems with the same value of �� ,� ,�� and �k�, weshowed in Sec. IV that even if their evolution toward theendemic state—if ever reached—is different, the diseaseprevalence I converges in all cases to the same value. Inaddition, Fig. 8 displays the fact that their degree distribu-tions also converge to the same distribution. In Sec. V A, wefound no continuous transition in P networks between thestationary degree distributions of susceptible and infectiousindividuals as link rewiring is turned on. Moreover, we com-puted in Sec. V B the value of the persistence threshold �per,and found that it has the same value in systems featuringadaptive networks with different initial topologies but thesame mean degree �k�.
It is reasonable to ask if this claim makes sense. In thecoevolutionary model studied here, susceptible individualsare allowed to avoid contact with infectious individuals by
changing acquaintances. As the disease propagates, links arebeing rewired and the network slowly loses memory of itsinitial structure. As already mentioned, the endemic state ofthe system is active. For a system able to reach it, the coevo-lution process between state and topology lasts for an infi-nitely long time. Hence, at some point, the information aboutits initial structure is completely lost.
This phenomenon can be interpreted in the framework ofstatistical mechanics. The endemic state can be thought asthe state of maximum entropy of the system. It only dependson the density parameter of the system, �k�, and the interac-tion parameters between particles �nodes� of the system,�� ,� ,��. As the system evolves dynamically toward the stateof maximum entropy, information is lost. Therefore, the evo-lution process toward the endemic state is irreversible.
However, even if there is much evidence in favor of theexistence of a universal endemic state for given �� ,� ,�� and�k�, this statement still remains at the conjecture level. Sinceour improved compartmental formalism does not seem toadmit an analytical solution for the equilibria of the system,it is impossible to mathematically demonstrate that the solu-tion for the endemic state does not depend on the particularinitial conditions of the system. Another approach may beneeded to solve this problem.
VII. CONCLUSION
In the spirit of the formalism presented in the Appendix of�30�, we have introduced an improved compartmental for-malism in the framework of a simple SIS model on networksfeaturing an adaptive rewiring rule �23�. In our approach,individuals are put in compartments according to their stateof infectiousness, their total degree k, and their infectiousdegree l. With these considerations, a set of ODEs describingthe dynamics of the system is obtained and can be integratednumerically to yield its evolution and stationary states. The-oretical predictions were found to be in excellent agreementwith numerical results for adaptive networks with variousdegrees of heterogeneity at the initial stage. Being capable ofreproducing the complete time evolution of both dynamicalelements, process and structure, the approach presented inthis paper marks an important step forward in understandingthe complex behavior of adaptive networks.
As a pedagogical example, we have analyzed in detail thecoevolution of disease and topology in a system featuring adegree-regular network at the initial stage. By tracking theevolution of meaningful observables, we were able to pointout the dual effect of link rewiring in the population. Besidesbringing better insights about the interplay between diseaseand topology on adaptive networks, this simple exampleshowed that our formalism is very well suited for the studyof these complex systems.
Moreover, the results obtained show that the initial con-ditions, i.e., disease prevalence and network topology, playan important role in determining the evolution and outcomeof a particular epidemic scenario on an adaptive network. Itdoes not only affect the speed at which stationarity isreached, but can also determine which stationary state isreached—either endemic or disease-free. In contrast, the
10−5
10−4
10−3
10−2
10−1
100
0 2 4 6 8 10
s∗ k,i∗ k
k
s∗k
i∗k
DR at t = 0P at t = 0
PL at t = 0
FIG. 8. �Color online� Normalized stationary degree distribu-tions sk
� and ik� in the endemic state for susceptible and infectious
nodes in three systems with different initial network topologiescharacterized by �k�=2. Simulation parameters are �=0.005, �=0.006, and �=0.02. Points correspond to the mean computed over1000 Monte Carlo simulations; solid lines are the predictions of ouranalytical approach.
MARCEAU et al. PHYSICAL REVIEW E 82, 036116 �2010�
036116-8
properties of the endemic state do not seem to be affected bythe initial topology of the network. We have presented strongevidence that it only depends on the dynamical parameters ofthe system, �� ,� ,��, and the mean degree of the network,�k�. However, since our model cannot be solved analytically,this conjecture remains to be proved.
The use of the model of Gross et al. as the framework ofthis paper served the purpose of proof of concept. Despite itsappealing simplicity, this particular model is actually lackingin realism. Possible directions for further research could con-sist of including more realistic features in epidemic modelson adaptive networks. A first step in this direction could bethe introduction of cliques �36� in the network to account forthe community structure observed in many real-world net-works �37�. Another interesting effect to implement would besome mechanism of preferential rewiring. For example, thiscould be modeled by choosing nodes with a probability pro-portional to the inverse of their degree in the rewiring pro-cess. This would account for the fact that people may beaware that being in contact with a highly connected indi-vidual is more dangerous than with someone having onlyfew acquaintances. This feature could potentially hinder tosome extent the formation of high-degree susceptible nodesin the network.
ACKNOWLEDGMENTS
Our research team is grateful to NSERC �V.M. andL.J.D.�, FQRNT �V.M., L.H.-D., and L.J.D.�, and CIHR �P.-A.N., L.H.-D., and A.A.� for financial support. We also ac-knowledge Thilo Gross for helpful discussions.
APPENDIX: THE FORMALISM OF GROSS et al.
Until now, existing models of epidemic spreading onadaptive networks have been studied analytically with thehelp of low-order moment-closure approximations�23,25–27�. Here, we present the formalism of Gross et al.for SIS dynamics on adaptive networks �23�.
Let �X1�, �X1X2�, and �X1X2X3�, where Xi� �S , I�, repre-sent the zeroth-, first-, and second-order moments of the sys-tem. �X1� corresponds to the fraction of X1 nodes in the net-work, �X1X2� is the density of X1X2 links per node, and�X1X2X3� is the density of X1X2X3 triplets per node in thenetworks. The variables used by Gross et al. then relate tothose in our formalism by the relations �S�=S, �I�= I, �SS�=SS /2, �II�= II /2, �SI�=SI= IS, �SSI�=SSI, and �ISI�=SII.Conservation relations �7� and �8� can now be written as�S�+ �I�=1 and �SS�+ �SI�+ �II�= �k� /2. In addition to the lat-ter constraints, the dynamics of the zeroth- and first-ordermoments of the system are described by the following bal-ance equations:
d�I�dt
= ��SI� − ��I� , �A1�
d�II�dt
= ���SI� + �ISI�� − 2��II� , �A2�
d�SS�dt
= �� + ���SI� − ��SSI� . �A3�
This dynamical system captures the effect of rewiring via thefirst term in Eq. �A3�. However, it does not yet represent aclosed model because of the appearance of the second-ordermoments in the last two equations. For this reason, the pairapproximation technique is used. The latter consists of ap-proximating the second-order moments by �X1X2X3���X1X2��X2X3� / �X2�, which gives in this case �ISI���SI�2 / �S� and �SSI��2�SS��SI� / �S�. Together with this ap-proximation, Eqs. �A1�–�A3� and the two conservation rela-tions constitute a closed model which can be studied in theframework of nonlinear dynamics.
The main difference between our improved compartmen-tal formalism and previous approaches resides in the level ofcoarse graining in the system. The variables Skl and Ikl, onwhich our formalism is based, simply correspond to the un-derlying distributions of the moments �X1� and �X1X2�.
�1� M. J. Keeling and K. T. D. Eames, J. R. Soc., Interface 2, 295�2005�.
�2� L. A. Meyers, Bull. Am. Math. Soc. 44, 63 �2007�.�3� C. T. Bauch, J. Math. Biol. 45, 375 �2002�.�4� K. T. D. Eames and M. J. Keeling, Math. Biosci. 189, 115
�2004�.�5� I. A. Doherty, S. Shiboski, J. M. Ellen, A. A. Adimora, and N.
S. Padian, Sex Transm. Dis. 33, 368 �2006�.�6� M. Morris, A. E. Kurth, D. T. Hamilton, J. Moody, and S.
Wakefield, Am. J. Public Health 99, 1023 �2009�.�7� N. H. Fefferman and K. L. Ng, Phys. Rev. E 76, 031919
�2007�.�8� E. Volz and L. A. Meyers, Proc. R. Soc. London, Ser. B 274,
2925 �2007�.�9� E. Volz and L. A. Meyers, J. R. Soc., Interface 6, 233 �2009�.
�10� C. Kamp, e-print arXiv:0912.4189.�11� T. Gross and B. Blasius, J. R. Soc., Interface 5, 259 �2008�.�12� Adaptive Networks: Theory, Models and Applications, edited
by T. Gross and H. Sayama �Springer, New York, 2009�.�13� S. Gil and D. Zanette, Phys. Lett. A 356, 89 �2006�.�14� P. Holme and M. E. J. Newman, Phys. Rev. E 74, 056108
�2006�.�15� D. H. Zanette and S. Gil, Physica D 224, 156 �2006�.�16� B. Kozma and A. Barrat, Phys. Rev. E 77, 016102 �2008�.�17� C. Nardini, B. Kozma, and A. Barrat, Phys. Rev. Lett. 100,
158701 �2008�.�18� F. Vazquez, V. M. Eguíluz, and M. S. Miguel, Phys. Rev. Lett.
100, 108702 �2008�.�19� C. Biely, R. Hanel, and S. Thurner, Eur. Phys. J. B 67, 285
�2009�.
ADAPTIVE NETWORKS: COEVOLUTION OF DISEASE AND… PHYSICAL REVIEW E 82, 036116 �2010�
036116-9
�20� G. Iñiguez, J. Kertész, K. K. Kaski, and R. A. Barrio, Phys.Rev. E 80, 066119 �2009�.
�21� S. Mandrà, S. Fortunato, and C. Castellano, Phys. Rev. E 80,056105 �2009�.
�22� P. Sobkowicz, Int. J. Mod. Phys. C 20, 1645 �2009�.�23� T. Gross, Carlos J. Dommar D’Lima, and B. Blasius, Phys.
Rev. Lett. 96, 208701 �2006�.�24� T. Gross and I. G. Kevrekidis, EPL 82, 38004 �2008�.�25� S. Risau-Gusman and D. H. Zanette, J. Theor. Biol. 257, 52
�2009�.�26� L. B. Shaw and I. B. Schwartz, Phys. Rev. E 77, 066101
�2008�.�27� D. Zanette and S. Risau-Gusmán, J. Biol. Phys. 34, 135
�2008�.�28� I. B. Schwartz and L. B. Shaw, Phys. 3, 17 �2010�.�29� M. E. J. Newman, Phys. Rev. E 66, 016128 �2002�.�30� P.-A. Noël, B. Davoudi, R. C. Brunham, L. J. Dubé, and B.
Pourbohloul, Phys. Rev. E 79, 026101 �2009�.�31� For the sake of readability, we will drop from here on the
explicit time dependence of Skl, Ikl, and related quantities. Sta-tionary values will be marked with an asterisk � ��.
�32� An arc is defined as a directional connection between twonodes. Each undirected link in the network thus consists of twodirectional arcs. A triplet is defined as the union of two direc-tional arcs around the same central node.
�33� T. Gross �private communication�.�34� For example, in the case where �k�=20, the behavior of a
degree 18 node will not differ much from that of a degree 22node. However, in the case where �k�=2, there will be a hugedifference between the behavior of a degree 0 node and thebehavior of a degree 4 node.
�35� M. Barthélemy, A. Barrat, R. Pastor-Satorras, and A. Vespig-nani, Phys. Rev. Lett. 92, 178701 �2004�.
�36� L. Hébert-Dufresne, P.-A. Noël, V. Marceau, A. Allard, and L.J. Dubé, Phys. Rev. E 82, 036115 �2010�.
�37� M. Girvan and M. E. J. Newman, Proc. Natl. Acad. Sci. U.S.A.99, 7821 �2002�.
MARCEAU et al. PHYSICAL REVIEW E 82, 036116 �2010�
036116-10
![Multi-Layer Adaptive Power Management Architecture for TSV ... Adaptive Power Management...2D and 3D chips to remove heat [7]. Routing analysis considering signal, power, and thermal](https://img.pdfslide.fr/doc/110x75/601b387425c0ee66ed0576b2/multi-layer-adaptive-power-management-architecture-for-tsv-adaptive-power-management.jpg)