Embed Size (px)
Citation preview
Genet. Sel. Evol. 35 (2003) 559–572 559© INRA, EDP Sciences, 2003DOI: 10.1051/gse:2003039
Original article
AFLP linkage map of the Japanese quailCoturnix japonica
Odile ROUSSOTa∗, Katia FEVEa, Florence PLISSON-PETITa,Frédérique PITELa, Jean-Michel FAUREb, Catherine BEAUMONTb,
Alain VIGNALa
a Laboratoire de génétique cellulaire, Institut national de la recherche agronomique,31326 Castanet-Tolosan, France
b Station de recherches avicoles, Institut national de la recherche agronomique,37380 Nouzilly, France
(Received 26 December 2002; accepted 7 April 2003)
Abstract – The quail is a valuable farm and laboratory animal. Yet molecular informationabout this species remains scarce. We present here the first genetic linkage map of the Japanesequail. This comprehensive map is based solely on amplified fragment length polymorphism(AFLP) markers. These markers were developed and genotyped in an F2 progeny from a crossbetween two lines of quail differing in stress reactivity. A total of 432 polymorphic AFLPmarkers were detected with 24 TaqI/EcoRI primer combinations. On average, 18 markers wereproduced per primer combination. Two hundred and fifty eight of the polymorphic markerswere assigned to 39 autosomal linkage groups plus the ZW sex chromosome linkage groups.The linkage groups range from 2 to 28 markers and from 0.0 to 195.5 cM. The AFLP map coversa total length of 1516 cM, with an average genetic distance between two consecutive markers of7.6 cM. This AFLP map can be enriched with other marker types, especially mapped chickengenes that will enable to link the maps of both species and make use of the powerful comparativemapping approach. This AFLP map of the Japanese quail already provides an efficient tool forquantitative trait loci (QTL) mapping.
Japanese quail / AFLP / genetic map / linkage groups / chromosomes
1. INTRODUCTION
Japanese quail are appreciated for meat and eggs. It is also a valuablelaboratory species because of its small body size, rapid generation interval andhigh prolificacy [24]. It has been used in selection experiments (e.g. [6,34]),and as a model for a variety of studies in embryonic development, genetics,
∗ Correspondence and reprintsE-mail: [email protected]
560 O. Roussot et al.
perception and behaviour and their neurological basis, reproduction, nutrition,production and pathology.
Japanese quail (Coturnix japonica), as the chicken (Gallus gallus), belongsto the order Galliformes and the family Phasianidae. Both species have asimilar genome length (1.2×10⁹ bp) and a karyotype of 2n = 78 chromosomes,composed of morphologically distinguishable macrochromosomes (1–8 and theZW sex chromosomes) and individually indistinguishable microchromosomes.Comparative cytogenetic studies, based on banding patterns or chromosomepainting using FISH, have revealed a highly conserved chromosome homology:the few chromosome rearrangements observed were essentially pericentricinversions in chromosomes 1, 2, 4 and 8 [35,37,40]. Today, the consensuslinkage map of the chicken genome has almost 2000 loci [8] whereas onlythree linkage groups involving protein and plumage colour loci have beenreported for the quail [12,13,25,36].
In linkage studies, microsatellite markers are currently used because theyare highly polymorphic and codominantly inherited. However, they occur atabout a 5–7-fold lower frequency in avian genomes than in mammals [30] andare thought to be biased in their distribution [30,38]. In addition, cross-speciesmicrosatellite amplification in birds is successful only at a low rate. On average,with chicken designed primers, 10–15% of the amplified markers in the Japan-ese quail are found to correspond to the orthologous loci of the chicken [11,28]. This does not guarantee these microsatellites to be polymorphic inthe populations studied. As a consequence, a sufficient set of markers forgenome mapping cannot be recovered by this method. Microsatellites haveonly very recently been specifically developed in the Japanese quail [15,16,21].
To develop a genetic map of the Japanese quail, we chose the amplified frag-ment length polymorphism (AFLP) technique [45]. In contrast to microsatellitemarkers, the AFLP technology screens a high number of loci and generatesnumerous markers, simply using a generic set of primers, without requiringprior knowledge of sequence data. It has been extensively applied to micro-organisms and plants, but rarely to animals [1,9,42]. These applications includemany genetic diversity studies as well as the construction of linkage maps orquantitative trait loci (QTL) mapping. In particular, the AFLP techniquewas demonstrated to be useful in the chicken to add new markers on the EL(East Lansing) reference map [17] and on the Wageningen linkage map [10].Its suitability for other avian species has also been suggested. As in thesestudies, we adopted the enzyme combination TaqI/EcoRI and trinucleotideprimer extensions to produce AFLP markers in the Japanese quail. Wepresent here the first linkage map for this species, based solely on AFLPmarkers.
AFLP linkage map of the Japanese quail 561
2. MATERIALS AND METHODS
2.1. Mapping population
An F2 cross between two Japanese quail lines divergently selected for shortor long duration of tonic immobility [5,23], a fear-related freezing behaviour,was performed. Six half-sib families originating from 6 F1 sires and 12 F1dams were used as the mapping population. The average number of chicks perF1 female was 58 ± 6. For one full-sib family, all the chicks were analysed.For the others, an average of 23 ± 3 chicks were genotyped. These F2 birdswere selected on the basis of their trait value, since this population also servedfor a QTL study. A total of 348 animals was genotyped: 20 F0, 18 F1, 310 F2animals.
2.2. DNA isolation
Genomic DNA was extracted from blood samples with a rapid high-saltprotocol scaled to a 96-well microplate format. In each well, a 2 µL bloodsample was incubated 10 min at room temperature with 10 µL cell lysis buffer(20 mM EDTA, 60 mM NaCl, 0.2% saponine Sigma). Twenty µL of washbuffer (10 mM EDTA, 75 mM NaCl) was added and, after centrifugation(1300 g, 15 min, Megafuge 1.0 R, Heraeus Sepatech), the supernatant wasdiscarded. The nuclei lysis was performed overnight at 37 ◦C with 80 µL ofan SDS-Proteinase K solution (10 mM EDTA, 10 mM NaCl, 10 mM Tris HCl,0.5% SDS, 100 µg · mL−1 Proteinase K Quantum Appligene). To achieveprotein precipitation, 30 µL of a saturated (6 M) NaCl solution was addedand the sample was vigorously mixed and centrifuged (1300 g, 30 min). Thesupernatant was transferred to a fresh 0.65 mL microplate well (Deep WellPlate, 0.65 mL, ABGene) and the DNA was precipitated with 250 µL absoluteethanol. After centrifugation (1300 g, 30 min), the ethanol was discarded.The DNA samples were air dried and redissolved in 200 µL Tris-EDTA buffer(10 mM Tris HCl, 0.1 mM EDTA pH 7.5). The DNA quantity and quality wereassessed by agarose gel electrophoresis.
2.3. AFLP analysis
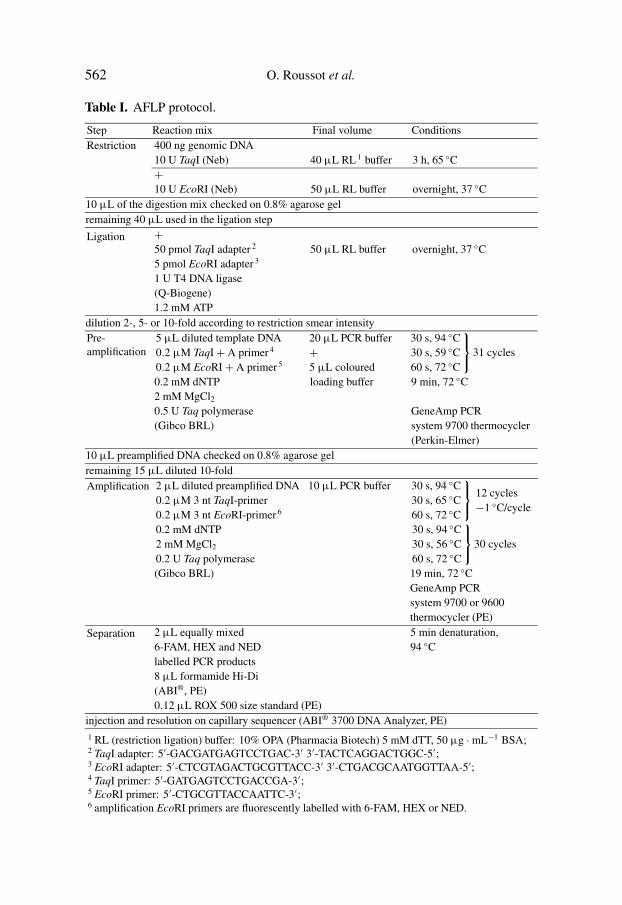
AFLP markers were generated following the conditions summarised inTable I. Preamplification primers were extended by one base, an adenine,at their 3′ end. Amplification primers were extended by 2 additional selectionnucleotides. Primer combinations, of which 27 were analysed on the mappingpopulation, had been previously selected according to line-specific DNA poolpatterns.
562 O. Roussot et al.
Table I. AFLP protocol.
Step Reaction mix Final volume ConditionsRestriction 400 ng genomic DNA
10 U TaqI (Neb) 40 µL RL 1 buffer 3 h, 65 ◦C+10 U EcoRI (Neb) 50 µL RL buffer overnight, 37 ◦C
10 µL of the digestion mix checked on 0.8% agarose gelremaining 40 µL used in the ligation step
Ligation +50 pmol TaqI adapter 2 50 µL RL buffer overnight, 37 ◦C5 pmol EcoRI adapter 3
1 U T4 DNA ligase(Q-Biogene)1.2 mM ATP
dilution 2-, 5- or 10-fold according to restriction smear intensityPre-amplification
5 µL diluted template DNA 20 µL PCR buffer 30 s, 94 ◦C0.2 µM TaqI+ A primer 4 + 30 s, 59 ◦C0.2 µM EcoRI+ A primer 5 5 µL coloured 60 s, 72 ◦C
31 cycles
0.2 mM dNTP loading buffer 9 min, 72 ◦C2 mM MgCl20.5 U Taq polymerase GeneAmp PCR(Gibco BRL) system 9700 thermocycler
(Perkin-Elmer)10 µL preamplified DNA checked on 0.8% agarose gelremaining 15 µL diluted 10-foldAmplification 2 µL diluted preamplified DNA 10 µL PCR buffer 30 s, 94 ◦C
0.2 µM 3 nt TaqI-primer 30 s, 65 ◦C0.2 µM 3 nt EcoRI-primer 6 60 s, 72 ◦C
12 cycles−1 ◦C/cycle
0.2 mM dNTP 30 s, 94 ◦C2 mM MgCl2 30 s, 56 ◦C0.2 U Taq polymerase 60 s, 72 ◦C
30 cycles
(Gibco BRL) 19 min, 72 ◦CGeneAmp PCRsystem 9700 or 9600thermocycler (PE)
Separation 2 µL equally mixed 5 min denaturation,6-FAM, HEX and NED 94 ◦Clabelled PCR products8 µL formamide Hi-Di(ABI®, PE)0.12 µL ROX 500 size standard (PE)
injection and resolution on capillary sequencer (ABI® 3700 DNA Analyzer, PE)1 RL (restriction ligation) buffer: 10% OPA (Pharmacia Biotech) 5 mM dTT, 50 µg ·mL−1 BSA;2 TaqI adapter: 5′-GACGATGAGTCCTGAC-3′ 3′-TACTCAGGACTGGC-5′;3 EcoRI adapter: 5′-CTCGTAGACTGCGTTACC-3′ 3′-CTGACGCAATGGTTAA-5′;4 TaqI primer: 5′-GATGAGTCCTGACCGA-3′;5 EcoRI primer: 5′-CTGCGTTACCAATTC-3′;6 amplification EcoRI primers are fluorescently labelled with 6-FAM, HEX or NED.
AFLP linkage map of the Japanese quail 563
Resulting electrophoregrams were checked with Genescan® 3.5 and ana-lysed using Genotyper® 3.6 (ABI®, PE). Markers between 50 and 500 bp wereidentified visually from F0 and F1 animal patterns. Marker peaks were thendetected automatically and checked manually in all the lanes. AFLP markerswere named after the TaqI primer extension followed by the EcoRI primerextension and the fragment size in bp. They were scored dominantly: bandabsence (recessive homozygous) was coded 11, band presence (heterozygousor dominant homozygous) 20. Missing data were coded as 00.
2.4. Map construction
Prior to linkage analysis, a χ2 test (P = 0.05) was performed for each markerin each of the 12 full-sib families in order to check Mendelian inheritance. Datadisplaying an unexpected segregation ratio were excluded.
Linkage analyses were conducted with CRI-MAP 2.4 [7]. First, the twopointoption of CRI-MAP was used to calculate pairwise LOD scores and to identifylinkage groups at decreasing values of the LOD threshold, from 10 to 4. Second,the linear order of markers within each linkage group was determined using thebuild and flips options of CRI-MAP. To begin, build was run several times withLOD values of 3 and 2, to find a well supported order for a subset of markers. Asmany additional markers as possible were then inserted in their most probableposition relative to the previously ordered markers. The most likely order wasfinally checked with flips. Map distances are given by CRI-MAP according tothe Kosambi function.
One linkage group was suspected to correspond to the sex chromosomes,ZW. This was confirmed creating a biallelic sex marker, designed to followthe inheritance of the W chromosome, and running the twopoint option ofCRI-MAP. Raw data were reconsidered in order to identify Z or W markers,attested by a sex-specific segregation ratio, and to build a map for these twochromosomes. Markers outside of this linkage group were also tested forlinkage to the biallelic sex marker.
3. RESULTS
3.1. AFLP markers
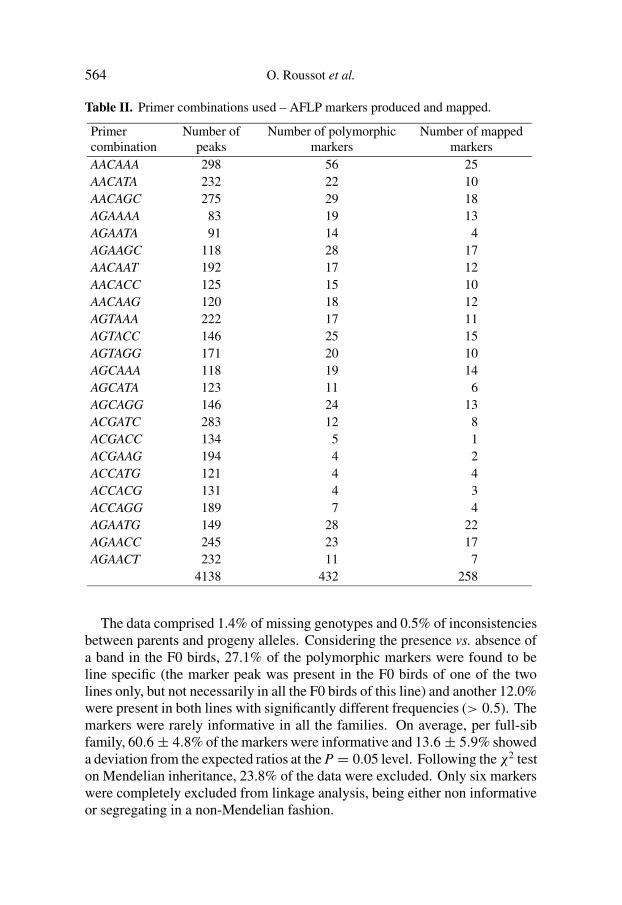
Of the selected primer combinations, twenty-four were analysed and 3(ACGAAA, ACGAAC, ACGAGC) were not further studied because they pro-duced patterns of poor quality. The 24 TaqI/EcoRI primer combinationsanalysed generated more than 4000 bands, of which 432 were consideredas polymorphic markers and typed in the population (Tab. II). On average,each primer combination yielded 18 polymorphic markers.
564 O. Roussot et al.
Table II. Primer combinations used – AFLP markers produced and mapped.
Primercombination
Number ofpeaks
Number of polymorphicmarkers
Number of mappedmarkers
AACAAA 298 56 25AACATA 232 22 10AACAGC 275 29 18AGAAAA 83 19 13AGAATA 91 14 4AGAAGC 118 28 17AACAAT 192 17 12AACACC 125 15 10AACAAG 120 18 12AGTAAA 222 17 11AGTACC 146 25 15AGTAGG 171 20 10AGCAAA 118 19 14AGCATA 123 11 6AGCAGG 146 24 13ACGATC 283 12 8ACGACC 134 5 1ACGAAG 194 4 2ACCATG 121 4 4ACCACG 131 4 3ACCAGG 189 7 4AGAATG 149 28 22AGAACC 245 23 17AGAACT 232 11 7
4138 432 258
The data comprised 1.4% of missing genotypes and 0.5% of inconsistenciesbetween parents and progeny alleles. Considering the presence vs. absence ofa band in the F0 birds, 27.1% of the polymorphic markers were found to beline specific (the marker peak was present in the F0 birds of one of the twolines only, but not necessarily in all the F0 birds of this line) and another 12.0%were present in both lines with significantly different frequencies (> 0.5). Themarkers were rarely informative in all the families. On average, per full-sibfamily, 60.6 ± 4.8% of the markers were informative and 13.6 ± 5.9% showeda deviation from the expected ratios at the P = 0.05 level. Following the χ2 teston Mendelian inheritance, 23.8% of the data were excluded. Only six markerswere completely excluded from linkage analysis, being either non informativeor segregating in a non-Mendelian fashion.
AFLP linkage map of the Japanese quail 565
3.2. AFLP linkage map
To define linkage groups, decreasing LOD threshold values were used. At aLOD of 5, some of the major linkage groups were merged due to a few linkagesthat were likely spurious. Also, the number of additional markers that wereintegrated at this LOD value did not justify lowering the threshold. Thereforea LOD cut-off value of 6 was preferred.
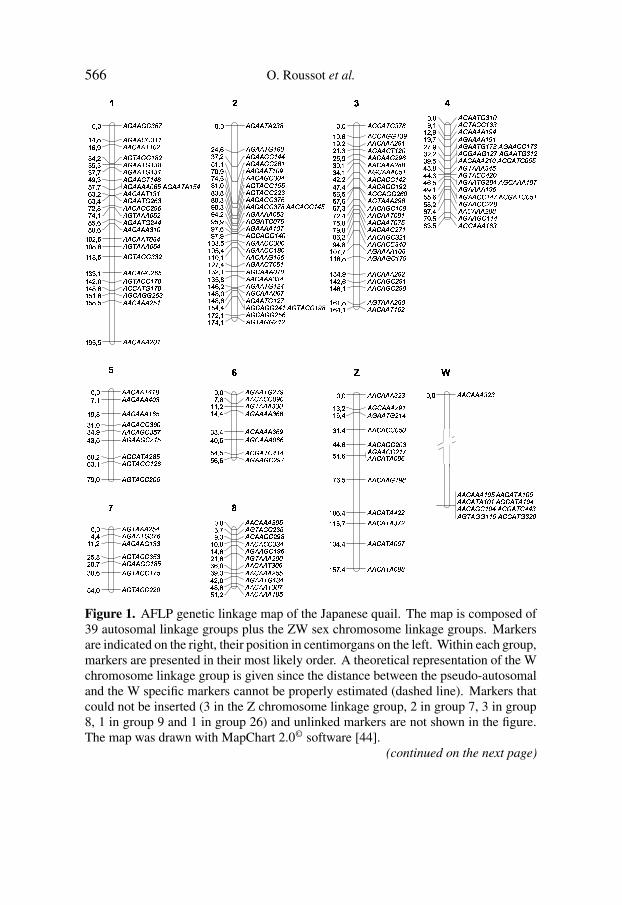
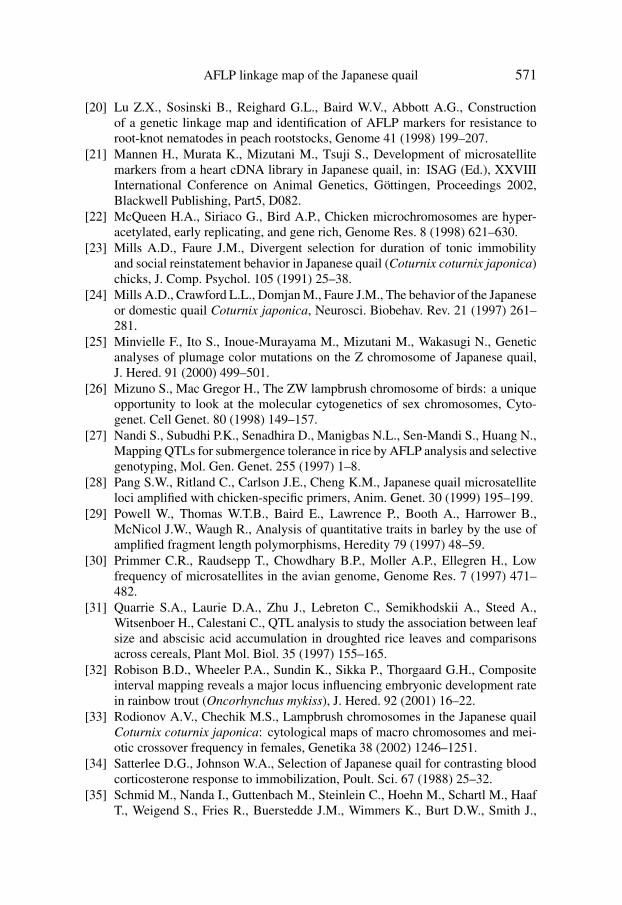
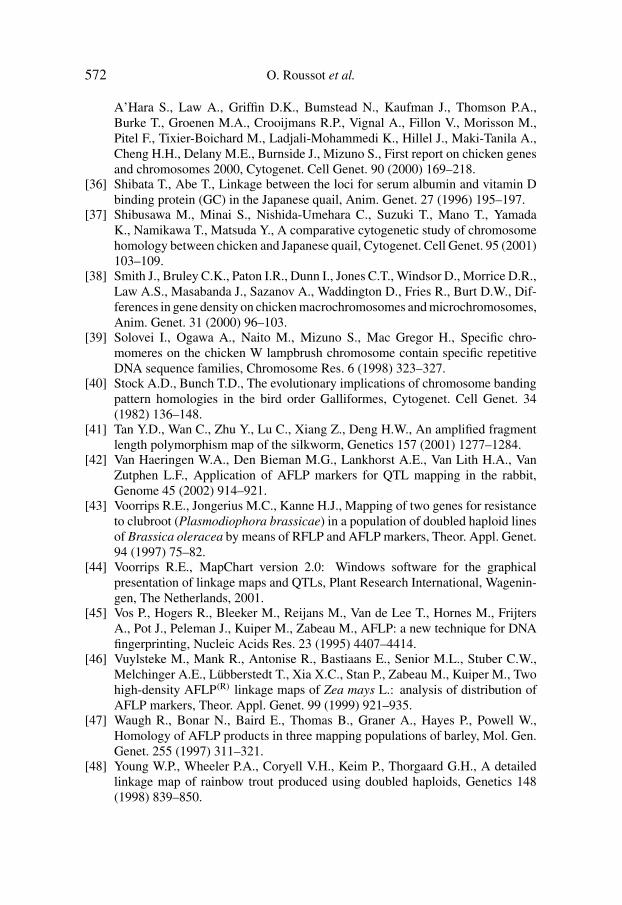
The AFLP linkage map comprises 258 markers (59.7%) distributed over39 autosomal linkage groups plus the ZW linkage groups (Fig. 1) while 174markers (40.3%) remain unlinked at the LOD threshold used. Linkage groupsvary from 2 to 28 markers. There are 11 major linkage groups of 8–28 markersand 30 minor groups of 6 markers or less.
Of the 23 markers of the gonosome linkage group, eight W-specific markerswere found. One marker presents a normal autosomal segregation and istherefore thought to belong to the pseudo-autosomal region. The other 14markers, presenting male-specific inheritance, were considered as Z-specificmarkers. A schematic representation is given for the W chromosome since norecombination occurs along its specific part and hence, no order can be inferred.
The AFLP linkage map of the Japanese quail covers a total length of1516 cM. Linkage groups range from 0.0 to 195.5 cM. The spacing between twoconsecutive markers ranges from 0.0 to 37 cM, with an average of 7.6± 6.2 cM.There are 17 pairs of markers in complete linkage in the autosomal linkagegroups and 7 markers in the W linkage group. For the latter, such a segregationpattern was expected and the markers are likely to correspond to differentloci. For the former, two markers can result from the amplification of thesame locus. The number of mapped loci can thus be estimated to be at least258 − 17 = 241. On the whole, the markers are close together and regularlydistributed. The markers generated by the same primer combination are sharedout among different linkage groups, except for the AACATA combination thatproduced many of the ZW markers.
4. DISCUSSION
Thanks to its multilocus nature and because potentially all possible primercombinations can be tested, the AFLP technique enables the production ofa large number of polymorphic markers. The biological material used alsocontributes to the level of revealed polymorphism and indeed, the quail isgenerally considered as a highly polymorphic species. The proportions ofline-specific markers (27.1%) and of shared markers with significant frequencydifferences (12.0%) help assess the level of between line polymorphism. TheAFLP patterns generated from Japanese quail DNA were complex. An averageof 18 polymorphic markers per primer combination was obtained, which is
566 O. Roussot et al.
���������������� ���������� �������� ��� �������������� ���� ��� ������ ������� ���� ��� !���������"�#� ����$�� ����������"�#� �����%�� %������������� &"����� ������������'���(���������� �#� (�&$�%�� %������������� ����"��� !���������"�'�����"��� ����������'���")"(%�!�� ������ ��������(��% ��� ����������"�'��&"&��$�� ������������'��� ������ �����������������&�*��!�� $����� ��������(�&�*���� ������ ��������������*�� $
���������������(�*���� ������ ���'���� �� �"!�� ����'�����"�#�� )� ��� ������������'�����*$���� ������������'�"(���*$��� $
�����������'�"����*��$� $
+
�������,� �'������ �
�������,�"��� )��!���� ����������,��� &"&��%� !���������,������$���� ����������,���*��)%��� ����������������&% ��� $����� �����#� ("(����� ������ �����'���"����� ��������������� ����� ���������������*�'�����������,� &"(���� ���������������(��� ��� !��� �����"� ��*(��$� ������������#� ����%� ������������#� &"���%� ����������'�������*�"�� $���������'���*����*�"$� �������������� �"���� �� ���������������(��� !%� ���������������*��*��!�� ������������'���"&�*�"$� ��������,�"��� ��&� ���� !��������������)�� ���� ��������,�"��� ��� ���� ������������'�"&�������� ���'��� )"��*$���� ������������'�("��*%�!�� ������ �����'��&"��*%���� �
-
���'�����"�'��*���� ����'�������#� �)�*�� ������������ �)���*�� !������������� ��!���� ������������'�")"�!"$� ������������ �������� ���������������(��� ��� ���������� �,� &���"!�� !�����������,� )���%� ����������,�'����$���� $����� ����� �)"�$�%� ������������,� ����"%� ���������������)��%�!�� ���������������*(%�$� ������������'��"�%��� ����������������������� !��������� ����&"�� ��� ������������#� �"�� ��%� %��������������*)�"�*�� �
����������� �)��� � ��� ��������������")��� �"!�� ��������������")��� �"��� ������ ����� ������*����� ��������������*� ��*����� �
.
���������"�'��� ��� ����#� ���'��� ����� ��������������*)�&�*!�� ��������������*)��� �� %���������"�#�� �����������'���� �!%� ����'�������#� �� ���������"�'��� ���!�� !�����������'��� ����� �����"���"(�(�"�� $���#� �����'��&"(���� ����#� ���'��&"�"��"��� ����������"�'���&������������#� ������ $�������������*)�(���� ����������'��� &����� �����"� ��(��$"$� ����������'������$"�� !�����������'�"����%� ������������,��� &%"�� $���,���������*����"�� $
/
������������&�� ��� ������������ &���%� �������������� ��(�*��� ���������������������� ��������������"(�� ��� ���������������� (���� $
�������,� �'���(�"��� !����� �����#� ���"��� �
����� ��� ���"�"(%���� �
0
������������&�� ��� ������������ &���%� �������������� ��(�*��� ���������������������� ��������������"(�� ��� ���������������� (���� $
�������,� �'���(�"��� !����� �����#� ���"��� �
����� ��� ���"�"(%���� �
0
�������,�"�'��*)�� ���������� ���")��%� ������ �����'�����"��� !�����������'����� ��� �
�����������'���)�"�� ������������'�������� ���� �����"��&�� &$���� $�������������")�$���� �
1
�������,�"�'��*)�� ���������� ���")��%� ������ �����'�����"��� !�����������'����� ��� �
�����������'���)�"�� ������������'�������� ���� �����"��&�� &$���� $�������������")�$���� �
1
����� ����� �(�&�� ����������"�'������� ������������#� �"������ !����� ��� ���"(��!"$�� ��������������*��(!"��� %����� ��� �,�� (����� �
����� ��� ������$ ��� �
2
����� ����� �(�&�� ����������"�'������� ������������#� �"������ !����� ��� ���"(��!"$�� ��������������*��(!"��� %����� ��� �,�� (����� �
����� ��� ������$ ��� �
2
�����������'�")"(�� ������ ��� ���"�"(�� %�������������")"��� ���������� ���"��&� �� ������������,� )�� ��� ������ �����'�"�"�!���� ����������,����"������ ������������'�"("(�"�� ��������,�"�#� ��&�!�� ����������,��������� ������������#� �"($���� !
3
�����������'�")"(�� ������ ��� ���"�"(�� %�������������")"��� ���������� ���"��&� �� ������������,� )�� ��� ������ �����'�"�"�!���� ����������,����"������ ������������'�"("(�"�� ��������,�"�#� ��&�!�� ����������,��������� ������������#� �"($���� !
3
����������� �"������ ������������'�")���*�� !���������"�'��� &� ��� �
��������� � ��(������� �
�������������"�������� ���������� ��������������� ����)"�$ ��� �
�����������#� )��%���� $
��������� �'&����� ����� ���������� �'�� ��"�*$� %
��������� ����(�� � ��� �
��������� ����)��� $�%� �
4
����������� �"������ ������������'�")���*�� !���������"�'��� &� ��� �
��������� � ��(������� �
�������������"�������� ���������� ��������������� ����)"�$ ��� �
�����������#� )��%���� $
��������� �'&����� ����� ���������� �'�� ��"�*$� %
��������� ����(�� � ��� �
��������� ����)��� $�%� �
4
�����������'������� �
�����������#� ��(��������,� �#� �"(��������� �#� �������,����� ���*��&�����������,� ��&���� �����"��&"&������� ��������� (���� ���,�"�����"�
5
�����������'������� �
�����������#� ��(��������,� �#� �"(��������� �#� �������,����� ���*��&�����������,� ��&���� �����"��&"&������� ��������� (���� ���,�"�����"�
5
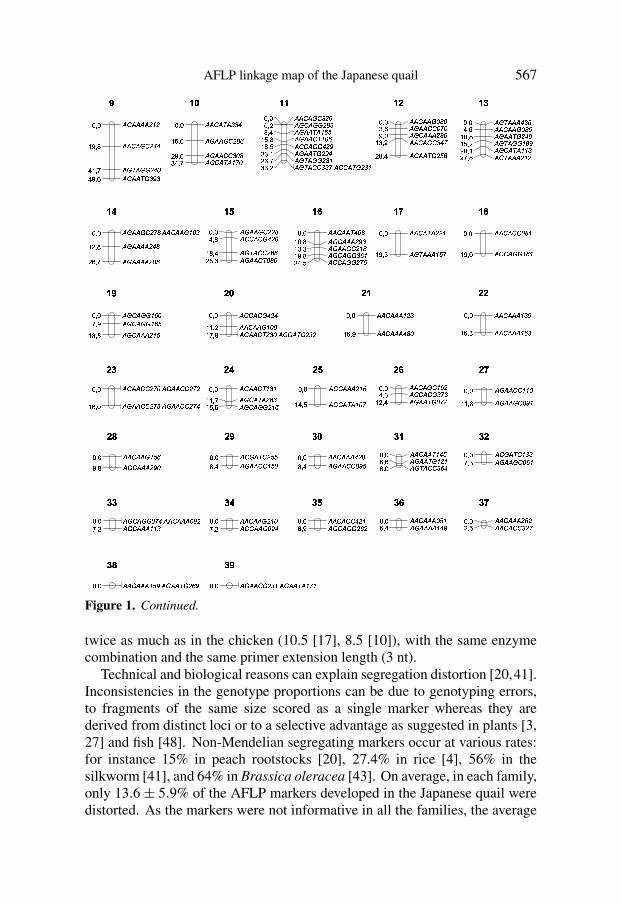
Figure 1. AFLP genetic linkage map of the Japanese quail. The map is composed of39 autosomal linkage groups plus the ZW sex chromosome linkage groups. Markersare indicated on the right, their position in centimorgans on the left. Within each group,markers are presented in their most likely order. A theoretical representation of the Wchromosome linkage group is given since the distance between the pseudo-autosomaland the W specific markers cannot be properly estimated (dashed line). Markers thatcould not be inserted (3 in the Z chromosome linkage group, 2 in group 7, 3 in group8, 1 in group 9 and 1 in group 26) and unlinked markers are not shown in the figure.The map was drawn with MapChart 2.0© software [44].
(continued on the next page)
AFLP linkage map of the Japanese quail 567
6�7�6�6�6�6 8�9 8:�; :
6�6�<�6�7�<�8�=�=> ?; @
6�7�A 6�7�7 8�="BC�> ; D6�7�6�6,A�7'E"F�EC"?; G
H
6�7�6�6�6�6 8�9 8:�; :
6�6�<�6�7�<�8�=�=> ?; @
6�7�A 6�7�7 8�="BC�> ; D6�7�6�6,A�7'E"F�EC"?; G
H
6�6�<�6,A 6 E�E�=:�; :
6�7�6�6�7�<�8"I"J> K�; :
6�7�6�6�< <�E�B�IL�?�; :6�7�<�6,A 6�9 M BN*C�; D
O P
6�6�<�6,A 6 E�E�=:�; :
6�7�6�6�7�<�8"I"J> K�; :
6�7�6�6�< <�E�B�IL�?�; :6�7�<�6,A 6�9 M BN*C�; D
O P
6�6�<�6�7�<�E�8"F:�; :6�7�<6�7�7'8�I�E:�; L6�7�6�6,A 6#9 J�Q@�; C6�7�6�6�<�A�9 B"J> K�; @6�< <�6�7�7'=�8"F> @�; K6�7�6�6,A�7'8"F�=L�N; >6�7�A 6�7�7 8�E�9L�G�; D6�7�A 6�< <�E�E�M'6�< <�6,A"7 8�E�9N�N; L
O�O
6�6�<�6�7�<�E�8"F:�; :6�7�<6�7�7'8�I�E:�; L6�7�6�6,A 6#9 J�Q@�; C6�7�6�6�<�A�9 B"J> K�; @6�< <�6�7�7'=�8"F> @�; K6�7�6�6,A�7'8"F�=L�N; >6�7�A 6�7�7 8�E�9L�G�; D6�7�A 6�< <�E�E�M'6�< <�6,A"7 8�E�9N�N; L
O�O
6�6�<�6�6�7�B�I�B:�; :6�7�6�6�< <�B"M BN; G6�7�<�6�6�6 8"I"J?�; :6�6�<�6�7�<�E�=�M> N; L6�7�6�6,A�7'8"Q"JL�@�; C
O�R
6�6�<�6�6�7�B�I�B:�; :6�7�6�6�< <�B"M BN; G6�7�<�6�6�6 8"I"J?�; :6�6�<�6�7�<�E�=�M> N; L6�7�6�6,A�7'8"Q"JL�@�; C
O�R
6�7,A 6�6�6 =�EJ:; :6�6�<�6�6�7�B�I�QC�; G6�7�6�6,A�7'8�=�F> :�; @6�7,A 6�7�7�9 I�F> K�; L6�7�<�6,A 6�9�9 EL�:�; >6�7,A 6�6�6 8�9 8L"D; @
O S
6�7,A 6�6�6 =�EJ:; :6�6�<�6�6�7�B�I�QC�; G6�7�6�6,A�7'8�=�F> :�; @6�7,A 6�7�7�9 I�F> K�; L6�7�<�6,A 6�9�9 EL�:�; >6�7,A 6�6�6 8�9 8L"D; @
O S
6�7�6�6�7�<�8�M I�6�6�<6�6�7�9*J E:�; :6�7�6�6�6�6 8�="I> L; @
6�7�6�6�6�6 8"B�IL�G; D
O�T
6�7�6�6�7�<�8�M I�6�6�<6�6�7�9*J E:�; :6�7�6�6�6�6 8�="I> L; @
6�7�6�6�6�6 8"B�IL�G; D
O�T
6�7�6�6�7�<�8�8"I:�; :6�< <�6�< 7 =�8"BC�; G6�7�A 6�< <�8J�I> @; C6�7�6�6�<�A�B�I�BL�K; N
O'U
6�7�6�6�7�<�8�8"I:�; :6�< <�6�< 7 =�8"BC�; G6�7�A 6�< <�8J�I> @; C6�7�6�6�<�A�B�I�BL�K; N
O'U
6�6�<�6�6�A ="B�I:�; :6�7�<�6�6�6 8"F�E> :; @6�7�6�6�7�<�8�9 I>*N"; N6�7�<�6�7�7'EJ�9> ?; @6�< <�6�7�7 8�M QL�C�; K
O V
6�6�<�6�6�A ="B�I:�; :6�7�<�6�6�6 8"F�E> :; @6�7�6�6�7�<�8�9 I>*N"; N6�7�<�6�7�7'EJ�9> ?; @6�< <�6�7�7 8�M QL�C�; K
O V
6�6�<�6,A 6 8�8�9:�; :
6�7,A 6�6�6�9 QM> ?�; N
O W
6�6�<�6,A 6 8�8�9:�; :
6�7,A 6�6�6�9 QM> ?�; N
O W
6�6�<�6�< <�B�I�9:; :
6�< <�6�7�7#9*J�9> ?�; :
O X
6�6�<�6�< <�B�I�9:; :
6�< <�6�7�7#9*J�9> ?�; :
O X
6�7�<6�7�7#9*J B:�; :6�7�<6�7�7#9*J QD; ?6�7�<6�6�6 8�9 Q> @; K
O H
6�7�<6�7�7#9*J B:�; :6�7�<6�7�7#9*J QD; ?6�7�<6�6�6 8�9 Q> @; K
O H
6�< <�6�< 7 =�8�=:�; :6�6�<�6�6�7#9 B�F>�> ; L6�7�6�6�<�A 8�E"B�6�< 7�6,A�<�8�E�8>*D"; @
R,P
6�< <�6�< 7 =�8�=:�; :6�6�<�6�6�7#9 B�F>�> ; L6�7�6�6�<�A 8�E"B�6�< 7�6,A�<�8�E�8>*D"; @
R,P
6�6�<�6�6�6�9 8�E:; :
6�6�<�6�6�6 ="I�B> G�; ?
R�O
6�6�<�6�6�6�9 8�E:; :
6�6�<�6�6�6 ="I�B> G�; ?
R�O
6�6�<�6�6�6�9 E"F:; :
6�6�<�6�6�6�9*J E> G�; N
R�R
6�6�<�6�6�6�9 E"F:; :
6�6�<�6�6�6�9*J E> G�; N
R�R
6�7�6�6�<�A�9 E�9:�; :6�7�<6�A 6 8J E>�> ; D6�7�<6�7�7'8�9 Q> K; K
R�T
6�7�6�6�<�A�9 E�9:�; :6�7�<6�A 6 8J E>�> ; D6�7�<6�7�7'8�9 Q> K; K
R�T
6�7�<�6�6�6 8�9*J:�; :
6�7�<�6,A 6�9 BM> C�; K
R�U
6�7�<�6�6�6 8�9*J:�; :
6�7�<�6,A 6�9 BM> C�; K
R�U
6�6�<�6�7�<�9 J 8:�; :6�< <�6�< 7 E�M*EC�; N6�7�6�6,A�7�BM�M> L�; C
R,V
6�6�<�6�7�<�9 J 8:�; :6�< <�6�< 7 E�M*EC�; N6�7�6�6,A�7�BM�M> L�; C
R,V
6�7�6�6�< <�8�M*B'6�7�6�6�< <�8�M*8:�; :
6�7�6�6�< <�8�M*Q'6�7�6�6�< <�8�M*=> G; :
R,S
6�7�6�6�< <�8�M*B'6�7�6�6�< <�8�M*8:�; :
6�7�6�6�< <�8�M*Q'6�7�6�6�< <�8�M*=> G; :
R,S
6�7�6�6�< <�9�9 B:; :6�7�6�6�7�<�B�F�9>�>�; @
R,W
6�7�6�6�< <�9�9 B:; :6�7�6�6�7�<�B�F�9>�>�; @
R,W
6�6�<�6�6�7#9 Q"J:�; :6�7�<6�6�6 8"F�B?�; @
R,X
6�6�<�6�6�7#9 Q"J:�; :6�7�<6�6�6 8"F�B?�; @
R,X
6�< 7�6�A�<�8"Q�Q:�; :6�7�6�6�< <�9 Q�B@�; C
R,H
6�< 7�6�A�<�8"Q�Q:�; :6�7�6�6�< <�9 Q�B@�; C
R,H
6�6�<�6�6�6 =�8�I:�; :6�7�6�6�< <�B�F�Q@�; C
S�P
6�6�<�6�6�6 =�8�I:�; :6�7�6�6�< <�B�F�Q@�; C
S�P
6�6�<�6�6,A�9 ="Q:�; :6�7�6�6,A�7#9 8�9G�; G6�7,A 6�< <�EJ =@�; :
S#O
6�6�<�6�6,A�9 ="Q:�; :6�7�6�6,A�7#9 8�9G�; G6�7,A 6�< <�EJ =@�; :
S#O
6�< 7�6,A"<�9 E�E:; :6�7�6�6�7�<�B"J�9D"; N
S�R
6�< 7�6,A"<�9 E�E:; :6�7�6�6�7�<�B"J�9D"; N
S�R
6�7�<6�7�7�BM =�6�6�<6�6�6'B�F�8:�; :6�7�<6�6�6�9�9 ED; L
S�S
6�7�<6�7�7�BM =�6�6�<6�6�6'B�F�8:�; :6�7�<6�6�6�9�9 ED; L
S�S
6�6�<�6�6�7'8�9 B:�; :6�< 7�6�6�7'B�F�=D; L
S�T
6�6�<�6�6�7'8�9 B:�; :6�< 7�6�6�7'B�F�=D; L
S�T
6�6�<�6�< <�=�8�9:�; :6�7�<�6�7�7'8J 8G�; ?
S,U
6�6�<�6�< <�=�8�9:�; :6�7�<�6�7�7'8J 8G�; ?
S,U
6�6�<�6�6�6�B�Q�9:�; :6�7�6�6�6�6�9 ="FG�; C
S�V
6�6�<�6�6�6�B�Q�9:�; :6�7�6�6�6�6�9 ="FG�; C
S�V
6�6�<�6�6�6 8J 8:; :6�6�<�6�< <�E�8�ML; K
S�W
6�6�<�6�6�6 8J 8:; :6�6�<�6�< <�E�8�ML; K
S�W
6�6�<�6�6�6#9 Q�F'6�7�6�6,A"7 8J�F:�; :
S�X
6�6�<�6�6�6#9 Q�F'6�7�6�6,A"7 8J�F:�; :
S�X
6�7�6�6�< <�8�E�9�6�7�6�6,A 6�9 M9:�; :
S�H
6�7�6�6�< <�8�E�9�6�7�6�6,A 6�9 M9:�; :
S�H
Figure 1. Continued.
twice as much as in the chicken (10.5 [17], 8.5 [10]), with the same enzymecombination and the same primer extension length (3 nt).
Technical and biological reasons can explain segregation distortion [20,41].Inconsistencies in the genotype proportions can be due to genotyping errors,to fragments of the same size scored as a single marker whereas they arederived from distinct loci or to a selective advantage as suggested in plants [3,27] and fish [48]. Non-Mendelian segregating markers occur at various rates:for instance 15% in peach rootstocks [20], 27.4% in rice [4], 56% in thesilkworm [41], and 64% in Brassica oleracea [43]. On average, in each family,only 13.6± 5.9% of the AFLP markers developed in the Japanese quail weredistorted. As the markers were not informative in all the families, the average
568 O. Roussot et al.
proportion of informative and Mendelian segregating markers, 47.0 ± 3.9%,better represents the usefulness of the data. This figure is in accordance withthe studies mentioned earlier.
Linkage groups were identified with a high threshold, related to the numberof markers to be tested. Increasing the twopoint threshold favours closelylinked markers and the closer markers are, the more complicated it becomesto resolve their order. Ordering the markers can present other difficulties. Theinformation content of AFLP markers is lower than that of other marker typesbecause of their biallelic dominant nature. Furthermore, informativeness in ourdesign is shared out between several families. Finally, our map contains onlyAFLP markers. In many studies, markers such as RFLP (restriction fragmentlength polymorphism), CAPS (cleaved amplified polymorphic sequence),microsatellites or genes are used together with AFLP markers. They canprovide clues about the chromosome assignment of linkage groups or linksto existing maps [2,31], but they can also give a framework to which AFLPmarkers are added [4]. Here, the markers are presented in their most likelyorder. Alternative orders can exist, whose likelihoods differ from that of theproposed order by a LOD value of less than 2 or 3. Additional markers willhelp improve the map robustness.
The map is relatively dense with an average interval size between adjacentmarkers of 7.6 cM. Although some linkage groups present higher markerdensities, no tight clustering of the markers was observed, as opposed to otherspecies [29,32] where it seems to be a consequence of the enzyme combinationsused. Within primer combinations, no clustering was observed either, except formarkers of the AACATA combination that map on the Z and W chromosomes.Herbergs et al. [10] also found a high number of Z linked markers workingin the chicken with the same enzyme combination. The number of markersof similar size on the W chromosome is also surprising. In both cases, thepresence of repetitive sequences on these chromosomes, as described in thechicken [26,35,39], can be suspected to account for this observation.
A large number of chromosomes makes it difficult to build an exhaustivemap, especially in the case of avian species and their microchromosomes.So, even if the number of linkage groups is actually similar to that ofchromosomes, some of them might likely correspond to different parts ofthe same chromosome, while some microchromosomes are not represented.However, AFLP markers can be expected to provide a better coverage ofmicrochromosomes than microsatellites. Indeed, as a result of the GC-richand gene-dense nature of microchromosomes [22,38] together with the type ofpolymorphism revealed by each technique, microsatellites are underrepresentedon these chromosomes [30], whereas the AFLP technique, using TaqI or otherenzymes, such as MspI or HinP1I [17] with GC-rich recognition sites, couldbetter target these zones.
AFLP linkage map of the Japanese quail 569
Our map spans a total length of 1516 cM. Considering that 60% of the mark-ers are mapped and ignoring the two ends of each linkage group, an estimationof the genetic length of the Japanese quail genome would be∼ 2530 cM. Thisis in agreement with recent cytological maps of lampbrush chromosomes inthe Japanese quail [33]. This is also comparable to the first estimates of thechicken genome genetic length [19]. However, a greater genetic length canbe expected for the quail since the more recent consensus linkage map in thechicken spans ∼ 3800 cM [8].
In order to allocate linkage groups to chromosomes and to have physicaldata to assess genome coverage, an efficient strategy is to map a set of genesof known location in the chicken on the Japanese quail AFLP map. This willallow to take advantage of the power of comparative genetic and cytogeneticapproaches between these species. AFLP markers have been shown to mapto the same loci in different populations, for instance in barley [47], oat [14],maize [46], chicken [18] or trout [32]. They can be expected to behave in thesame manner in the quail and therefore some of the markers developed in thisstudy might be useful in other quail lines or populations. On the contrary, usingmarkers of common size and common primer combination origin in quail andchicken for comparative mapping purposes would be hazardous.
This Japanese quail AFLP map will be enriched with genes. Recentlydeveloped microsatellites in this species are also available [15,16,21]. Thismap already provides a basis for identifying and studying regions, and eventu-ally genes, involved in the genetic control of complex traits (QTL).
ACKNOWLEDGEMENTS
This work was supported in part by Aventis Animal Nutrition and theGénopôle Toulouse Midi-Pyrénées. AFLP is a trademark filed by KeygeneNV, The Netherlands.
REFERENCES
[1] Agrama H.A., Houssin S.F., Tarek M.A., Cloning of AFLP markers linked toresistance to Peronosclerospora sorghi in maize, Mol. Genet. Genomics 267(2002) 814–819.
[2] Alonso-Blanco C., Peeters A.J., Koornneef M., Lister C., Dean C., Van denBosch N., Pot J., Kuiper M.T., Development of an AFLP based linkage map ofLer, Col and Cvi Arabidopsis thaliana ecotypes and construction of a Ler/Cvirecombinant inbred line population, Plant J. 14 (1998) 259–271.
[3] Cervera M.T., Gusmao J., Steenackers M., Peleman J., Storme V., Van den BroeckA., Van Montagu M., Boerjan W., Identification of AFLP molecular markers forresistance against Melampsora larici-populina in Populus, Theor. Appl. Genet.93 (1996) 733–737.
570 O. Roussot et al.
[4] Cho Y.G., Mc Couch S.R., Kuiper M., Kang M.R., Pot J., Groenen J.T.M., EunM.Y., Integrated maps of AFLP, SSLP and RFLP markers using a recombinantinbred population of rice (Oryza sativa L.), Theor. Appl. Genet. 97 (1998) 370–380.
[5] Faure J.M., Mills A.D., Improving the adaptability of animals by selection, in:T. Grandin (Ed.), Genetics and the Behavior of Domestic Animals, AcademicPress, 1998, pp. 235–264.
[6] Gerken M., Petersen J., Bidirectional selection for dustbathing activity in Japan-ese quail (Coturnix coturnix japonica), Brit. Poultry Sci. 28 (1987) 23–37.
[7] Green P., Falls K., Crooks S., Documentation for CRI-MAP, version 2.4, Wash-ington University School of Medicine, St Louis, 1990.
[8] Groenen M.A., Cheng H.H., Bumstead N., Benkel B.F., Briles W.E., Burke T.,Burt D.W., Crittenden L.B., Dodgson J., Hillel J., Lamont S., de Leon A.P., SollerM., Takahashi H., Vignal A., A consensus linkage map of the chicken genome,Genome Res. 10 (2000) 137–147.
[9] Guerra M.M., Bernardo F., McLauchlin J., Amplified fragment length poly-morphism (AFLP) analysis of Listeria monocytogenes, Syst. Appl. Microbiol.25 (2002) 456–461.
[10] Herbergs J., Siwek M., Crooijmans R.P., Van der Poel J.J., Groenen M.A.,Multicolour fluorescent detection and mapping of AFLP markers in chicken(Gallus domesticus), Anim. Genet. 30 (1999) 274–285.
[11] Inoue-Murayama M., Kayang B.B., Kimura K., Ide H., Nomura A., TakahashiH., Nagamine Y., Takeda T., Hanada H., Tatsuda K., Tsudzuki M., MatsudaY., Mizutani M., Murayama Y., Ito S., Chicken microsatellite primers are notefficient markers for Japanese quail, Anim. Genet. 32 (2001) 7–11.
[12] Ito S., Kimura M., Isogai I., A sex difference in recombination values betweenextended brown and phosphoglucose isomerase loci in Japanese quail, Jpn J.Zootech. Sci. 59 (1988) 801–805.
[13] Ito S., Kimura M., Isogai I., Linkage between panda plumage and albumin lociin Japanese quail, Jpn J. Zootech. Sci. 59 (1988) 822–824.
[14] Jin H., Domier L.L., Kolb F.L., Brown C.M., Identification of quantitative traitloci for tolerance to barley yellow dwarf virus in oat, Phytopathology 88 (1998)410–415.
[15] Kayang B.B., Inoue-Murayama M., Nomura A., Kimura K., Takahashi H.,Mizutani M., Ito S., Fifty microsatellite markers for Japanese quail, J. Hered. 91(2000) 502–505.
[16] Kayang B.B., Inoue-Murayama M., Hoshi T., Matsuo K., Takahashi H.,Minezawa M., Mizutani M., Ito S., Microsatellite loci in Japanese quail andcross-species amplification in chicken and guinea fowl, Genet. Sel. Evol. 34(2002) 233–253.
[17] Knorr C., Cheng H.H., Dodgson J.B., Application of AFLP markers to genomemapping in poultry, Anim. Genet. 30 (1999) 28–35.
[18] Knorr C., Cheng H.H., Dodgson J.B., DNA cloning and sequence analysis ofchicken AFLP, Anim. Genet. 32 (2001) 156–159.
[19] Levin I., Santangelo L., Cheng H., Crittenden L.B., Dodgson J.B., An autosomalgenetic linkage map of the chicken, J. Hered. 85 (1994) 79–85.
AFLP linkage map of the Japanese quail 571
[20] Lu Z.X., Sosinski B., Reighard G.L., Baird W.V., Abbott A.G., Constructionof a genetic linkage map and identification of AFLP markers for resistance toroot-knot nematodes in peach rootstocks, Genome 41 (1998) 199–207.
[21] Mannen H., Murata K., Mizutani M., Tsuji S., Development of microsatellitemarkers from a heart cDNA library in Japanese quail, in: ISAG (Ed.), XXVIIIInternational Conference on Animal Genetics, Göttingen, Proceedings 2002,Blackwell Publishing, Part5, D082.
[22] McQueen H.A., Siriaco G., Bird A.P., Chicken microchromosomes are hyper-acetylated, early replicating, and gene rich, Genome Res. 8 (1998) 621–630.
[23] Mills A.D., Faure J.M., Divergent selection for duration of tonic immobilityand social reinstatement behavior in Japanese quail (Coturnix coturnix japonica)chicks, J. Comp. Psychol. 105 (1991) 25–38.
[24] Mills A.D., Crawford L.L., Domjan M., Faure J.M., The behavior of the Japaneseor domestic quail Coturnix japonica, Neurosci. Biobehav. Rev. 21 (1997) 261–281.
[25] Minvielle F., Ito S., Inoue-Murayama M., Mizutani M., Wakasugi N., Geneticanalyses of plumage color mutations on the Z chromosome of Japanese quail,J. Hered. 91 (2000) 499–501.
[26] Mizuno S., Mac Gregor H., The ZW lampbrush chromosome of birds: a uniqueopportunity to look at the molecular cytogenetics of sex chromosomes, Cyto-genet. Cell Genet. 80 (1998) 149–157.
[27] Nandi S., Subudhi P.K., Senadhira D., Manigbas N.L., Sen-Mandi S., Huang N.,Mapping QTLs for submergence tolerance in rice by AFLP analysis and selectivegenotyping, Mol. Gen. Genet. 255 (1997) 1–8.
[28] Pang S.W., Ritland C., Carlson J.E., Cheng K.M., Japanese quail microsatelliteloci amplified with chicken-specific primers, Anim. Genet. 30 (1999) 195–199.
[29] Powell W., Thomas W.T.B., Baird E., Lawrence P., Booth A., Harrower B.,McNicol J.W., Waugh R., Analysis of quantitative traits in barley by the use ofamplified fragment length polymorphisms, Heredity 79 (1997) 48–59.
[30] Primmer C.R., Raudsepp T., Chowdhary B.P., Moller A.P., Ellegren H., Lowfrequency of microsatellites in the avian genome, Genome Res. 7 (1997) 471–482.
[31] Quarrie S.A., Laurie D.A., Zhu J., Lebreton C., Semikhodskii A., Steed A.,Witsenboer H., Calestani C., QTL analysis to study the association between leafsize and abscisic acid accumulation in droughted rice leaves and comparisonsacross cereals, Plant Mol. Biol. 35 (1997) 155–165.
[32] Robison B.D., Wheeler P.A., Sundin K., Sikka P., Thorgaard G.H., Compositeinterval mapping reveals a major locus influencing embryonic development ratein rainbow trout (Oncorhynchus mykiss), J. Hered. 92 (2001) 16–22.
[33] Rodionov A.V., Chechik M.S., Lampbrush chromosomes in the Japanese quailCoturnix coturnix japonica: cytological maps of macro chromosomes and mei-otic crossover frequency in females, Genetika 38 (2002) 1246–1251.
[34] Satterlee D.G., Johnson W.A., Selection of Japanese quail for contrasting bloodcorticosterone response to immobilization, Poult. Sci. 67 (1988) 25–32.
[35] Schmid M., Nanda I., Guttenbach M., Steinlein C., Hoehn M., Schartl M., HaafT., Weigend S., Fries R., Buerstedde J.M., Wimmers K., Burt D.W., Smith J.,
572 O. Roussot et al.
A’Hara S., Law A., Griffin D.K., Bumstead N., Kaufman J., Thomson P.A.,Burke T., Groenen M.A., Crooijmans R.P., Vignal A., Fillon V., Morisson M.,Pitel F., Tixier-Boichard M., Ladjali-Mohammedi K., Hillel J., Maki-Tanila A.,Cheng H.H., Delany M.E., Burnside J., Mizuno S., First report on chicken genesand chromosomes 2000, Cytogenet. Cell Genet. 90 (2000) 169–218.
[36] Shibata T., Abe T., Linkage between the loci for serum albumin and vitamin Dbinding protein (GC) in the Japanese quail, Anim. Genet. 27 (1996) 195–197.
[37] Shibusawa M., Minai S., Nishida-Umehara C., Suzuki T., Mano T., YamadaK., Namikawa T., Matsuda Y., A comparative cytogenetic study of chromosomehomology between chicken and Japanese quail, Cytogenet. Cell Genet. 95 (2001)103–109.
[38] Smith J., Bruley C.K., Paton I.R., Dunn I., Jones C.T., Windsor D., Morrice D.R.,Law A.S., Masabanda J., Sazanov A., Waddington D., Fries R., Burt D.W., Dif-ferences in gene density on chicken macrochromosomes and microchromosomes,Anim. Genet. 31 (2000) 96–103.
[39] Solovei I., Ogawa A., Naito M., Mizuno S., Mac Gregor H., Specific chro-momeres on the chicken W lampbrush chromosome contain specific repetitiveDNA sequence families, Chromosome Res. 6 (1998) 323–327.
[40] Stock A.D., Bunch T.D., The evolutionary implications of chromosome bandingpattern homologies in the bird order Galliformes, Cytogenet. Cell Genet. 34(1982) 136–148.
[41] Tan Y.D., Wan C., Zhu Y., Lu C., Xiang Z., Deng H.W., An amplified fragmentlength polymorphism map of the silkworm, Genetics 157 (2001) 1277–1284.
[42] Van Haeringen W.A., Den Bieman M.G., Lankhorst A.E., Van Lith H.A., VanZutphen L.F., Application of AFLP markers for QTL mapping in the rabbit,Genome 45 (2002) 914–921.
[43] Voorrips R.E., Jongerius M.C., Kanne H.J., Mapping of two genes for resistanceto clubroot (Plasmodiophora brassicae) in a population of doubled haploid linesof Brassica oleracea by means of RFLP and AFLP markers, Theor. Appl. Genet.94 (1997) 75–82.
[44] Voorrips R.E., MapChart version 2.0: Windows software for the graphicalpresentation of linkage maps and QTLs, Plant Research International, Wagenin-gen, The Netherlands, 2001.
[45] Vos P., Hogers R., Bleeker M., Reijans M., Van de Lee T., Hornes M., FrijtersA., Pot J., Peleman J., Kuiper M., Zabeau M., AFLP: a new technique for DNAfingerprinting, Nucleic Acids Res. 23 (1995) 4407–4414.
[46] Vuylsteke M., Mank R., Antonise R., Bastiaans E., Senior M.L., Stuber C.W.,Melchinger A.E., Lübberstedt T., Xia X.C., Stan P., Zabeau M., Kuiper M., Twohigh-density AFLP(R) linkage maps of Zea mays L.: analysis of distribution ofAFLP markers, Theor. Appl. Genet. 99 (1999) 921–935.
[47] Waugh R., Bonar N., Baird E., Thomas B., Graner A., Hayes P., Powell W.,Homology of AFLP products in three mapping populations of barley, Mol. Gen.Genet. 255 (1997) 311–321.
[48] Young W.P., Wheeler P.A., Coryell V.H., Keim P., Thorgaard G.H., A detailedlinkage map of rainbow trout produced using doubled haploids, Genetics 148(1998) 839–850.