Embed Size (px)
Citation preview
International Journal of Multiphase Flow 40 (2012) 1–18
Contents lists available at SciVerse ScienceDirect
International Journal of Multiphase Flow
journal homepage: www.elsevier .com/ locate / i jmulflow
Review
Analyzing preferential concentration and clustering of inertial particlesin turbulence
Romain Monchaux a, Mickael Bourgoin b, Alain Cartellier b,⇑a Unité de mécanique, Ecole Nationale Supérieure de Techniques Avancées, ParisTech, Chemin de la Hunière, 91761 Palaiseau Cedex, Franceb LEGI – Laboratoire des Ecoulements Géophysiques et Industriels, CNRS/UJF/G-INP UMR5519, BP53, 38041 Grenoble, France
a r t i c l e i n f o a b s t r a c t
Article history:Received 9 November 2011Received in revised form 5 December 2011Accepted 6 December 2011Available online 13 December 2011
Keywords:Preferential concentrationTurbulenceInertial particles
0301-9322/$ - see front matter � 2011 Elsevier Ltd. Adoi:10.1016/j.ijmultiphaseflow.2011.12.001
⇑ Corresponding author. Tel.: +33 (0)476825048; faE-mail address: [email protected]
Particle laden flows are of relevant interest in many industrial and natural systems. When the carrier flowis turbulent, a striking feature is the tendency of particles denser than the fluid to inhomogeneouslydistribute in space, forming clusters and depleted regions. This phenomenon, known as ‘‘preferentialconcentration’’, has now been extensively investigated since the 1960s. The commonly invoked turboph-oretic effect, responsible for the centrifugation of heavy particles outside the turbulent vortices, hasrecently got more complex by other additional mechanisms which have been shown to potentially playan important role in segregating the particles (for instance particles with moderate Stokes number havebeen shown to preferentially stick to low-acceleration points of the carrier flow). As a matter of fact acomplete frame for accurately describing and modeling the particle-flow interaction is not yet availableand basic questions, as the existence or not of a typical cluster size or of a typical cluster life-time-scale,still remain to be answered. This requires further quantitative investigations of preferential concentration(both from experiments and numerics) as well as dedicated mathematical tools in order to analyze thedispersed phase, its structuring properties and its dynamics (from individual particle level up to clusterslevel). This review focuses on the description of the techniques available nowadays to investigate thepreferential concentration of inertial particles in turbulent flows. We first briefly recall the historical con-text of the problem followed by a description of usual experimental and numerical configurations clas-sically employed to investigate this phenomenon. Then we present the main mathematical analysistechniques which have been developed and implemented up to now to diagnose and characterize theclustering properties of dispersed particles. We show the advantages, drawbacks and complementarityof the different existing approaches. To finish, we present physical mechanisms which have already beenidentified as important and discuss the expected breakthrough from future investigations.
� 2011 Elsevier Ltd. All rights reserved.
Contents
1. Introduction . . . . . . . . . . . . . . . . . . . . . . . . . . . . . . . . . . . . . . . . . . . . . . . . . . . . . . . . . . . . . . . . . . . . . . . . . . . . . . . . . . . . . . . . . . . . . . . . . . . . . . . . . . . 2
1.1. Origins and first results regarding preferential concentration . . . . . . . . . . . . . . . . . . . . . . . . . . . . . . . . . . . . . . . . . . . . . . . . . . . . . . . . . . . . . . 22. Experimental and numerical configuration . . . . . . . . . . . . . . . . . . . . . . . . . . . . . . . . . . . . . . . . . . . . . . . . . . . . . . . . . . . . . . . . . . . . . . . . . . . . . . . . . . 3
2.1. Experimental facilities. . . . . . . . . . . . . . . . . . . . . . . . . . . . . . . . . . . . . . . . . . . . . . . . . . . . . . . . . . . . . . . . . . . . . . . . . . . . . . . . . . . . . . . . . . . . . . 32.1.1. Wind-tunnel experiments . . . . . . . . . . . . . . . . . . . . . . . . . . . . . . . . . . . . . . . . . . . . . . . . . . . . . . . . . . . . . . . . . . . . . . . . . . . . . . . . . . . 42.1.2. Closed flows . . . . . . . . . . . . . . . . . . . . . . . . . . . . . . . . . . . . . . . . . . . . . . . . . . . . . . . . . . . . . . . . . . . . . . . . . . . . . . . . . . . . . . . . . . . . . . 4
2.2. Numerical approaches. . . . . . . . . . . . . . . . . . . . . . . . . . . . . . . . . . . . . . . . . . . . . . . . . . . . . . . . . . . . . . . . . . . . . . . . . . . . . . . . . . . . . . . . . . . . . . 4
2.2.1. Direct numerical simulations and large eddies simulations . . . . . . . . . . . . . . . . . . . . . . . . . . . . . . . . . . . . . . . . . . . . . . . . . . . . . . . . 42.2.2. Random flows . . . . . . . . . . . . . . . . . . . . . . . . . . . . . . . . . . . . . . . . . . . . . . . . . . . . . . . . . . . . . . . . . . . . . . . . . . . . . . . . . . . . . . . . . . . . . 52.2.3. Synthetic flows . . . . . . . . . . . . . . . . . . . . . . . . . . . . . . . . . . . . . . . . . . . . . . . . . . . . . . . . . . . . . . . . . . . . . . . . . . . . . . . . . . . . . . . . . . . . 52.3. Seeding techniques and particle characterization . . . . . . . . . . . . . . . . . . . . . . . . . . . . . . . . . . . . . . . . . . . . . . . . . . . . . . . . . . . . . . . . . . . . . . . . 5
2.3.1. Particle seeding. . . . . . . . . . . . . . . . . . . . . . . . . . . . . . . . . . . . . . . . . . . . . . . . . . . . . . . . . . . . . . . . . . . . . . . . . . . . . . . . . . . . . . . . . . . . 52.3.2. Particle characterization. . . . . . . . . . . . . . . . . . . . . . . . . . . . . . . . . . . . . . . . . . . . . . . . . . . . . . . . . . . . . . . . . . . . . . . . . . . . . . . . . . . . . 62.3.3. Stokes number . . . . . . . . . . . . . . . . . . . . . . . . . . . . . . . . . . . . . . . . . . . . . . . . . . . . . . . . . . . . . . . . . . . . . . . . . . . . . . . . . . . . . . . . . . . . 6ll rights reserved.
x: +33 (0)476825271.r (A. Cartellier).
2 R. Monchaux et al. / International Journal of Multiphase Flow 40 (2012) 1–18
3. Diagnosis for preferential concentration and clusters characterization . . . . . . . . . . . . . . . . . . . . . . . . . . . . . . . . . . . . . . . . . . . . . . . . . . . . . . . . . . . . 6
3.1. Quantifying preferential concentration/clustering . . . . . . . . . . . . . . . . . . . . . . . . . . . . . . . . . . . . . . . . . . . . . . . . . . . . . . . . . . . . . . . . . . . . . . . 73.1.1. A wide range of methods . . . . . . . . . . . . . . . . . . . . . . . . . . . . . . . . . . . . . . . . . . . . . . . . . . . . . . . . . . . . . . . . . . . . . . . . . . . . . . . . . . . . 73.1.2. Associated results . . . . . . . . . . . . . . . . . . . . . . . . . . . . . . . . . . . . . . . . . . . . . . . . . . . . . . . . . . . . . . . . . . . . . . . . . . . . . . . . . . . . . . . . . 10
3.2. Identifying and characterizing clusters/voids . . . . . . . . . . . . . . . . . . . . . . . . . . . . . . . . . . . . . . . . . . . . . . . . . . . . . . . . . . . . . . . . . . . . . . . . . . 10
3.2.1. Strategies. . . . . . . . . . . . . . . . . . . . . . . . . . . . . . . . . . . . . . . . . . . . . . . . . . . . . . . . . . . . . . . . . . . . . . . . . . . . . . . . . . . . . . . . . . . . . . . . 103.2.2. Associated results . . . . . . . . . . . . . . . . . . . . . . . . . . . . . . . . . . . . . . . . . . . . . . . . . . . . . . . . . . . . . . . . . . . . . . . . . . . . . . . . . . . . . . . . . 104. Physical mechanisms . . . . . . . . . . . . . . . . . . . . . . . . . . . . . . . . . . . . . . . . . . . . . . . . . . . . . . . . . . . . . . . . . . . . . . . . . . . . . . . . . . . . . . . . . . . . . . . . . . . 12
4.1. Turbulence-particle interactions . . . . . . . . . . . . . . . . . . . . . . . . . . . . . . . . . . . . . . . . . . . . . . . . . . . . . . . . . . . . . . . . . . . . . . . . . . . . . . . . . . . . 124.1.1. Response to flow structures. . . . . . . . . . . . . . . . . . . . . . . . . . . . . . . . . . . . . . . . . . . . . . . . . . . . . . . . . . . . . . . . . . . . . . . . . . . . . . . . . 124.1.2. Collisions and coalescence . . . . . . . . . . . . . . . . . . . . . . . . . . . . . . . . . . . . . . . . . . . . . . . . . . . . . . . . . . . . . . . . . . . . . . . . . . . . . . . . . . 134.1.3. Sweep-stick mechanism. . . . . . . . . . . . . . . . . . . . . . . . . . . . . . . . . . . . . . . . . . . . . . . . . . . . . . . . . . . . . . . . . . . . . . . . . . . . . . . . . . . . 13
4.2. Settling velocity. . . . . . . . . . . . . . . . . . . . . . . . . . . . . . . . . . . . . . . . . . . . . . . . . . . . . . . . . . . . . . . . . . . . . . . . . . . . . . . . . . . . . . . . . . . . . . . . . . 14
5. Expected future breakthrough. . . . . . . . . . . . . . . . . . . . . . . . . . . . . . . . . . . . . . . . . . . . . . . . . . . . . . . . . . . . . . . . . . . . . . . . . . . . . . . . . . . . . . . . . . . . 155.1. Experimental and numerical challenges . . . . . . . . . . . . . . . . . . . . . . . . . . . . . . . . . . . . . . . . . . . . . . . . . . . . . . . . . . . . . . . . . . . . . . . . . . . . . . 155.2. Physical insight . . . . . . . . . . . . . . . . . . . . . . . . . . . . . . . . . . . . . . . . . . . . . . . . . . . . . . . . . . . . . . . . . . . . . . . . . . . . . . . . . . . . . . . . . . . . . . . . . . 15
References . . . . . . . . . . . . . . . . . . . . . . . . . . . . . . . . . . . . . . . . . . . . . . . . . . . . . . . . . . . . . . . . . . . . . . . . . . . . . . . . . . . . . . . . . . . . . . . . . . . . . . . . . . . 161. Introduction
Turbulent flows laden with particles occur very often in naturaland industrial situations: dispersion of pollutants in the atmo-sphere, sedimentation in rivers, rain formation in warm clouds,plankton dispersion in the ocean, optimization of chemical reactorsand of various industrial processes including combustion of liquidfuel. . . In these examples, particles consist of dust/sand in air orwater, liquid droplets or solid particles (such as coal, catalyst. . .)in gas and are then denser than the carrying fluid. Thus, theirdynamics is not strictly following the fluid velocity field but is in-stead lagging behind it. This is a specific case of inertial particlesimmersed in turbulent flows that also refer to situations when par-ticles are less dense than the fluid or when particles size is muchgreater than the smallest turbulent scale, namely the Kolmogorovlength. The common occurrence of this class of flows deservesthorough fundamental studies since no proper or practical model-ing is yet available. So far, the equations governing inertial particledynamics have been obtained under strong assumptions in verylimited situations (Gatignol, 1983; Maxey and Riley, 1983) andmost of the recent numerical works use even simpler models.
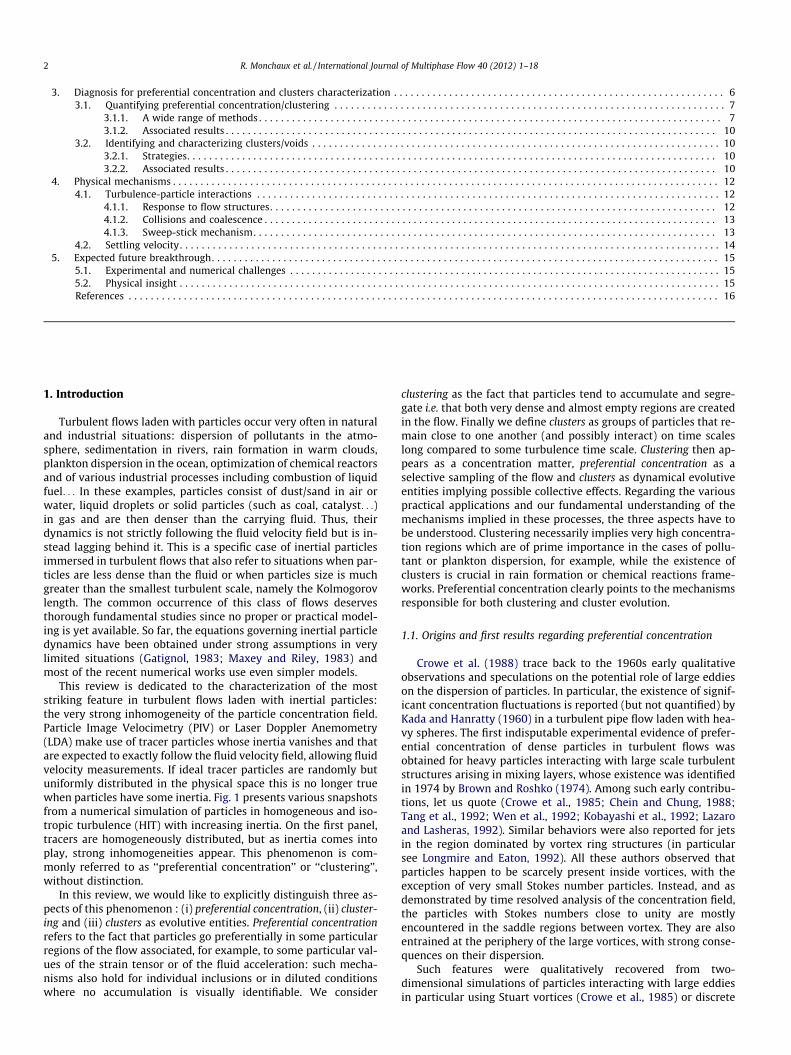
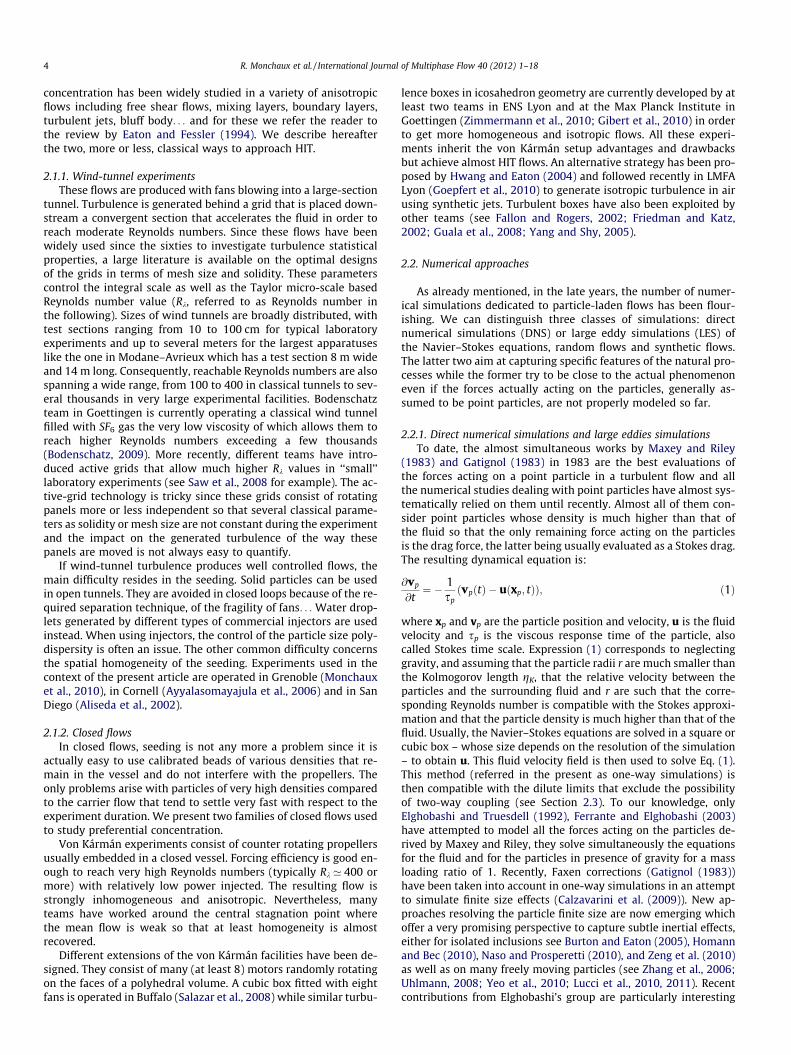
This review is dedicated to the characterization of the moststriking feature in turbulent flows laden with inertial particles:the very strong inhomogeneity of the particle concentration field.Particle Image Velocimetry (PIV) or Laser Doppler Anemometry(LDA) make use of tracer particles whose inertia vanishes and thatare expected to exactly follow the fluid velocity field, allowing fluidvelocity measurements. If ideal tracer particles are randomly butuniformly distributed in the physical space this is no longer truewhen particles have some inertia. Fig. 1 presents various snapshotsfrom a numerical simulation of particles in homogeneous and iso-tropic turbulence (HIT) with increasing inertia. On the first panel,tracers are homogeneously distributed, but as inertia comes intoplay, strong inhomogeneities appear. This phenomenon is com-monly referred to as ‘‘preferential concentration’’ or ‘‘clustering’’,without distinction.
In this review, we would like to explicitly distinguish three as-pects of this phenomenon : (i) preferential concentration, (ii) cluster-ing and (iii) clusters as evolutive entities. Preferential concentrationrefers to the fact that particles go preferentially in some particularregions of the flow associated, for example, to some particular val-ues of the strain tensor or of the fluid acceleration: such mecha-nisms also hold for individual inclusions or in diluted conditionswhere no accumulation is visually identifiable. We consider
clustering as the fact that particles tend to accumulate and segre-gate i.e. that both very dense and almost empty regions are createdin the flow. Finally we define clusters as groups of particles that re-main close to one another (and possibly interact) on time scaleslong compared to some turbulence time scale. Clustering then ap-pears as a concentration matter, preferential concentration as aselective sampling of the flow and clusters as dynamical evolutiveentities implying possible collective effects. Regarding the variouspractical applications and our fundamental understanding of themechanisms implied in these processes, the three aspects have tobe understood. Clustering necessarily implies very high concentra-tion regions which are of prime importance in the cases of pollu-tant or plankton dispersion, for example, while the existence ofclusters is crucial in rain formation or chemical reactions frame-works. Preferential concentration clearly points to the mechanismsresponsible for both clustering and cluster evolution.
1.1. Origins and first results regarding preferential concentration
Crowe et al. (1988) trace back to the 1960s early qualitativeobservations and speculations on the potential role of large eddieson the dispersion of particles. In particular, the existence of signif-icant concentration fluctuations is reported (but not quantified) byKada and Hanratty (1960) in a turbulent pipe flow laden with hea-vy spheres. The first indisputable experimental evidence of prefer-ential concentration of dense particles in turbulent flows wasobtained for heavy particles interacting with large scale turbulentstructures arising in mixing layers, whose existence was identifiedin 1974 by Brown and Roshko (1974). Among such early contribu-tions, let us quote (Crowe et al., 1985; Chein and Chung, 1988;Tang et al., 1992; Wen et al., 1992; Kobayashi et al., 1992; Lazaroand Lasheras, 1992). Similar behaviors were also reported for jetsin the region dominated by vortex ring structures (in particularsee Longmire and Eaton, 1992). All these authors observed thatparticles happen to be scarcely present inside vortices, with theexception of very small Stokes number particles. Instead, and asdemonstrated by time resolved analysis of the concentration field,the particles with Stokes numbers close to unity are mostlyencountered in the saddle regions between vortex. They are alsoentrained at the periphery of the large vortices, with strong conse-quences on their dispersion.
Such features were qualitatively recovered from two-dimensional simulations of particles interacting with large eddiesin particular using Stuart vortices (Crowe et al., 1985) or discrete
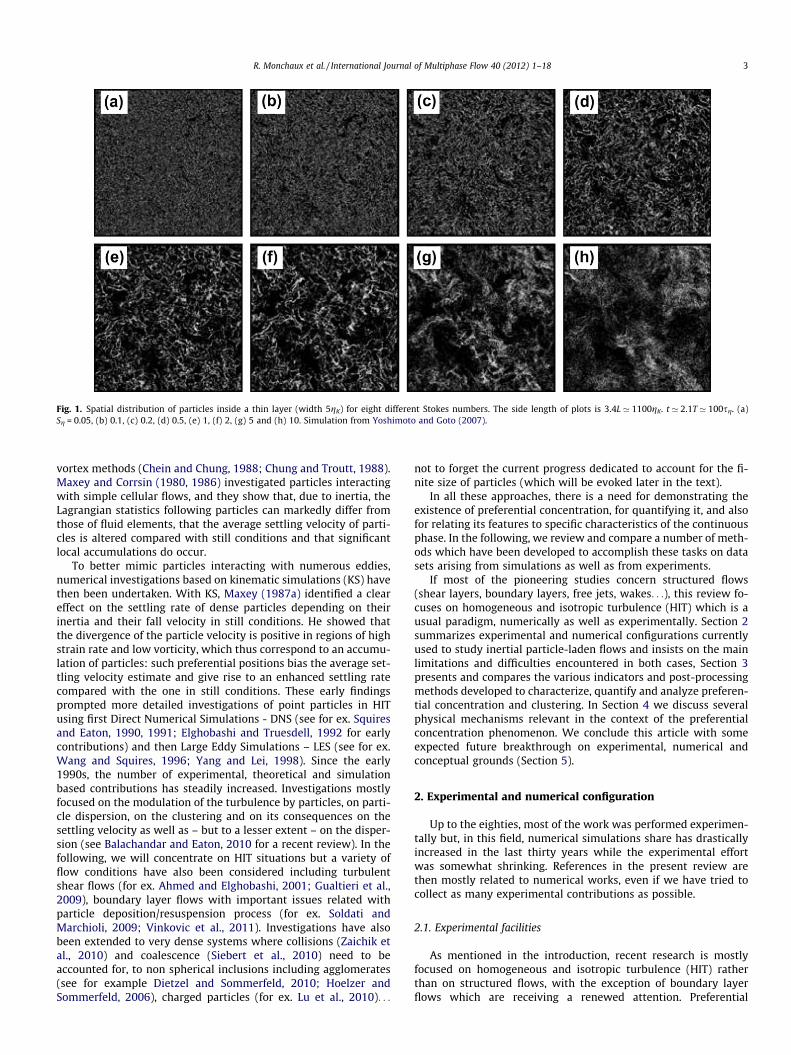
Fig. 1. Spatial distribution of particles inside a thin layer (width 5gK) for eight different Stokes numbers. The side length of plots is 3.4L ’ 1100gK. t ’ 2.1T ’ 100sg. (a)Sg = 0.05, (b) 0.1, (c) 0.2, (d) 0.5, (e) 1, (f) 2, (g) 5 and (h) 10. Simulation from Yoshimoto and Goto (2007).
R. Monchaux et al. / International Journal of Multiphase Flow 40 (2012) 1–18 3
vortex methods (Chein and Chung, 1988; Chung and Troutt, 1988).Maxey and Corrsin (1980, 1986) investigated particles interactingwith simple cellular flows, and they show that, due to inertia, theLagrangian statistics following particles can markedly differ fromthose of fluid elements, that the average settling velocity of parti-cles is altered compared with still conditions and that significantlocal accumulations do occur.
To better mimic particles interacting with numerous eddies,numerical investigations based on kinematic simulations (KS) havethen been undertaken. With KS, Maxey (1987a) identified a cleareffect on the settling rate of dense particles depending on theirinertia and their fall velocity in still conditions. He showed thatthe divergence of the particle velocity is positive in regions of highstrain rate and low vorticity, which thus correspond to an accumu-lation of particles: such preferential positions bias the average set-tling velocity estimate and give rise to an enhanced settling ratecompared with the one in still conditions. These early findingsprompted more detailed investigations of point particles in HITusing first Direct Numerical Simulations - DNS (see for ex. Squiresand Eaton, 1990, 1991; Elghobashi and Truesdell, 1992 for earlycontributions) and then Large Eddy Simulations – LES (see for ex.Wang and Squires, 1996; Yang and Lei, 1998). Since the early1990s, the number of experimental, theoretical and simulationbased contributions has steadily increased. Investigations mostlyfocused on the modulation of the turbulence by particles, on parti-cle dispersion, on the clustering and on its consequences on thesettling velocity as well as – but to a lesser extent – on the disper-sion (see Balachandar and Eaton, 2010 for a recent review). In thefollowing, we will concentrate on HIT situations but a variety offlow conditions have also been considered including turbulentshear flows (for ex. Ahmed and Elghobashi, 2001; Gualtieri et al.,2009), boundary layer flows with important issues related withparticle deposition/resuspension process (for ex. Soldati andMarchioli, 2009; Vinkovic et al., 2011). Investigations have alsobeen extended to very dense systems where collisions (Zaichik etal., 2010) and coalescence (Siebert et al., 2010) need to beaccounted for, to non spherical inclusions including agglomerates(see for example Dietzel and Sommerfeld, 2010; Hoelzer andSommerfeld, 2006), charged particles (for ex. Lu et al., 2010). . .
not to forget the current progress dedicated to account for the fi-nite size of particles (which will be evoked later in the text).
In all these approaches, there is a need for demonstrating theexistence of preferential concentration, for quantifying it, and alsofor relating its features to specific characteristics of the continuousphase. In the following, we review and compare a number of meth-ods which have been developed to accomplish these tasks on datasets arising from simulations as well as from experiments.
If most of the pioneering studies concern structured flows(shear layers, boundary layers, free jets, wakes. . .), this review fo-cuses on homogeneous and isotropic turbulence (HIT) which is ausual paradigm, numerically as well as experimentally. Section 2summarizes experimental and numerical configurations currentlyused to study inertial particle-laden flows and insists on the mainlimitations and difficulties encountered in both cases, Section 3presents and compares the various indicators and post-processingmethods developed to characterize, quantify and analyze preferen-tial concentration and clustering. In Section 4 we discuss severalphysical mechanisms relevant in the context of the preferentialconcentration phenomenon. We conclude this article with someexpected future breakthrough on experimental, numerical andconceptual grounds (Section 5).
2. Experimental and numerical configuration
Up to the eighties, most of the work was performed experimen-tally but, in this field, numerical simulations share has drasticallyincreased in the last thirty years while the experimental effortwas somewhat shrinking. References in the present review arethen mostly related to numerical works, even if we have tried tocollect as many experimental contributions as possible.
2.1. Experimental facilities
As mentioned in the introduction, recent research is mostlyfocused on homogeneous and isotropic turbulence (HIT) ratherthan on structured flows, with the exception of boundary layerflows which are receiving a renewed attention. Preferential
4 R. Monchaux et al. / International Journal of Multiphase Flow 40 (2012) 1–18
concentration has been widely studied in a variety of anisotropicflows including free shear flows, mixing layers, boundary layers,turbulent jets, bluff body. . . and for these we refer the reader tothe review by Eaton and Fessler (1994). We describe hereafterthe two, more or less, classical ways to approach HIT.
2.1.1. Wind-tunnel experimentsThese flows are produced with fans blowing into a large-section
tunnel. Turbulence is generated behind a grid that is placed down-stream a convergent section that accelerates the fluid in order toreach moderate Reynolds numbers. Since these flows have beenwidely used since the sixties to investigate turbulence statisticalproperties, a large literature is available on the optimal designsof the grids in terms of mesh size and solidity. These parameterscontrol the integral scale as well as the Taylor micro-scale basedReynolds number value (Rk, referred to as Reynolds number inthe following). Sizes of wind tunnels are broadly distributed, withtest sections ranging from 10 to 100 cm for typical laboratoryexperiments and up to several meters for the largest apparatuseslike the one in Modane–Avrieux which has a test section 8 m wideand 14 m long. Consequently, reachable Reynolds numbers are alsospanning a wide range, from 100 to 400 in classical tunnels to sev-eral thousands in very large experimental facilities. Bodenschatzteam in Goettingen is currently operating a classical wind tunnelfilled with SF6 gas the very low viscosity of which allows them toreach higher Reynolds numbers exceeding a few thousands(Bodenschatz, 2009). More recently, different teams have intro-duced active grids that allow much higher Rk values in ‘‘small’’laboratory experiments (see Saw et al., 2008 for example). The ac-tive-grid technology is tricky since these grids consist of rotatingpanels more or less independent so that several classical parame-ters as solidity or mesh size are not constant during the experimentand the impact on the generated turbulence of the way thesepanels are moved is not always easy to quantify.
If wind-tunnel turbulence produces well controlled flows, themain difficulty resides in the seeding. Solid particles can be usedin open tunnels. They are avoided in closed loops because of the re-quired separation technique, of the fragility of fans. . . Water drop-lets generated by different types of commercial injectors are usedinstead. When using injectors, the control of the particle size poly-dispersity is often an issue. The other common difficulty concernsthe spatial homogeneity of the seeding. Experiments used in thecontext of the present article are operated in Grenoble (Monchauxet al., 2010), in Cornell (Ayyalasomayajula et al., 2006) and in SanDiego (Aliseda et al., 2002).
2.1.2. Closed flowsIn closed flows, seeding is not any more a problem since it is
actually easy to use calibrated beads of various densities that re-main in the vessel and do not interfere with the propellers. Theonly problems arise with particles of very high densities comparedto the carrier flow that tend to settle very fast with respect to theexperiment duration. We present two families of closed flows usedto study preferential concentration.
Von Kármán experiments consist of counter rotating propellersusually embedded in a closed vessel. Forcing efficiency is good en-ough to reach very high Reynolds numbers (typically Rk ’ 400 ormore) with relatively low power injected. The resulting flow isstrongly inhomogeneous and anisotropic. Nevertheless, manyteams have worked around the central stagnation point wherethe mean flow is weak so that at least homogeneity is almostrecovered.
Different extensions of the von Kármán facilities have been de-signed. They consist of many (at least 8) motors randomly rotatingon the faces of a polyhedral volume. A cubic box fitted with eightfans is operated in Buffalo (Salazar et al., 2008) while similar turbu-
lence boxes in icosahedron geometry are currently developed by atleast two teams in ENS Lyon and at the Max Planck Institute inGoettingen (Zimmermann et al., 2010; Gibert et al., 2010) in orderto get more homogeneous and isotropic flows. All these experi-ments inherit the von Kármán setup advantages and drawbacksbut achieve almost HIT flows. An alternative strategy has been pro-posed by Hwang and Eaton (2004) and followed recently in LMFALyon (Goepfert et al., 2010) to generate isotropic turbulence in airusing synthetic jets. Turbulent boxes have also been exploited byother teams (see Fallon and Rogers, 2002; Friedman and Katz,2002; Guala et al., 2008; Yang and Shy, 2005).
2.2. Numerical approaches
As already mentioned, in the late years, the number of numer-ical simulations dedicated to particle-laden flows has been flour-ishing. We can distinguish three classes of simulations: directnumerical simulations (DNS) or large eddy simulations (LES) ofthe Navier–Stokes equations, random flows and synthetic flows.The latter two aim at capturing specific features of the natural pro-cesses while the former try to be close to the actual phenomenoneven if the forces actually acting on the particles, generally as-sumed to be point particles, are not properly modeled so far.
2.2.1. Direct numerical simulations and large eddies simulationsTo date, the almost simultaneous works by Maxey and Riley
(1983) and Gatignol (1983) in 1983 are the best evaluations ofthe forces acting on a point particle in a turbulent flow and allthe numerical studies dealing with point particles have almost sys-tematically relied on them until recently. Almost all of them con-sider point particles whose density is much higher than that ofthe fluid so that the only remaining force acting on the particlesis the drag force, the latter being usually evaluated as a Stokes drag.The resulting dynamical equation is:
@vp
@t¼ � 1
spðvpðtÞ � uðxp; tÞÞ; ð1Þ
where xp and vp are the particle position and velocity, u is the fluidvelocity and sp is the viscous response time of the particle, alsocalled Stokes time scale. Expression (1) corresponds to neglectinggravity, and assuming that the particle radii r are much smaller thanthe Kolmogorov length gK, that the relative velocity between theparticles and the surrounding fluid and r are such that the corre-sponding Reynolds number is compatible with the Stokes approxi-mation and that the particle density is much higher than that of thefluid. Usually, the Navier–Stokes equations are solved in a square orcubic box – whose size depends on the resolution of the simulation– to obtain u. This fluid velocity field is then used to solve Eq. (1).This method (referred in the present as one-way simulations) isthen compatible with the dilute limits that exclude the possibilityof two-way coupling (see Section 2.3). To our knowledge, onlyElghobashi and Truesdell (1992), Ferrante and Elghobashi (2003)have attempted to model all the forces acting on the particles de-rived by Maxey and Riley, they solve simultaneously the equationsfor the fluid and for the particles in presence of gravity for a massloading ratio of 1. Recently, Faxen corrections (Gatignol (1983))have been taken into account in one-way simulations in an attemptto simulate finite size effects (Calzavarini et al. (2009)). New ap-proaches resolving the particle finite size are now emerging whichoffer a very promising perspective to capture subtle inertial effects,either for isolated inclusions see Burton and Eaton (2005), Homannand Bec (2010), Naso and Prosperetti (2010), and Zeng et al. (2010)as well as on many freely moving particles (see Zhang et al., 2006;Uhlmann, 2008; Yeo et al., 2010; Lucci et al., 2010, 2011). Recentcontributions from Elghobashi’s group are particularly interesting
R. Monchaux et al. / International Journal of Multiphase Flow 40 (2012) 1–18 5
in the context of the present review as they address the question ofpreferential concentration of finite size particles and its conse-quences on turbulence modulation.
2.2.2. Random flowsInitially developed to study statistical properties of turbulence,
random flows and more particularly Kraichnan’s flows (Kraichnan,1968) are playing an important role in our understanding of parti-cle-laden flows. Flows belonging to the so-called Kraichnan ensem-ble consist of delta-correlated in time and spatially correlatedflows for which the second order structure function can be writtenas:
huiðr; tÞujðr0; t0Þi ¼ 2bijðr � r0Þdðt � t0Þ; ð2Þ
where u is the velocity difference vector field. The spatial correla-tion tensor bij is chosen to ensure incompressibility, isotropy andscale invariance. Its expression involve the Hölder exponent h. Play-ing with h values allows to mimic smooth differentiable velocityfields (h = 1 equivalent to dissipative range of turbulence) or rough-er flows (h < 1 equivalent to inertial range of turbulence). In thisframework, the particle dynamics is a Markov process and pair sep-aration for example can be described with a Fokker–Planck equa-tion with multiplicative noise. Bec and co-workers used a modelreduction in which the noise becomes additive but at the cost ofan additional non-linear drift (see the short review by Bec et al.,2008). Without temporal correlation, these models cannot repre-sent persistent structures, Olla has recently weakened the delta-correlation in time hypothesis to allow some memory effect inthe dynamics (Olla, 2010).
2.2.3. Synthetic flowsAn important class of flows used to test various ideas and iso-
late physical mechanisms is the so-called synthetic flows or kine-matic simulations. The latter consist of a superimposition of sineand cosine functions that mimic turbulent behavior as forexample:
uðx; tÞ ¼XNk
n¼1
An sinðkn � xþxntÞ þ Bn cosðkn � xþxntÞ; ð3Þ
An and Bn are chosen to establish a prescribed energy spectrumand are normal to kn to ensure incompressibility. This type of mod-el has been used by various authors Chen et al. (2006) and Ijzer-mans et al. (2010) in the framework of inertial particlepreferential concentration in comparison to more realisticapproaches.
Synthetic flows would refer to flows built with arrays of analyt-ical vortices whose relative positions or intensity are randomly ordeterministically evolving or built from superimposition of variouspure shear flows whose intensity is also randomly evolving. Theseminimal models have been used for long to test basic vortex trap-ping/escaping ideas by Eaton and Fessler (1994) or Maxey (1987b)but in a more recent literature as well (Bec et al., 2005; Ijzermanset al., 2010; Ducasse and Pumir, 2009; Aly and Nicolleau, 2008).
2.3. Seeding techniques and particle characterization
An obviously crucial point in the preferential concentrationstudies is the seeding and, according to the particles employed,their characterization. There are different aspects to take into ac-count when dealing with seeding: some concern the particle char-acteristics as their size, density or shape while others concern theparticle field as the mass or volume fraction loading, the loadinghomogeneity or the relative seeding injection velocity. At thisstage, it is important to define and discuss the control parametersassociated to particle-laden turbulent flows. The most relevant
control parameters governing turbulent flows laden with inertialparticles are the Stokes and Rouse numbers and the mass and vol-ume loading. The Stokes number compares the particle viscousrelaxation time to a turbulent time. The latter is often chosen asthe Kolmogorov time, but can also be chosen somewhere else inthe inertial range or in the large scales. The Rouse number com-pares the particle terminal velocity to the turbulent fluctuationsintensity. In dispersed systems, the loading intervenes both byway of the volume concentration and by way of the mass loading.The latter is known to have a significant effect on the turbulencemodulation (Druzhinin and Elghobashi, 1999) while the volumeconcentration primarily affects the momentum coupling betweenphases.
2.3.1. Particle seedingIntuitively, mass and volume fraction loading should only im-
pact the coupling between the fluid and the dispersed phases, nev-ertheless, different studies have pointed out some possiblecollective dynamics leading to non trivial effects of global concen-tration on settling velocity of the particles or on the clusteringproperties (see for example Aliseda et al., 2002 or Monchaux etal., 2010). Even if a clear threshold cannot be defined, it is generallyassumed that for volume fraction (resp. mass loading) less than10�5 (resp. 10�2) the fluid flow is not affected by the particles thatmay be considered as passively advected. Above these values, backreaction of the particles on the fluid cannot be ruled out anymore.In addition, collisions are to be accounted for volume fractionsexceeding typically 10�3. Note that investigations of the so-calledtwo-way coupling problem are still scarce (see Ferrante andElghobashi, 2003; Lucci et al., 2010, 2011 for the most extensivenumerical studies) and much remains to be understood on theinfluence of the loading. Moreover, the crude estimates givenabove are expected to evolve when taking into account the finitesize of particles as notably shown by Yeo et al. (2010) and by Lucciet al. (2010, 2011). Let us finally mention that new parametershave been recently proposed to account for the modulation of tur-bulence. For instance, Poelma et al. (2007) proposed to use a‘‘Stokes load’’ defined as USt = n0St (with St the usual Stokes numberand n0 the average number of particles in a dissipative eddy) whichthey have shown to give a better collapse of experimental data onturbulence modulation (see also the reviews by Poelma and Ooms,2006; Balachandar and Eaton, 2010 on this question).
In almost any numerical study, particles are injected in thesimulation at once at uniformly distributed random locations cov-ering the whole computation box, which seems to be the idealway to inject particles if one wants to study the segregationand preferential concentration occurring to the particle field.Experimentally people try to adopt seeding techniques leadingto situations as close as possible to the ideal numerical case. Inclosed flows and turbulent boxes seeded with particles whosedensity is not very different from the fluid’s one the seedinghomogeneity is not a problem. Difficulties arise for particles muchdenser than the fluid that tend to settle quickly – even in vonKármaán flows that are very efficient mixing flows – and basi-cally, this phenomenon drastically limits the experiment durationand implies some pre-mixing before each experiment. Wind tun-nel experiment is probably the most challenging situation sincethe settling problem (that may also induce some secondary flowin the carrier phase) is complemented with the injection unifor-mity issue. Usually, particles are injected far enough upstreamthe measurement volume, typically close to the grid location.The injection process should avoid creating disturbances to theflow (wakes, mixing layers. . .) and should achieve homogeneousseeding. The solution chosen often implies an array of injectorsplaced on the grid itself and aiming at the downstream direction,or surrounding the grid and aiming at the center of the tunnel.
6 R. Monchaux et al. / International Journal of Multiphase Flow 40 (2012) 1–18
The initial velocity difference between particles and carrier fluidimplies the possible formation of mixing layers that would resultin persistent structures developing along the flow.
2.3.2. Particle characterizationRegarding the particle characteristics, the most comfortable sit-
uation occurs when only one type of particle is present so that re-sults are easier to analyze since the Stokes number for example isnon ambiguously defined. If monodispersity is easily approachedin the case of solid particles that can be calibrated, seeding withdroplets leads to strongly polydispersed particle populations. Acareful characterization of the particle properties is then requiredto evaluate the size distribution. Aside direct imaging techniques,several systems exist to achieve in situ measurements such asPhase Doppler Anemometers (PDAs, commercialized for instanceby Artium Technologies, TSI, Dantec Dynamics), diffraction basedanalyzers – such as the SprayTech by Malvern (UK) –, phasedetection optical probes – see for instance A2 Photonic Sensors(France). . ., interferometric particle imaging and global phaseDoppler techniques, see for example Damaschke et al. (2002). . . Ex-cept in the case of PDA and phase detection probes (see Hong et al.,2004; Saito et al., 2009), the granulometry analysis has to be per-formed independently from velocity or concentration measure-ments (to be described in the next section). If we implicitlyassume here that particles are spherical and are thus fully charac-terized by their diameter, some experiments have been operatedwith more complicated particles such as pollen or with livingorganisms with or without mobility whose shape is far from spher-ical (see for instance Schmitt and Seuront (2008)).
2.3.3. Stokes numberAmong the key parameters governing turbulent flows laden
with dense particles, the Stokes number defined as the particleresponse time relative to some time scale characteristics of theunderlying continuous phase flow (generally the Kolmogorovtime scale sg or the integral time scale of the carrier flow T = L/u0, where L is the correlation length of the carrier velocity fieldand u0 its rms value) plays a central role. Its definition and evalu-ation thus deserve a careful examination. The classical definitioncompares the viscous relaxation time of the particle sm and theKolmogorov time sg:
St ¼ sm
sgwith sm ¼
118
qp
qf
d2p
m; ð4Þ
where qp and qf are the particle and fluid density, m is the fluid kine-matic viscosity and dp is the particle diameter.
Although this Stokes number is commonly said to representinertial effects, recent investigations of the dynamics of isolatedinclusions (Qureshi et al., 2007, 2008) indicate that – for a givenStokes number – size and density are not interchangeable quanti-ties in terms of particle dynamics, and therefore they ought to bedistinguished in future investigations dealing with finite size inclu-sions. Recent two-way coupling simulations by Lucci et al. (2010,2011) are considering particles whose diameters are around theTaylor micro-scale. They do show that particles with same relaxa-tion time but with different diameters have different impact on thecarrier flow. Thus, the relevant parameter space is at least twodimensional. To account for the particle finite sizes one cannotuse sm nor sg anymore and we refer the reader to a recent discus-sion of this point by Xu and Bodenschatz (2008) and by Schmittand Seuront (2008). Both teams consider that the particles filterthe turbulent motion happening at scales smaller than their diam-eter and use the turbulent dynamical time at the scale of the par-ticle size:
sp ¼d2
p
�
!1=3
; ð5Þ
leading to Stokes number values smaller than those defined fromthe Kolmogorov time scale. Similarly, even when the point particleapproximation is valid, following an original idea by Falkovich et al.(2003) and Bec et al. (2007b, 2008) have shown that scale by scaleclustering properties in the inertial range may be better describedin terms of a local Stokes number, defined as the ratio betweenthe particle response time sm and the turnover time at the givenscale of interest. Further corrections are also to be considered ifthe particulate Reynolds number increases, thus either for largeparticles or for particles with large relative velocity with respectto the fluid (see for instance Mei, 1996).
From an experimental point of view, evaluation of the Stokesnumber is most of the time a tricky problem. In the case of polydis-persed seedings, if one wants to define a Stokes number associatedto one experiment, the particle diameter used in the Stokes num-ber calculation is a statistical quantity (mean or more probable va-lue for example) whose dispersion (measured with the variance ofthe particle diameters distribution) could be large compared to themean. Other complications arise from the turbulent times defini-tions that require the measurement of the dissipation rate � whichis also often subject to large uncertainties. As a result, it is oftendelicate to compare exact absolute Stokes numbers values ob-tained from different experiments for which size distributionsare most often polydispersed.
3. Diagnosis for preferential concentration and clusterscharacterization
In this section, we will describe the many methods used tostudy and characterize preferential concentration and clusteringin turbulent flows. First, we focus on direct methods that are allmore or less linked to concentration measurements. Then we pres-ent some indirect methods that use dynamical measurements toevidence a preferential sampling of the flow by inertial particles.We close this section by mentioning the few attempts to performsimultaneous measurements in the continuous and dispersedphases.
Ideally, one aims at knowing exact 3D coordinates of all the par-ticles present in the flow but practically we are still lagging very farbehind this goal. Several teams have developed sophisticated 3Dparticle tracking (Ayyalasomayajula et al., 2006; Luthi, 2003) thatallows to follow several hundreds of particle trajectories in a smallvolume (whose typical size is of the order of 4 � 5 cm) at a quitehigh cost since it requires the use of four high speed camerasand implies the use of a cluster to process the acquired images ina reasonable amount of time. For the matter of preferential concen-tration, these data can be very useful for indirect dynamical meth-ods but are not very suited to the study of concentration fieldssince the number of particles tracked per unit volume is limited.3D data may also come from holographic methods as developedfor example at Buffalo or Lyon (Chareyron, 2009; Salazar et al.,2008), even if to date, the number of particles followed with thistechnique is still low (’400 typically). The most common acquisi-tion consists of 2D-pictures taken in a thin laser sheet (usually ofthe order of 1 mm). The great advantage is that these pictures con-tain many particles (from 1000 to 20,000 typically) distributed onlengths comparable with the flow integral scale, allowing goodconcentration measurement and cluster characterization. Flowsbeing necessarily 3D, using 2D-pictures implies a projection ofthe particle positions over the laser sheet thickness (the resultingbias has to be carefully evaluated) and, according to the flow topol-ogy, makes particle tracking noisy to perform (quasi 2D flows as
R. Monchaux et al. / International Journal of Multiphase Flow 40 (2012) 1–18 7
wind-tunnel) or impossible (fully 3D flows as von Kármán flows).Finally, we note that, in some situations, people use 1D data con-sisting of single point measurement of particle arrival time (typi-cally from PDA or from in situ measurements in clouds). Fromthose, using a kind of Taylor hypothesis, they build a 1D concentra-tion map along a line. Numerical simulations may also be 1D, 2D or3D and in the following paragraph, we will describe the type ofanalysis that can be performed from such data to get insight intothe preferential concentration and clustering issues.
3.1. Quantifying preferential concentration/clustering
If visualizations give qualitative impressions of the strength ofthe preferential concentration phenomenon, there is a tremendouscall for quantitative estimations of it and several approaches aresimultaneously used to achieve this goal. In the introduction, wedefined what we mean by preferential concentration, clusteringand clusters; in this section we review several methods which areused to analyze particles in turbulent flows and we discuss towhich extent they allow, or not, to characterize these three phe-nomena. In order to compare these different analysis techniques,whenever it was possible, we have processed data acquired inour wind-tunnel and described in Monchaux et al. (2010) witheach method.
3.1.1. A wide range of methodsWhen dealing with preferential concentration or clustering, it is
implicitly assumed that one deals with preferential concentrationwhen compared to uniformly distributed particles leading to aPoisson distribution. Almost all the hereafter described methodstry to quantify a distance between the considered concentrationfields and uniform ones.
3.1.1.1. Visualizations. Qualitative analysis of clustering and prefer-ential concentration is often given through visualizations, particu-larly in numerical papers. Whatever are the simulations, 2D DNS(Chen et al., 2006; Goto and Vassilicos, 2006; Coleman and Vassili-cos, 2009), 3D DNS (Squires and Eaton, 1990, 1991; Wang andMaxey, 1993; Reade and Collins, 2000; Collins and Keswani,2004; Bec et al., 2007a; Calzavarini et al., 2008; Goto and Vassilicos,2008; Coleman and Vassilicos, 2009; Bec et al., 2010; Yoshimotoand Goto, 2007), Large Eddy Simulations, Wang and Squires(1996) and Jin et al. (2010) stochastic modeling (Bec, 2005; Becet al., 2005) authors often display series of pictures associated toStokes numbers increasing from the tracer limit up to order 10 val-ues as shown in Fig. 1 taken from Yoshimoto and Goto (2007). Re-sults are actually consistent among these various publications,even if the forces acting on particles are differently modeled: for
0 20 40 600
0.02
0.04
0.06
0.08
0.1
particle counts
poissonexperiment
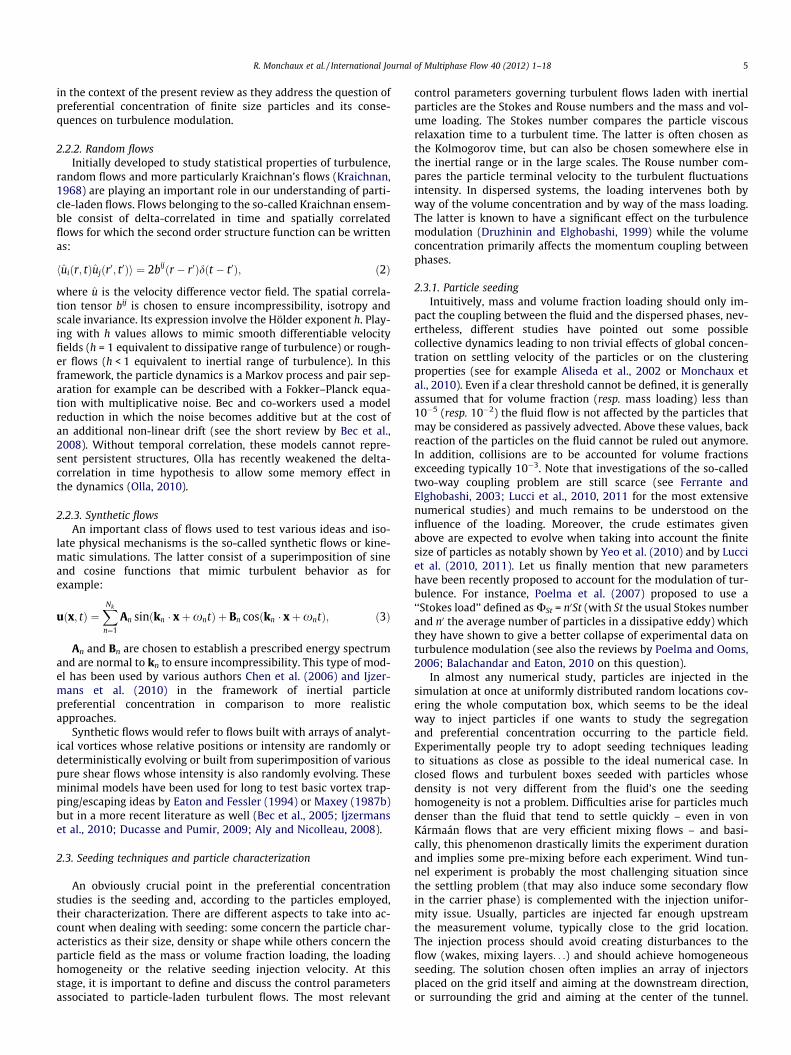
Fig. 2. Box counting method. Left: PDF of the number of particles per box for an experimedependence with box sizes for different experiments at various Stokes numbers. The averfrom Monchaux et al. (2010). (For interpretation of the references to color in this figure
tracers, the particles are homogeneously distributed and as Stokesnumber is increasing some areas get denser and denser while oth-ers are drained; maximum concentration gradients are observedfor Stokes numbers around unity above which empty areas stopgrowing while concentration patterns in dense area turn blurred.Visualizations have been also used to point out correlations be-tween particle concentration and either region of high/low strainor fluid zero-acceleration points (Chen et al., 2006; Coleman andVassilicos, 2009; Goto and Vassilicos, 2006; Goto and Vassilicos,2008) or pressure gradient fields (Bec et al., 2007a). We will see la-ter how quantitative indicators support these visualizations.Experimentally, this type of visualizations is scarcely used in a di-rect way but, as already mentioned, preferential concentration isoften employed for flow visualization purposes. We also remarkthat the review by Eaton and Fessler (1994) refers to a large num-ber of visualizations in complex and structured flows.
3.1.1.2. Clustering index. This is a rough way to obtain somethingclose to the box index described below. A test volume V is chosenand moved in the whole space. For each position of the test vol-ume, N is the number of particles within in the volume at the con-sidered position. One defines the clustering index (CI) as:
CIðVÞ ¼ rN
N� 1; ð6Þ
where N and rN are the average and the variance of the numbers ofparticles N(V) obtained when moving the test volume. For Poissondistributions, as mean and variance are equal, CI is identically equalto zero while it gets positive when spatial correlations occur in V.The review by Shaw et al. (2002) references teams that used theclustering index to quantify clustering in clouds. The clustering in-dex strongly depends on the scale chosen to define the control vol-ume V and is thus scarcely used.
3.1.1.3. Box counting methods. Starting from nD-data, whatever theinteger value of n, the nD space is divided into N boxes of equal sizedefined by an arbitrary chosen scale r such that each box has a vol-ume rn and that the N boxes fill the entire space of the data. If onewants to measure concentration and/or characterize dense area,then one counts how many particles belong to each box. In the caseof uniformly distributed particles, the Probability Density Function(PDF) of the number of particles per box is described by a Poissondistribution. In presence of clustering, boxes with very high andvery low number of particles per box will be much more likely toexist than in the Poisson case and so the associated PDF will differfrom the associated Poisson one as can be seen from Fig. 2 left ob-tained with experimental data in presence of clustering. It is thenpossible to calculate the distance between these two PDF with
0 20 40 600
0.01
0.02
0.03
0.04
box size (η)
BI
<St>∼0.93<St>∼0.33<St>∼0.69<St>∼1.3
increasingStokesnumber
nt (red squares) and for an associated Poisson process (blue circles). Right: box indexage number of particles per image varies in the range 600–4000. Experiments takenlegend, the reader is referred to the web version of this article.)
10−1 100 101 1021.5
1.6
1.7
1.8
1.9
2
2.1
Averaged Stokes
D2
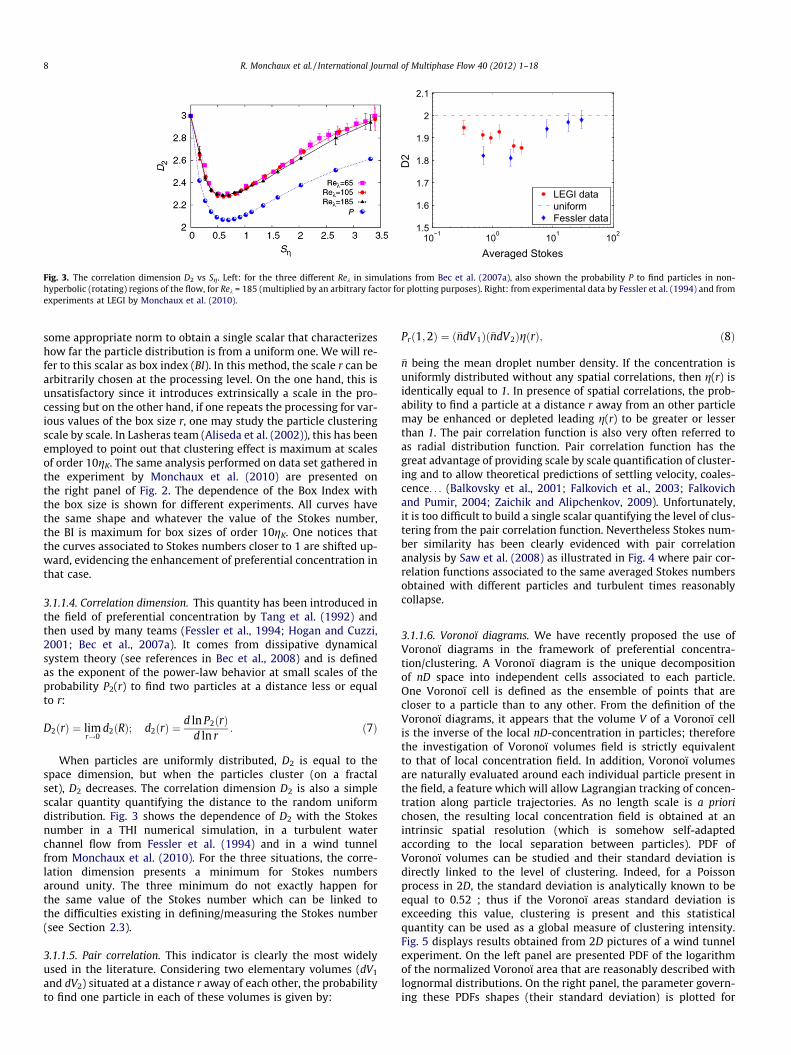
LEGI datauniformFessler data
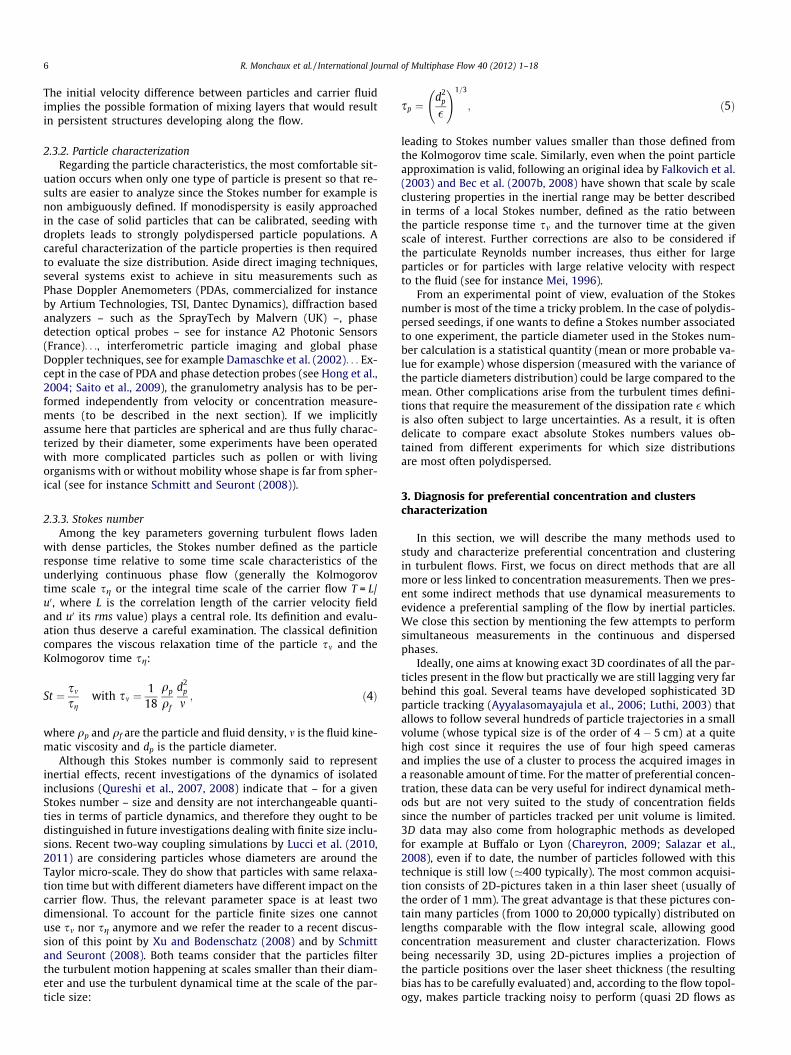
Fig. 3. The correlation dimension D2 vs Sg. Left: for the three different Rek in simulations from Bec et al. (2007a), also shown the probability P to find particles in non-hyperbolic (rotating) regions of the flow, for Rek = 185 (multiplied by an arbitrary factor for plotting purposes). Right: from experimental data by Fessler et al. (1994) and fromexperiments at LEGI by Monchaux et al. (2010).
8 R. Monchaux et al. / International Journal of Multiphase Flow 40 (2012) 1–18
some appropriate norm to obtain a single scalar that characterizeshow far the particle distribution is from a uniform one. We will re-fer to this scalar as box index (BI). In this method, the scale r can bearbitrarily chosen at the processing level. On the one hand, this isunsatisfactory since it introduces extrinsically a scale in the pro-cessing but on the other hand, if one repeats the processing for var-ious values of the box size r, one may study the particle clusteringscale by scale. In Lasheras team (Aliseda et al. (2002)), this has beenemployed to point out that clustering effect is maximum at scalesof order 10gK. The same analysis performed on data set gathered inthe experiment by Monchaux et al. (2010) are presented onthe right panel of Fig. 2. The dependence of the Box Index withthe box size is shown for different experiments. All curves havethe same shape and whatever the value of the Stokes number,the BI is maximum for box sizes of order 10gK. One notices thatthe curves associated to Stokes numbers closer to 1 are shifted up-ward, evidencing the enhancement of preferential concentration inthat case.
3.1.1.4. Correlation dimension. This quantity has been introduced inthe field of preferential concentration by Tang et al. (1992) andthen used by many teams (Fessler et al., 1994; Hogan and Cuzzi,2001; Bec et al., 2007a). It comes from dissipative dynamicalsystem theory (see references in Bec et al., 2008) and is definedas the exponent of the power-law behavior at small scales of theprobability P2(r) to find two particles at a distance less or equalto r:
D2ðrÞ ¼ limr!0
d2ðRÞ; d2ðrÞ ¼d ln P2ðrÞ
d ln r: ð7Þ
When particles are uniformly distributed, D2 is equal to thespace dimension, but when the particles cluster (on a fractalset), D2 decreases. The correlation dimension D2 is also a simplescalar quantity quantifying the distance to the random uniformdistribution. Fig. 3 shows the dependence of D2 with the Stokesnumber in a THI numerical simulation, in a turbulent waterchannel flow from Fessler et al. (1994) and in a wind tunnelfrom Monchaux et al. (2010). For the three situations, the corre-lation dimension presents a minimum for Stokes numbersaround unity. The three minimum do not exactly happen forthe same value of the Stokes number which can be linked tothe difficulties existing in defining/measuring the Stokes number(see Section 2.3).
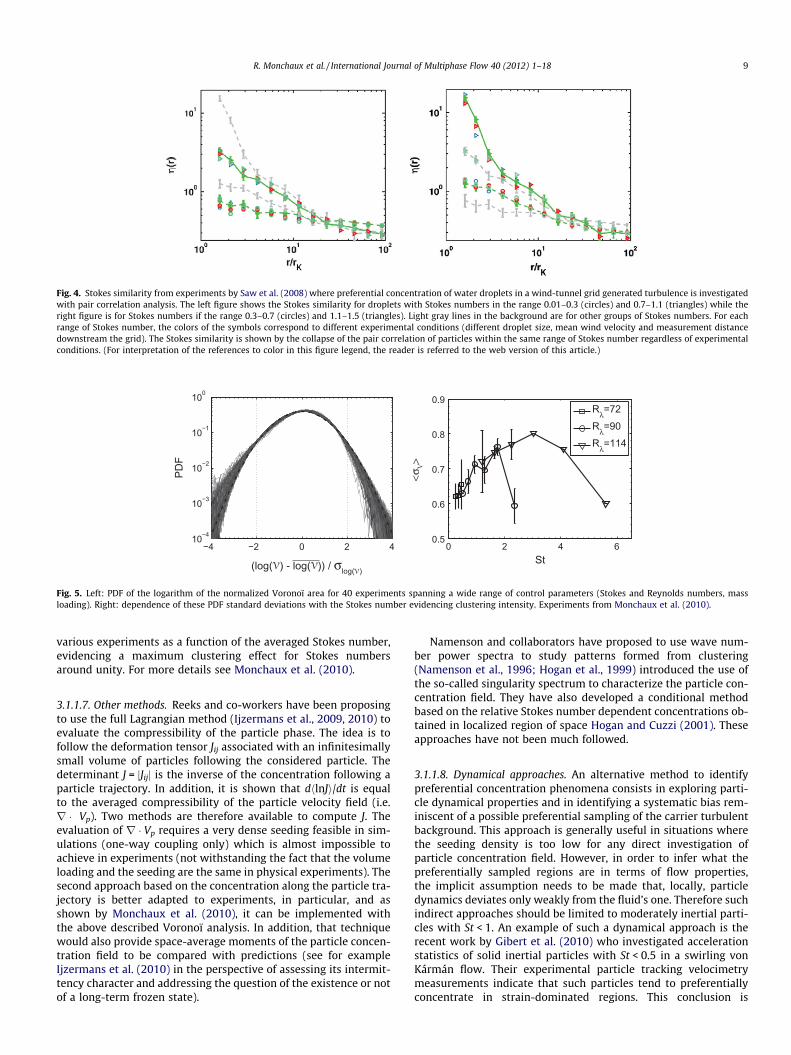
3.1.1.5. Pair correlation. This indicator is clearly the most widelyused in the literature. Considering two elementary volumes (dV1
and dV2) situated at a distance r away of each other, the probabilityto find one particle in each of these volumes is given by:
Prð1;2Þ ¼ ð�ndV1Þð�ndV2ÞgðrÞ; ð8Þ
�n being the mean droplet number density. If the concentration isuniformly distributed without any spatial correlations, then g(r) isidentically equal to 1. In presence of spatial correlations, the prob-ability to find a particle at a distance r away from an other particlemay be enhanced or depleted leading g(r) to be greater or lesserthan 1. The pair correlation function is also very often referred toas radial distribution function. Pair correlation function has thegreat advantage of providing scale by scale quantification of cluster-ing and to allow theoretical predictions of settling velocity, coales-cence. . . (Balkovsky et al., 2001; Falkovich et al., 2003; Falkovichand Pumir, 2004; Zaichik and Alipchenkov, 2009). Unfortunately,it is too difficult to build a single scalar quantifying the level of clus-tering from the pair correlation function. Nevertheless Stokes num-ber similarity has been clearly evidenced with pair correlationanalysis by Saw et al. (2008) as illustrated in Fig. 4 where pair cor-relation functions associated to the same averaged Stokes numbersobtained with different particles and turbulent times reasonablycollapse.
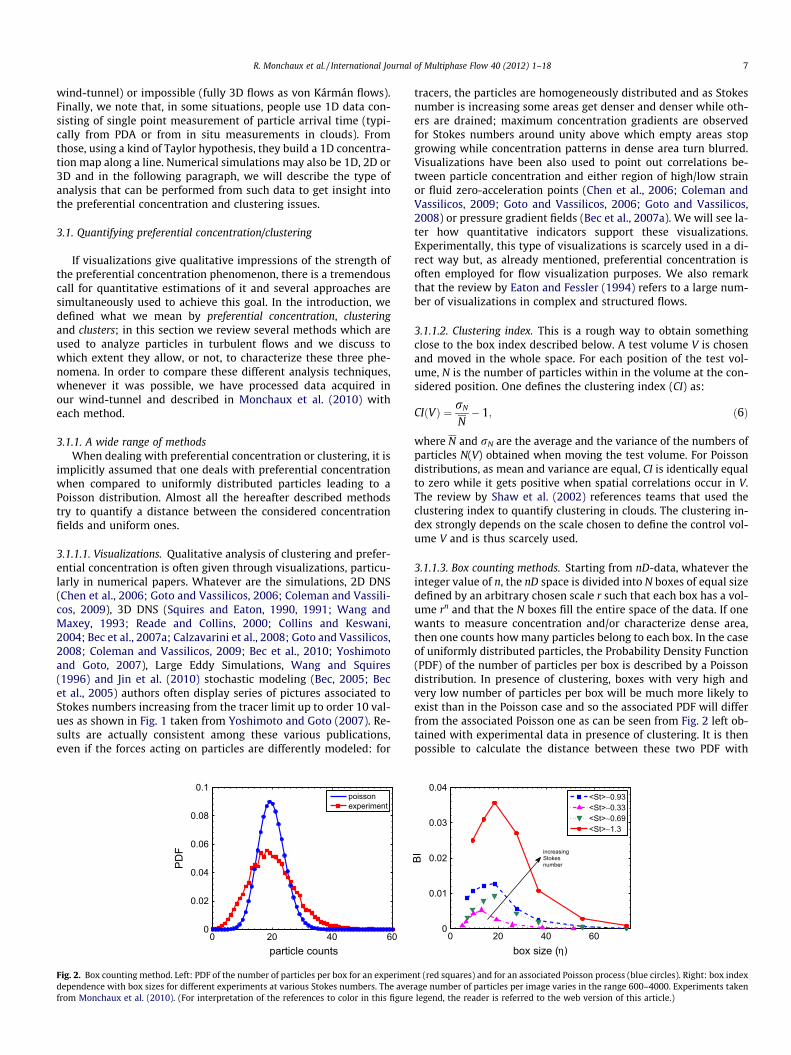
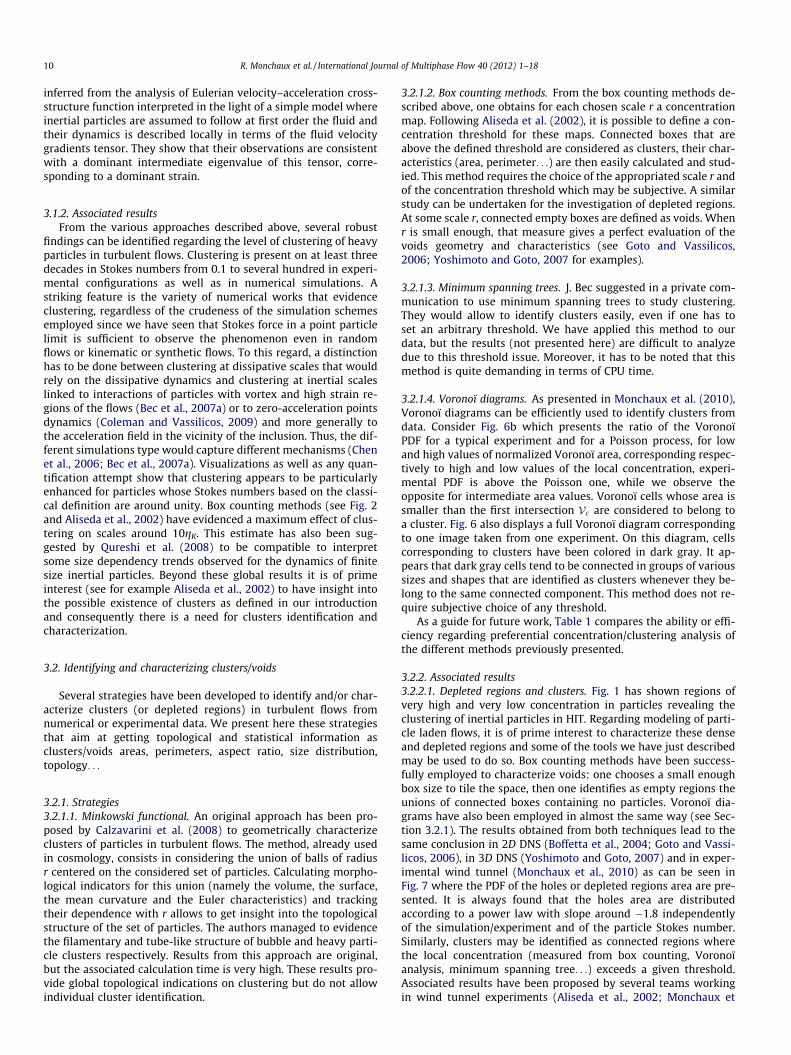
3.1.1.6. Voronoï diagrams. We have recently proposed the use ofVoronoï diagrams in the framework of preferential concentra-tion/clustering. A Voronoï diagram is the unique decompositionof nD space into independent cells associated to each particle.One Voronoï cell is defined as the ensemble of points that arecloser to a particle than to any other. From the definition of theVoronoï diagrams, it appears that the volume V of a Voronoï cellis the inverse of the local nD-concentration in particles; thereforethe investigation of Voronoï volumes field is strictly equivalentto that of local concentration field. In addition, Voronoï volumesare naturally evaluated around each individual particle present inthe field, a feature which will allow Lagrangian tracking of concen-tration along particle trajectories. As no length scale is a priorichosen, the resulting local concentration field is obtained at anintrinsic spatial resolution (which is somehow self-adaptedaccording to the local separation between particles). PDF ofVoronoï volumes can be studied and their standard deviation isdirectly linked to the level of clustering. Indeed, for a Poissonprocess in 2D, the standard deviation is analytically known to beequal to 0.52 ; thus if the Voronoï areas standard deviation isexceeding this value, clustering is present and this statisticalquantity can be used as a global measure of clustering intensity.Fig. 5 displays results obtained from 2D pictures of a wind tunnelexperiment. On the left panel are presented PDF of the logarithmof the normalized Voronoï area that are reasonably described withlognormal distributions. On the right panel, the parameter govern-ing these PDFs shapes (their standard deviation) is plotted for
−4 −2 0 2 410−4
10−3
10−2
10−1
100
(log( ) - log( )) / σlog( )
0 2 4 60.5
0.6
0.7
0.8
0.9
St
Rλ=72Rλ=90Rλ=114
<σ>
Fig. 5. Left: PDF of the logarithm of the normalized Voronoï area for 40 experiments spanning a wide range of control parameters (Stokes and Reynolds numbers, massloading). Right: dependence of these PDF standard deviations with the Stokes number evidencing clustering intensity. Experiments from Monchaux et al. (2010).
Fig. 4. Stokes similarity from experiments by Saw et al. (2008) where preferential concentration of water droplets in a wind-tunnel grid generated turbulence is investigatedwith pair correlation analysis. The left figure shows the Stokes similarity for droplets with Stokes numbers in the range 0.01–0.3 (circles) and 0.7–1.1 (triangles) while theright figure is for Stokes numbers if the range 0.3–0.7 (circles) and 1.1–1.5 (triangles). Light gray lines in the background are for other groups of Stokes numbers. For eachrange of Stokes number, the colors of the symbols correspond to different experimental conditions (different droplet size, mean wind velocity and measurement distancedownstream the grid). The Stokes similarity is shown by the collapse of the pair correlation of particles within the same range of Stokes number regardless of experimentalconditions. (For interpretation of the references to color in this figure legend, the reader is referred to the web version of this article.)
R. Monchaux et al. / International Journal of Multiphase Flow 40 (2012) 1–18 9
various experiments as a function of the averaged Stokes number,evidencing a maximum clustering effect for Stokes numbersaround unity. For more details see Monchaux et al. (2010).
3.1.1.7. Other methods. Reeks and co-workers have been proposingto use the full Lagrangian method (Ijzermans et al., 2009, 2010) toevaluate the compressibility of the particle phase. The idea is tofollow the deformation tensor Jij associated with an infinitesimallysmall volume of particles following the considered particle. Thedeterminant J = jJijj is the inverse of the concentration following aparticle trajectory. In addition, it is shown that dhlnJi/dt is equalto the averaged compressibility of the particle velocity field (i.e.r � Vp). Two methods are therefore available to compute J. Theevaluation of r � Vp requires a very dense seeding feasible in sim-ulations (one-way coupling only) which is almost impossible toachieve in experiments (not withstanding the fact that the volumeloading and the seeding are the same in physical experiments). Thesecond approach based on the concentration along the particle tra-jectory is better adapted to experiments, in particular, and asshown by Monchaux et al. (2010), it can be implemented withthe above described Voronoï analysis. In addition, that techniquewould also provide space-average moments of the particle concen-tration field to be compared with predictions (see for exampleIjzermans et al. (2010) in the perspective of assessing its intermit-tency character and addressing the question of the existence or notof a long-term frozen state).
Namenson and collaborators have proposed to use wave num-ber power spectra to study patterns formed from clustering(Namenson et al., 1996; Hogan et al., 1999) introduced the use ofthe so-called singularity spectrum to characterize the particle con-centration field. They have also developed a conditional methodbased on the relative Stokes number dependent concentrations ob-tained in localized region of space Hogan and Cuzzi (2001). Theseapproaches have not been much followed.
3.1.1.8. Dynamical approaches. An alternative method to identifypreferential concentration phenomena consists in exploring parti-cle dynamical properties and in identifying a systematic bias rem-iniscent of a possible preferential sampling of the carrier turbulentbackground. This approach is generally useful in situations wherethe seeding density is too low for any direct investigation ofparticle concentration field. However, in order to infer what thepreferentially sampled regions are in terms of flow properties,the implicit assumption needs to be made that, locally, particledynamics deviates only weakly from the fluid’s one. Therefore suchindirect approaches should be limited to moderately inertial parti-cles with St < 1. An example of such a dynamical approach is therecent work by Gibert et al. (2010) who investigated accelerationstatistics of solid inertial particles with St < 0.5 in a swirling vonKármán flow. Their experimental particle tracking velocimetrymeasurements indicate that such particles tend to preferentiallyconcentrate in strain-dominated regions. This conclusion is
10 R. Monchaux et al. / International Journal of Multiphase Flow 40 (2012) 1–18
inferred from the analysis of Eulerian velocity–acceleration cross-structure function interpreted in the light of a simple model whereinertial particles are assumed to follow at first order the fluid andtheir dynamics is described locally in terms of the fluid velocitygradients tensor. They show that their observations are consistentwith a dominant intermediate eigenvalue of this tensor, corre-sponding to a dominant strain.
3.1.2. Associated resultsFrom the various approaches described above, several robust
findings can be identified regarding the level of clustering of heavyparticles in turbulent flows. Clustering is present on at least threedecades in Stokes numbers from 0.1 to several hundred in experi-mental configurations as well as in numerical simulations. Astriking feature is the variety of numerical works that evidenceclustering, regardless of the crudeness of the simulation schemesemployed since we have seen that Stokes force in a point particlelimit is sufficient to observe the phenomenon even in randomflows or kinematic or synthetic flows. To this regard, a distinctionhas to be done between clustering at dissipative scales that wouldrely on the dissipative dynamics and clustering at inertial scaleslinked to interactions of particles with vortex and high strain re-gions of the flows (Bec et al., 2007a) or to zero-acceleration pointsdynamics (Coleman and Vassilicos, 2009) and more generally tothe acceleration field in the vicinity of the inclusion. Thus, the dif-ferent simulations type would capture different mechanisms (Chenet al., 2006; Bec et al., 2007a). Visualizations as well as any quan-tification attempt show that clustering appears to be particularlyenhanced for particles whose Stokes numbers based on the classi-cal definition are around unity. Box counting methods (see Fig. 2and Aliseda et al., 2002) have evidenced a maximum effect of clus-tering on scales around 10gK. This estimate has also been sug-gested by Qureshi et al. (2008) to be compatible to interpretsome size dependency trends observed for the dynamics of finitesize inertial particles. Beyond these global results it is of primeinterest (see for example Aliseda et al., 2002) to have insight intothe possible existence of clusters as defined in our introductionand consequently there is a need for clusters identification andcharacterization.
3.2. Identifying and characterizing clusters/voids
Several strategies have been developed to identify and/or char-acterize clusters (or depleted regions) in turbulent flows fromnumerical or experimental data. We present here these strategiesthat aim at getting topological and statistical information asclusters/voids areas, perimeters, aspect ratio, size distribution,topology. . .
3.2.1. Strategies3.2.1.1. Minkowski functional. An original approach has been pro-posed by Calzavarini et al. (2008) to geometrically characterizeclusters of particles in turbulent flows. The method, already usedin cosmology, consists in considering the union of balls of radiusr centered on the considered set of particles. Calculating morpho-logical indicators for this union (namely the volume, the surface,the mean curvature and the Euler characteristics) and trackingtheir dependence with r allows to get insight into the topologicalstructure of the set of particles. The authors managed to evidencethe filamentary and tube-like structure of bubble and heavy parti-cle clusters respectively. Results from this approach are original,but the associated calculation time is very high. These results pro-vide global topological indications on clustering but do not allowindividual cluster identification.
3.2.1.2. Box counting methods. From the box counting methods de-scribed above, one obtains for each chosen scale r a concentrationmap. Following Aliseda et al. (2002), it is possible to define a con-centration threshold for these maps. Connected boxes that areabove the defined threshold are considered as clusters, their char-acteristics (area, perimeter. . .) are then easily calculated and stud-ied. This method requires the choice of the appropriated scale r andof the concentration threshold which may be subjective. A similarstudy can be undertaken for the investigation of depleted regions.At some scale r, connected empty boxes are defined as voids. Whenr is small enough, that measure gives a perfect evaluation of thevoids geometry and characteristics (see Goto and Vassilicos,2006; Yoshimoto and Goto, 2007 for examples).
3.2.1.3. Minimum spanning trees. J. Bec suggested in a private com-munication to use minimum spanning trees to study clustering.They would allow to identify clusters easily, even if one has toset an arbitrary threshold. We have applied this method to ourdata, but the results (not presented here) are difficult to analyzedue to this threshold issue. Moreover, it has to be noted that thismethod is quite demanding in terms of CPU time.
3.2.1.4. Voronoï diagrams. As presented in Monchaux et al. (2010),Voronoï diagrams can be efficiently used to identify clusters fromdata. Consider Fig. 6b which presents the ratio of the VoronoïPDF for a typical experiment and for a Poisson process, for lowand high values of normalized Voronoï area, corresponding respec-tively to high and low values of the local concentration, experi-mental PDF is above the Poisson one, while we observe theopposite for intermediate area values. Voronoï cells whose area issmaller than the first intersection Vc are considered to belong toa cluster. Fig. 6 also displays a full Voronoï diagram correspondingto one image taken from one experiment. On this diagram, cellscorresponding to clusters have been colored in dark gray. It ap-pears that dark gray cells tend to be connected in groups of varioussizes and shapes that are identified as clusters whenever they be-long to the same connected component. This method does not re-quire subjective choice of any threshold.
As a guide for future work, Table 1 compares the ability or effi-ciency regarding preferential concentration/clustering analysis ofthe different methods previously presented.
3.2.2. Associated results3.2.2.1. Depleted regions and clusters. Fig. 1 has shown regions ofvery high and very low concentration in particles revealing theclustering of inertial particles in HIT. Regarding modeling of parti-cle laden flows, it is of prime interest to characterize these denseand depleted regions and some of the tools we have just describedmay be used to do so. Box counting methods have been success-fully employed to characterize voids: one chooses a small enoughbox size to tile the space, then one identifies as empty regions theunions of connected boxes containing no particles. Voronoï dia-grams have also been employed in almost the same way (see Sec-tion 3.2.1). The results obtained from both techniques lead to thesame conclusion in 2D DNS (Boffetta et al., 2004; Goto and Vassi-licos, 2006), in 3D DNS (Yoshimoto and Goto, 2007) and in exper-imental wind tunnel (Monchaux et al., 2010) as can be seen inFig. 7 where the PDF of the holes or depleted regions area are pre-sented. It is always found that the holes area are distributedaccording to a power law with slope around �1.8 independentlyof the simulation/experiment and of the particle Stokes number.Similarly, clusters may be identified as connected regions wherethe local concentration (measured from box counting, Voronoïanalysis, minimum spanning tree. . .) exceeds a given threshold.Associated results have been proposed by several teams workingin wind tunnel experiments (Aliseda et al., 2002; Monchaux et
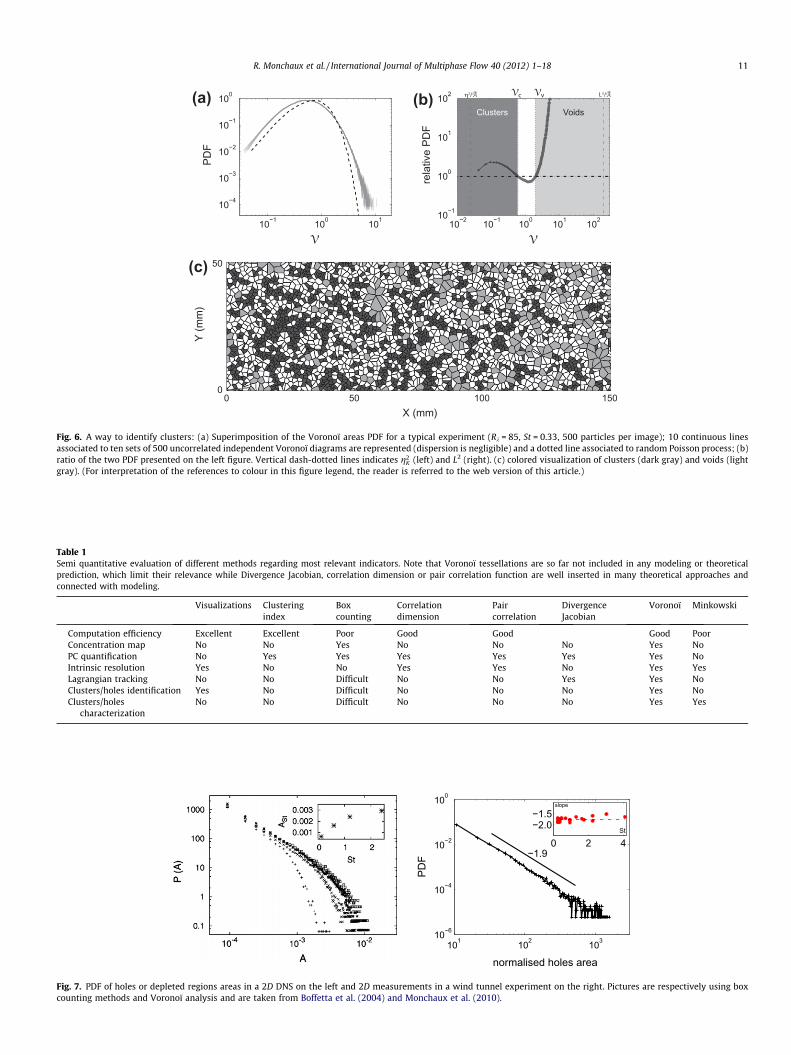
Table 1Semi quantitative evaluation of different methods regarding most relevant indicators. Note that Voronoï tessellations are so far not included in any modeling or theoreticalprediction, which limit their relevance while Divergence Jacobian, correlation dimension or pair correlation function are well inserted in many theoretical approaches andconnected with modeling.
Visualizations Clusteringindex
Boxcounting
Correlationdimension
Paircorrelation
DivergenceJacobian
Voronoï Minkowski
Computation efficiency Excellent Excellent Poor Good Good Good PoorConcentration map No No Yes No No No Yes NoPC quantification No Yes Yes Yes Yes Yes Yes NoIntrinsic resolution Yes No No Yes Yes No Yes YesLagrangian tracking No No Difficult No No Yes Yes NoClusters/holes identification Yes No Difficult No No No Yes NoClusters/holes
characterizationNo No Difficult No No No Yes Yes
101 102 10310−6
10−4
10−2
100
normalised holes area
0 2 4
−2.0−1.5
St
−1.9
slope
Fig. 7. PDF of holes or depleted regions areas in a 2D DNS on the left and 2D measurements in a wind tunnel experiment on the right. Pictures are respectively using boxcounting methods and Voronoï analysis and are taken from Boffetta et al. (2004) and Monchaux et al. (2010).
(b)(a)
10−1 100 101
10−4
10−3
10−2
10−1
100
10 −2 10 −1 10 0 10 1 10 2 10 −1
10 0
10 1
10 2
rela
tive
Voids Clusters
(c)
1501005000
50
X (mm)
Y (m
m)
Fig. 6. A way to identify clusters: (a) Superimposition of the Voronoï areas PDF for a typical experiment (Rk = 85, St = 0.33, 500 particles per image); 10 continuous linesassociated to ten sets of 500 uncorrelated independent Voronoï diagrams are represented (dispersion is negligible) and a dotted line associated to random Poisson process; (b)ratio of the two PDF presented on the left figure. Vertical dash-dotted lines indicates g2
K (left) and L2 (right). (c) colored visualization of clusters (dark gray) and voids (lightgray). (For interpretation of the references to colour in this figure legend, the reader is referred to the web version of this article.)
R. Monchaux et al. / International Journal of Multiphase Flow 40 (2012) 1–18 11
100 101 102 10310−6
10−5
10−4
10−3
10−2
10−1
100
0 2 4
−3
−2
−1
0St
−2
slope
η2 L2
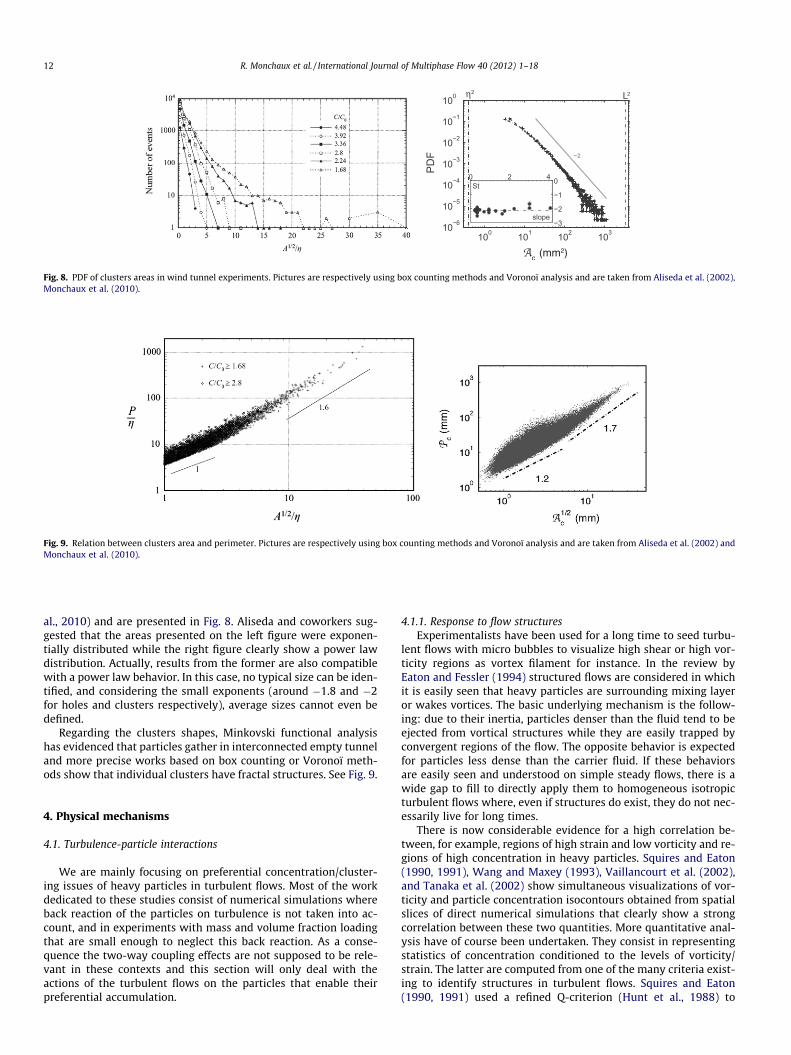
Fig. 8. PDF of clusters areas in wind tunnel experiments. Pictures are respectively using box counting methods and Voronoï analysis and are taken from Aliseda et al. (2002),Monchaux et al. (2010).
Fig. 9. Relation between clusters area and perimeter. Pictures are respectively using box counting methods and Voronoï analysis and are taken from Aliseda et al. (2002) andMonchaux et al. (2010).
12 R. Monchaux et al. / International Journal of Multiphase Flow 40 (2012) 1–18
al., 2010) and are presented in Fig. 8. Aliseda and coworkers sug-gested that the areas presented on the left figure were exponen-tially distributed while the right figure clearly show a power lawdistribution. Actually, results from the former are also compatiblewith a power law behavior. In this case, no typical size can be iden-tified, and considering the small exponents (around �1.8 and �2for holes and clusters respectively), average sizes cannot even bedefined.
Regarding the clusters shapes, Minkovski functional analysishas evidenced that particles gather in interconnected empty tunneland more precise works based on box counting or Voronoï meth-ods show that individual clusters have fractal structures. See Fig. 9.
4. Physical mechanisms
4.1. Turbulence-particle interactions
We are mainly focusing on preferential concentration/cluster-ing issues of heavy particles in turbulent flows. Most of the workdedicated to these studies consist of numerical simulations whereback reaction of the particles on turbulence is not taken into ac-count, and in experiments with mass and volume fraction loadingthat are small enough to neglect this back reaction. As a conse-quence the two-way coupling effects are not supposed to be rele-vant in these contexts and this section will only deal with theactions of the turbulent flows on the particles that enable theirpreferential accumulation.
4.1.1. Response to flow structuresExperimentalists have been used for a long time to seed turbu-
lent flows with micro bubbles to visualize high shear or high vor-ticity regions as vortex filament for instance. In the review byEaton and Fessler (1994) structured flows are considered in whichit is easily seen that heavy particles are surrounding mixing layeror wakes vortices. The basic underlying mechanism is the follow-ing: due to their inertia, particles denser than the fluid tend to beejected from vortical structures while they are easily trapped byconvergent regions of the flow. The opposite behavior is expectedfor particles less dense than the carrier fluid. If these behaviorsare easily seen and understood on simple steady flows, there is awide gap to fill to directly apply them to homogeneous isotropicturbulent flows where, even if structures do exist, they do not nec-essarily live for long times.
There is now considerable evidence for a high correlation be-tween, for example, regions of high strain and low vorticity and re-gions of high concentration in heavy particles. Squires and Eaton(1990, 1991), Wang and Maxey (1993), Vaillancourt et al. (2002),and Tanaka et al. (2002) show simultaneous visualizations of vor-ticity and particle concentration isocontours obtained from spatialslices of direct numerical simulations that clearly show a strongcorrelation between these two quantities. More quantitative anal-ysis have of course been undertaken. They consist in representingstatistics of concentration conditioned to the levels of vorticity/strain. The latter are computed from one of the many criteria exist-ing to identify structures in turbulent flows. Squires and Eaton(1990, 1991) used a refined Q-criterion (Hunt et al., 1988) to
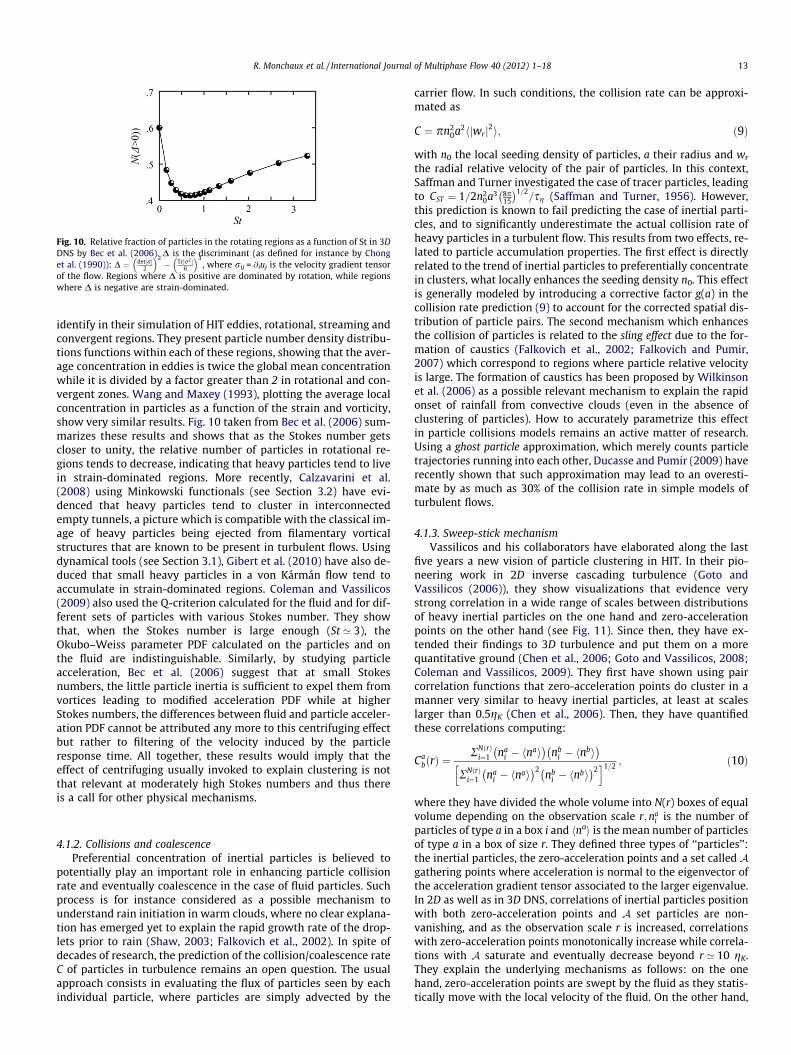
Fig. 10. Relative fraction of particles in the rotating regions as a function of St in 3DDNS by Bec et al. (2006). D is the discriminant (as defined for instance by Chonget al. (1990)): D ¼ det½r�
2
� �2� Tr½r2 �
6
� �3, where rij = @iuj is the velocity gradient tensor
of the flow. Regions where D is positive are dominated by rotation, while regionswhere D is negative are strain-dominated.
R. Monchaux et al. / International Journal of Multiphase Flow 40 (2012) 1–18 13
identify in their simulation of HIT eddies, rotational, streaming andconvergent regions. They present particle number density distribu-tions functions within each of these regions, showing that the aver-age concentration in eddies is twice the global mean concentrationwhile it is divided by a factor greater than 2 in rotational and con-vergent zones. Wang and Maxey (1993), plotting the average localconcentration in particles as a function of the strain and vorticity,show very similar results. Fig. 10 taken from Bec et al. (2006) sum-marizes these results and shows that as the Stokes number getscloser to unity, the relative number of particles in rotational re-gions tends to decrease, indicating that heavy particles tend to livein strain-dominated regions. More recently, Calzavarini et al.(2008) using Minkowski functionals (see Section 3.2) have evi-denced that heavy particles tend to cluster in interconnectedempty tunnels, a picture which is compatible with the classical im-age of heavy particles being ejected from filamentary vorticalstructures that are known to be present in turbulent flows. Usingdynamical tools (see Section 3.1), Gibert et al. (2010) have also de-duced that small heavy particles in a von Kármán flow tend toaccumulate in strain-dominated regions. Coleman and Vassilicos(2009) also used the Q-criterion calculated for the fluid and for dif-ferent sets of particles with various Stokes number. They showthat, when the Stokes number is large enough (St ’ 3), theOkubo–Weiss parameter PDF calculated on the particles and onthe fluid are indistinguishable. Similarly, by studying particleacceleration, Bec et al. (2006) suggest that at small Stokesnumbers, the little particle inertia is sufficient to expel them fromvortices leading to modified acceleration PDF while at higherStokes numbers, the differences between fluid and particle acceler-ation PDF cannot be attributed any more to this centrifuging effectbut rather to filtering of the velocity induced by the particleresponse time. All together, these results would imply that theeffect of centrifuging usually invoked to explain clustering is notthat relevant at moderately high Stokes numbers and thus thereis a call for other physical mechanisms.
4.1.2. Collisions and coalescencePreferential concentration of inertial particles is believed to
potentially play an important role in enhancing particle collisionrate and eventually coalescence in the case of fluid particles. Suchprocess is for instance considered as a possible mechanism tounderstand rain initiation in warm clouds, where no clear explana-tion has emerged yet to explain the rapid growth rate of the drop-lets prior to rain (Shaw, 2003; Falkovich et al., 2002). In spite ofdecades of research, the prediction of the collision/coalescence rateC of particles in turbulence remains an open question. The usualapproach consists in evaluating the flux of particles seen by eachindividual particle, where particles are simply advected by the
carrier flow. In such conditions, the collision rate can be approxi-mated as
C ¼ pn20a2hjwrj2i; ð9Þ
with n0 the local seeding density of particles, a their radius and wr
the radial relative velocity of the pair of particles. In this context,Saffman and Turner investigated the case of tracer particles, leadingto CST ¼ 1=2n2
0a3 8p15
� �1=2=sg (Saffman and Turner, 1956). However,
this prediction is known to fail predicting the case of inertial parti-cles, and to significantly underestimate the actual collision rate ofheavy particles in a turbulent flow. This results from two effects, re-lated to particle accumulation properties. The first effect is directlyrelated to the trend of inertial particles to preferentially concentratein clusters, what locally enhances the seeding density n0. This effectis generally modeled by introducing a corrective factor g(a) in thecollision rate prediction (9) to account for the corrected spatial dis-tribution of particle pairs. The second mechanism which enhancesthe collision of particles is related to the sling effect due to the for-mation of caustics (Falkovich et al., 2002; Falkovich and Pumir,2007) which correspond to regions where particle relative velocityis large. The formation of caustics has been proposed by Wilkinsonet al. (2006) as a possible relevant mechanism to explain the rapidonset of rainfall from convective clouds (even in the absence ofclustering of particles). How to accurately parametrize this effectin particle collisions models remains an active matter of research.Using a ghost particle approximation, which merely counts particletrajectories running into each other, Ducasse and Pumir (2009) haverecently shown that such approximation may lead to an overesti-mate by as much as 30% of the collision rate in simple models ofturbulent flows.
4.1.3. Sweep-stick mechanismVassilicos and his collaborators have elaborated along the last
five years a new vision of particle clustering in HIT. In their pio-neering work in 2D inverse cascading turbulence (Goto andVassilicos (2006)), they show visualizations that evidence verystrong correlation in a wide range of scales between distributionsof heavy inertial particles on the one hand and zero-accelerationpoints on the other hand (see Fig. 11). Since then, they have ex-tended their findings to 3D turbulence and put them on a morequantitative ground (Chen et al., 2006; Goto and Vassilicos, 2008;Coleman and Vassilicos, 2009). They first have shown using paircorrelation functions that zero-acceleration points do cluster in amanner very similar to heavy inertial particles, at least at scaleslarger than 0.5gK (Chen et al., 2006). Then, they have quantifiedthese correlations computing:
CabðrÞ ¼
RNðrÞi¼1 na
i � hnai� �
nbi � hnbi
� �RNðrÞ
i¼1 nai � hnai
� �2 nbi � hnbi
� �2h i1=2 ; ð10Þ
where they have divided the whole volume into N(r) boxes of equalvolume depending on the observation scale r;na
i is the number ofparticles of type a in a box i and hnai is the mean number of particlesof type a in a box of size r. They defined three types of ‘‘particles’’:the inertial particles, the zero-acceleration points and a set called Agathering points where acceleration is normal to the eigenvector ofthe acceleration gradient tensor associated to the larger eigenvalue.In 2D as well as in 3D DNS, correlations of inertial particles positionwith both zero-acceleration points and A set particles are non-vanishing, and as the observation scale r is increased, correlationswith zero-acceleration points monotonically increase while correla-tions with A saturate and eventually decrease beyond r ’ 10 gK.They explain the underlying mechanisms as follows: on the onehand, zero-acceleration points are swept by the fluid as they statis-tically move with the local velocity of the fluid. On the other hand,
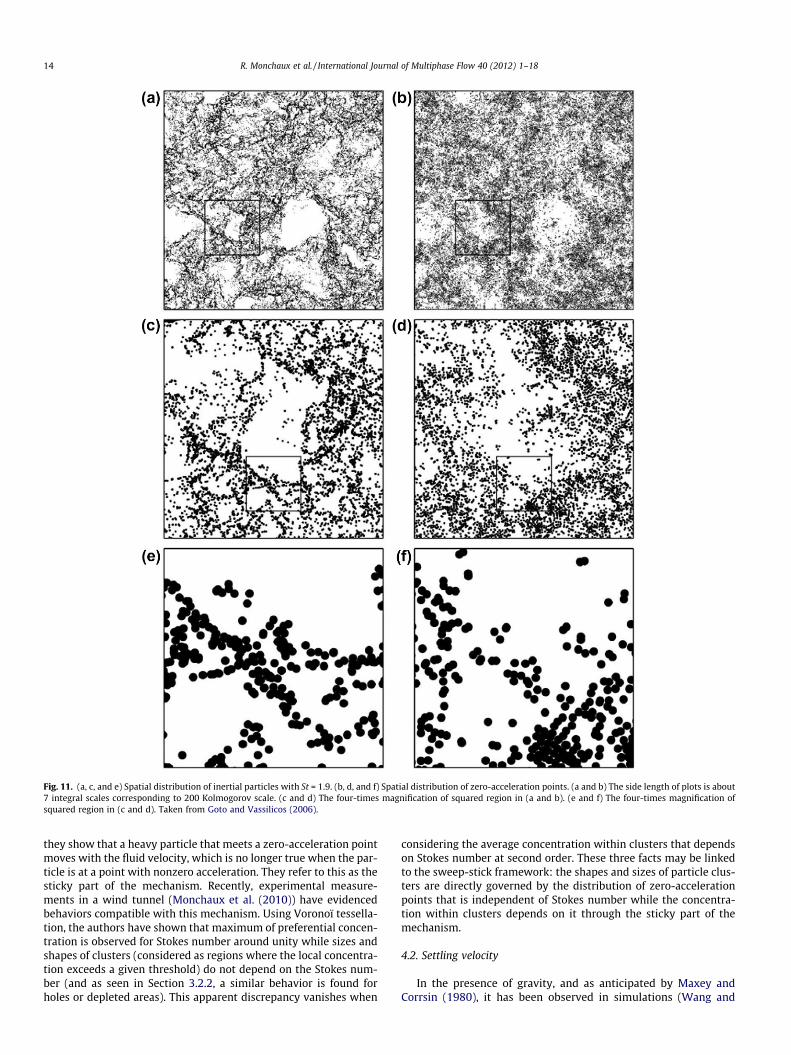
Fig. 11. (a, c, and e) Spatial distribution of inertial particles with St = 1.9. (b, d, and f) Spatial distribution of zero-acceleration points. (a and b) The side length of plots is about7 integral scales corresponding to 200 Kolmogorov scale. (c and d) The four-times magnification of squared region in (a and b). (e and f) The four-times magnification ofsquared region in (c and d). Taken from Goto and Vassilicos (2006).
14 R. Monchaux et al. / International Journal of Multiphase Flow 40 (2012) 1–18
they show that a heavy particle that meets a zero-acceleration pointmoves with the fluid velocity, which is no longer true when the par-ticle is at a point with nonzero acceleration. They refer to this as thesticky part of the mechanism. Recently, experimental measure-ments in a wind tunnel (Monchaux et al. (2010)) have evidencedbehaviors compatible with this mechanism. Using Voronoï tessella-tion, the authors have shown that maximum of preferential concen-tration is observed for Stokes number around unity while sizes andshapes of clusters (considered as regions where the local concentra-tion exceeds a given threshold) do not depend on the Stokes num-ber (and as seen in Section 3.2.2, a similar behavior is found forholes or depleted areas). This apparent discrepancy vanishes when
considering the average concentration within clusters that dependson Stokes number at second order. These three facts may be linkedto the sweep-stick framework: the shapes and sizes of particle clus-ters are directly governed by the distribution of zero-accelerationpoints that is independent of Stokes number while the concentra-tion within clusters depends on it through the sticky part of themechanism.
4.2. Settling velocity
In the presence of gravity, and as anticipated by Maxey andCorrsin (1980), it has been observed in simulations (Wang and
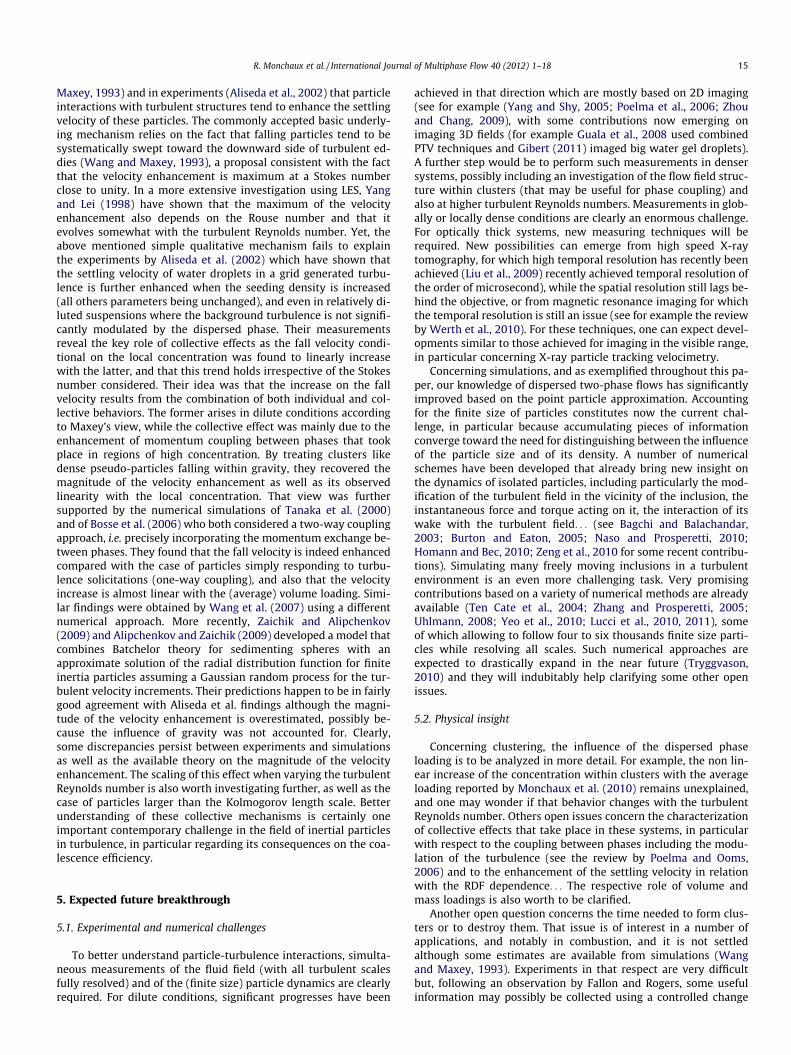
R. Monchaux et al. / International Journal of Multiphase Flow 40 (2012) 1–18 15
Maxey, 1993) and in experiments (Aliseda et al., 2002) that particleinteractions with turbulent structures tend to enhance the settlingvelocity of these particles. The commonly accepted basic underly-ing mechanism relies on the fact that falling particles tend to besystematically swept toward the downward side of turbulent ed-dies (Wang and Maxey, 1993), a proposal consistent with the factthat the velocity enhancement is maximum at a Stokes numberclose to unity. In a more extensive investigation using LES, Yangand Lei (1998) have shown that the maximum of the velocityenhancement also depends on the Rouse number and that itevolves somewhat with the turbulent Reynolds number. Yet, theabove mentioned simple qualitative mechanism fails to explainthe experiments by Aliseda et al. (2002) which have shown thatthe settling velocity of water droplets in a grid generated turbu-lence is further enhanced when the seeding density is increased(all others parameters being unchanged), and even in relatively di-luted suspensions where the background turbulence is not signifi-cantly modulated by the dispersed phase. Their measurementsreveal the key role of collective effects as the fall velocity condi-tional on the local concentration was found to linearly increasewith the latter, and that this trend holds irrespective of the Stokesnumber considered. Their idea was that the increase on the fallvelocity results from the combination of both individual and col-lective behaviors. The former arises in dilute conditions accordingto Maxey’s view, while the collective effect was mainly due to theenhancement of momentum coupling between phases that tookplace in regions of high concentration. By treating clusters likedense pseudo-particles falling within gravity, they recovered themagnitude of the velocity enhancement as well as its observedlinearity with the local concentration. That view was furthersupported by the numerical simulations of Tanaka et al. (2000)and of Bosse et al. (2006) who both considered a two-way couplingapproach, i.e. precisely incorporating the momentum exchange be-tween phases. They found that the fall velocity is indeed enhancedcompared with the case of particles simply responding to turbu-lence solicitations (one-way coupling), and also that the velocityincrease is almost linear with the (average) volume loading. Simi-lar findings were obtained by Wang et al. (2007) using a differentnumerical approach. More recently, Zaichik and Alipchenkov(2009) and Alipchenkov and Zaichik (2009) developed a model thatcombines Batchelor theory for sedimenting spheres with anapproximate solution of the radial distribution function for finiteinertia particles assuming a Gaussian random process for the tur-bulent velocity increments. Their predictions happen to be in fairlygood agreement with Aliseda et al. findings although the magni-tude of the velocity enhancement is overestimated, possibly be-cause the influence of gravity was not accounted for. Clearly,some discrepancies persist between experiments and simulationsas well as the available theory on the magnitude of the velocityenhancement. The scaling of this effect when varying the turbulentReynolds number is also worth investigating further, as well as thecase of particles larger than the Kolmogorov length scale. Betterunderstanding of these collective mechanisms is certainly oneimportant contemporary challenge in the field of inertial particlesin turbulence, in particular regarding its consequences on the coa-lescence efficiency.
5. Expected future breakthrough
5.1. Experimental and numerical challenges
To better understand particle-turbulence interactions, simulta-neous measurements of the fluid field (with all turbulent scalesfully resolved) and of the (finite size) particle dynamics are clearlyrequired. For dilute conditions, significant progresses have been
achieved in that direction which are mostly based on 2D imaging(see for example (Yang and Shy, 2005; Poelma et al., 2006; Zhouand Chang, 2009), with some contributions now emerging onimaging 3D fields (for example Guala et al., 2008 used combinedPTV techniques and Gibert (2011) imaged big water gel droplets).A further step would be to perform such measurements in densersystems, possibly including an investigation of the flow field struc-ture within clusters (that may be useful for phase coupling) andalso at higher turbulent Reynolds numbers. Measurements in glob-ally or locally dense conditions are clearly an enormous challenge.For optically thick systems, new measuring techniques will berequired. New possibilities can emerge from high speed X-raytomography, for which high temporal resolution has recently beenachieved (Liu et al., 2009) recently achieved temporal resolution ofthe order of microsecond), while the spatial resolution still lags be-hind the objective, or from magnetic resonance imaging for whichthe temporal resolution is still an issue (see for example the reviewby Werth et al., 2010). For these techniques, one can expect devel-opments similar to those achieved for imaging in the visible range,in particular concerning X-ray particle tracking velocimetry.
Concerning simulations, and as exemplified throughout this pa-per, our knowledge of dispersed two-phase flows has significantlyimproved based on the point particle approximation. Accountingfor the finite size of particles constitutes now the current chal-lenge, in particular because accumulating pieces of informationconverge toward the need for distinguishing between the influenceof the particle size and of its density. A number of numericalschemes have been developed that already bring new insight onthe dynamics of isolated particles, including particularly the mod-ification of the turbulent field in the vicinity of the inclusion, theinstantaneous force and torque acting on it, the interaction of itswake with the turbulent field. . . (see Bagchi and Balachandar,2003; Burton and Eaton, 2005; Naso and Prosperetti, 2010;Homann and Bec, 2010; Zeng et al., 2010 for some recent contribu-tions). Simulating many freely moving inclusions in a turbulentenvironment is an even more challenging task. Very promisingcontributions based on a variety of numerical methods are alreadyavailable (Ten Cate et al., 2004; Zhang and Prosperetti, 2005;Uhlmann, 2008; Yeo et al., 2010; Lucci et al., 2010, 2011), someof which allowing to follow four to six thousands finite size parti-cles while resolving all scales. Such numerical approaches areexpected to drastically expand in the near future (Tryggvason,2010) and they will indubitably help clarifying some other openissues.
5.2. Physical insight
Concerning clustering, the influence of the dispersed phaseloading is to be analyzed in more detail. For example, the non lin-ear increase of the concentration within clusters with the averageloading reported by Monchaux et al. (2010) remains unexplained,and one may wonder if that behavior changes with the turbulentReynolds number. Others open issues concern the characterizationof collective effects that take place in these systems, in particularwith respect to the coupling between phases including the modu-lation of the turbulence (see the review by Poelma and Ooms,2006) and to the enhancement of the settling velocity in relationwith the RDF dependence. . . The respective role of volume andmass loadings is also worth to be clarified.
Another open question concerns the time needed to form clus-ters or to destroy them. That issue is of interest in a number ofapplications, and notably in combustion, and it is not settledalthough some estimates are available from simulations (Wangand Maxey, 1993). Experiments in that respect are very difficultbut, following an observation by Fallon and Rogers, some usefulinformation may possibly be collected using a controlled change
16 R. Monchaux et al. / International Journal of Multiphase Flow 40 (2012) 1–18
in the external body force (possibly using charged particles in elec-tric fields). Simulations should decisively help in that matter.
A crucial issue lies in the behavior of particles much larger thanKolmogorov length scale. Not so many well controlled experimentsor simulations are available today for such conditions and there isthus ample room for new investigations aimed at unveiling funda-mental mechanisms. For example, the influence of the finite size ofparticles on the modulation of turbulence is on the way to be clar-ified for moderate particle Reynolds number inclusions (Lucci etal., 2011) but more is needed concerning wake-turbulence interac-tions (Zeng et al., 2010). In the same perspective, the interactionbetween a background turbulent field and the so-called particle-induced turbulence, the latter arising either from interactingwakes (Hunt and Eames, 2002; Riboux et al., 2010) or from parti-cle-particle interactions (Cartellier et al., 2009) is still poorlyunderstood.
In the context of the dynamics of individual particles, Lagrang-ian statistics have been very early identified as key quantities tounderstand the underlying coupling with the carrier turbulentflow. They are receiving much attention nowadays as they arebecoming accessible thanks to development of experimental andsimulation techniques, which allow to carefully investigate theforcing exerted by the turbulent field on the particle. These inves-tigations are particularly important for the implementation of rel-evant 1-way coupling models for the particle equation of motionbeyond the usual point particle approximation (Maxey and Riley,1983; Gatignol, 1983). Concerning clustering and preferential con-centration issues, Lagrangian statistics have also been recentlyidentified as potentially important. For instance, recent measure-ments of settling velocity by Aliseda et al. (2002) have shown theexistence of collective effects, resulting in a enhancement of thesettling velocity of clustered particles. The modeling of such collec-tive effects may be improved if quantities such as the local concen-tration field along particle trajectories and the typical residencetime of particles inside the clusters, could be quantified. Such res-idence time measurements were attempted by Aliseda et al. (2002)using LDA time series, but the trends were not clear enough to beexploited. Measurements of the concentration along a given parti-cle trajectory (which are by essence Lagrangian), which have beeninitiated by Monchaux et al. (2010), are expected to produce morereliable statistics, and thus should open the way to a better under-standing of the role of clusters on particle dispersion and on set-tling velocity enhancement. In this context, accessing Lagrangianstatistics of the particle dynamics (velocity and acceleration) con-ditioned to the local concentration along their trajectories remainsan important challenge. Let us indeed recall that the concentrationseen by the particles along their trajectory gives access to thedeformation tensor of particle positions: that Lagrangian variableis related to the particle compressibility and thus to the underlyingacceleration field (see Coleman and Vassilicos, 2009). Such a pro-gram is under way at LEGI (France) particularly with the aim toevaluate the intermittency of the particle number density.
Dynamical clusters tracking is a far more complex issue, muchmore difficult to achieve with present tools. As mentioned in theintroduction, important aspects for modeling and practical applica-tions are the existence of clusters and the study of their dynamicalbehavior. Using Voronoï diagrams for example, one can easily iden-tify clusters in 3D flows, the next step being to follow them to getaccess to relevant quantities as the residence time of particles, thedependence of their inner concentration and of their geometricalcharacteristics. To tackle these issues, it is required to have accessto large numbers of particles (at least hundreds of thousands) inthree dimensional flows. So far, no experimental facility canachieve these requirements because of the measurement sensitiv-ity to particle gains or losses using 2D illumination systems andnumerical simulations have to be employed.
All the new understanding arising from such investigationsshould benefit two-phase flow modeling and ultimately simula-tions useful for engineers.
References
Ahmed, A.M., Elghobashi, S., 2001. Direct numerical simulation of particledispersion in homogeneous turbulent shear flows. Phys. Fluids 13, 3346–3364.
Alipchenkov, V., Zaichik, L., 2009. Effect of particle clustering on the gravitationalsettling velocity in homogeneous turbulence. Fluid Dynam. 44, 397–404.
Aliseda, A., Cartellier, A., Hainaux, F., Lasheras, J.C., 2002. Effect of preferentialconcentration on the settling velocity of heavy particles in homogeneousisotropic turbulence. J. Fluid Mech. 468, 77–105.
Aly, A., Nicolleau, F., 2008. Dispersion of heavy particle sets in isotropic turbulenceusing kinematic simulation. Phys. Rev. E 78, 016310.
Ayyalasomayajula, S., Gylfason, A., Collins, L.R., Bodenschatz, E., Warhaft, Z., 2006.Lagrangian measurements of inertial particle accelerations in grid generatedwind tunnel turbulence. Phys. Rev. Lett. 97, 144507.
Bagchi, P., Balachandar, S., 2003. Effect of turbulence on the drag and lift of aparticle. Phys. Fluids 15, 3496–3513.
Balachandar, S., Eaton, J.K., 2010. Turbulent dispersed multiphase flow. Annu. Rev.Fluid Mech. 42, 111–133.
Balkovsky, E., Falkovich, G., Fouxon, A., 2001. Intermittent distribution of inertialparticles in turbulent flows. Phys. Rev. Lett. 86, 2790–2793.
Bec, J., 2005. Multifractal concentrations of inertial particles in smooth randomflows. J. Fluid Mech. 528, 255–277.
Bec, J., Biferale, L., Boffetta, G., Celani, A., Cencini, M., Lanotte, A., Musacchio, S.,Toschi, F., 2006. Acceleration statistics of heavy particles in turbulence. J. FluidMech. 550, 349–358.
Bec, J., Biferale, L., Cencini, M., Lanotte, A., Musacchio, S., Toschi, F., 2007a. Heavyparticle concentration in turbulence at dissipative and inertial scales. Phys. Rev.Lett. 98, 084502.
Bec, J., Biferale, L., Cencini, M., Lanotte, A.S., Toschi, F., 2010. Intermittency in thevelocity distribution of heavy particles in turbulence. J. Fluid Mech. 646, 527–536.
Bec, J., Celani, A., Cencini, M., Musacchio, S., 2005. Clustering and collisions of heavyparticles in random smooth flows. Phys. Fluids 17, 073301.
Bec, J., Cencini, M., Hillerbrand, R., 2007b. Clustering of heavy particles in randomself-similar flow. Phys. Rev. E 75, 025301.
Bec, J., Cencini, M., Hillerbrand, R., Turitsyn, K., 2008. Stochastic suspensions ofheavy particles. Phys. D Nonlinear Phenom. 237, 2037–2050.
Bodenschatz, E., 2009. Tech. rep., Max Planck Institute, Goettingen <http://www.euhit.org/i-gtf.html>.
Boffetta, G., de Lillo, F., Gamba, A., 2004. Large scale inhomogeneity of inertialparticles in turbulent flows. Phys. Fluids 16, L20–L23.
Bosse, T., Kleiser, L., Meiburg, E., 2006. Small particles in homogeneous turbulence:settling velocity enhancement by two-way coupling. Phys. Fluids 18, 027102.
Brown, G.L., Roshko, A., 1974. On density effects and large structure in turbulentmixing layers. J. Fluid Mech. 64, 775–816.
Burton, T., Eaton, J., 2005. Fully resolved simulations of particle turbulenceinteraction. J. Fluid Mech. 545, 67–111.
Calzavarini, E., Kerscher, M., Lohse, D., Toschi, F., 2008. Dimensionality andmorphology of particle and bubble clusters in turbulent flow. J. Fluid Mech.607, 13–24.
Calzavarini, E., Volk, R., Bourgoin, M., Lév eque, E., Pinton, J., Toschi, F., 2009.Acceleration statistics of finite-sized particles in turbulent flow: the role ofFaxén forces. J. Fluid Mech. 630, 179.
Cartellier, A., Andreotti, M., Sechet, P., 2009. Induced agitation in homogeneousbubbly flows at moderate particle Reynolds number. Phys. Rev. E 80, 065301.
Chareyron, D., 2009. Developpement de methodes instrumentales en vue de l’etudeLagrangienne de l’evaporation dans une turbulence homogene isotrope. Ph.D.thesis, Ecole Centrale de Lyon, France.
Chein, R., Chung, J., 1988. Simulation of particle dispersion in a two-dimensionalmixing layer. Am. Inst. Chem. Eng. J. 34, 946–954.
Chen, L., Goto, S., Vassilicos, J.C., 2006. Turbulent clustering of stagnation points andinertial particles. J. Fluid Mech. 553, 143–154.
Chong, M.S., Perry, A.E., Cantwell, B.J., 1990. A general classification of three-dimensional flow fields. Phys. Fluids 2, 765–777.
Chung, J., Troutt, T., 1988. Simulation of particle dispersion in an axisymmetric jet. J.Fluid Mech. 186, 199–222.
Coleman, S.W., Vassilicos, J.C., 2009. A unified sweep-stick mechanism to explainparticle clustering in two- and three-dimensional homogeneous, isotropicturbulence. Phys. Fluids 21, 113301.
Collins, L.R., Keswani, A., 2004. Reynolds number scaling of particle clustering inturbulent aerosols. New J. Phys. 6, 119.
Crowe, C.T., Chung, J.N., Troutt, T.R., 1988. Particle mixing in free shear flows. Prog.Energy Combust. Sci. 14, 171–194.
Crowe, C.T., Gore, R.A., Troutt, T.R., 1985. Particle dispersion by coherent structuresin free shear flows. Particul. Sci. Technol.: Int. J. 3, 149–158.
Damaschke, N., Nobach, H., Tropea, C., 2002. Optical limits of particle concentrationfor multi dimensional particle sizing techniques in fluid mechanics. Exp. Fluids32, 143–152.
Dietzel, M., Sommerfeld, M., 2010. LBM simulations on agglomerate transport anddeposition. In: Proc 6th International Symposium on multiphase Flow, Heat
R. Monchaux et al. / International Journal of Multiphase Flow 40 (2012) 1–18 17
Transfer and Energy conversion, in AIP Conference Proceedings. vol. 1207. pp.796–801.
Druzhinin, O.A., Elghobashi, S., 1999. On the decay rate of isotropic turbulence ladenwith microparticles. Phys. Fluids 11, 602–610.
Ducasse, L., Pumir, A., 2009. Inertial particle collisions in turbulent synthetic flows:quantifying the sling effect. Phys. Rev. E 80.
Eaton, J.K., Fessler, J.R., 1994. Preferential concentration of particles by turbulence.Int. J. Multiphase Flow 20, 169–209.
Elghobashi, S., Truesdell, G.C., 1992. Direct simulation of particle dispersion in adecaying isotropic turbulence. J. Fluid Mech. 242, 655–700.
Falkovich, G., Fouxon, A., Stepanov, M., 2003. Statistics of Turbulence-InducedFluctuations of Particle Concentration. Kluwer Academic, Dordrecht, pp. 155–158.
Falkovich, G., Fouxon, A., Stepanov, M.G., 2002. Acceleration of rain initiation bycloud turbulence. Nature 419, 151–154.
Falkovich, G., Pumir, A., 2004. Intermittent distribution of heavy particles in aturbulent flow. Phys. Fluids 16, L47–L50.
Falkovich, G., Pumir, A., 2007. Sling effect in collisions of water droplets in turbulentclouds. J. Atmos. Sci. 64, 4497.
Fallon, T., Rogers, C.B., 2002. Turbulence-induced preferential concentration of solidparticles in microgravity conditions. Exp. Fluids 33, 233–241.
Ferrante, A., Elghobashi, S., 2003. On the physical mechanisms of two-way couplingin particle-laden isotropic turbulence. Phys. Fluids 15, 315–329.
Fessler, J.R., Kulick, J.D., Eaton, J.K., 1994. Preferential concentration of heavyparticles in a turbulent channel flow. Phys. Fluids 6, 3742–3749.
Friedman, P.D., Katz, J., 2002. Mean rise rate of droplets in isotropic turbulence.Phys. Fluids 14, 3059–3073.
Gatignol, R., 1983. The Faxen formulae for a rigid particle in an unsteady non-uniform Stokes flow. J. Méc. Théorique Appl. 2, 143–160.
Gibert, M., 2011. private communication.Gibert, M., Xu, H., Bodenschatz, E., 2010. Where do heavy particles go in a turbulent
flow? ArXiv e-prints, arXiV:1002.3755v2.Goepfert, C., Marié, J., Chareyron, D., Lance, M., 2010. Characterization of a system
generating a homogeneous isotropic turbulence field by free synthetic jets. Exp.Fluids 48, 809–822.
Goto, S., Vassilicos, J.C., 2006. Self-similar clustering of inertial particles and zero-acceleration points in fully developed two-dimensional turbulence. Phys. Fluids18, 115103.
Goto, S., Vassilicos, J.C., 2008. Sweep-stick mechanism of heavy particle clustering influid turbulence. Phys. Rev. Lett. 100, 054503.
Guala, M., Liberzon, A., Hoyer, K., Tsinober, A., Kinzelbach, W., 2008. Experimentalstudy on clustering of large particles in homogeneous turbulent flow. J. Turbul.9, 34.
Gualtieri, P., Picano, F., Casciola, C.M., 2009. Anisotropic clustering of inertialparticles in homogeneous shear flow. J. Fluid Mech. 629, 25.
Hoelzer, A., Sommerfeld, M., 2006. Transport of non-spherical particles inturbulence: application of the LBM. In: Proc. ASME Fluids Eng. Div. SummerConf., vol. 1 of A and B. pp. 1739–1743.
Hogan, R.C., Cuzzi, J.N., 2001. Stokes and Reynolds number dependence ofpreferential particle concentration in simulated three-dimensional turbulence.Phys. Fluids 13, 2938–2945.
Hogan, R.C., Cuzzi, J.N., Dobrovolskis, A.R., 1999. Scaling properties of particledensity fields formed in simulated turbulent flows. Phys. Rev. E 60, 1674–1680.
Homann, H., Bec, J., 2010. Finite-size effects in the dynamics of neutrally buoyantparticles in turbulent flow. J. Fluid Mech. 651, 81–91.
Hong, M., Cartellier, A., Hopfinger, E., 2004. Characterization of phase detectionoptical probes for the measurement of the dispersed phase parameters insprays. Int. J. Multiphase Flow 30 (6), 615–648
Hunt, J., Eames, I., 2002. The disappearance of laminar and turbulent wakes incomplex flows. J. Fluid Mech. 457, 111–132.
Hunt, J.C.R., Wray, A.A., Moin, P., 1988. Eddies, streams, and convergence zones inturbulent flows. In: Studying Turbulence Using Numerical SimulationDatabases, vol. 2. pp. 193–208.
Hwang, W., Eaton, J.K., 2004. Creating homogeneous and isotropic turbulencewithout a mean flow. Exp. Fluids 36, 444–454.
Ijzermans, R.H.A., Meneguz, E., Reeks, M.W., 2010. Segregation of particles inincompressible random flows: singularities, intermittency and randomuncorrelated motion. J. Fluid Mech. 653, 99–136.
Ijzermans, R.H.A., Reeks, M.W., Meneguz, E., Picciotto, M., Soldati, A., 2009.Measuring segregation of inertial particles in turbulence by a full Lagrangianapproach. Phys. Rev. E 80, 015302.
Jin, G., He, G.-W., Wang, L.-P., 2010. Large-eddy simulation of turbulent collision ofheavy particles in isotropic turbulence. Phys. Fluids 22.
Kada, H., Hanratty, T., 1960. Effects of solids on turbulence in a fluid. AICHE J., 624–630.
Kobayashi, H., Masutani, S.M., Azuhata, S., Morita, S., 1992. Particle dispersion in aplane mixing layer with streamwise pressure gradient. JSME Int. J. 35, 29–37.
Kraichnan, R.H., 1968. Small-scale structure of a scalar field convected byturbulence. Phys. Fluids 11, 945–953.
Lazaro, B.J., Lasheras, J.C., 1992. Particle dispersion in the developing free shearlayer. I – Unforced flow. II – Forced flow. J. Fluid Mech. 235, 143–221.
Liu, X., Im, K.-S., Wang, J., Tate, M., Ercan, A., Schuette, D., Gruner, S., 2009. Fourdimensional visualisation of highly transient fuel sprays by microsecondquantitative X-ray tomography. Appl. Phys. Lett. 94, 084101.
Longmire, E.K., Eaton, J.K., 1992. Structure of a particle-laden round jet. J. FluidMech. 236, 217–257.
Lu, J., Nordsiek, H., Shaw, R., 2010. Clustering of settling charged particles inturbulence: theory and experiments. New J. Phys. 12, 123030.
Lucci, F., Ferrante, A., Elghobashi, S., 2010. Modulation of isotropic turbulence byparticles of Taylor length-scale size. J. Fluid Mech. 650, 5.
Lucci, F., Ferrante, A., Elghobashi, S., 2011. Is Stokes number an appropriateindicator for turbulence modulation by particles of Taylor-length-scale size?Phys. Fluids 23, 025101.
Luthi, B., 2003. Some Aspects of Strain, Vorticity and Material Element Dynamics asMeasured with 3D Particle Tracking Velocimetry in a Turbulent Flow. Ph.D.thesis, ETH. Znrich.
Maxey, M., Corrsin, S., 1980. Stokes spheres falling under gravity in cellular flow-fields. Bull. APS 25, paper EA6.
Maxey, M.R., 1987a. The gravitational settling of aerosol particles in homogeneousturbulence and random flow fields. J. Fluid Mech. 174, 441–465.
Maxey, M.R., 1987b. The motion of small spherical particles in a cellular flow field.Phys. Fluids 30, 1915–1928.
Maxey, M.R., Corrsin, S., 1986. Gravitational settling of aerosol particles in randomlyoriented cellular flow fields. J. Atmos. Sci. 43, 1112–1134.
Maxey, M.R., Riley, J.J., 1983. Equation of motion for a small rigid sphere in anonuniform flow. Phys. Fluids 26, 883–889.
Mei, R., 1996. Velocity fidelity of flow tracer particles. Exp. Fluids 22, 1–13.Monchaux, R., Bourgoin, M., Cartellier, A., 2010. Preferential concentration of heavy
particles: a Voronoi analysis. Phys. Fluids 22, 103304.Namenson, A., Antonsen Jr., T.M., Ott, E., 1996. Power law wave number spectra of
fractal particle distributions advected by flowing fluids. Phys. Fluids 8, 2426–2434.
Naso, A., Prosperetti, A., 2010. The interaction between a solid particle and aturbulent flow. New J. Phys. 12, 033040.
Olla, P., 2010. Preferential concentration versus clustering in inertial particletransport by random velocity fields. Phys. Rev. E 81, 016305.
Poelma, C., Dickson, W.B., Dickinson, M.H., 2006. Time-resolved reconstruction ofthe full velocity field around a dynamically-scaled flapping wing. Exp. Fluids 41,213–225.
Poelma, C., Ooms, G., 2006. Particle-turbulence interaction in a homogeneous,isotropic turbulent suspension. Appl. Mech. Rev. 59, 78.
Poelma, C., Westerweel, J., Ooms, G., 2007. Particlefluid interactions in grid-generated turbulence. J. Fluid Mech. 589, 315–351.
Qureshi, N.M., Arrieta, U., Baudet, C., Cartellier, A., Gagne, Y., Bourgoin, M., 2008.Acceleration statistics of inertial particles in turbulent flow. Eur. Phys. J. B 66,531–536.
Qureshi, N.M., Bourgoin, M., Baudet, C., Cartellier, A., Gagne, Y., 2007. Turbulenttransport of material particles: an experimental study of finite size effects. Phys.Rev. Lett. 99, 184502.
Reade, W.C., Collins, L.R., 2000. Effect of preferential concentration on turbulentcollision rates. Phys. Fluids 12, 2530–2540.
Riboux, G., Risso, F., Legendre, D., 2010. Experimental characterization of theagitation generated by bubbles rising at high Reynolds number. J. Fluid Mech.643, 509–539.
Saffman, P.G., Turner, J.S., 1956. On the collision of drops in turbulent clouds. J. FluidMech. 1.
Saito, T., Matsuda, K., Ozawa, Y., Oishi, S., Aoshima, S., 2009. Measurement of tinydroplets using a newly developed optical fibre probe micro-fabricated by afemtosecond pulse laser. Meas. Sci. Technol. 20, 114002.
Salazar, J.P.L.C., De Jong, J., Cao, L.J., Woodward, S.H., Meng, H., Collins, L.R., 2008.Experimental and numerical investigation of inertial particle clustering inisotropic turbulence. J. Fluid Mech. 600, 245–256.
Saw, E.W., Shaw, R.A., Ayyalasomayajula, S., Chuang, P.Y., Gylfason, Á., 2008. Inertialclustering of particles in high-Reynolds-number turbulence. Phys. Rev. Lett.100, 214501.
Schmitt, F.G., Seuront, L., 2008. Intermittent turbulence and copepod dynamics:increase in encounter rates through preferential concentration. J. Marine Syst.70, 263–272.
Shaw, R.A., 2003. Particle-turbulence interactions in atmospheric clouds. Annu. Rev.Fluid Mech. 35, 183–227.
Shaw, R.A., Kostinski, A.B., Larsen, M.L., 2002. Towards quantifying dropletclustering in clouds. Quart. J. Roy. Meteorol. Soc. 128, 1043–1057.
Siebert, H., Gerashchenko, S., Gylfason, A., Lehmann, K., Collins, L., Shaw, R., Warhaft,Z., 2010. Towards understanding the role of turbulence on droplets in clouds:in situ and laboratory measurements. Atmos. Res. 97, 426–443.
Soldati, A., Marchioli, C., 2009. Physics and modelling of turbulent particledeposition and entrainment: review of a systematic study. Int. J. MultiphaseFlow 35, 827–839.
Squires, K.D., Eaton, J.K., 1990. Particle response and turbulence modification inisotropic turbulence. Phys. Fluids 2, 1191–1203.
Squires, K.D., Eaton, J.K., 1991. Preferential concentration of particles by turbulence.Phys. Fluids 3, 1169–1178.
Tanaka, M., Komai, N., Maeda, Y., Hagiwara, Y., 2000. Two-way coupling effect onthe settling velocity of small heavy particles in homogeneous turbulence . In:et al., C.D. (Ed.), Advances in Turbulence VIII, Proc. 8th European TurbulenceConference. CIMNE, Barcelona.
Tanaka, M., Maeda, Y., Hagiwara, Y., 2002. Turbulence modification on ahomogeneous turbulent shear flow laden with small heavy particles. Int. J.Heat Fluid Flow 23, 615–626.
Tang, L., Wen, F., Yang, Y., Crowe, C.T., Chung, J.N., Troutt, T.R., 1992. Self-organizing particle dispersion mechanism in a plane wake. Phys. Fluids 4,2244–2251.
18 R. Monchaux et al. / International Journal of Multiphase Flow 40 (2012) 1–18
Ten Cate, A., Derksen, J., Portela, L., van den Akker, H., 2004. Fully resolvedsimulations of colliding monodisperse spheres in forced isotropic turbulence. J.Fluid Mech. 519, 233–271.
Tryggvason, G., 2010. Virtual motion of real particles. J. Fluid Mech. 650, 1–4.Uhlmann, M., 2008. Interface-resolved direct numerical simulation of vertical
particulate channel flow in the turbulent regime. Phys. Fluids 20, 053305.Vaillancourt, P.A., Yau, M.K., Bartello, P., Grabowski, W.W., 2002. Microscopic
approach to cloud droplet growth by condensation. Part II: Turbulence,clustering, and condensational growth. J. Atmos. Sci. 59, 3421–3435.
Vinkovic, I., Doppler, D., Lelouvetel, J., Buffat, M., 2011. Direct numerical simulationof particle interaction with ejections in turbulent channel flows. Int. J.Multiphase Flow 37, 187–197.
Wang, L.-P., Ayal, Grabowski, W., 2007. Effects of aerodynamic interactions on themotion of heavy particles in a bidisperse suspension. J. Turbul. 8, 25.
Wang, L.P., Maxey, M.R., 1993. Settling velocity and concentration distributionof heavy particles in homogeneous isotropic turbulence. J. Fluid Mech. 256,27–68.
Wang, Q., Squires, K., 1996. Large eddy simulation of particle-laden turbulentchannel flow. Phys. Fluids 8, 1207–1223.
Wen, F., Kamalu, N., Chung, J., Crowe, C., Troutt, T., 1992. Particle dispersion byvortex structures in plane mixing layers. Trans. ASME J. Fluids Eng. 114, 657–666.
Werth, C., Zhang, C., Brusseau, M., Oostrom, M., Baumann, T., 2010. A review of non-invasive imaging methods and applications in contaminant hydrogeologyresearch. J. Contam. Hydrol. 113, 1–24.
Wilkinson, M., Mehlig, B., Bezuglyy, V., 2006. Caustic activation of rain showers.Phys. Rev. Lett. 97, 048501.
Xu, H., Bodenschatz, E., 2008. Motion of inertial particles with size larger thanKolmogorov scale in turbulent flows. Phys. D: Nonlinear Phenom. 237, 2095–2100.
Yang, C.Y., Lei, U., 1998. The role of the turbulent scales in the settling velocity ofheavy particles in homogeneous isotropic turbulence. J. Fluid Mech. 371, 179–205.
Yang, T.S., Shy, S.S., 2005. Two-way interaction between solid particles andhomogeneous air turbulence: particle settling rate and turbulencemodification measurements. J. Fluid Mech. 526, 171–216.
Yeo, K., Dong, S., Climent, E., Maxey, M., 2010. Modulation of homogeneousturbulence seeded with finite size bubbles and particles. Int. J. Multiphase Flow36, 221–233.
Yoshimoto, H., Goto, S., 2007. Self-similar clustering of inertial particles inhomogeneous turbulence. J. Fluid Mech. 577, 275.
Zaichik, L., Simonin, O., Alipchenkov, V., 2010. Turbulent collision rates of arbitrary-density particles. Int. J. Heat Mass Transfer 53, 1613–1620.
Zaichik, L.I., Alipchenkov, V.M., 2009. Statistical models for predicting pairdispersion and particle clustering in isotropic turbulence and theirapplications. New J. Phys. 11, 103018.
Zeng, L., Balachandar, S., Najjar, F., 2010. Wake response of a stationary finite-sizedparticle in a turbulent channel flow. Int. J. Multiphase Flow 36, 403–422.
Zhang, Z., Botto, L., Prosperetti, A., 2006. Microstructural effects in a fully-resolvedsimulation of 1024 sedimenting spheres. In: Balachandar, S., Prosperetti, A.(Eds.), IUTAM Symposium on Computational Approaches to Multiphase Flow.Springer.
Zhang, Z., Prosperetti, A., 2005. A second-order method for three-dimensionalparticle simulation. J. Comput. Phys. 210, 292–324.
Zhou, Q., Chang, N., 2009. Experimental investigation of single particle settling inturbulence generated by oscillating grid. Chem. Eng. J. 149, 289–300.
Zimmermann, R., Xu, H., Gasteuil, Y., Bourgoin, M., Volk, R., Pinton, J., Bodenschatz,E., 2010. The Lagrangian exploration module: an apparatus for the study ofstatistically homogeneous and isotropic turbulence. Rev. Sci. Instrum. 81,055112.


![Strictly Biphasic Janus Structures DOI: 10.1002/anie.201309352 …nanofm.mse.gatech.edu/Papers/Strictly Biphasic Soft and... · 2014. 7. 3. · Janus particles,[35,37,38] the synthetic](https://img.pdfslide.fr/doc/110x75/60b8fa7bb2d0ae72b367ee44/strictly-biphasic-janus-structures-doi-101002anie201309352-biphasic-soft-and.jpg)