Embed Size (px)
Citation preview
ELSEVIER Journal of Magnetism and Magnetic Materials 196-197 (1999) 391-393
A ~ Journal of magneUsm
A ~ and magnetic
~ i materials
Anisotropic behaviour of permalloy wires using the giant magnetoimpedance effect
P. Ciureanu a'*, M. Britel a, D. M6nard a, C. Akyel b, A. Yelon a, M. Rouabhi c, R.W. C o c h r a n e c
aDdpartement de gdnie physique, Groupe de Recherche en Physique et Technologie des Couches Minces, Ecole Polytechnique, C.P. 6079, succ. Centre-ville, Montrdal, QC, Canada H3C 3A7
bD~partement de gbnie dlectrique, Ecole Polytechnique, C.P. 6079, succ. Centre-ville, Montrbal, QC, Canada H3C 3A7 CGroupe de Recherche en Physique et Technologie des Couches Minces, Dbpartement de physique, Universitb de Montreal, C.P. 6128, succ.
Centre-ville, Montreal, QC. Canada H3C 3J7
Abstract
Magnetoimpedance spectra of soft magnetic wires are characterized by peaks of the real part of the impedance at frequencies f0 which increase with the strength of the applied field, Ho. In the high-field region, f2 varies linearly with Ho, with a slope that depends on the saturation magnetization and the gyromagnetic ratio; in the low-field region, the plot
2 f6 -Ho shows a near-zero intercept at Ho = HK. Given the gyromagnetic ratio, both the saturation magnetization and the anisotropy field can be determined from the variation o f f 2 vs. Ho. © 1999 Elsevier Science B.V. All rights reserved.
Keywords: Magnetoimpedance; Ferromagnetic resonance; Anisotropy; Amorphous wires
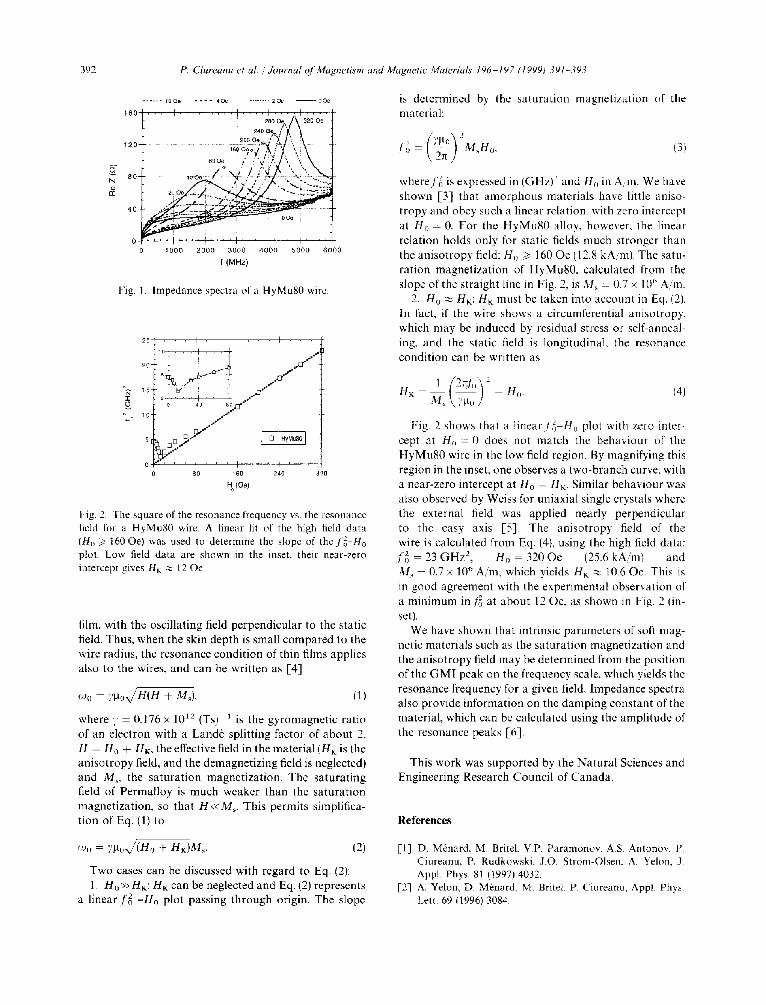
The giant magnetoimpedance (GMI) effect is due to the strong variation of the circumferential permeability, and thus of the skin depth, when a longitudinal DC magnetic field is applied to a magnetic conductor. Tech- nical saturation dominates the skin effect at low frequency, whereas ferromagnetic resonance (FMR) dominates the skin effect in the microwave range. High- frequency spectra of the impedance of a Permalloy wire, 44 ~tm in diameter and with a resistivity of 46 p,O cm, were measured using a shorted coaxial line with the wire as inner conductor, connected to a network analyzer. Details of the experimental technique are given in Ref. [1]. These spectra show characteristic peaks of the real part of the wire impedance (Fig. 1), related to magnetic losses in the material. The peaks shift towards higher
*Corresponding author. Fax: + 1-514-340-3706; e-mail: [email protected].
frequency for stronger fields. The position of the peak, marked with a dot on Fig. 1, defines the resonance frequency, fo, for a given field, Ho.
Ferromagnetic resonance occurs in samples submitted simultaneously to a longitudinal static field, Ho, which causes saturation of the sample and precession of the spins, and a perpendicular oscillating field, H(t), which provides the energy to maintain the precession and pro- duces the resonance. We have shown [2] that models of GMI and of FMR are formally equivalent. The field geometry for the giant magnetoimpedance effect in a magnetic wire used as a central conductor in a coaxial line in which a microwave signal is propagating can be mapped onto that of the ferromagnetic resonance in a thin magnetic film submitted to fields Ho and H(t) [3]. In fact, the oscillating field H(t) is circumferential, as is the magnetic field in a TEM propagating mode. Due to the skin effect, these fields are present only in a thin outer shell of the wire. By unrolling the outer shell into a plane, we obtain the same field configuration as for a planar
0304-8853/99/$ - see front matter © 1999 Elsevier Science B.V. All rights reserved. PII: S0304-8 8 5 3 ( 9 8 ) 0 0 7 7 0 - 7
392 P. Ciureanu et al. / Journal o[' Magnetism and Magnetic Materials 196 - 197 (1999) 391-393
...... lOOe . . . . 40e ........ 20e OOe
16o . . . . I . . . . I . . . . ! . . . . l . . . , ~ 1 . . . . 280 O~ ~/~3320 Oe
240 0% ,"'~ \ 12 o - - ~oo 0 , % / )~ / ' . . \
' -°w x ' . , \ . . . . , .. v ..~,~, ".., ,. \
~" 8 o - 4oc~ r ~ . . e, ,
4o- i ~ ' - - ' ,," . , ' , "--,.F-,--'::
0 . . . . i . . . . I . . . . I . . . . I . . . . I . . . . 0 1000 2000 3000 4000 5 0 0 0 6000
f (MHz)
Fig. 1. Impedance spectra of a HyMuS0 wire.
2 5 . , I , , I , , . I , .
I~o , , ! , , . , , 20 ~ ,~""
s . . . . . ~ .,[7'""
, s 7 e ..... 0
0 t o 40 8o .{2""" ' ° ~qD.9....~ ........
0F ' ' ' ' I ' ' ' I ' ' ' I ' ' ' 0 8 0 ~ 6 0 a0 320
H o (Oe)
Fig. 2. The square of the resonance frequency vs. the resonance field for a HyMu80 wire. A linear fit of the high field data (Ho ~> 160 Oe) was used to determine the slope of the f o - H o plot, Low field data are shown in the inset, their near-zero intercept gives HK ~ 12 Oe.
film, with the oscillating field perpendicular to the static field. Thus, when the skin depth is small compared to the wire radius, the resonance condi t ion of thin films applies also to the wires, and can be wri t ten as [4]
o00 = 7 P o v / H ( H + M~), (1)
where 7 = 0.176 x 10¹² (Ts) 1 is the gyromagnet ic rat io of an electron with a Land6 split t ing factor of abou t 2, H = Ho + HK, the effective field in the mater ia l (HK is the an iso t ropy field, and the demagnet iz ing field is neglected) and M~ the sa tu ra t ion magnet izat ion. The sa tura t ing field of Permal loy is much weaker than the sa tura t ion magnet iza t ion, so tha t H<<M~. This permits simplifica- t ion of Eq. (1) to
~Oo = 7gox/(Ho + HK)M~. (2)
Two cases can be discussed with regard to Eq. (2): 1. Ho>>HK: HK can be neglected and Eq. (2) represents
a l inear , /2 -Ho plot passing t h r ough origin. The slope
is determined by the sa tura t ion magnet iza t ion of the material:
7 st, \ ~ ) (3)
wheref2o is expressed in (GHz) 2 and Ho in A m . We have shown [3] tha t a m o r p h o u s mater ia ls have little aniso- tropy and obey such a l inear relation, with zero intercept at Ho = 0. For the H y M u 8 0 alloy, however, the l ineal relat ion holds only for static fields much s t ronger than the an iso t ropy field: Ho >~ 160 Oe (12.8 kA/m). The satu- ra t ion magnet iza t ion of HyMu80, calculated from the slope of the straight line in Fig. 2, is M~ = 0.7 x 10 ~' A/re.
2. Ho ~ HK: HK must be taken into account in Eq. (2). In fact, if the wire shows a circumferential anisotropy, which may be induced by residual stress or self-anneal- ing, and the static field is longitudinal , the resonance condi t ion can be writ ten as
1 (2rtti~) e - Ho. HK = ~ \ ] ' P - O J (4i
Fig. 2 shows that a l i n e a r f o - H o plot with zero inter- cept at Ho = 0 does not match the behaviour of the H y M u 8 0 wire in the low field region. By magnifying this region in the inset, one observes a two-branch curve, with a near-zero intercept at Ho = HK. Similar behaviour was also observed by Weiss for uniaxial single crystals where the external field was applied nearly perpendicular to the easy axis [5]. The anisot ropy field of the wire is calculated from Eq. (4), using the high field data: .1"2o = 23 G H z 2, Ho 320 Oe (25.6 kA/m) and Air = 0.7 x 10 ~' A/m, which yields HK ~ 10 .60e . This is in good agreement with the exper imental observat ion of a m in imum in /~ at abou t 12 Oe, as shown in Fig. 2 (in- set).
We have shown that intrinsic parameters of soft mag- netic materials such as the sa tura t ion magnet iza t ion and the anisot ropy field may be determined from the posi t ion of the G M I peak on the frequency scale, which yields the resonance frequency for a given field. Impedance spectra also provide informat ion on the damping cons tan t of the material , which can be calculated using the ampl i tude of the resonance peaks [6].
This work was suppor ted by the Na tu ra l Sciences and Engineer ing Research Counci l of Canada.
R e f e r e n c e s
[1] D. Manard, M. Britel. V.P. Paramonov, A.S. Antonov, P. Ciureanu, P. Rudkowski, J.O. Str6m-Olsen. A. Yelon, J. Appl. Phys. 81 (1997) 4032.
[2] A. Yelon, D. M6nard, M. Britel, P. Ciureanu, Appl. Phys. Lett. 69 (1996) 3084.
P. Ciureanu et al. / Journal of Magnetism and Magnetic Materials 196-197 (1999) 391-393 393
[3] P. Ciureanu, M. Britel, D. M6nard, A. Yelon, C. Akyel, M. Rouabhi, R.W. Cochrane, J. Appl. Phys. 83 (1998) 6563.
1.4] D. Craik, Magnetism, Wiley, New York, 1995, p. 282.
1-5] S.V. Vonsovskii (Ed.), Ferromagnetic Resonance, Per- gamon, Oxford, 1968, p. 34.
1.6] D. M~nard, M. Britel, P. Ciureanu, A. Yelon, M. Rouabhi, R.W. Cochrane, J. Magn. Magn. Mater., in press.