Embed Size (px)
Citation preview
Thin Solid Films 455–456(2004) 722–725
0040-6090/04/$ - see front matter� 2004 Elsevier B.V. All rights reserved.doi:10.1016/j.tsf.2004.02.005
Application of FTIR ellipsometry to detect and classify microorganisms
Enric Garcia-Caurel*, Jacqueline Nguyen, Laurent Schwartz, Bernard Drevillon´
Laboratoire de Physique des Interfaces et des Couches Minces (UMR 7647) Ecole Polytechnique, 91128, Palaiseau, Cedex, France´
Abstract
Here is presented a new method to detect and to classify microorganisms from their ellipsometric response in the mid-infraredrange(2–12mm) measured by FTIR ellipsometry. Apart from the ellipsometric measurements, the performance of the methodalso stands on the simplicity of sample preparation and data analysis. In the mid-infrared range each molecule exhibits acharacteristic absorption fingerprint, thus making ellipsometry chemically selective. FTIR ellipsometry is used here for the firsttime to analyze bacteria grown in culture media. Sample preparation is extremely simple and consists of the evaporation of adroplet of an aqueous suspension of microorganisms on a planar surface. Ellipsometric measurements are performed on the solidresidue left on the surface after the evaporation of the droplet. Data analysis can be divided in two steps. First, simplification ofthe measured spectra by principal component analysis(PCA), which is a common multivariate statistical technique used toeliminate redundant information. Second, classification of the simplified spectra using a standard clustering method. As a result,we show how this method can be employed to discriminate and identify bacteria at the species level. The results of this experimentare very promising for the application of ellipsometry for analytical purposes in biochemistry and in medicine.� 2004 Elsevier B.V. All rights reserved.
Keywords: Ellipsometry; FTIR; bacteria detection; multivariate; Principal component analysis
1. Introduction
Microbiologic detection and identification representsa major problem in diverse clinical activities. Standardmicrobiologic analysis is effective but has the drawbackof requiring sample cultivation periods(48–72 h) toolong to be practical. We believe FTIR ellipsometry tobe an adequate optical technique because of its non-invasiveness and high sensitivity to small amounts ofmolecules deposited on a surfacew1x. In this article wepresent a new method to detect and to classify micro-organisms from their spectral response in the infraredmeasured by means of FTIR ellipsometry. This methodis based on a statistical multivariate treatment of theinformation contained in each spectrum. The methodallows to group spectra corresponding to a given micro-organism in a well defined clusters. As such, it ispossible to build a reference database of spectra corre-sponding to diverse microorganisms and then, to usethis database to identify possibly different microorgan-sims from their respective spectra. Our method is appli-cable a priori to any kind of microorganism. The article
*Corresponding author. Tel.:q33-1-6933-3214; fax:q33-1-6933-3006.
E-mail address: [email protected](E. Garcia-Caurel).
is structured in two parts, the first one is descriptive andcovers some key concepts on data treatment and samplepreparation. The second part shows an application exam-ple on which we demonstrate how to build a referencedatabase from a set of ‘known’ spectra and then how touse it to identify ‘unknown’ bacteria from another setof spectra.
2. Materials and methods
2.1. Sample preparation
Six different bacteria species(Bacilus subtilis, Citro-bacter diversus, Escherichia coli, Enterococcus faecalis,Pantogea agglomerans and Proteus vulgaris) weregrown in separate standard culture media for a periodof 48 h. After that, a portion of the grown colonies werediluted in pure water and double centrifuged to takeaway the culture media. The concentration of bacteriain water was approximately 10 individualsyml. Sample9
preparation consisted of depositing a drop of 100ml ofsolution on the bare surface of a substrate and leavingit to dry at room temperature. The substrates werecrystal silicon wafers. Ellipsometric measurements weredone in the residuals left on the silicon surfaces after
723E. Garcia-Caurel et al. / Thin Solid Films 455 –456 (2004) 722–725
Table 1The table specifies the names of the bacteria used for our example,the number of measurements done over each kind of bacteria andfinally the label of each measurement
Bacteria name No of samples Samples nameyday
B. subtilis 3 Bsub1, Bsub2, Bsub3yDay 1C. diversus 3 Cdiver1, Cdiver2, Cdiver3yDay 1E. coli 3 Ecoli1, Ecoli2, Ecoli3yDay 2E. faecalis 3 Efaec1, Efaec2, Efaec3yDay 2P. agglomerans 5 Paggl1, Paggl2, Paggl3yDay 3
Paggl_X1, Paggl_X2yDay 4P. vulgaris 3 Pvulg1, Pvulg2, Pvulg3yDay 3
Measurements marked without X were used to build the database.Measurements marked X were used as unknown measurements to beclassed within the database. The last column also includes the daywhen the samples where prepared and measured.
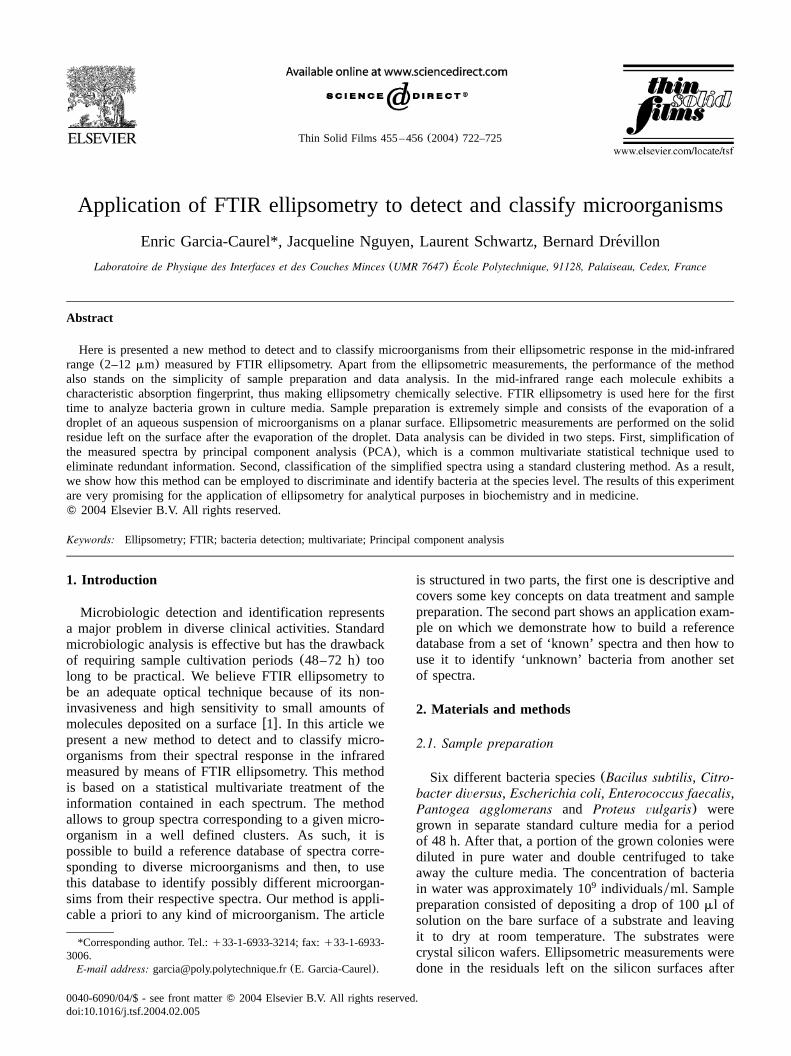
Fig. 1. ExperimentalImD and Im0D spectra corresponding to sampleEcoli1.
evaporation. The shape of the evaporates was circularwith an average surface of 1"0.1 cm , i.e. large enough2
with respect to that of the IR beam spot(10 mm ). The2
sample preparation and the measuring process spannedseveral days. All details concerning the days on whicheach sample was prepared are summarized in Table 1.
2.2. Ellipsometric measurements and FTIR ellipsometer
Working with ellipsometricC andD spectra has thedrawback that a baseline correction must be done forboth magnitudes. To overcome this problem, we evalu-ated the optical density, definedw2x as:
B E¯tanC ¯C FDsln qj DyD , (1)Ž .D GtanC
for a semi-infinite substrate coated with a single layer.The bars overC andD indicate that these magnitudescorrespond to the bare substrate. The optical densityeliminates spectral features caused by the substrate,therefore enhancing those due to the coating. We cal-culated the second derivative of the imaginary part ofD, Im0D, because it minimizes the influence of thethickness of the deposit of bacteria. The signature leftby an absorption appears inIm0D as a sharp inflectioncentered at zero, which is one of the mathematicalconditions to carry out ulterior statistical analyses. Theoptical configuration and the calibration of the FTIRellipsometer are given elsewherew3,4x. Random noise isthe major challenge for posterior analysis. In order tominimize it, each spectrum was taken after averaging5000 independent measurements. As a result, weobtained spectra with a signal to noise ratio better than100. This allowed us to calculate the derivatives ofImDusing the Savitzky–Golay method with 5 points withouthaving major problems concerning noise propagation.
2.3. Data treatment
(a) Data normalization: Data was standardized bynormalizing all the spectra. We took as a reference thevalue of the maximum preceding the inflection centeredat approximately 1550 cm .(b) Data simplification:y1
Before applying the clustering procedure to a givenensemble of spectra, we applied a principal componentanalysis (PCA) w5,6x. PCA analysis allowed us totransform a given spectrum composed by approximately360 points to a new one composed of only 6 points,thus dramatically reducing its complexity.(c) DataClustering: Classification of the simplified spectra wasdone following a hierarchical clustering schema. Wefound that the Ward’s methodw5x gave excellent results.We took the Euclidian norm as a criterion to quantifythe differences between spectra. All calculus were donewith the commercial software STATISTICA.
3. Results
In Fig. 1, there are representedImD and Im0D corre-sponding to theEcoli1. In ImD several inflections appeardue to the absorptions related to the diverse chemicalbonds of the bacteria, and a background whose shapedepends on the sample preparation conditions. In theIm0D the background has been removed and only theinflections due to absorptions present inImD are appar-ent. What makes a spectrum of a given bacteria uniqueare the relative positions and intensities of the absorp-tions. There are several prominent absorptions thatappear systematically in all spectra that can be assignedto known vibrations of chemical bonds present in mol-ecules playing a key biologic rolew7–9x such as poly-saccharides and nucleic acids(900–1200 cm ) ory1
lipids and proteins(bands at 1550 and 1650 cm).y1
724 E. Garcia-Caurel et al. / Thin Solid Films 455 –456 (2004) 722–725
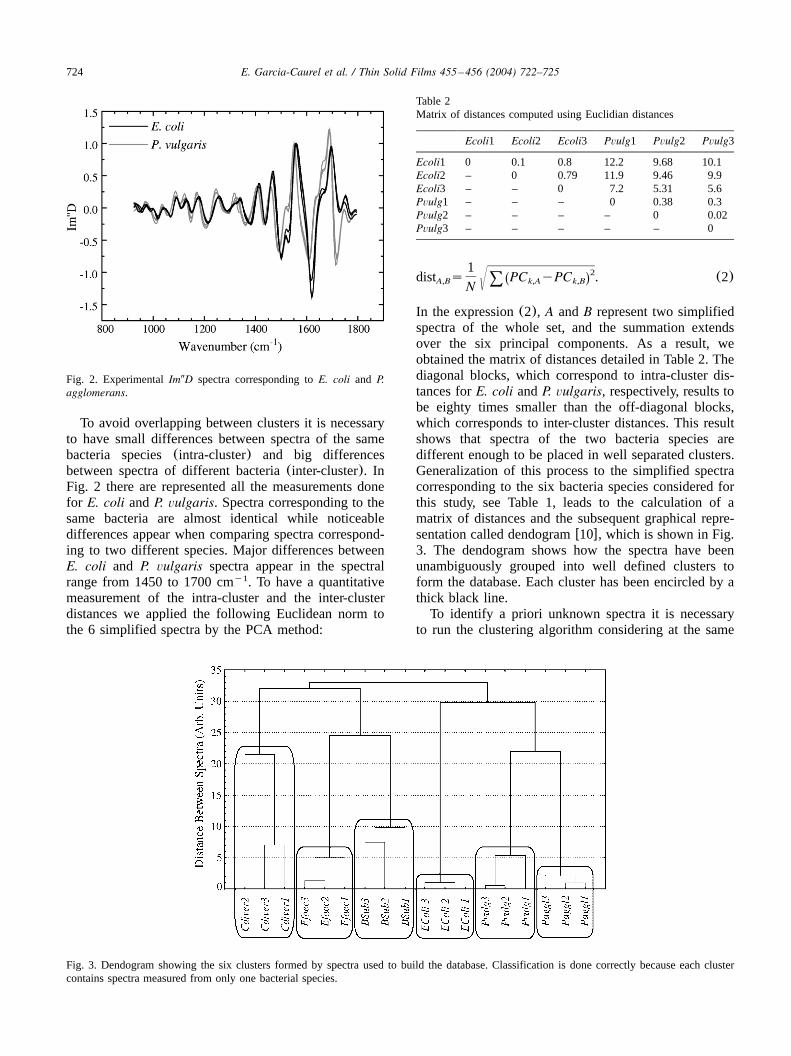
Fig. 2. ExperimentalIm0D spectra corresponding toE. coli and P.agglomerans.
Table 2Matrix of distances computed using Euclidian distances
Ecoli1 Ecoli2 Ecoli3 Pvulg1 Pvulg2 Pvulg3
Ecoli1 0 0.1 0.8 12.2 9.68 10.1Ecoli2 – 0 0.79 11.9 9.46 9.9Ecoli3 – – 0 7.2 5.31 5.6Pvulg1 – – – 0 0.38 0.3Pvulg2 – – – – 0 0.02Pvulg3 – – – – – 0
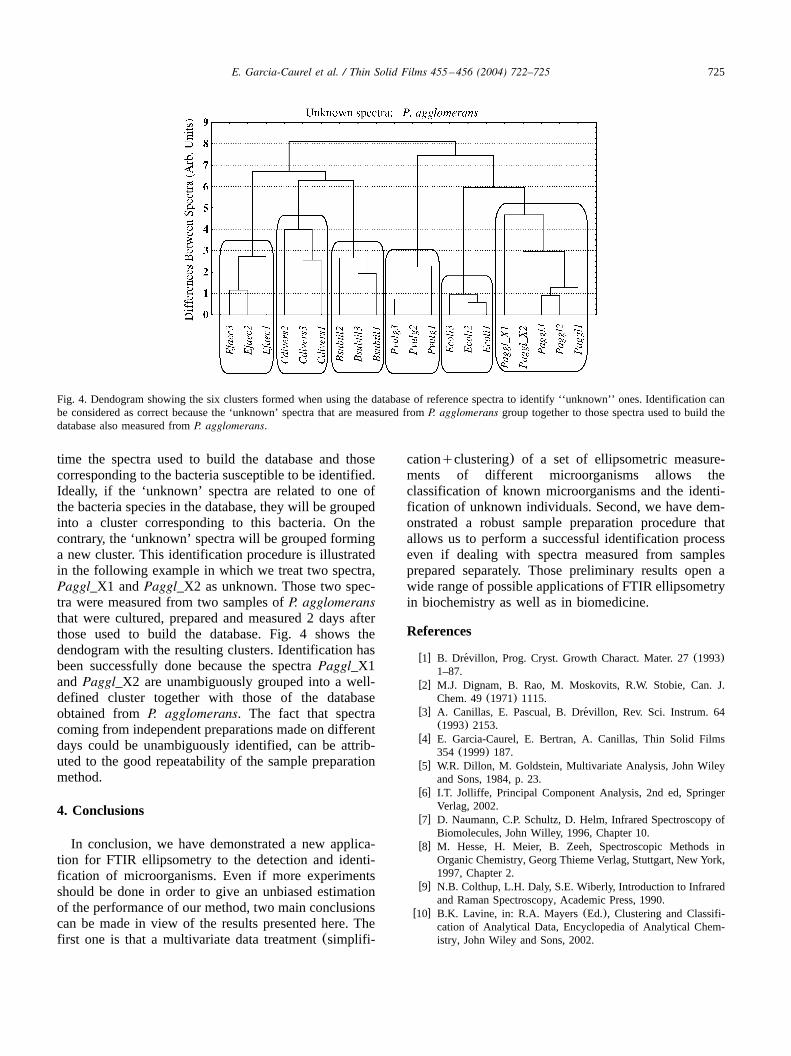
Fig. 3. Dendogram showing the six clusters formed by spectra used to build the database. Classification is done correctly because each clustercontains spectra measured from only one bacterial species.
To avoid overlapping between clusters it is necessaryto have small differences between spectra of the samebacteria species(intra-cluster) and big differencesbetween spectra of different bacteria(inter-cluster). InFig. 2 there are represented all the measurements donefor E. coli andP. vulgaris. Spectra corresponding to thesame bacteria are almost identical while noticeabledifferences appear when comparing spectra correspond-ing to two different species. Major differences betweenE. coli and P. vulgaris spectra appear in the spectralrange from 1450 to 1700 cm . To have a quantitativey1
measurement of the intra-cluster and the inter-clusterdistances we applied the following Euclidean norm tothe 6 simplified spectra by the PCA method:
1 2dist s PC yPC . (2)Ž .A,B k,A k,By8N
In the expression(2), A andB represent two simplifiedspectra of the whole set, and the summation extendsover the six principal components. As a result, weobtained the matrix of distances detailed in Table 2. Thediagonal blocks, which correspond to intra-cluster dis-tances forE. coli andP. vulgaris, respectively, results tobe eighty times smaller than the off-diagonal blocks,which corresponds to inter-cluster distances. This resultshows that spectra of the two bacteria species aredifferent enough to be placed in well separated clusters.Generalization of this process to the simplified spectracorresponding to the six bacteria species considered forthis study, see Table 1, leads to the calculation of amatrix of distances and the subsequent graphical repre-sentation called dendogramw10x, which is shown in Fig.3. The dendogram shows how the spectra have beenunambiguously grouped into well defined clusters toform the database. Each cluster has been encircled by athick black line.To identify a priori unknown spectra it is necessary
to run the clustering algorithm considering at the same
725E. Garcia-Caurel et al. / Thin Solid Films 455 –456 (2004) 722–725
Fig. 4. Dendogram showing the six clusters formed when using the database of reference spectra to identify ‘‘unknown’’ ones. Identification canbe considered as correct because the ‘unknown’ spectra that are measured fromP. agglomerans group together to those spectra used to build thedatabase also measured fromP. agglomerans.
time the spectra used to build the database and thosecorresponding to the bacteria susceptible to be identified.Ideally, if the ‘unknown’ spectra are related to one ofthe bacteria species in the database, they will be groupedinto a cluster corresponding to this bacteria. On thecontrary, the ‘unknown’ spectra will be grouped forminga new cluster. This identification procedure is illustratedin the following example in which we treat two spectra,Paggl_X1 andPaggl_X2 as unknown. Those two spec-tra were measured from two samples ofP. agglomeransthat were cultured, prepared and measured 2 days afterthose used to build the database. Fig. 4 shows thedendogram with the resulting clusters. Identification hasbeen successfully done because the spectraPaggl_X1andPaggl_X2 are unambiguously grouped into a well-defined cluster together with those of the databaseobtained fromP. agglomerans. The fact that spectracoming from independent preparations made on differentdays could be unambiguously identified, can be attrib-uted to the good repeatability of the sample preparationmethod.
4. Conclusions
In conclusion, we have demonstrated a new applica-tion for FTIR ellipsometry to the detection and identi-fication of microorganisms. Even if more experimentsshould be done in order to give an unbiased estimationof the performance of our method, two main conclusionscan be made in view of the results presented here. Thefirst one is that a multivariate data treatment(simplifi-
cationqclustering) of a set of ellipsometric measure-ments of different microorganisms allows theclassification of known microorganisms and the identi-fication of unknown individuals. Second, we have dem-onstrated a robust sample preparation procedure thatallows us to perform a successful identification processeven if dealing with spectra measured from samplesprepared separately. Those preliminary results open awide range of possible applications of FTIR ellipsometryin biochemistry as well as in biomedicine.
References
w1x B. Drevillon, Prog. Cryst. Growth Charact. Mater. 27(1993)´1–87.
w2x M.J. Dignam, B. Rao, M. Moskovits, R.W. Stobie, Can. J.Chem. 49(1971) 1115.
w3x A. Canillas, E. Pascual, B. Drevillon, Rev. Sci. Instrum. 64´(1993) 2153.
w4x E. Garcia-Caurel, E. Bertran, A. Canillas, Thin Solid Films354 (1999) 187.
w5x W.R. Dillon, M. Goldstein, Multivariate Analysis, John Wileyand Sons, 1984, p. 23.
w6x I.T. Jolliffe, Principal Component Analysis, 2nd ed, SpringerVerlag, 2002.
w7x D. Naumann, C.P. Schultz, D. Helm, Infrared Spectroscopy ofBiomolecules, John Willey, 1996, Chapter 10.
w8x M. Hesse, H. Meier, B. Zeeh, Spectroscopic Methods inOrganic Chemistry, Georg Thieme Verlag, Stuttgart, New York,1997, Chapter 2.
w9x N.B. Colthup, L.H. Daly, S.E. Wiberly, Introduction to Infraredand Raman Spectroscopy, Academic Press, 1990.
w10x B.K. Lavine, in: R.A. Mayers(Ed.), Clustering and Classifi-cation of Analytical Data, Encyclopedia of Analytical Chem-istry, John Wiley and Sons, 2002.


![What can sodium MRI reveal about sodium accumulation in ... · to Wallerian degeneration [17]. ... be combined with sodium MRI, which is more prone to detect the occurrence and to](https://img.pdfslide.fr/doc/110x75/5e74deecf0f7f2057b5043aa/what-can-sodium-mri-reveal-about-sodium-accumulation-in-to-wallerian-degeneration.jpg)


![三tt口 ],11...sakuntala.saijai@gmail.com [Background] Organic hydroponics consist of nitrification process enriching nitrifying-microorganisms and crop cultivation maintaining the](https://img.pdfslide.fr/doc/110x75/5e7c57d0bfdfb06d7b179f70/tt-11-sakuntalasaijaigmailcom-background-organic-hydroponics-consist.jpg)