Embed Size (px)
Citation preview
BIOCHIMIE, 1974, 56, 61-76.
Conformational studies on muscular parvalbumins.
II. Nuclear magnetic resonance analysis (*).
Joseph PARELLO, Adrien CAVE, Pedro PUIGDOMENECH ('*), Catherine MAURY ( * ' ' ) , Jean-Paul CAPONY and Jean-Francois PECn~RE.
Equipe de Recherche de Biophysique n ° 140 (CNRS), Universitd des Sciences et Techniques du Langnedoc, 34000 Montpellier, France
Ddpartement de Biochimie Macromol~culaire du CNRS, Route de Mende, B.P. 5051, 34033 Montpellier - - Cedex, France.
(5-6-1973).
Summary. - - NMR spectroscopy (proton resonance at 100 and 270 MHz) has been used to observe conformational features in muscular parvalbumins from hake (Merluccius merluccius) and carp (Cyprinus carpio), in the native state, in the denatured state (6M guanidinium chloride or heating) and after almost complete removal of calcium ions. From these observations it appears that the removal of the strongly bound calcium ions leads to a structure very similar to that obtained by chemical or thermal denaturation. On the other hand, the NMR spectrum of the native carp parvalbumins can be interpreted in the light of the recent X-Ray data obtained elsewhere for this protein. Some aspects of the primary structure of these parvalbumins, such as the presence of an N-terminal acetyl residue, have also been investigated with the NMR technique.
INTRODU,CTION.
Previous results of optical measurements [1, 2] have ind ica ted the presence in several muscular pa rva lbumins f rom lower ver tebra tes of a high degree of order (ca 40 p. cent hel ic i ty) , a s i tuation w h i c h is amply documented in the recent X-Ray analysis of the crystals of one of the components (pI 4.25) f rom carp muscle [3, 4]. The lat ter stu- dies have also conf i rmed the globular charac te r of these prote ins w h i c h was h i ther to in fe r red f rom h y d r o d y n a m i c studies [5] and they have p rov ided a detai led descr ip t ion of the i r te r t ia ry s t ructure and, in par t icular , of the configurat ion of the Phe residues whose very high p ropor t ion make up for one of the most remarkable features of muscular pa rva lbumins [6!. As par t of a series of phys ico- chemica l exper iments d i rec ted towards the know- ledge of thei r conformat ion , the NMR analysis of this class of prote ins f rom lower ver tebrates the- refore appears to be very p romis ing and the more
(*) Contribution n ° 99 from the D~partement de Bio- chimie Macromol~culaire and n ° 1 from the E.R.140. This investigation was supported in part by the D~I~- gation G~n6rale h la Recherche Scientifique et Tech- nique, by the Fondation pour la Recherche M~dicale Fran~aise and by the Centre InternationaI des Etu- diants et Stagiaires.
(**) Permanent address : Instituto de Biologia Fun- damental, Universidad Autonomla de Barcelona, Bar- celona, Spain.
(***) Permanent address: Laboratoire de Calcul et Traitement de l 'Information, U.S.T.L., 34000 Montpel- lier, France.
so that it is made easy by the i r excel lent solu- bi l i ty propert ies . The interest of such an analysis fur ther der ives f rom the recent f inding that par- va lbumins s t rongly bind 2 Ca++/mole [7, 8], a s i tuation w h i c h points towards a possible functio- nal analogy of these prote ins wi th the muscle regu- latory prote in t roponin-C, found in h igher verte- brate muscles. NMR spectra indeed should be very helpful in the detect ion and ident i f icat ion of conformat iona l changes associated wi th the bin- ding and release of ca lc ium ions by parvalbu- mins and t roponin . Thus such an analysis could contr ibute to the unders tanding , at the molecular level, of how these prote ins perhaps par t ic ipa te in the regulat ion of the act ivi ty of the muscles in w h i c h they are present .
The present repor t is concerned wi th the results of a series of p r e l im ina ry N ~ R exper iments , ob- ta ined by pro ton spec t roscopy at 100 and 270 MHz, on two pa rva lbnmins (from hake and carp) and a iming at the visual izat ion of conformat iona l changes associated wi th the presence of a chemi- cal denatur ing agent, guan id in ium chlor ide, ~vith t empera tu re var ia t ion, and wi th the removal of the f irmly bound calcium ions. On the other hand, in connec t ion wi th the de te rmina t ion of the p r im a ry s t ructure of parvalbunf ins [9], the use of the NMR techn ique has been explored as a conve- nient probe for establ ishing the presence, d i rec t ly in the prote ins themselves, of an aeetyl N-terminal b locking group.
62 J. Parello and coll.
MATERIALS AND METHODS.
The major pa rva lbumins (pl 4.36) from hake (Merluccins merlnccius) and one of the major par- va lbumins (pI 4.25) from carp (Cyprinns carpio) were p repared as descr ibed elsewhere [10].
Calcium was removed through Sephadex G-25 fi l t rat ion (1 × 3.0 cm acryl ic plast ic co lumn for 10-15 mg protein, collection in po lypropylene tubes) in the cold room, using a 0.0,05 M sodium EGTA (ethylene glycol bis-(~-amino ethylether) N,N'-tetraacetic acid) solution, pH 7.5, as eluent. Lyophil izat ion of the pro te in peak afforded sam- ples con ta in ing about 0.4 mole Ca/mole protein, as estimated by atomic absorpt ion spectrometry, which were redissolved in D~O, y ie ld ing prote in solutions of concen t ra t ion ca 0.00,15 M, buffered at pD 7.5 wi th 0.0'12 M EGTA.
NMR spectra were recorded a round 30°C using 5 mm prec is ion tubes, unde r cont inuous wave (CW) condi t ions ( f requency sweep) on a Varian HA-100 spectrometer equipped wi th a C.A.T. Varian C-1024 device to improve the signal to noise ratio (Laboratoire de RMN, Universi t6 des Sciences et Techniques du Languedoc, Mont- pellier), and unde r rf pulse condi t ions on a Bru- ker HX-270 spectrometer equipped wi th the Fou- r ier t ransform (FT) technique and us ing a Nicolet 32 K computer (Spectrospin AG, Fhl lenden, Swit- zerland). Variable tempera ture exper iments were carr ied out o n the Varian HA-100 spectrometer us ing the V-6040 tempera ture-contro l device. NMR spectra us ing the CW mode were obtained in two dis t inc t regions, that at lower field from + 6.0 to + 11.0 ppm and that at higher field from - - 1.5 to + 3.5 ppm ; in the FT mode the spectral width, 12 ppm, covered the whole spectrum.
A known quant i ty of pa rva lbumin was dissol- ved in 0.5 ml D oO (99.9 p. cent deuter ium, C.E.A., Saclay) being 0.04.5 M in potassium phosphate and of pD = 7.6 (20°), y ie ld ing p ro te in solutions of concent ra t ion 0.0,0~I- 0.0.04 M. Guan id in ium chlo- r ide (GnC1), dissolved in the buffer above so that a 6 M solution was obtained (5.15 mg/0.5 ml), was used as a dena tu r ing agent in o r d e r to get refe- rence chemical shifts in the absence of any ter- t ia ry s t ructure cont r ibut ion . The solvent signal was used as an homonue lea r pro ton in te rna l lock signal (HDO) dur ing the CW exper iments and as an he teronuclear deuteron in te rna l lock signal (HDO) dur ing the F T experiments . Chemical shifts are quoted in ppm and posit ive numbers indica te shifts to low field from the reference resonance sodium 2,2-dimethyl - 2 - s i Iapentane - 5 - sulfonate (DSS). The sodium salt was avoided from the pro-
BIOCHIMIE, 1974, 56, n ° I.
te in solut ions to prevent conformat ional distur- bances and signal overlapping. The ca l ibra t ion of spectra was obtained us ing a solution of 0.0,1 M D SS in D20 (A = 5HD O - 5 D S S = 4.6.9 _+ 0.02 ppm) and in 6 M gnan id in ium chloride-D20 (A' ~ 5HD O-
5DS s = 5.0'0 -+- 0.02' ppm) at ca 30 °. Chemical shifts (8ob~, 30 o) are defined at -4- 0.0.3 ppm. It has been verified that the methyl signal posi t ion of DSS is not concent ra t ion dependent from 0.5 × 10 .2 to 2.0 × 10 -2 M DSS for D20 as well as for 6 M GnC1- D oO solutions.
All calculat ions were performed us ing an IBM 36,0-44 computer (Universit~ des Sciences et Tech- niques du Languedoc, Montpellier).
RESULTS AND D~SCUSSION.
NMR spectra of the chemically denatured pro- teins (Fig. 1 and 2).
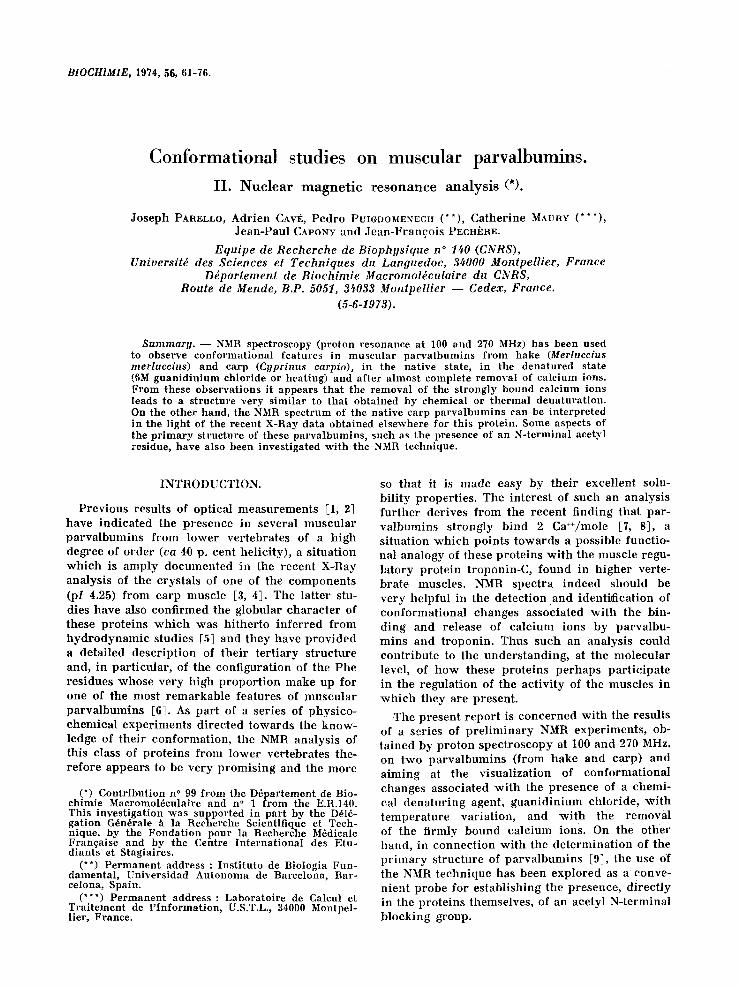
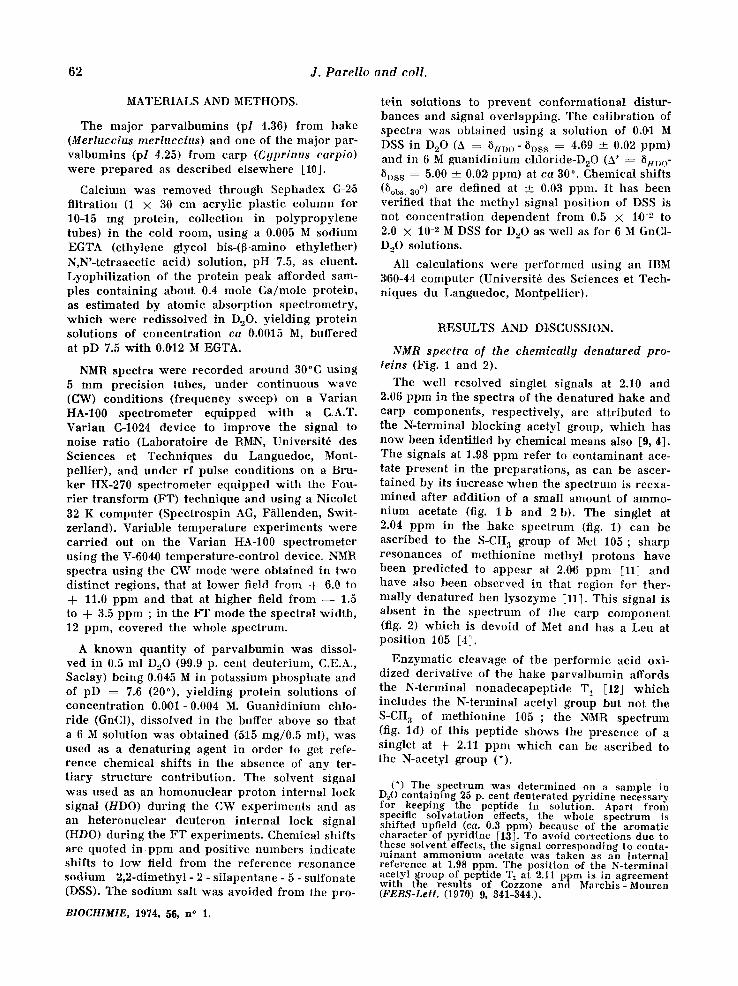
The well resolved singlet signals at 2.10 and 2.0,6 ppm in the spectra of the denatured hake and carp components , respectively, are at t r ibuted to the N-terminal b locking acetyl group, which has now been identif ied by chemical means also [9, 4]. The signals at 1.98 ppm refer to con taminan t ace- tate present in the prepara t ions , as can be ascer- ta ined by its in,crease when the spectrum is reexa- mined after addi t ion of a small amount of ammo- n ium acetate (fig. 1 b and 2b) . The singlet at 2.0.4 ppm in the hake spect rum (fig. 1) can be ascribed to the S-CH 3 group of M,et 105; sharp resonances of meth ion ine methyl protons have been predic ted to appear at 2.06 ppm [11] and have also been observed in that region for ther- mal ly denatured hen lysozyme [11~. This signal is absent in the spect rum of the carp component (fig. 2) which is devoid of Met and has a Leu at posi t ion 105 [4~.
Enzymat ic cleavage of the per formic acid oxi- dized derivative of the hake pa rva lbumin affords the N-terminal nonadecapept ide T 1 [12] which includes the N-terminal acetyl group but not the S,CH 3 of meth ion ine 1.0,5 ; the N ~ R spectrum (fig. ld ) of this pept ide shows the presence of a singlet at + 2.11 ppm which can be ascr ibed to the N-acetyl group (*).
(*) The spectrum was determined on a sample in D:O containing 25 p. cent deuterated pyridine necessary for keeping the peptide in solution. Apart from specific solvatation effects, the whole spectrum is shifted upfield (ca. 0.3 ppm) because of the aromatic character of pyridine [13]. To avoid corrections due to these solvent effects, the signal corresponding to conta- minant ammonium acetate was taken as an internal reference at 1.98 ppm. The position of the N-terminal acetyl group of pep~ide T1 at 2.11 ppm is in agreement with the results of Cozzone and Marchis-Mouren (FEBS-LetL (1970) 9, 341-3440.
Conformation of muscular paroalbumins. 63
o ~ o~I 0 ~ ~ , i i I l ¢'~ II I I ¢'i i
,,
!
e) qr
I
0
0
\ o
\
i / ',,.,. I I ~ i . ~ . ~ . , " " , i
/ \ , i / ' , . / '
/ \ _ ¢ _
. . . . . . . ' ~ ,¢ h A. . . . . . . . .
- - ~ I I lIT I I tE l l
d d
I l I ~ I I I 3.5 3.0 2.5 0 1.5 1.0 0.5 01.0
i)$$
FIG. 1. - - 100 MHz CW SH NMR spectrum (higher f ie ld region between 0.0 and ÷ 3.5 ppm) at 27 ° C of the ma jor hake parva lbumin in 6 M GnCI°D~O ; protein : 8.35 × 10-~ M.
a) 190 scans. b ) 177 scans ; 5 I~l AeOH 0.1 M added : the acetate s ignal (1.98 ppm) is label led x. c) s imu la t ed s p e c t r u m according to the data or ref. 11 and to the a m i n o acid compo-
s i t ion (7) ; the N - t e r m i n a l acetyl g roup is not included in the ea leula t ions . d) I00 Mtlz spec t rum of the N- t e rmina l nonadecapep t ide T1 of the hake p a r v a l b u m i n
in C~D~N/D..,O (1/3, v /v ) .
°1' ' l l b~ T
'
q ~" N I I I
i ~ . ~ k . , , ~ ~ ' ~ / i X . - - .
11 v , , . . . . , , , , ~ ,~ i " I ' I - . i i i k , • ~ r ~ ~ ~ . . / , , ; , , ' , , \ !
/VII \ . vl ~ i v / . , i, . ,
I I
r i t
3.5 l I I | I Piss 3 .0 2.5 2.0 1.5 1.0 (~5 0 .0
FIc. 2. - - 10.0 MHz C W SH NMR spec trum at 27°C of the carp parva lbumin in ~ M GnCI-D~-O ; protein : I × lO-S M.
a) 85 scans ; o : i m p u r i t y . b) 219 scans ; 10 ~l AcOH 0.1 M added : the acetate s ignal a p p e a r s at 1.98 p p m and is
label led x. e) s imu la t ed spec tum according to the da ta of ref. 11 and to the a m i n o acid compos i -
t ion ( 4 ) ; the N - t e r m i n a l aeetyl g roup is no t inc luded in the ca lcula t ions .
BIOCHIMIE, 1974, 56, n" 1.
6 4 J. Parel lo and coll.
As shown in figures 1 and 2, the denatured spectra have been pred ic ted by s imulat ion on the basis of composi t ion only using the p rocedure of McDonald and Phi l l ips :[11]. In fact, the obser- ved chemical shifts, 5obs, a0 o ( refer red to 0.01 M DSS solutions), are larger than those repor ted in ref. l l for prote ins in random-coi l configuration.
The chemical shifts observed (8ob~ ' a0 o) in the spectra of chemica l ly dena tured parva lbumins cor respond to re fe rence values in the absence of
0.1 ppm) could be due essentially to the diffe- rence in t empera tu re be tween the two cases, 3.0 ° (exp.) and 40 ° (calc.) (*). The actual chemica l shifts r epor ted in Figs 1 and 2 were adjusted using the re la t ionship, 5¢al¢ = 8 .... 30o - 0A ppm.
The present results, however , even established wi th the aid of only two low-molecula r proteins , c lear ly demonstra te the essential va l id i ty of the p rocedure p roposed by McDonald and Phi l l ips [11]. Indeed, independen t ly of the signif icant dif-
i " - - -
t 1 ~.~ ~.'o A ~'.o ,15 ,Io d~ o°~ S -o:~ -,.o
2Z I I '
i 10.5 1;.0 ' g'.O ' 8 . 0 7~5 7.0 9.5 8,5 6!5 6~0
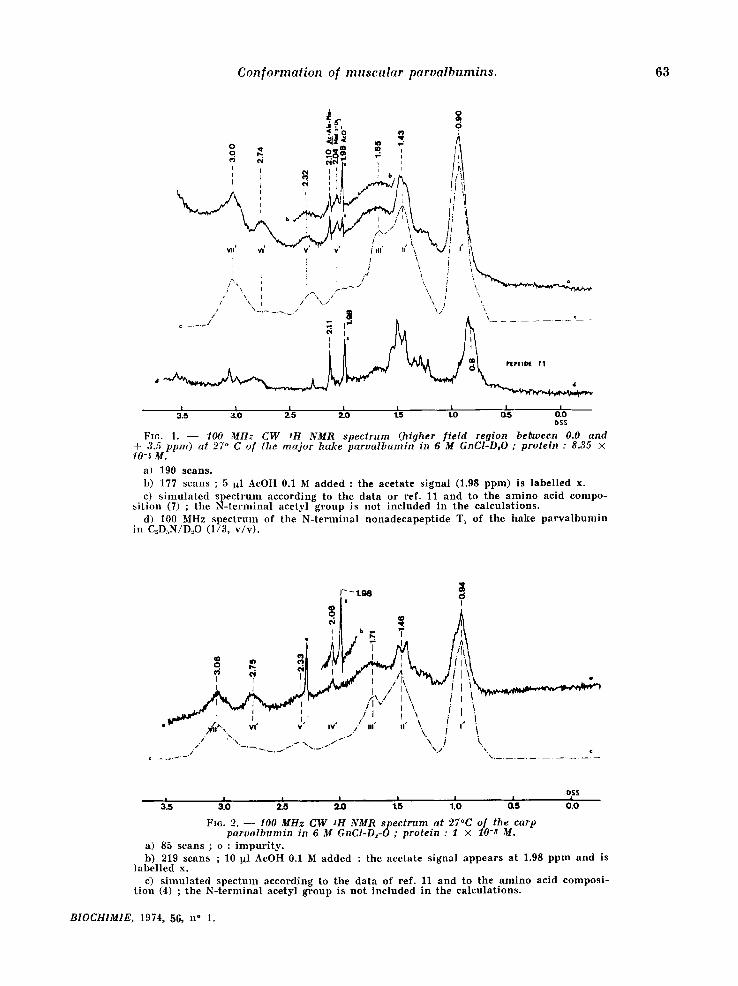
FIG. 3. - - 100 MHz C W 1H NMR spectrum at 27°C of the m a j o r hake paroa lbumin in pbosphate-DzO buf fer solution, pD = 7.6 (a) protein : 4.3 × 10⁻³ M, (b) protein : 1.7 × 10⁻⁸ M after Sephadex G-25 gel filtration of sample a.
Upper part : region from --1 .0 to + 3.5 ppm. a) 82 scans (the strong signal x at !.87 ppm corresponds to external acetate ion ; the two signals labelled xx are the corres- ponding spinning sidebands) ; b) 92 scans.
Lower part : a) region from -~- 5.8 to + 11.0 ppm ; 140 scans.
any ter t iary s t ructure contr ibut ion , p rov ided they are cor rec ted for the influence of GnC1, using the re la t ionship, 5 ..... 30° : 8 ob~, SO. + a (a : A- h ' : - - 0.31 ppm at 30°). For ins tance resonances co r re spond ing to the methyl groups of Ileu, Leu and Val appear a round + 1.30 p p m (5ob~.3oo) ; the cor rec ted value (8 .... 300 ) is therefore about 0.9,9 ppm. Nevertheless, calculat ion of s imulated spectra using the data of ref. 11 yields a value of + 0.89 ppm (Scale). The d i sc repancy between expe- r imenta l and s imulated spectra (8 ..... 30. -Scale
BIOCHIMIE, 1974, 56, n ° 1.
ferenees in amino acid composi t ion be tween the hake and the carp parva lbumins [7, 4], the simu- lated spectra in figures 1 and 2 both have a simi- lar general shape and compr ise c lear ly defined spectral regions I' (0.9 ppm), I I ' (1.4 ppm), I I I ' (1.6 ppm), IV' (2.0 ppm), V' (2.3 ppm) VI' (2.7 ppm) and VII ' (3.0 ppm) agreeing wel l w i th those of thei r exper imenta l counterpar t . Only for the reso-
(*) The observed difference appears in agreement with the chemical shift dependence of the water pro- ton signal, which is abo.ut 0.01 ppm/°C.
Conformation of muscular parvalbumins. 6 5
!
,
¢,,, ~ o ~
i I ,.5 4.0 ~s ~!o 2'5 2'.o ,'.5 ,'.o o!~ do -o'.s
oSS
I I
I
10.5 10,0 9.5 9.0 8.5 8.0 7.5 7.0 6.5 ~0 5.5
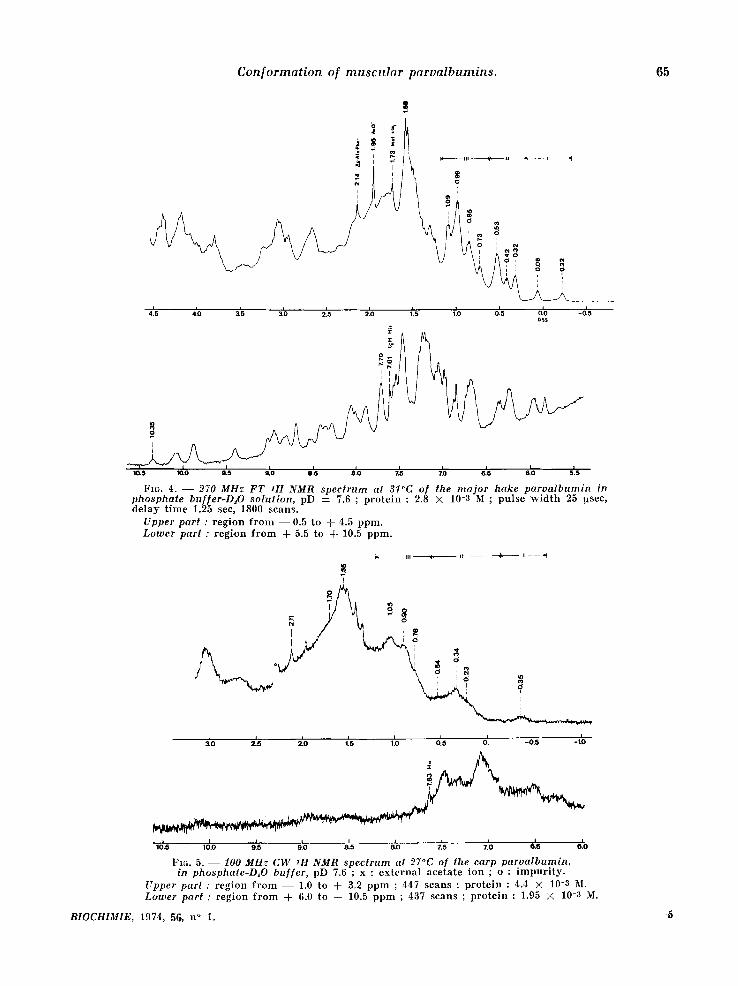
Fz~. 4. - - 270 MHz FT 1H NMR spec trum at 3l~C of the ma jor hake parva lbumin in phosphate buffer-D~O solution, pD = 7.6 ; p r o t e i n : 2.8 X 10⁻⁸ M ; p u l s e w i d t h 25 !xsec, d e l a y t i m e 1.25 see, 1800 s c a n s .
Upper part : r e g i o n f r o m - - 0 . 5 t o + 4.5 p p m . Lotwer part : r e g i o n f r o m + 5.5 t o + 10.5 p p m .
'T
, :/
' ' d -o[~ -~o ~'.o ~I,, ' ' t o o.~ 2 . 0 1.5
1(~.5 1(~.0 915 910 8~5 ~0 715 7!0 6'.5 a'.o
Fzc,. 5. - - 100 MHz C W 1H NMR spectrum at 27°C of the carp parvalbumin , in phosphate-D~O buf[er, pD 7.6 ; x : e x t e r n a l a c e t a t e i o n ; o : i m p u r i t y .
Upper part : r e g i o n f r o m - - 1.0 t o + 3.9 p p m ; 447 s c a n s ; p r o t e i n : 4.4 × 10⁻³ M. Ltrwer part : r e g i o n f r o m A- 6.0 t o + 10.5 p p m ; 437 s c a n s ; p r o t e i n : 1.95 X 10⁻³ M.
BIOCHIMIE, 1974, 56, n ° 1.
66 J. Pare l lo and coll.
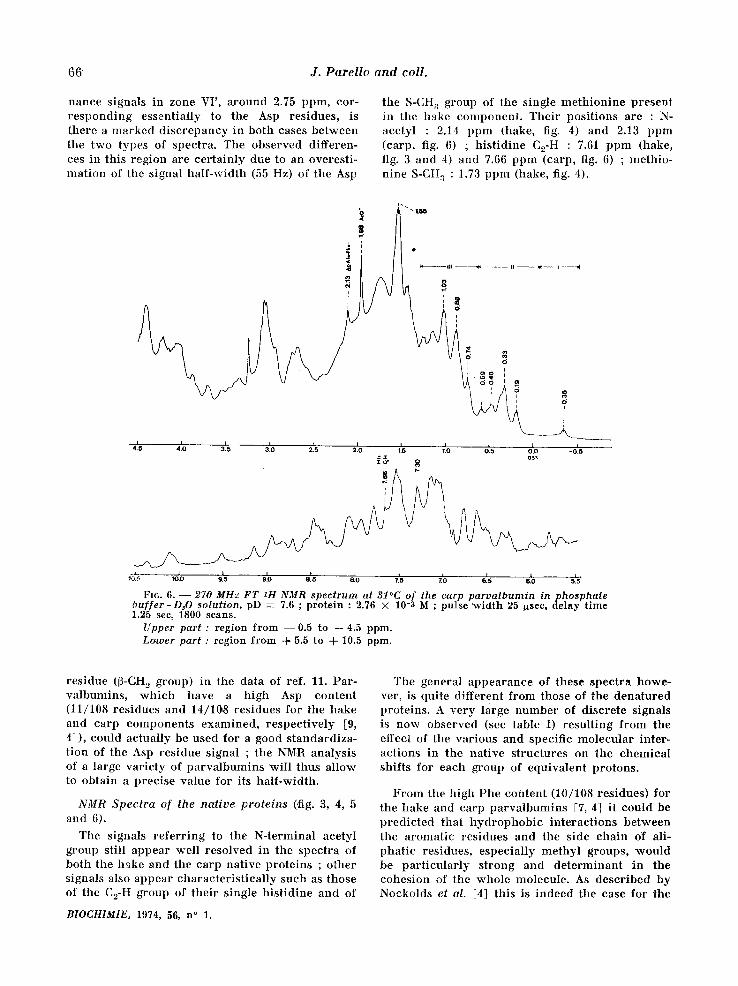
nance signals in zone VI', a round 2.75 ppm, cor- r e spond ing essentially to the Asp residues, is there a marked d iscrepancy in both cases between the two types of spectra. The observed differen- ces in this region are cer ta in ly due to an overesti- mat ion of the signal half-width (55 Hz) of the Asp
the S-CH a group of the single meth ion ine present in the hake component . Their posi t ions are : N- aeetyl : 2.14 ppm (hake, fig. 4) and 2.13 ppm (carp, fig. 6) ; h is t id ine C2-H : 7.61 ppm (hake, fig. 3 and 4) and 7.66 ppm (carp, fig. 6) ; methio- n ine S-CH:~ : 1.73 ppm (hake, fig. 4).
' o
i [ I ~"
I i I I I I I I I 1 i 4.5 4,0 3.5 3.0 2.5 2.0 1.5 I 0 0.5 0 0 -0 ,5
h
-L, t 10.5 10~0 ~5 9:0 ' 8!0 7.5 8.5 ZtO 615 6~0 5'.5
Fro. 6. - - 270 MHz FT ~H NMR spectrum at 31°C of the carp parvalbumin inphosphate buffer-D,O solution, pD = 7.6 ; protein : 2.76 × 10⁻³ M ; pulse width 25 ~sec, delay time 1.25 sec, 1800 scans.
Upper part : region from --0 .5 to q-4.5 ppm. Lamer part : region from d- 5.5 to -{- 10.5 ppm.
residue (~-CH~ group) in the data of ref. 11. Par- valbumins , wh ich have a high Asp content (11/108 residues and 14/10,8 residues for the hake and carp components examined, respect ively [9, 41), could actually be used for a good s tandardiza- t ion of the Asp residue signal ; the NMtq analysis of a large variety of pa rva lbumins wil l thus allow to obtain a precise value for its half-width.
NMR Spectra of the native proteins (,fig. 3, 4, 5 and 6).
The signals re fer r ing to the N-terminal acetyl group still appear well resolved in the spectra of both the hake and the carp native proteins ; other signals also appear character is t ical ly such as those of the C2-H group of their single h is t id ine and of
BIOCHIMIE, 1974, 56, n ° 1.
The general appearance of these spectra howe- ver, is quite different from those of the denatured proteins. A very large number of discrete signals is now observed (see table I) resul t ing from the effect of the various and specific molecular inter- actions in the nat ive structures on the chemical shifts for each group of equivalent protons.
From the high Phe content (10/108 residues) for the hake and carp pa rva lbumins [7, 4] it could be predic ted that hydrophob ic in terae t ions be tween the aromatic residues and the side chain Of ali- phat ic residues, especially methyl groups, would be par t icu la r ly s t rong and de te rminan t in the cohesion of the whole molecule. As descr ibed by Nockolds et al. [4] this is indeed the ease for the
Conformalion of muscular parvalbumins. 67
c a r p p a r v a l b u m i n w h e r e 18 n o n - p o l a r a l i p h a t i c r e s i d u e s (7 Leu, 4 I le, 3 Val and 3 Ala) a re i n t e r - na l and l ie in an a r o m a t i c e n v i r o n m e n t of 8 i n t e r - na l P h e res idues . An e x p l a n a t i o n for the sh i f t s o b s e r v e d in the na t i ve p r o t e i n s w i t h r e spec t to the d e n a t u r e d ones can t h e r e f o r e be a t t e m p t e d essen-
a first a p p r o x i m a t i o n , to take the i n f l u e n c e o n l y of t he f o r m e r in to a c c o u n t w h e n c a l c u l a t i n g the NMR s p e c t r u m of a p r o t e i n of k n o w n t e r t i a r y s t ruc tu re .
The m a g n i t u d e of t he s h i e l d i n g due to a ben- zene r i n g has b e e n p r e d i c t e d q u a n t i t a t i v e l y by
TABLE I.
Upfield resonance in the NMR spectra (100 and 270 MHz) o[ native and carp parvalbumins. Chemical shifts are referred to internal DSS.
Region
II
I l l
IV
V
Hake parvalbamin
100 MHz
- - 0.29 O. 04
0.29 0.45(S)
0.50
o. 72
0,85
0.94 1.02
1.17(S) 1.23 (S) 1.29 (S)
1.40 (S) 1 .46
1.52 (S)
1.67 (a)
1.87 (b) 2.07 (c)
279 MHz
- - 0.22 O. 06
O. 32 0.42
0.53
0.73 0.82 (S) 0.85 ! 0.87 (S) 0.99 1.08 1.10 r
1,12 (S) 1.24 I. 30
1.32 (S) [ 1.37 1.39 i 1.45 (s) 1.47 1.50
I
1.53 (s) 1.56 I 1.58 1.61 (S),
1.73 (a) 1.78 1.81 1.85 1.95 (b) i 2.14 (c)
Region
I t
i I I
IV
V
Carp parvalbumin
100 MHz
- - 0.35
0.23(S) 0.34
0.54
0.78
0.90
1.05
1.23
1.35
1.42
1 .55
1.7o (s)
2.11 (c)
270 MHz
- - 0.35
0.19 0.33 0.36 (S)
0.48 0.59
0.74 O. 84 (S) 0.88 o. 98 (s) 1.03 1.14 i . 17 (s)
1.24 1.26 1.29 (S)
I . 34 (S)
1.39 (S) 1.42 (S) 1.44 1.46 1.54 1.56
1 . 7 4
1 .98 (b) 2.13 (c)
(a) -S-CHa signal of Met 105 of hake parvalbumin ; this signal is absent in the carp spectrum. (b) External acetate. (c) Aeetyl N-terminal blocking group. (S) shoulder.
t i a l ly on the basis of the m a g n e t i c p e r t u r b a t i o n due to t h e Phe res idues , e s p e c i a l l y in t h e upf ie ld p a r t of t he spec t ra . The l a rge a m p l i t u d e of the a r o m a t i c r i n g c u r r e n t s as c o m p a r e d to o t h e r dia- m a g n e t i c a n i s o t r o p y effects, m a k e s it poss ib le , in
BIOCH1MIE, 1974, 56, n" 1.
J o h n s o n and B o v e y [14] u s i n g the c o n c e p t of r i n g cu r r en t . The JB m o d e l has been s a t i s f a c t o r i l y ap- p l i ed to p r e d i c t i n t r a m o l e c u l a r s h i e l d i n g effects [15], as w e l l as i n t e r m o l e c u l a r effects , s u c h as aro- m a t i c so lven t effects [13],
68 J. Parello and coll.
T h e J B m o d e l w a s a p p l i e d to t h e c a r p p a r v a l -
b u n f i n u s i n g t h e k n o w n X - r a y c o o r d i n a t e s . T h e
u s e o f t h i s m o d e l i n t h e e a s e o f a p r o t e i n c o n t a i -
n i n g o n l y P h e a s a r o m a t i c r e s i d u e s a p p e a r s w e l l
j u s t i f i e d o n t h e b a s i s o f t h e e l e c t r o n i c s i m i l a r i t y
b e t w e e n t h e a r o m a t i c r i n g o f p h e n y l a l a n i n e a n d
t h a t o f b e n z e n e . A s i m i l a r t r e a t m e n t w a s p r e - v i o u s l y a p p l i e d to l y s o z y m e b y S t e r n l i c h t a n d
number of pro|ons
60"
4 5 ) l
I
I
1:5 1~o o.'5 o'.o
o
f
-0 .5 -i.O PP~
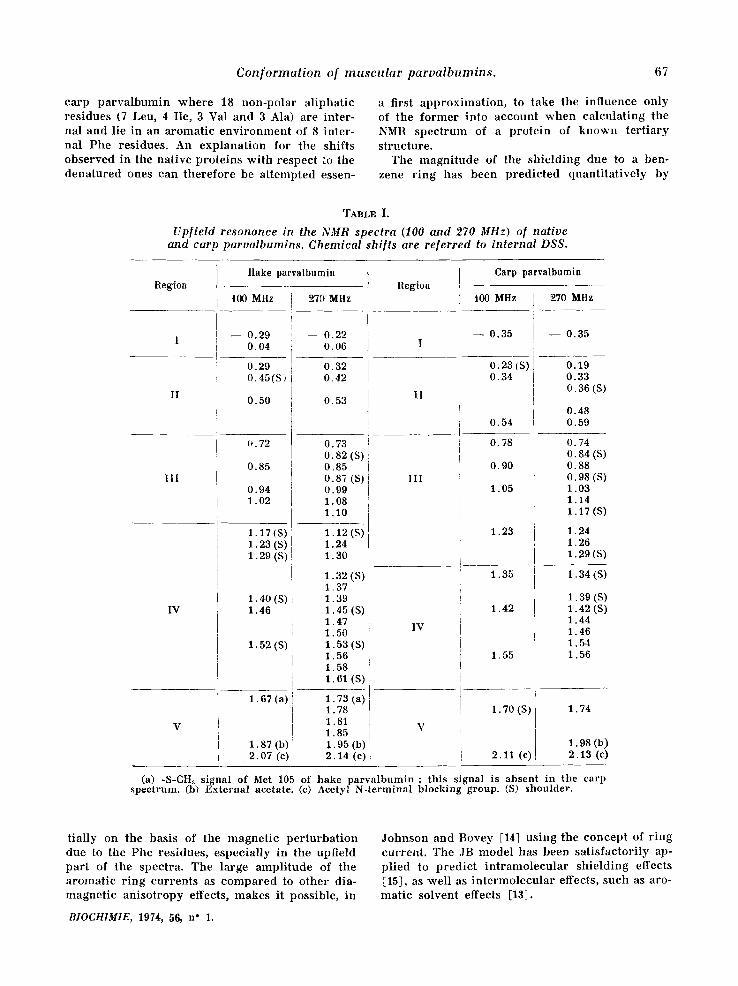
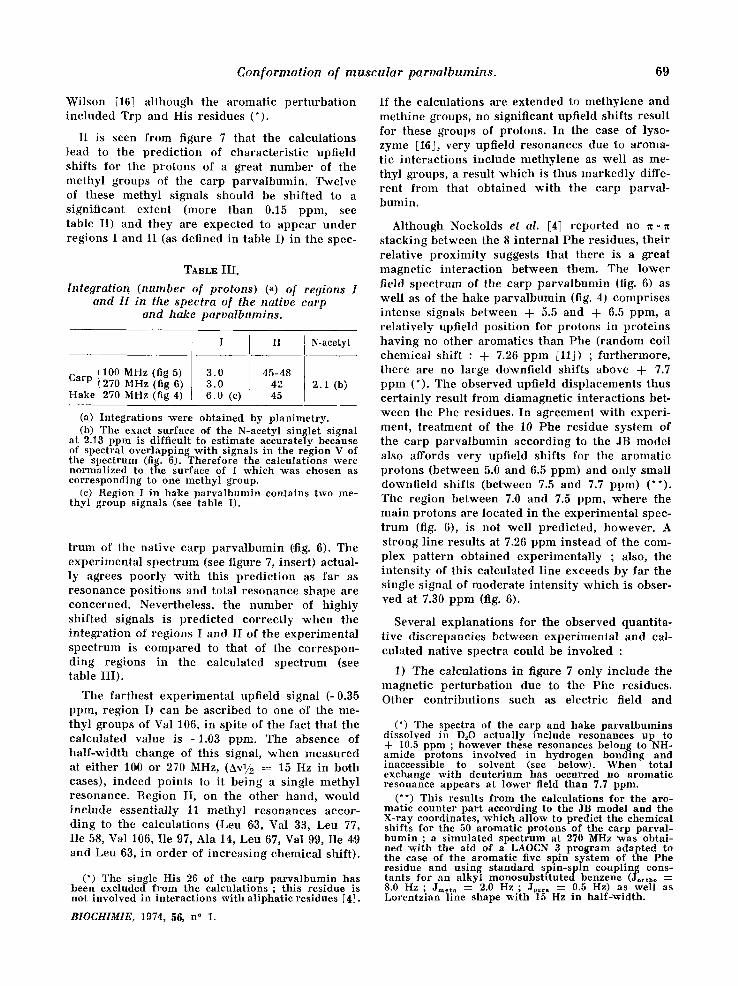
1716. 7. - - a) Aliphatic simulated NMR spectra of the carp paroalbumin at 270 MHz including ,63 methyl groups (from 5 Thr, 20 Ala, 5 Val, 9 Leu, 5Ile). Ver t i ca l b a r s a re p ro - p o r t i o n a l to t h e n u m b e r of m e t h y l g r o u p s w i t h t he s a m e c h e m i c a l s h i f t ; a L o r e n t z i a n l ine s h a p e w a s a d o p t e d w i t h 15 Hz in h a l f - w i d t h , b) Releoant part of the experimental spectrum from figure 6.
TABLE II .
Calculated increments for the methy l group major chemical shills in the aliphatic residues of carp parvalbumin using the JB model.
Perturbing" aromatic Perturbed aliphati(: Calculated increments Chemical sh i f t s in ppm residues (Phe) residue (a) (iu ppm) (b) relerred to DSS) (e)
Ala 14 iH - - 0 . 77 2 9 . . . . . . . . . . . . . . . . . . . . . . . . .
29 , 70 a n d 29 , 30 . . . . . . . . . . 47 , 102 . . . . . . . . . . . . . . . . . . . . 66 , 85 a n d 85 . . . . . . . . . . . . . . 24, 29 , 66, 70 a n d 24 , 29.. 24 a n d 66 . . . . . . . . . . . . . . . . . . 8 5 . . . . . . . . . . . . . . . . . . . . . . . . .
47 and 57 . . . . . . . . . . . . . . . . . . 30, 102 a n d 30 , 102 . . . . . . . . .
¥ a l 33 iH lie 58 i Leu 63 iH Leu 67 iH Leu 77 i l ie 97 i Val 99 sH Val 106 iH
- - 0.80 and -~- 0.11 - - 0.39 and ~___ 0.00 - - 0.79 and - - 0.16 - - 0.24 and q - 0.01 - - 0 5 9 and -~- 0 .0l - - 0.31 and -+- 0.60 - - 0.25 and - - 0 12 - - 1.96 and - - 0.43
-~- 0 . 6 4 -~ 0 . 1 3 -q- 2 . 0 4 + 0 .44 -~- 0 . 83 -~- 0 10 -~- 0 .73 --~ 0 .65 @ 0 . 9 0 -}- 0 . 30 -]- 0 . 90 -~- 0 . 52 ~ - 0 . 83 + 0 .68 + 0.81 - - 1 .o3 + 0 .50
(a) F o l l o w i n g ref . 4, i : i n t e r n a l r e s i due , H : : r e s i d u e in a - h e l i x r eg ion , s = r e s i d u e a t t h e s u r f a c e of t h e p ro t e in .
(b) C a l c u l a t e d i n c r e m e n t s w e r e o b t a i n e d u s i n g a t a b l e of n u c l e a r s h i e l d i n g v a l u e s c o m m u n i c a t e d to one of u s b y C. E. J o h n s o n Jr . a n d F. A. Bovey i n c o n j u n c t i o n w i t h vef. 14. T h e v a l u e s of z a n d p ( cy l ind r i ca l c o o r d i n a t e s : t h e z a x i s is n o r m a l to t h e p l a n e
CH~ a n d C H g r o u p s were d e t e r m i n e d b y a s s u m i n g t e t r a h e d r a l b o n d ang le s , u s i n g X- r ay c o o r d i n a t e s of t h e c a r b o n p o s i t i o n s ; t h e m e t h y l p r o t o n s w e r e a s s u m e d to be loca ted al t h e c e n t e r of t h e b a s e o f t h e cone f o r m e d b y ' t h e f r e e l y r o t a t i n g CHa g r o u p a b o u t the C-C b o n d , a c c o r d i n g to r e f s 15 a n d 16. T h e i n c r e m e n t s u n d e r 0.25 p p m h a v e n o t been c o n s i d e r e d .
(c) T h e u n p e r t u r b e d c h e m i c a l s h i f t s c o r r e s p o n d to t h o s e r e p o r t e d in ref . 11 (Ala : 1.41 ; Ile : 0.83 ; L e u : 0.89 ; Val : 0.93).
BIOCH1MIE, 1974, 56, n ° 1.
Conformation of muscu lar parvalbumins . 69
Wilson [16] al though the aromat ic per turba t ion inc luded Trp and His residues (*).
It is seen f rom figure 7 that the calculat ions lead to the p red ic t ion of charac te r i s t ic upfield shifts for the protons of a great number of the methyl groups of the carp parva lbumin . Twelve of these methyl signals should be shif ted to a signi~ficant extent (more than 0.15 ppm, see table II) and they are expected to appear under regions I and II (as defined in table I) in the spec-
TABLE III.
Integration (number o V protons) (~) o[ regions I and II in the spectra of the native carp
and hake parvalbumins.
t l00 MHz (fig 5) Carp {270 MHz (fig 6) Hake 270 MHz (fig 4)
3.0 3.0 6.0 (c)
II N-acetyl
45-48 42 45
2.1 (b)
(a) Integrations were obtained by planimetry. (b) The exact surface of the N-acetyl singlet signal
at 2.13 ppm is difficult to estimate accurately because of spectral over]upping with signals in the region V of the spectrum (fig. 6). Therefore the calculations were normalized to the surface of I which was chosen as corresponding to one methyl group.
(e) Region I in hake parvalbumin contains two me- thyl group signals (see table I).
t rum of the nat ive carp pa rva lbumin (:fig. 6). The exper imenta l spec t rum (see figure 7, insert) actual- ly agrees poor ly wi th this p red ic t ion as far as resonance posi t ions and total resonance shape are concerned. Nevertheless, the number of highly shif ted signals is p red ic ted correc t ly w h e n the in tegra t ion of regions I and II of the exper imenta l spec t rum is compared to that of the cor respon- ding regions in the calculated spec t rum (see table III).
The far thest exper imenta l upfield signal (-0.35 ppm, region I) can be ascr ibed to one of the me- thyl groups of Val 106, in spite of the fact that the calculated value is -1.03 ppm. The absence of ha l f -wid th change of this signal, when measured at e i ther 100 or 27.0 MHz, (5vl/2 = 15 Hz in both cases), indeed points to it be ing a single methy l resonance. Region II, on the other hand, would inc lude essential ly 11 methyl resonances accor- d ing to the calculat ions (Leu 63, Val 33, Leu 77, Ile 58, Val 10~6, Ile 9,7, Ala 14, Leu 67, Val 99, Ile 49 and Leu 63, in o rder of increas ing chemica l shift).
(*) The single His 26 of the carp parvalbumin has been excluded from the calculations ; this residue is not involved in interactions with aliphatic residues [4].
If the calculat ions are ex tended to methylene and meth ine groups, no signif icant upfield shifts result for these groups of protons. In the case of lyso- zyme [16], very upfield resonances due to aroma- t ic in terac t ions inc lude methy lene as well as me- thyl groups, a result w h i c h is thus marked ly diffe- rent f rom that obta ined wi th the carp parval- bumin.
Although Nockolds et al. [4] repor ted no ~ - s tacking between the 8 in te rna l Phe residues, the i r re la t ive p rox imi ty suggests that there is a great magnet ic in te rac t ion be tween them. The lower field spec t rum of the carp pa rva lbumin (fig. 6) as well as of the hake pa rva lbumin (fig. 4) compr ises intense signals between + 5.5 and + 6.5 ppm, a re la t ive ly upfield posi t ion for pro tons in pro te ins hav ing no other aromat ics than Phe ( random coil chemica l shift : + 7.26 ppm [11]) ; fur thermore , there are no large downfield shifts above + 7.7 ppm (*). The observed upfield displacements thus cer ta in ly result f rom diamagnet ic in terac t ions bet- ween the Phe residues. In agreement wi th experi- ment, t rea tment of the 10 Phe res idue system of the carp pa rva lbumin accord ing to the JB model also affords very upfield shifts for the aromat ic pro tons (between 5.0 and 6.5 ppm) and only small downfie ld shifts (between 7.5 and 7.7 ppm) (**). The region be tween 7.0 and 7.5 ppm, whe re the main protons are located in the exper imenta l spec- t rum (fig. 6), is not wel l p red ic ted , however . A strong l ine results at 7.26 ppm instead of the com- plex pa t te rn obtained exper imenta l ly ; also, the in tensi ty of this calculated l ine exceeds by far the single signal of modera te intensi ty w h i c h is obser- ved at 7.30 ppm (fig. 6).
Several explanat ions for the observed quanti ta- t ive d iscrepancies be tween exper imenta l and cal- culated native spectra could be invoked :
1) The calculat ions in figure 7 only inc lude the magnet ic pe r tu rba t ion due to the Phe residues. Other contr ibut ions such as e lec t r ic field and
(*) The spectra of the carp and hake parvalbumins dissolved in D:O actually include resonances up to + 10.5 ppm ; however these resonances belong to NH- amide protons involved in hydrogen bonding and inaccessible to solvent (see below). Hrhen total exchange with deuterium has occurred no aromatic resonance appears at lower field than 7.7 ppm.
(**) This results from the calculations for the aro- matic counter part according to the JB model and the X-ray coordinates, which allow to predict the chemical shifts for the 50 aromatic protons of the carp parval- bumin ; a simulated spectrum at 270 MHz was obtai- ned with the aid of a LAOCN 3 program adapted to the case of the aromatic five spin s.ystem of the Phe residue and usin lg standard spin-spin coupling cons- tants for an alkyl monosubstituted benzene (Jo,tho ---- 8.0 Hz ; J~,ta ---- 2.0 Hz ; J,~r, ---- 0.5 Hz) as well as Lorentzian line shape with 15 Hz in half-width.
BIOCH1MIE, 1974, 56, n ° 1.
70 J. Pare l l o a n d coll .
a-helix s t ructure effects have not been considered in this first approach. Actually, the Sternl icht and Wilson 's discussion on lysozyme leads to the con- clusion that only small chemical shift changes would occur upon folding into regions of right- handed helices [16].
2) The s t ructure in solution differs slightly from that in the crystal.
3) In the dissolved state, the equ i l ib r ium bet- ween rotamers of the side chains can be altered, as well as the kinet ics of their in terconvers ion . In this view, the two methyl groups of Val 106, for instance, would be located at two mean posi- t ions between the extreme calculated ones, yiel- ding a better agreement with exper iment (*). The existence of different rotamers was already infer- red for the Phe residues of pa rva lbumins on the basis of optical methods [1], and seems also to be supported for Val residue 10~ from the NMR spec- tral behaviour of the carp pa rva lbumin when tem- pera ture is allowed to vary (see below).
The observat ion of character is t ic upfield dis- placements for a set of methyl , and aromatic (Phe) protons in the NMR spect rum of the nat ive carp pa rva lbumin (Fig. 5 and 6), is essentially in agreement wi th the molecular configurat ion esta- bl ished by X-ray crystal lography [4]. At the pre- sent level of accuracy in the N~MR analysis, it is not poss ib le to say if the s t ructure in solution is really ident ical to that in the crystal. As far as the in te rna l hydrophob ic core (see ref. 4 and table II) of the pro te in is concerned, this seems to be the case. In the same order of ideas, it has been esta- bl ished on quite different exper imental evidence that the s t ructure of a globular prote in , such as an enzyme, appears to be the ¢ same >> in aqueous solution and in the we t crystal l ine state [17]. Even in this case, the cr i ter ion of ident i ty of the mole- cule in both states can only be spec i f ied to the resolution of small f ract ions of a chemical bond length [17]. It must be emphasized that slight :changes of coordinates (_ 0.2 X) between the crysta l l ine (X-ray) and the dissolved (NMR) states would afford noticeable chemical shift changes up io 0.2-0,3 ppm, so that, in the present si tuation, only a quali tat ive or at: least semi-quant i ta t ive agreement could be expected when compar ing the results of N MR and X,ray crystal lography.
(*) These appear to be ~1.03 and W 0.70 ppm on the basis of calculations : including three rotamers of Val 106 through rotat ion around the Ca --C~ bond ; if the internal energy of these rotamers differs mar- kedly, the two methyl groups of Val 106 would appear as two distinct signals even in the case of a rapid interconversion.
BIOCHIMIE, 1974, 56, n ° 1.
Nevertheless, character is t ic ter t iary s tructure features of the carp pa rva lbumin , involv ing ali- phat ic-aromat ic in terac t ions are well reflected at the magnet ic level on the NMR spectra : 1) inter- actions between near residues. In par t icular , in- teract ions between an aromatic residue located at posi t ion n in an a-helix, and an al iphat ic residue at posi t ion n _ 4 (or 5) of the same helix, such as between Phe 70 and Leu 67 and between Phe 10~2 and Val 10,6, are clearly visible. Such a regular a l ternance of non-polar residues appears as a character is t ic of u-helical segments inc luded in globular proteins, as shown by the results of Perutz et al. for hemoglobin [18]. 2) in terac t ions between distant residues. Among these inter- actions, those involv ing elements of separate helical segments are of par t icu la r interest, as they could play a p r e domi na n t role in the ma in tenance of the ter t iary structure. The in terac t ions Leu 67- Phe 29, Val 33-Phe 70 and Val 106-Phe 3 0 a r e of this type. The last two are probably quite s trong as shown by the cor responding upfield increments (see table II). The Val 10~6-Phe 30 in teract ion, which involves the two h e l i c a l segments B and F (*), could play an impor tan t role in the funct ion of the molecule, as the F helix inc ludes the car- boxyl te rmina l par t of the chain and is adjacent to the EF (*) region (residues 90 to 101) wh ich is one of the two calcium b i n d i n g sites [4].
The s imilar i ty of the methyl high field regions in the N, MR spectra of the hake and carp parval- bumins (Fig. 3-4, and Fig. 5-6, respectively), added to the fact that almost (**) all the al iphat ic and aromatic residues involv ing an impor tan t magne- tic in te rac t ion (see table II) are i nva r i a n t in the p r i ma r y s t ructure of the two proteins suggests that some of the resonance signals of the hake parval- bumi n can be identif ied in spite of the fact that no atomic coordinates are available for this pro- tein. The signal at - - 0 . 2 2 ppm cer ta in ly repre , sents one of the two methyls of bake 's Val 10,6 which would lie in a chemical env i ronmen t very s imilar to that observed in the carp pa rva lbumin (presence of the B and F helical segments). The other upfield resonance in region I, at + 0.06 ppm (3 pro[0ns), is tentat ively a t t r ibuted to one methyl of Leu 63. The observat ion of two upfield resolved
(*) The X-ray crystallographic results [4] esta- blished the presence in parvalbumins, of a-helical regions named A, B, C, D, E and F ; the non helical peptide regions between two helical regions are named by two letters (EF, e.g., corresponds to the peptide region between helices E and F).
(**) In hake [9] Val 33 of carp is replaced by Ile, and Ile 58 by Val. All the other elements of Table II remain unchanged.
Conformation of muscular parvalbumins. 71
signals in the hake spec t rum, ins tead of one in the carp spec t rum, is pe rhaps to be re la ted to a local d i f ference in the two s t ructures , in p a r t i c u l a r r ega rd ing the spa t ia l r e l a t ionsh ip be tween Leu 63, Phe 66 and Phe 85. However , the two p ro te ins w h i c h differ by 27 amino ac id subst i tut ions, have in all o ther respec ts ve ry s imi la r NM,R spect ra , w h i c h po in t to the i r ~having also a s imi la r t e r t i a ry s t ructure . In tegra t ion of the upf ie ld region of the 270 M, Hz spec t rum of the hake p a r v a l b u m i n is in agreement w i th th is assumpt ion (see table III) .
I t is in te res t ing to not ice that all the res idues w h i c h give r ise to the upf ie ld regions I and II in the spec t rum of the ca rp p a r v a l b u m i n (pe r tu rbed a l ipha t i c and p e r t u r b i n g a romat ic res idues of table II) are not only unchanged in the hake ' s p r i m a r y s t ruc ture but also in tha t of four o ther pa r va lbumins whose sequence is pa r t l y k n o w n (J'. F. Pech6re, J. P. Capony and J. Demail le , in p repa ra t ion ) . This i nva r i ance is quite r e m a r k a b l e and suggests that the a l i pha t i c - a roma t i c in ter - ac t ions are essent ia l in the cohes ion of the ter- t i a ry s t ruc ture of pa rva lbumins .
The observed upfie ld shifts in the NMR spec t ra are ac tual ly in agreement w i th a contact w h e r e the methy l group of the a l ipha t i c res idue lies above the p lane of the a romat ic r ing, in the z d i rec t ion (see legend of table II). Acco rd ing to the t h e r m o d y n a m i c t r ea tmen t of Nemethy and Sche- raga [19], this conf igurat ion leads to a s tabi l iza- t ion of the in t e rac t ing system. It is also very r emarkab le to observe that a l though the Phe con- tent of p a r v a l b u m i n s is a r e la t ive ly high one, the Phe res idues occupy very separa te pos i t ions in the sequences ; only one c luster is observed (dou- blet in pos i t ions 29-30). Such a conf igurat ion ap- pea r s more sui table for an inc reased number of a l i pha t i c - a roma t i c in t e rac t ions to take p lace over the ent i re cha in length than a more c lus te red one.
Al though the h y d r o p h o b i c in te rac t ions are cer- t a in ly impor t an t in the cohes ion of the pa rva lbu- min structures, it must be r emembered that these p ro t e ins belong to the class of g lobular pro te ins , w h e r e the s tab i l i ty resul ts f rom a ba lance bet- ween many in te rac t ions (d ipo l a r in te rac t ions , h y d r o g e n bonding, van der Waals forces) . The role of hyd rogen bond ing in the t e r t i a ry s t ruc ture has been discussed by Kre t s inge r et aL [20] ~.n the i r X-ray s tudy of the carp pa rva lbnmin .
The ca rp p ro t e in conta ins 178 exchangeable hydrogens , 10'8 pept ide-NH hydrogens and 70 NH and OH hydrogens f rom Asp, Asn, Glu, Gin, Lys, Arg, Thr and Ser s ide chains . The last ca tegory co r r e sponds to r a p i d solvent exchangeable h y d r o -
gens, p a r t i c u l a r l y in the case of the ca rp parva l - bumin w h e r e almost all po l a r s ide chain hyd ro - gens (65 out of 70) are s i tuated at the surface of the molecule [201. Of the 108 pe p t i de - a mide hyd ro - gens, on the o ther hand , 29 are exposed to solvent, 10 are bound to s ide chain oxygens [201 and these would there fore also exchange very rap id ly . The above cons ide ra t ions thus y ie ld a number of 104 p ro tons (65 + 29 + 10) w h i c h are exchanged agains t deuterons when d isso lv ing the p ro te in into DuO. In contras t , the r ema in ing 74 pro tons , inaccess ib le to solvent and involved in the he l ica l s t ruc tures and in te rna l h y d r o g e n bonding, could have very low exchange rates against D20 , as it has been no t iced in the nat ive conformat ion of o ther p ro t e ins [21, 22, 23]. The observed spec t rum of the ca rp p a r v a l b u m i n (,fig. 6) in D20 indeed seems to reflect the exis tence of d i f ferent ia l ex- change rates of the mobi le p ro tons of the mole- cule, a s i tua t ion w h i c h is c lear ly a p p a r e n t in the hake spec t rum (fig. 3 and 4) f rom the behav iou r of the signals at 7.70 and 10.35 ppm. The in tegra t ion of the observed s ignals also suggests the p resence of p ro tons p a r t i a l l y exchanged wi th deuter ium.
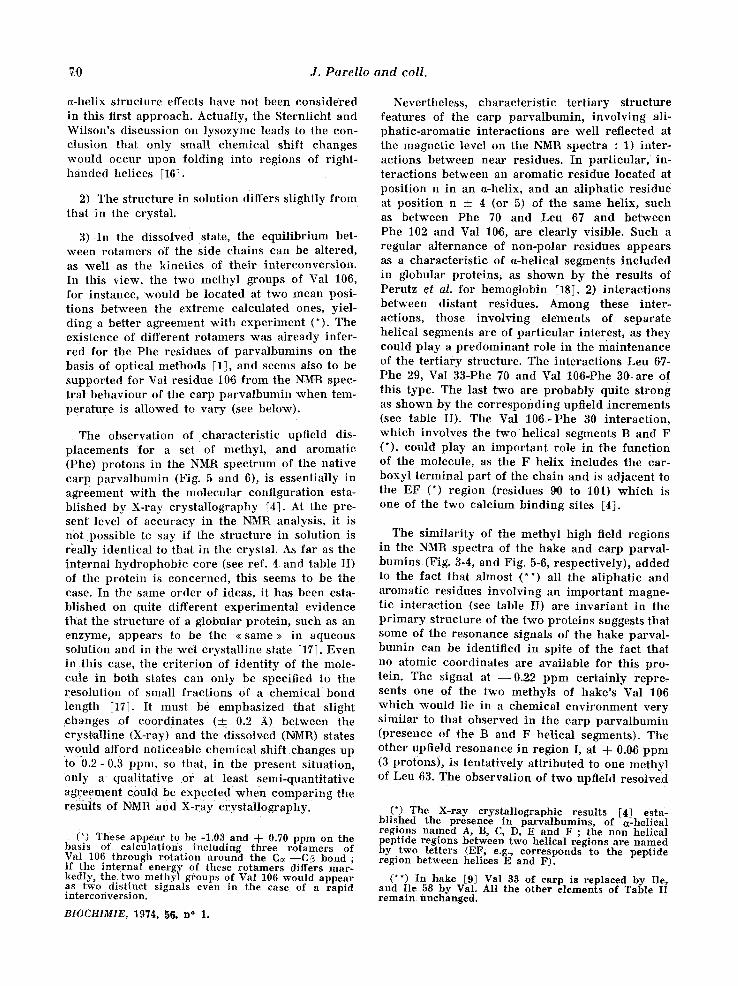
Thermal denaturation of the carp parvalbumin. The spec t ra r e p o r t e d in f igure 8 show definite
a l te ra t ions of the t e r t i a ry s t ruc ture of the ca rp p a r v a l b u m i n when va ry ing the t empera tu re bet- ween 27 ° and 73 °. At the h ighes t t empera tu re , the NMR spec t rum is ve ry c h a r a c t e r i s t i c of a denatu- red state, and appea r s ve ry s imi la r to that of the chemica l ly dena tu red state of figure 2. However , p rec i se d i f ferences a p p e a r w h i c h could be re la ted , among others, to effects due to the d i f ference in t empera tu re be tween both spectra . Region I ' in figure 8 (73 °) is composed of two signals (0.95 and 1.02 ppm) ; f rom the theore t i ca l p r ed i c t i ons [11] based on the amino ac id c o m p o s i t i o n , the la t ter ce r t a in ly co r r e sponds to the Val residues. In the chemica l ly dena tu red spec t rum (fig. 2) only a shoulder is observed at this pos i t ion resul t ing f rom a poo re r reso lu t ion (chemical shifts and ha l f -wid ths of signals) between the Val- and Leu- I le -methyl signals. Another cha rac t e r i s t i c diffe- rence be tween the two k inds of spec t ra is the a p p e a r a n c e of resolved sp in - sp in coupl ing mul t i - plets at h igh t empera tu re because of ha l f -wid th changes ; this occurs in regions II ' ( intense dou- blet, cen te red at 1.48 ppm, J = 7 Hz, methyl groups of Ala res idues) , and in region VII ' ( t r ip le t cen te red at 3.08 ppm, J ~__ 7 Hz of the e - C H 2 groups of Lys res idues) .
The shape of each spec t rum in figure 8 can be r ead i ly unde r s tood as the sum of two spect ra , one c o r r e s p o n d i n g to the nat ive state, the o ther to a
BIOCHIMIE, 1974 , 56, n ° 1.
72 J . P a r e l l o a n d co l l .
d e n a t u r e d s t a t e d e f i n e d b y w h a t is o b s e r v e d at 73 ° . T h i s is so b e c a u s e t h e i n t e r c o n v e r s i o n of b o t h s p e c i e s is a Mow p r o c e s s o n t h e NMR t i m e sca l e
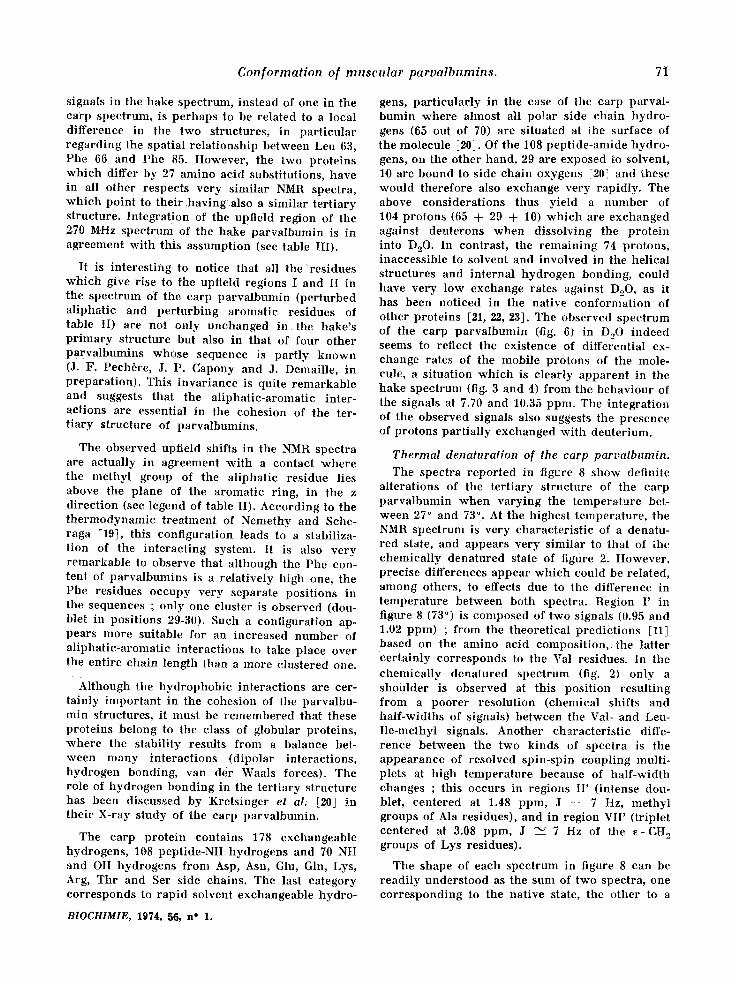
a m e l t i n g t e m p e r a t u r e ( t e m p e r a t u r e at h a l f d e n a - t u r a t i o n ) of a b o u t 65 ° . I t m u s t be e m p h a s i z e d t h a t t h e o b s e r v e d t r a n s i t i o n i n v o l v e s e s s e n t i a l l y h y d r o - p h o b i c r e s i d u e s a n d t h e r e f o r e c o u l d b e r e p r e s e n - t a t i v e of a m e l t i n g p r o c e s s a s s o c i a t e d w i t h t he i n t e r n a l e l e m e n t s of t h e p r o t e i n .
TABLE IV.
T h e r m a l d e n a t u r a t i o n o f carp p a r v a l b u m i n u n d e r c o n d i t i o n s o[ [ igure 8.
Temp. °C
27 43 53 63 68 73
P. cent denatured
0 0 4
38 77
95-100
0 ,5 0 0 - O ~ 5
FI6. 8. - - 1,00 MHz CW zH NMR spectra (high-f ield part) of the carp parva lbumin (protein : 2.9 × 10-,~ M) in phosphate - D~O buf fer , pD = 7.5 (ca 20 ° ) at diffe- ren t tempera tures .
The reference spect rum 27 ° corresponds to the sam- ple of Fig. 5 at a lower s igna l /no i se ra t io (214 scans). The symbol 27 ° (T), T : 43, 53 and 63, means t h a t the spect rum has been recorded at 27 ° a f te r hea t ing the sample at the t empera tu re value repor ted between b r a c k e t s ; the cooling period a lways reached several h o u r s .
Chemical shif ts are quoted in ppm/DSS bu t are re- ferred to the me thy l resonance of a m m o n i u m aceate which was chosen irLvariant a t 1.98 ppm/DSS all t h r o u g h the t empera tu re va r i a t ion ; no t em pe r a t u r e correct ions have been appl ied for th is reference system.
T h e e x p e r i m e n t s i n v o l v i n g a cyc l e of h e a t i n g a n d c o o l i n g r e p o r t e d in fig. 8 a lso c l e a r l y es ta- b l i s h t h e e x i s t e n c e of a r e v e r s i b i l i t y b e t w e e n t he d e n a t u r e d s t a t e a n d t h e n a t i v e s ta te , all t h r o u g h t h e t h e r m a l t r a n s i t i o n . T h e r e v e r t e d s p e c t r a ,
% dena l
100
5O
O. x - - { i
6 o 8 0 -c
Fro. 9. - - Thermal denaturat ion curve of the carp parva lbamin under the condi t ions described in fig. 8. The es t imat ion of p. cent denat, is documented in the Appendix and in table IV.
[22]. H o w e v e r , b e c a u s e of t h e l i m i t a t i o n s of t h e NMR m e t h o d i tse l f , t h e r e is no d e f i n i t e p r o o f t h a t o t h e r i n t e r m e d i a t e c o n f o r m a t i o n s c o u l d no t exis t .
T h e r e s u l t s of c a l c u l a t i o n s b a s e d on t he s i m p l e t w o - s t a t e h y p o t h e s i s a n d u s i n g t h e r e l a t i o n s h i p ,
S - 1.32 × b p. c e n t d e n a t . - - × 10~) g i v e n in
S - 0.25 × b t he A p p e n d i x , a r e s u m m a r i z e d at t a b l e IV, a n d in f igure 9.
T h e t h e r m a l d e n a t u r a t i o n c u r v e (fig. 9) is cha - r a c t e r i s t i c of a c o o p e r a t i v e m e l t i n g p r o c e s s , w i t h
BIOCHIMIE, 1974, 56, n ° 1.
h o w e v e r s h o w s o m e d i f f e r e n c e s w i t h t h e i r d i r e c t c o u n t e r p a r t (27 ° ) w h i c h c o u l d i m p l y i n c o m p l e t e r e f o l d i n g ; t h e d i f f e r e n c e is p a r t i c u l a r l y n o t i c e a b l e w h e n c o m p a r i n g r e g i o n s I I I (d- 0.6 at A- 1.2 p p m ) of t h e t w o n a t i v e s ta tes , 27 ° a n d 27 ° (73 ° ) i n f igu re 8.
A v e r y i n t e r e s t i n g f e a t u r e in t he NMR s p e c t r a of c a r p p a r v a l b u m i n e x a m i n e d u n d e r v a r y i n g t e m p e r a t u r e is t h e s h i f t of t h e u p f i e l d m e t h y l s i g n a l of Val 10,0 (27 ° , - - 0 . 3 5 p p m ; 43 ° , - - 0.22 p p m ; 53 °, - - 0.24 p p m ; 63% - - 0.20 p p m ) .
Conformat ion of muscu lar parvalbumins . 73
The main shift occurs between 27 ° and 43 ° when denatura t ion has not yet o c c u r r e d ; chemica l shifts as well as ha l f -wid th changes are observed in that range of tempera ture . These shifts might be related to the existence of different ro tamers for res idue side chains as has a l ready been discussed
to that of the nat ive pro te in (Fig. 5) and a com- par ison wi th that of the chemica l ly denatured pro- tein (Fig. 2) suggests that, concomit tan t ly to the removal of the calc ium ions, a conformat ion has been reached w h i c h is very s imilar to that of the dena tured state.
I
Z 2 6
b - 1 0
-14 , X
~ 5 5 10 (OtO) 15
l ! t a
- ~o . =:. ~'o ~:5 ,.o o~, do -o.,' o$s
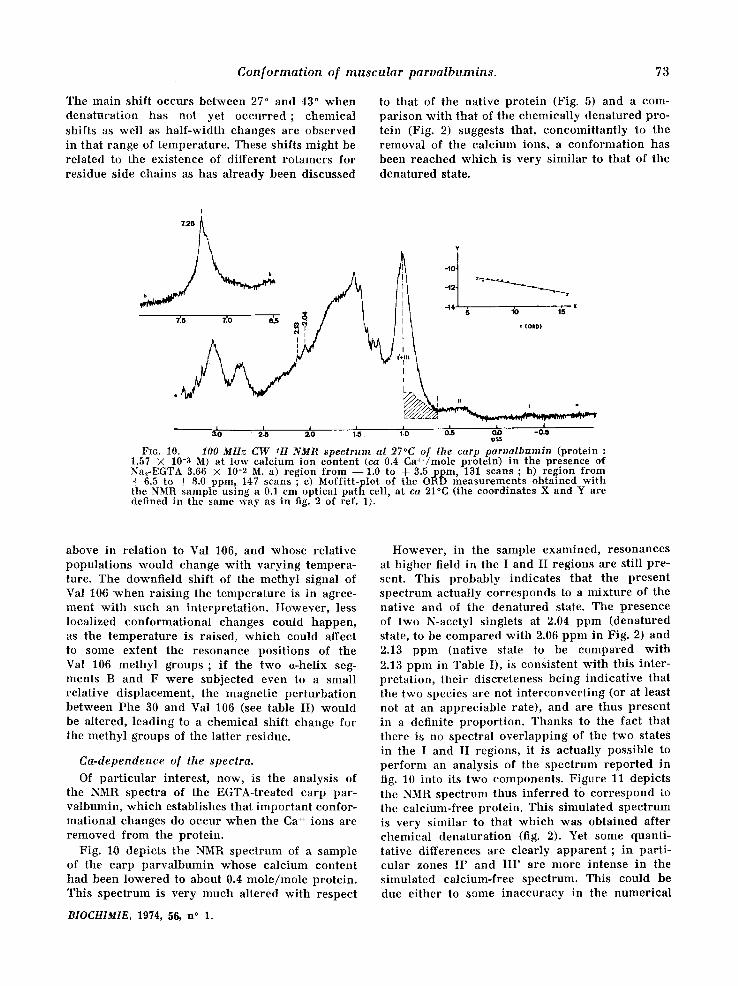
FI6. 10. - - 100 MHz CW 1H NMR spectrum at 27°C of the carp parualbumin (protein :
1.57 × 10⁻³ M) at low calcium ion content (ca 0.4 Ca~+/mole protein) in the presence of Na2-EGTA 3.66 × 10⁻² M. a) region from - - 1.0 to + 3.5 ppm, 131 scans ; b) region from + 6.5 to + 8.0 ppm, 147 scans ; c) Moffitt-plot of the ORD measurements obtained with the NMR sample using a 0.1 cm optical path cell, at ca 21°C (the coordinates X and Y are defined in the same way as in fig. 2 of ref. 1).
above in re la t ion to Val 106, and whose re la t ive populat ions would change wi th va ry ing tempera- ture. The downfield shift of the methyl signal of Val 10fi w h e n ra is ing the t empera tu re is in agree- ment w i th such an in terpre ta t ion . However , less local ized conformat iona l changes could happen, as the t empera tu re is raised, w h i c h could affect t o some extent the resonance posi t ions of the Val 10'6 methyl g r o u p s ; if the two ~-helix seg- ments B and F were subjected even to a small re lat ive displacement , the nlagnet ic per turba t ion be tween Phe 30 and Val 10,6 (see table II) would be altered, leading to a chemica l shift change for the methyl groups of the latter residue.
Ca-dependence of the speclra.
Of par t i cu la r interest , now, is the analysis of the NMR spectra of the EGTA-treated carp par- valbumin, wh ich establishes that impor tan t confor- mat ional changes do occur w h e n the Ca ++ ions are r emoved f rom the protein .
Fig. 1~0 depicts the NMR spec t rum of a sample of the carp pa rva lbumin whose ca lc ium content had been lowered to about 0.4 m o l e / m o l e protein. This spec t rum is very much al tered wi th respect
BIOCHIMIE, 1974, 56, n ° 1.
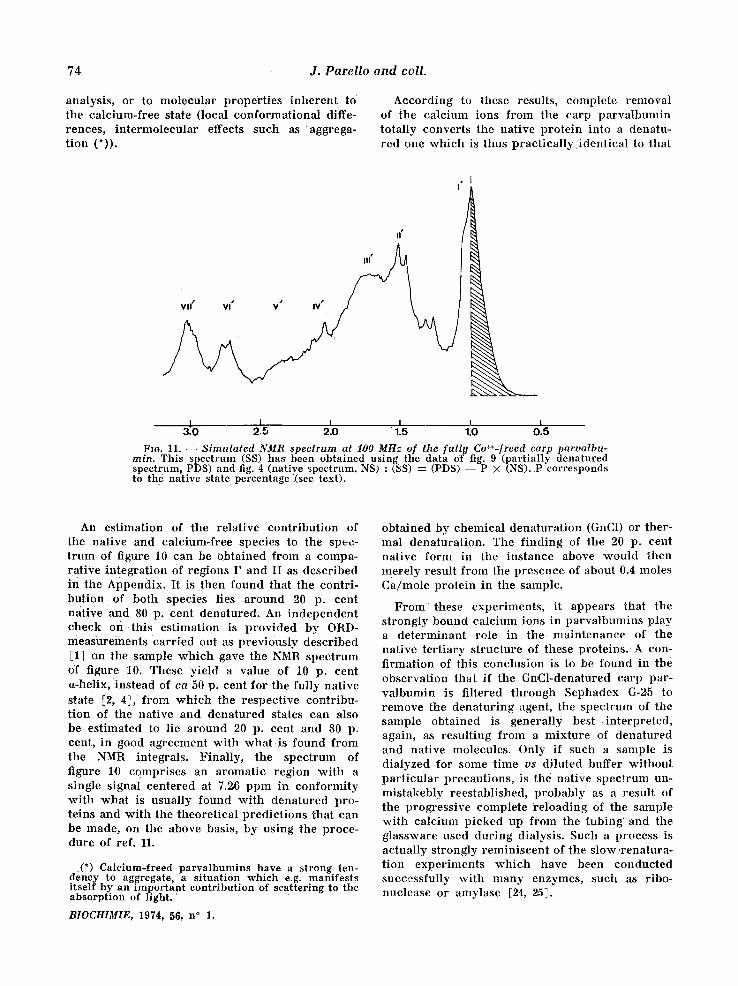
However , in the sample examined, resonances at h igher field in the I and II regions are still pre- sent. This probably indicates that the present spec t rum actually cor responds to a mix ture of the nat ive and of the dena tured state. The p resence of two N-acetyl singlets at 2.04 ppm (denatured stale, to be compared wi th 2.0,6 ppm in Fig. 2) and 2.13 ppm (native state to be compared wi th 2.13 ppm in Table I), is consistent wi th this inter- pretat ion, the i r discreteness being ind ica t ive that the two species are not in t e rconver t ing (or at least not at an apprec iab le rate), and are thus present in a definite p ropor t ion . Thanks to ttie fact that there is no spectral over lapp ing of the two states in the I and II regions, it is actually possible to pe r fo rm an analysis of the spec t rum repor ted in fig. 10 into its two components . F igure 11 depicts the NMR spec t rum thus in fe r red to co r re spond to the calc ium-free protein. This s imulated spec t rum is very s imilar to that w h i c h was obtained after chemica l denatura t ion (fig. 2). Yet some quanti- tat ive differences are clearly apparen t ; in par t i - cular zones II ' and I I I ' are more intense in the s imulated calc ium-free spectrum. This could be due e i ther to some inaccuracy in the numer ica l
74 J . P a r e l l o a n d co l l .
analysis, or to molecular propert ies inheren t to the calcium-free state (local conformat ional diffe- rences, in te rmolecular effects such as aggrega- t ion (*)).
According to these results, complete removal of the calcium ions from the carp pa rva lbumin totally converts the native pro te in into a denatu- red one wh ich is thus pract ica l ly ident ical to that
s I
I1" j
/< /
I I i i i i 3 . 0 2.5 2.0 1.5 1 .0 0 . 5
Fro. 11. S imula ted NMR spectrum at 100 MHz of the [ull!t Ca++-freed earls parvalbu- rain. This spectrum (SS) has been obtained using the data of fig. 9 (partially denatured spectrum, PDS) and fig. 4 (native spectrum, NS) : (SS) : (PDS) - - P X (NS). P corresponds to the native state percentage (see text).
An est imation of the relative con t r ibu t ion of the native and calcium-free species to the spec- t rum of figure 10 can be obta ined from a compa- rat ive in tegrat ion Of regions I ' and II as descr ibed in the Appendix. It is then found that the contri- but ion of both species lies a round 20 p. cent nat ive and 80 p. cent denatured. An independen t check o n t h i s est imation is p rovided by ORD- measurements car r ied out as previously descr ibed [1] on the sample wh ich gave the NMR spect rum of figure 10. These yield a value of 10 p. cent a-helix, instead of ca 50 p. cent for the fully nat ive state [2, 4], from which the respect ive contr ibu- t ion of the native and denatured states can also be estimated to lie a round 20 p. cent and 80 p. cent, in good agreement wi th what is found from the NMR integrals. Final ly , the spectrum of figure 10 comprises an aromatic region wi th a single signal centered at 7.26 ppm in conformi ty wi th what is usual ly found wi th denatured pro- teins and wi th the theoret ical predic t ions that can be made, on the above basis, by us ing the proce- dure of ref. 11.
(*) Calcium-freed parvalbumins have a strong ten- deney to aggregate, a situation which e.g. manifests itself by an important contribution of scattering to the absorption of l ight .
BIOCHIMIE, 1974, 56, n ° 1.
obta ined by chemical denatura t ion (GnC1) or ther- mal denatura t ion. The f ind ing of the 20 p. cent nat ive form in the ins tance above would then merely result from the p resence of about 0.4 moles Ca/mole pro te in in the sample.
F r o m these experiments , it appears that the s trongly bound calcium ions in pa rva lbmnins play a de te rminan t role in t h e ma in tenance of the nat ive ter t iary s t ructure of these p ro te ins , A con. f i rmation of this conclusion is to be found in the observat ion that if the GnCl-denatured carp par- va lbumin is filtered through Sephadex G-25 to remove the dena tu r ing agent, the spect rum of the sample obtained is generally best interpreted, again, as resul t ing from a mixture of denatured and native molecules. Only if such a sample is dialyzed for some time vs diluted buffer wi thout par t icu la r precaut ions , is the nat ive spec t rum un- mistakebly reestablished, p robab ly as a result of the progressive complete re loading of the sample wi th calcium picked up from the t u b i n g and the glassware used dur ing dialysis. Such a process is actually s t rongly remin i scen t of the slow r ena tu ra - t ion exper iments which have been conducted successfully wi th many enzymes, such as ribo- nuclease or amylase [24, 25].
Conformation of muscular parvalbumins. 75
If the s trongly bound calcium ions of parvalbu- mins are s t ructural ly requi red to preserve the in tegr i ty of their nat ive structure, however, it would imply that their possible physiological funct ion canno t he associated wi th a complete exchange of the metal ions. It is conceivable that, in vivo, because of association wi th another mole- cule wh ich could also act as an effector, the dena- tura t ion concomit tant to complete calcium remo- val is prevented. The possibi l i ty remains , never- theless, that, in the cell, pa rva lbumins ei ther release only par t of their f i rmly bound calcium or that their activity is associated wi th the sites of lower affinity for the ion [8]. In this respect, it is in teres t ing that p r e l imina ry exper iments seem to indicate that the calcium content of parvalbu- rains can be lowered appreciably wi thout alter- ation of the major character is t ics of the conforma- t ion of the fully loaded state, and that, on the other hand, the chemical shifts of some signals (C2-H of His, S-CH 3 of Met in the hake parvalbu- rain) are sensit ive to calcium in excess of 2 moles / mole protein.
CONCLUSIONS.
The impor tan t chemical shift changes obser- ved in the NMR spectra of pa rva lbumins in funct ion of their conformat ional state suggest that this technique is a very valuable one for detecting and ident i fy ing such changes unde r varied condi t ions . Actually, the great solubil i ty and the smal l size, as well as dominan t role of the simple hydrophobic in teract ions which ~orm the basis of the in terna l cohesion of these pro te ins and which can be well in te rpre ted theoretically, all contr ibute to make pa rva lbumins a mater ia l of choice for NMR studies, especially as so much detailed in format ion is available on their p r ima r y and on their ter t iary structure.
The conformat ional changes associated wi th the specific Ca-binding propert ies of pa rva lbumins undoubted ly are among the most in teres t ing aspects of such studies. The dena tura t ion observed here concomit tant ly to complete calcium removal should be considered only as a first result to be supplemented by many future investigations. How- ever, an apprecia t ion of the technica l condi t ions unde r wh ich a more precise and quant i ta t ive ana- lysis of the N~R spectra of pa rva lbumins can be conducted has thus been gained.
It is therefore reasonable to hope that a de- tailed invest igat ion of the mechan i sm of calcium release and capture by pa rva lbumins can be successfully conducted by NMR spectroscopy. An
extension and more gradual use of the techniques employed in the present work, coupled wi th CA) exper iments [1] should provide details about the changes in the general archi tecture of the mole- cule concomi t tan t to such a process. On o t h e r hand, the use of paramagnet ic shifts reagents, such as lanthanides , would be helpful in detect ing eon- format ional changes a round the Ca2÷ b i n d i n g sites. Work is now in progress along these different lines.
Ackno~vledgments.
T he k i n d c o m m u n i c a t i o n of a t o m i c c o o r d i n a t e s of the carp parvalbumin by Dr. R. H. Kretsinger, Dept. of Biology, University of Virginia, is gratefully a c k n o w - ledged. Drs. H. P. Kellerhals and W. Schittenhelm helped greatly by permitting the use of their supra- conducting spectrometer Bruker HX-270. Mr. Ch. Gauf- tier, Laboratoire de RMN, USTL, Montpellier, is t o be thanked for its efficient cooperation in the recording of the spectra. Dr. A. Fruchier, USTL, Montpellier, kindly provived a version of the LAOCN 3 NMR pro- gram.
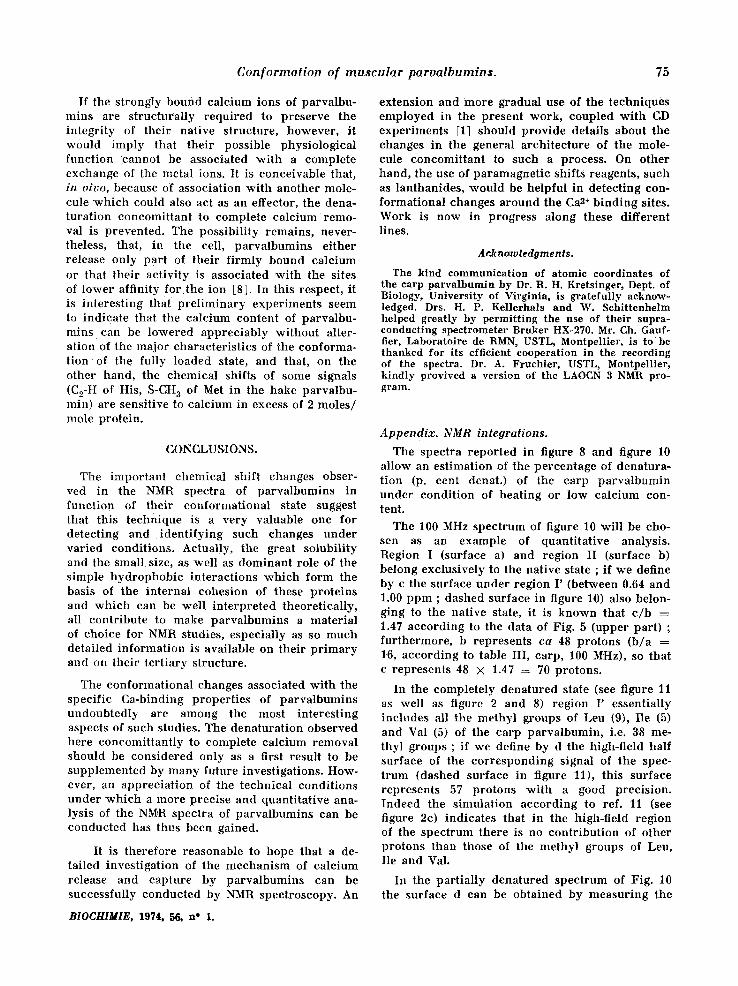
Appendix. NMR integrations.
The spectra repor ted in figure 8 and figure 10 allow an est imation of the percentage of denatura- t ion (p. cent denat.) of the carp pa rva lbumin unde r condi t ion of heat ing or low calc ium con- tent.
The 100 MHz spectrum of figure 10 will be cho- sen as an example of quant i ta t ive analysis. Region I {surface a) and region II (surface b) belong exclusively to the native state ; if we define by c the surface unde r region I ' (between 0.64 and 1.00 ppm ; dashed surface in figure 10) also belon- ging to the nat ive state, it is know n that c / b ---- 1.47 according to the data of Fig. 5 (upper part) ; fur thermore, b represents ca 48 protons (b /a = 16, according to table III, carp, 100 MHz), so that c represents 48 X 1.47 = 70 protons.
In the completely denatured state (see figure 11 as well as fignlre 2 and 8) region I ' essential ly inc ludes all the methyl groups of Leu (9), Ile (5) and Yal (5) of the carp pa rva lbumin , i.e. 38 me- thyl groups ; if we define by d the high-field half surface of the cor responding signal of the spec- t rum (dashed surface in figure 11), this surface represents 57 protons wi th a good precision. Indeed the s imula t ion according to ref. 11 (see figure 2c) indicates that in the high-field region of the spectrum there is no con t r ibu t ion of other protons than those of the methyl groups of Leu, Ile and Val.
In the par t ia l ly denatured spect rum of Fig. 10 the surface d can be obtained by measur ing the
BIOCHIMIE, 1974, 56, n ° 1.
76 J. P a r e l l o a n d col l .
w h o l e s u r f a c e S b e t w e e n 0.64 a n d 1.00 p p m , d = S - - c = S - - - b × 1.47.
U n d e r t h e s e c o n d i t i o n s , p. c e n t dena t . = S - 1.47 × b
× 100, fo r t h e e x p e r i m e n t s deal - S - 0.28 × b
i n g w i t h c a l c i u m r e m o v a l ; e.g. p, cen t dena t . = 79 fo r t h e s a m p l e of f igure 10.
In t h e case of t h e t h e r m a l d e n a t u r a t i o n (fig. 8), S - 1.32 X b
p. c e n t dena t . ---- × 100. S - - 0.25 b
R~SUM~.
La spectroscopic RMN (r~sonance protonique fi 100 et 270 MHz) a ~t~ utilis6e pour observer des change- ments eonformat ionnels dans deux parvalbumines m.usculaires en provenance du merlus (Merluccius merluccius) et de la carpe (Cyprinus ca~pio) lors du passage de l '6tat nat i f h l '$tat ddutatur6 (chlorure de guanidinium 6M ou ehauffage) ou h celui obienu aprSs eul6vement presque complet des ions calcium. De ces observat ions il rSsulte que cette derni6re operat ion conduit h une conformat ion tr~s scrub]able h celle qui est obtenue apr6s d6naturat ion chimique ou thermi- que. D'autre part, le spectre RMN de la parvalbumine de carpe native peut ~tre iuterpr6t6 sur la base des do nndes obtenues ail leurs lors d 'une 6tude aux rayons X des cristaux de cette prot6ine. Certains aspects de la s t ructure pr imaire de ces parvalbumines, en part icul ier la p r e s e n c e d 'un r~sidu ac6tyl6 N-ter- minal, ont dgalement 6t6 examiufs h l 'aide de la technique de RMN.
REFERENCES.
1. Parello, J: a Pech6re, J.-F. (1971) Biochim., 53, 1079-1083.
2. Rao, K. S. P. B. a Gerday, C. (1973) Comp. Biochem. Physiol., 44 B, 1113-1125.
3. Kretsinger, R. H., Nockolds, C. E., Coffee, C. J. a Bradshaw, R. A. (1971) Cold Spring Harbor Symposium, 36, 217-220.
4. Nockolds, C. E., Kretsinger, R. H., Coffee, C. J. & Bradshaw, R. A. (1972) Proc. Natl. Acad. Sci., 69, 581-584.
5. Konosu, S., Hamoir, G. a Peeh6re, J.-F. (1965) Bio- chem. J., 96, 98-112.
6. Peeh6re, J.-F. (1968) Comp. Biochem. Physiol., 24, 289-295.
7. Peeh~re, J.-F., Capony, J.-P. & Rydbn, L. (1971) Eur. J. Biochem., 23, 421-428.
8. Benzonana, G., Capony, J.-P. & Pech6re, J.-F. (1972) Biochim. Biophys, Acta, 278, 110=116.
9. Capony, J.-P., Ryd6n, L., Demaille, J. & Pechbre, J.-F. (1973) Europ. J. Biochem., 32, 97-108.
10. Pech6re, J.-F., Demaille, J. & Capony, J.-P. (1971) Biochim. Biophys. Acta, 236, 391-408.
11. McDonald, C. C. & Phill ips, W. D. (1969) J. Am. Chem. Soc., 91, 1513-1521.
12. Capony, J.-P. & Pech6re, J.-F. (1973) Europ. J. Bio- chem., 32, 88-96.
13. Lazlo, P. (1967) Progr. NMR Spectroscopy, 3, 231- 402.
14. Johnson, C. E. Jr. & Bovey, F . .4 . (1958) J. Chem. Phys., 29, 1012-1014.
15. Durand, P., Parello, J., Buu-Hoi, N. P. a Alais, L. (1963) Bull. Soc. Chim., 2438-2441.
16. Sternlicht, H. & Wilson, D. (1967) Bioehem., 6, 2881- 2892.
17. Rossi, G. L. & Bernhard, S. A. (1970) J. MoL Biol., 49, 85-91.
18. Perutz, M. F., Kendrexv, J. C. & Watson, H. C. (1965) J. Mol. Biol., 13, 669-678.
19. Nemethy, G. & Scheraga, H. A. (19629 J. Phys. Chem., 66, 1773-1789.
20. Kretsinger, R. H. & Nockolds, C. E. (1973) J. Biol. Chem., 248, 3313-3326.
21. Hvidt, A. & Nielsen, S. O. (19'66) Adv. Protein Chem., 31, 287-386.
22. McDonald, C. C..& Phil l ips, W. D. (1970) Biological Macromolecules, Marcel Dekker, Inc., New York, 4, 1-48.
23. Karplus, S., Snyder, G. H. & Sykes, B. D. (1973) Biochem., 12, 1323-1329.
24, Anflusen, C. B. (1967) Harvey Lect., 61, 95-I16. 25. Fukushi, T. & Isemura, T. (1968) J. Biochem.
(Tokyo), 64, 283-292.
BIOCHIMIE, 1974, 56, n ° 1.


![CRYSTAL GARANTIES 2011 BAT10ï Mise en page 1 - Net … · 2011-05-05 · [CRYSTAL STUDIES] Crystal Studies, l’assurance complète de vos études à l’étranger ! Crystal Studies](https://img.pdfslide.fr/doc/110x75/5ebc95e11463d476e401c447/crystal-garanties-2011-bat10-mise-en-page-1-net-2011-05-05-crystal-studies.jpg)