Embed Size (px)
Citation preview
HEC MONTRÉAL
Determinants of Economic Growth in Sub-Saharan
African Countries: A Panel Data Approach
par
Jérémie Gingras
Science de la gestion
(Économie Appliquée)
Mémoire présenté en vue de l'obtention
du grade de maîtrise ès sciences
(M.Sc.)
Avril 2018
©Jérémie Gingras, 2018

Sommaire
Cette étude se penche sur deux questions interconnectées : quels facteurs stim-
ulent la croissance économique dans la région de l'Afrique subsaharienne (ex-
cluant L'Afrique du Sud) et parmi ces facteurs, lesquels ont la plus grande
in�uence sur le développement économique de la région? Pour répondre à
ces questions, nous avons eu recours aux données de panel issues de 35 pays
entre 2000 et 2015. L'hétérogénéité des pays étudiés se manifeste à travers
une multitude de variables telles que les conditions initiales, les ressources
disponibles, les institutions, l'histoire, etc. Nous avons des raisons de croire
que ces variables peuvent avoir une in�uence sur la croissance du PIB des
pays. Par conséquent, l'utilisation d'un modèle à e�ets aléatoires a permis
tenir compte de l'hétérogénéité non observée à travers les régions. Les résul-
tats indiquent que la formation de capital physique, un secteur d'exportation
dynamique, l'aide humanitaire et le capital humain sont positivement corrélés
à la croissance du PIB dans les pays de l'Afrique subsaharienne. Parmi ces
déterminants, le capital physique, les exportations et l'aide humanitaire sont
fortement et positivement corrélés avec la croissance du PIB entre 2000 et
2015. Étonnamment, les résultats démontrent que les investissements directs
étrangers ont un impact minimal sur la croissance économique des pays de
cette région, voire même négligeable, en particulier à court terme.
i
Determinants of Economic Growth in Sub-Saharan
African Countries: A Panel Data Approach*
Gingras, J.�, Delelegn, M.�, Kinfu, Y.�
April 25, 2018
Abstract
The paper addresses two broad and interconnected questions: whatdrives growth in Sub-Saharan African (SSA) region (excluding SouthAfrica) and which factor or determinant among those investigated hasthe strongest in�uence on the region's economic growth trajectory? Inresponding to these questions, we used panel data from 35 countriesfor the years 2000-2015. The countries studied are heterogeneous withdi�erent initial conditions, resources base, history and institutions andmany other variables. We have reasons to believe that these variableshave some in�uence on GDP growth. In this regard, the study em-ployed a random e�ects model to account for unobserved heterogeneityacross the region. The empirical results indicate that physical capi-tal formation, a dynamic export sector, foreign aid and human capitalare positively correlated with GDP growth in SSA. Of these, the �rstthree (physical capital, dynamic export sector and ODA) are stronglyand positively correlated with GDP growth during 2000-20015. Sur-prisingly, the results show that the role of foreign direct investment indriving economic growth in the region is minimal at best or negligibleat worse, especially in the short run.
JEL-Codes : C23, F43.Keywords : Economic growth, Sub-Saharan Africa, panel data.
*This paper was written in the ful�lment of the requirements for the degree of Masters inApplied Financial Economics, Department of Applied Economics, HEC Montreal (Prof. Dr.Martin Boyer, HEC Montreal) and in the context of an internship with UNCTAD (MussieDelelegn, Senior Economic A�airs O�cer and Chief of Landlocked Devolpping CountriesSection, UNCTAD)
�Department of Applied Economics, HEC Montreal, Montreal, Canada.�Division for Africa, Least Developed Countries and Special Programmes, United Nations
Conference on Trade and Development, Geneva, Switzerland.�Center for Research and Action in Public Health, University of Canberra, Canberra,
Australia.
Contents
Sommaire . . . . . . . . . . . . . . . . . . . . . . . . . . . . . . . . . . i
Abstract . . . . . . . . . . . . . . . . . . . . . . . . . . . . . . . . . . . ii
List of tables . . . . . . . . . . . . . . . . . . . . . . . . . . . . . . . . v
List of �gures . . . . . . . . . . . . . . . . . . . . . . . . . . . . . . . . vi
1 Introduction . . . . . . . . . . . . . . . . . . . . . . . . . . . . . . . 1
2 Economic growth in Sub-Saharan Africa . . . . . . . . . . . . . 2
3 Theoretical background . . . . . . . . . . . . . . . . . . . . . . . . 7
3.1 Initial capital . . . . . . . . . . . . . . . . . . . . . . . . . . . . 8
3.2 Foreign Direct Investment . . . . . . . . . . . . . . . . . . . . . 8
3.3 Physical Capital formation . . . . . . . . . . . . . . . . . . . . . 9
3.4 Government expenditures . . . . . . . . . . . . . . . . . . . . . 10
3.5 Economic freedom . . . . . . . . . . . . . . . . . . . . . . . . . 11
3.6 Openness to trade . . . . . . . . . . . . . . . . . . . . . . . . . . 11
3.7 Human capital . . . . . . . . . . . . . . . . . . . . . . . . . . . 12
4 Determinants of Economic Growth: Model Speci�cation . . . 14
5 Data and variables . . . . . . . . . . . . . . . . . . . . . . . . . . . 16
6 Estimation Methodology . . . . . . . . . . . . . . . . . . . . . . . 16
7 Estimation results . . . . . . . . . . . . . . . . . . . . . . . . . . . 19
8 Conclusion and Policy Recommendations . . . . . . . . . . . . 22
References . . . . . . . . . . . . . . . . . . . . . . . . . . . . . . . . . . 25
Appendices . . . . . . . . . . . . . . . . . . . . . . . . . . . . . . . . . A-i
iii

A Outliers and extreme values . . . . . . . . . . . . . . . . . . . . . A-i
B Countries included in the research . . . . . . . . . . . . . . . . . B-i
iv

List of Tables
1 De�nitions and data sources of variables. . . . . . . . . . . . . . 17
2 Regression table . . . . . . . . . . . . . . . . . . . . . . . . . . . 20
3 Descriptive statistics . . . . . . . . . . . . . . . . . . . . . . . . 21
4 List of countries included in the sample . . . . . . . . . . . . . . B-i
v
List of Figures
1 GDP growth per capita, 2000-2015. . . . . . . . . . . . . . . . . A-i
2 Mesures of leverage and squared normalized residuals. . . . . . . A-i
vi
1 Introduction
The paper attempts to address some of the limitations and shortcomings ob-
served in earlier works in explaining the determinants of growth in Sub-Saharan
Africa. Its contribution to the existing literature lies in its comprehensiveness -
it considers multidimensional variables; its inclusiveness -it covers 35 countries;
and dealing with heterogeneity within the region. The paper closely examines
the combined role of endogenous and exogenous determinants of growth (such
as ODA, FDI). Based on a panel approach, it responds to two interrelated ques-
tions: what determines growth in Sub-Saharan African countries and which
of the determinants has the greatest in�uence in growth trajectories of the
region?
This paper will focus on the links between empirical evidence and economic
policymaking in Sub-Saharan Africa. In this context, the paper is motivated by
three key inter-related factors: �rst, formulating and implementing right poli-
cies and strategies in Sub-Saharan African countries requires careful analysis
and understanding of key determinants of growth. Second, a clear identi�-
cation of key determinants and understanding the degree of in�uence of each
factor can assist policy makers and practitioners to develop sector speci�c poli-
cies where each of the countries in the sub-region has comparative advantages.
This also helps countries to understand and deal with binding constraints and
limiting exploitation of comparative advantages. Finally, understanding key
sectors and binding constraints can greatly assist policy makers in the design,
rationalization and realignment of appropriate and targeted interventions (in-
centives) aimed at exploiting existing comparative advantages and addressing
binding constraints. This will in turn enable countries in the region to identify
latent comparative advantages or to adapt to emerging global opportunities
(e.g. as Mauritius has been doing in the �nancial services and ICT sectors).
Therefore, the ultimate objective of the paper is to understand key drivers
of economic growth with the view to seek ways and means to make growth
1
in Sub-Saharan Africa broad-based, inclusive and sustainable with substantial
impact on job creation and poverty reduction.
2 Economic growth in Sub-Saharan Africa
Economic growth, its sources and key determinants has been subject to empir-
ical investigation in developing countries as a whole. More speci�cally, these
studies have focuded on causes and consequences of economic convergence (or
divergence) between developed and developing countries using the two main
growth theories - neoclassical and endogenous growth theories as their main
frame of reference (Arvanitis and Loukis (2009)). This in turn has been mo-
tivated by two broad trends: �rst, convergence in income of some developing
economies such as those in East Asian (emerging) economies with developed
economies; and second, the persistent lag of the African region in the catch-up
process. The convergence and divergence trends are also behind the reasons
for an increasing interest to understand the sources, form and quality of eco-
nomic growth. The focus of these and other earlier similar works has primarily
been on investigating the role of human and physical capital formation, po-
litical stability and market distortions in economic (and income) convergence
or divergence. For instance, using school enrolment as proxy for human cap-
ital, Barro (1991) argued that for a given starting value of per capita GDP,
a country's subsequent growth is positively related to initial human capital.
On the other hand, factors of accumulation could explain the di�erences in in-
come per capita according tothe neoclassical school of thought (Solow (1956)).
Others such as Romer (1986) and Romer (1990) underscored the importance
of externalities associated with physical and human capital formation as well
as innovation in driving sustained and steady growth. Further research on
sources of economic convergence or divergence placed emphasis on the role
of institutions as fundamental causes of di�erences in economic development
between and across countries (Acemoglu et al. (2005)).
2
As with many developing economies, there was a need to understand growth
dynamics and related challenges in the African region in general and Sub-
Saharan Africa in particular. The fact that African countries, especially those
in the Sub-Saharan region (excluding South Africa) have been lagging behind
the rest of the developing world in economic growth and income convergence,
continues to attract the attention of researchers, policy makers and practi-
tioners alike. Aghion et al. (1998) refers to the club convergence phenomenon,
where some countries manage to converge to growth rates of the most advanced
countries and others (for example, African countries) diverge from them. Con-
sequently, robust empirical and historical work has been undertaken on the
sub region as a whole- at a country level or on a group of countries. These
include, but not limited to, tracking Africa's economic growth performance
and understanding key determinants of growth. Such an important work is
expected to continue in the future as well, so long as there is no conclusive
evidence as yet as to what determines the growth performance of the African
continent as a whole and the Sub-Saharan region in particular.
With respect to the Sub-Saharan region, the most notable and compre-
hensive work undertaken on the subject to date is a two-volume assessment
of the political economy of growth in the region carried out by the African
Economic Research Consortium (AERC). Drawing from rigorous country spe-
ci�c studies, this work analysed Africa's growth experience. It did so through
two broad analytical frameworks: (a) an analysis of "anti-growth syndrome"
and explanation of observed policy patterns in terms of political economy and
geography; and (b) an application of the "syndrome taxonomy" to issues of
contemporary growth strategies. These analytical frameworks or approaches
encompass �ve key features: divergence of income between Africa and the rest
of the developing regions, diversity of countries covered by the study, slow
capital accumulation, demographic shift and limited structural transformation
and inter-temporal variation of growth rates within countries (growth volatil-
ity). The broader policy conclusions of the work were on improving economic,
3
environmental and political governance. These include the need for putting in
place appropriate investments and policy choices, overcoming locational dis-
advantages and building human capital. The study focussed in the analysis
of "anti-growth syndrome" and an application the "syndrome taxonomy" to
address binding constraints (Ndulu (2008)).
Subsequently, Collier et al. (1998) investigated the relative importance of
technology and endowments of human and physical capital in determining
di�erences in earnings and productivity of the manufacturing sector in the
selected Sub-Saharan African Countries (Cameroun, Ghana, Kenya, Zambia
and Zimbabwe). Accordingly, "evidence from the earnings functions shows that
private returns to both experience and education rise with level of education,
whereas evidence from the production function gives lower returns on education
than the earnings function". While the analysis and the �ndings provides
valuable input for policy making, the study is con�ned to a speci�c sectors
(manufacturing) and only �ve countries from SSA. It also covers a limited
number of variables (technology, human and physical capital). Such a narrow
approach limits a wider applicability of the underlying policy recommendations
to a broader context.
Further e�orts to clearly de�ne or understand key determinants of eco-
nomic growth in SSA have been undermined by the policies and strategies
pursued in the sub region. This was partly due to the fact that development
policies and strategies pursued and implemented in Sub-Saharan Africa dur-
ing the last several decades has been exclusively focused on generating high
economic growth. Notable exemples of these strategies were the Structural
Adjustment Programmes (SAPs) of the 1980s, Poverty Reduction Strategy Pa-
pers (PRSPs) of the 1990s, which guided, directed and in�uenced formulation
and implementation of domestic policies and strategies in SSA. The prescribed
policies have not been fully internalized by African institutions and human re-
sources. Nor have they been fully integrated with domestic sectoral policies
wherever such policies existed. In fact, they have created parallel coordina-
4
tion mechanisms and, at times, they diverted or competed for scarce investible
resources. Moreover, the underlying assumption of theses policies was that
a sustained high economic growth would lead to robust employment oppor-
tunities and substantial reduction in the number of people living in extreme
poverty rapidly. This broad assumption de�ected the attention of African
policy makers and practitioners away from factors determining or generating
a sustainable economic growth. Such a misplaced or mistaken focus on the
quantity of economic growth has masked the key determinants of economic
growth and their behaviours. This greatly weakened the institutional capaci-
ties and domestic ownership of policies and strategies. The later was caused
by weak integration of externally imposed or prescribed policy into sectoral
regulations (UNCTAD (2008)).
The broad consequence of these phenomenon was that it undermined e�orts
to identify sectors of comparative advantages in the countries and misguided
the incentive structure by directing them towards ine�cient and economically
less viable sectors. The con�uences of these phenomenon greatly diminished
the capacities of African countries to deal with growth-disrupting impacts of
endogenous or exogenous shocks that most countries in Sub-Saharan Africa
have often been subjected to. These poverty reduction-centred and growth-
driven policy frameworks also reoriented public expenditure and budgets to-
wards social sectors where poverty outcomes were thought to be signi�cant
and quicker. OECD/DAC data on O�cial Development Assistance in the
1990s and 2000s shows that ODA commitment to social sector, on average,
constituted more than 40 per cent of net ODA disbursements to SSA, while
the share of productive sectors (agriculture and industry) continues to decline
or receive less priority (UNCTAD (2008)). The focus of national budgetary
process and donor funding on social sectors is not bad in itself, but this should
not have been done at the expense of production and productive sectors or pro-
ductive capacity development, which is key in determining economic growth,
its inclusiveness and sustainability.
5
As much as earlier policies masked determinants of growth, they have also
weakened endogenous policy formulation and implementation capacities in
Sub-Saharan Africa. Above all, the policies with weak ownership and im-
plementation capacities misplaced excessive emphasis on the quantity of eco-
nomic growth at the expense of quality, form and sustainability. The focus
on growth (quantity) without understanding its sources, form and quality un-
dermined e�orts to clearly explain and understand drivers or determinants of
economic growth. This phenomenon led to rethinking development polices
in Sub-Saharan African countries. Sub-Saharan African countries themselves
realized the need for reorienting their macroeconomic, industrial, agricultural
(rural) and infrastructure policies towards generating inclusive and sustained
economic growth capable of creating decent jobs and accelerating transforma-
tive development. The New Partnership for Africa's Development (NEPAD) -
a regionally owned framework, adopted in 2001, was a response to the need for
home-grown solutions to speci�c development problems and challenges facing
the African continent. However, the noble objectives of NEPAD to lead African
countries' transformative development has been extremely slow due mainly to
weak institution and human resources capacities, lack of adequate �nance,
poor prioritization strategy and other persistent problems facing Africa.
In the recent discourse on the so-called paradigm shift in development po-
lices in Africa, key issues such as policy space, country ownership of develop-
ment polices, governance, partnership and the concept of productive capacities
- all have become at the center of global trade and development discourse in
recent years. There is emerging consensuses now that, for African countries to
achieve broad-based, sustained and inclusive economic growth, it is critical to
go through fostering productive capacities. This path involves an increase in
the share of high productivity manufacturing and modern services in output,
accompanied by an increase in agricultural productivity (UNCTAD (2012)).
In terms of identi�cation and analysis of determinants of growth, this means
that drivers of economic growth are multi-dimensional and understanding or
6
explaining them requires a comprehensive approach.
3 Theoretical background
As discussed earlier in the paper, neoclassical theory identi�es ingredients nec-
essary for sustained economic growth. It focuses on three components that
in�uence the total output of an economy, which include the quality and quan-
tity of physical capital, availability of labor and technology. Solow (1956) and
Swan (1956) made major contributions to the neoclassical theory and the de-
terminants of the growth path of an economy. The Solow-Swan growth model
attributes the steady-state equilibrium of an economy with 3 main factors:
capital formation, gains in productivity and labor growth. The model pre-
dicts that in the short run, the growth of an economy is determined by the
attainment of a new steady state wich can be achieved through increase capital
investment, high saving rate, labor force growth and the depreciation rate. In
the long run, the authors concluded that growth is achievable only through
exogenous technological progress. Since then, Mankiw et al. (1992) made im-
portant additions to the work of Solow and Swan by introducing human capital
components to the model. These authors, alongside later research, dismiss the
Solow-Swan model in favor of endogenous-growth models that assume constant
and increasing returns on capital. One of the main idea that was put forward
is the concept of conditional convergence, also known as the catch-up e�ect.
This hypothesis refers to the tendency of a developing economy to grow at a
higher rate per capita than a more developed economy and therefore reducing
the di�erence between the two economies.
In more recent years, renewed emphasis was placed on explaining the dif-
ferences in per-capita growth rate across countries with a set of quanti�able
explanatory variables (Barro (2003)). Our work is motivated by some of the
most in�uential �ndings brought to light by these literatures which identify
the key determinants of economic growth. These include: initial capital, for-
7
eign direct investment, physical capital formation, government expenditure,
economic freedom, openness to trade and human capital.
3.1 Initial capital
The initial capital hypothesis as a source of economic growth, is directly linked
to the conditional convergence hypothesis mentioned earlier. Accordingly,
Barro (2003) reported an inverse relationship between initial level of GDP and
GDP per capita growth of the following period. His models predicted a higher
growth rate of GDP per capita in response to lower starting point of GDP,
when other variables are held constant. However, the pace of convergence
is expected to be dependent on context-speci�c structural factors, including
level of human capital (i.e. life expectancy and educational attainment) and
the policy environment in place in each country.
3.2 Foreign Direct Investment
In recent years, the stock and �ow of foreign direct investments (FDI) grew at
an exponential rate due to the internationalization of economic activities. It
has therefore attracted much attention as a determinant of economic growth
both in empirical and policy areas. However, the empirical literature studying
the impact of FDI on economic growth has been divided. On one hand, multi-
ple studies have linked FDI to economic growth in the host country mainly due
to the gain in productivity caused by the transfer of new technologies, more
e�ective management and positive in�uence on local markets (see Xu (2000),
and Alfaro et al. (2004)). On the other hand, Wang and Wang (2015) found no
evidence of additional productivity gains from foreign investment, since both
domestic and foreign acquisitions brings productivity improvements. These
authors compared the post-acquisition performance changes of foreign and do-
mestic acquired �rms in China. After controlling for the acquisition e�ect in
domestic acquisitions, they found no evidence that foreign ownership can bring
8
additional productivity gains to the acquired �rms. Likewise, by studying the
spillovers e�ects from joint ventures in Venezuelan plants with and without
foreign equity participation, Aitken and Harrison (1999) concluded that FDI
may not bring any bene�cial spillover e�ects in the host country and possi-
bly creating a destructive competition between foreign a�liates and domestic
�rms.
3.3 Physical Capital formation
The World Bank de�nes physical capital formation as the amount by which
total physical capital stock increased during an accounting period plus net
changes in the amount of inventory outlays on additions to the �xed asset of a
given economy. This generally refers to additional or incremental investment
in machineries, tools, new technologies and other productive assets used in
the production processes. Usually, it does not include consumption (capital
depreciation). UNCTAD uses the notion of Gross Fixed Capital Formation
(GFCF), which it de�nes as "an increase in physical assets (investment minus
disposals) within the measurement period, wich is being disaggrated into gross
public capital formation, gross �xed domestic private capital formation and
foreign direct investment" (UNCTAD (2006)).
As demonstrated by Solow (1962), physical capital formation is a necessary,
but not su�cient, condition for growth. One of the key �ndings of Ndambiri
et al. (2012) and Artelaris et al. (2007) is that even though physical capital
formation is generally less e�cient for the case of African countries, it is still
a fundamental determinant of economic growth. Another interesting study
by Collier et al. (1998) found that private returns on physical capital in Sub-
Saharan Africa are higher than those available on human capital investments
in production function, implying also a high cost of physical capital in the
region. This partly explains the reasons for failure in Africa to foster structural
economic transformation and vibrant manufacturing sector.
9
3.4 Government expenditures
The role of government (alternatively, State) in economic development has
been a center of debate for several decades. The intensity and degree of con-
troversies vary between and across schools of economic thoughts. Earlier con-
tributions to and debates on the role of governments (states) centered on the
preservation of national economic interest and the promotion of socio-economic
wellbeing of individuals and communities. Adolph Wagner 1 was the �rst to
provide comprehensive empirical evidence or explanations on the nexus be-
tween economic development and a relative growth in the public sector (Dutta
and Magableh (2006)). He postulated that government expenditure grows
faster than the economy during the early processes of industrialization and
urbanization (Biehl et al. (1998)). Acoording to the autor, the growth in the
size of the economy is accompanied by a concomitant relative growth in gov-
ernment (public) expenditure on providing goods and services (Egbetunde and
O Fasanya (2013)). For Yavas (1998), the size and type of expansion of gov-
ernment activity in an economy di�ers according to the stages of development.
On the other hand, Rathenau (1921), viewed the State as "the guardian and
administrator of enormous means of investment where it places such means
at the disposal of all productive occupation and will eventually determine the
level and rates of wage to be paid".
Recent literature has also continued to provide substantial analysis on the
respective role of the government and market with a focus on e�cient alloca-
tion of resources. As with earlier work, contemporary literature stresses that
government policies play a major role in the growth path of an economy. Oth-
ers view government intervention in resources allocation as a source of market
distortions and argue that market does the best job in allocative e�ciency.
1German economist who advanced the "Law of Fiscal Institutions and the Growth ofGovernment" referred to as Wagner's Law (Hutter (1982)). He also laid the foundation forlabour laws, social security contracts, competition law, systems of credit and various lawson extension of public property in the provision of public goods and services. He provided,perhaps, the �rst empirical estimation and economic interpretation of the nexus betweenthe size of the economy and the size of government (1870- 1890)
10
As de�ned by Barro (2003), government consumption measures expenditures
that do not directly a�ect productivity but can lead to distortions in the econ-
omy. These distortions can be caused by ine�cient government activities with
adverse e�ects on the private sector associated with public taxes. In a simi-
lar study, Barro (1995) concluded that when non-productive government con-
sumption is low and distortions in the private markets are limited, it induces
higher levels of real per capita GDP. Generally, for the neoliberal school of
thoughts, it is the market that �xes economic problems by allocating scarce
resources e�ectively and e�ciently. While there is no conclusive evidence on
the roles of state and markets, nevertheless, there is emerging consensus that
both markets and states (governments) are needed for the proper (e�cient)
functioning of the economy.
3.5 Economic freedom
Other factors related to government and institutional policies may also in�u-
ence the economic growth of a country. The assumption is that improvements
in institutional framework imply enhanced property rights and, consequently,
serves as an incentive for higher investment and growth (see Barro (2003)). The
analysis includes a subjective indicator (from the Heritage Foundation) as a
proxy for economic freedom which includes rule of law, government size, regu-
latory e�ciency and market openness. Rodrik (2000) concluded that healthy
institutions not only directly a�ects economics growth, but also in�uence other
major determinants of growth such as human and physical capital, investments
and technological progress.
3.6 Openness to trade
Another crucial source of growth highlighted in the literature is openness
to trade. Numerous empirical studies (Barro (2003), Gallup et al. (1998),
Ndambiri et al. (2012) have demonstrated that countries that have been con-
11
sistently open to global markets would show a faster growth than closed
economies. Openness to the global trade is likely to induce faster growth
rate because open economies are inclined to have a greater division of labor
and production processes that are more in line with their comparative advan-
tages (Gallup et al. (1998)). In accordance to our remarks on foreign direct
investment, open economies are more likely to import new technologies and
skills from the rest of the world, consequently causing advances in productivity.
Since many developing countries largely depend on their exports sector, open-
ness can be measured by the annual growth rate of exports to GDP (Dollar
and Kraay (2000).
3.7 Human capital
Human capital involves the propensity of the labor force to acquire knowl-
edge, skills and experience through education and training. Since the addition
of human capital to the neoclassical theory by Mankiw et al. (1992), numerous
studies have empirically proven the positive relationship between human cap-
ital and economic growth. The current growth literature not only focuses on
the quantity of the labor force, but also the quality. Human capital involves
the propensity of the labor force to acquire knowledge, skills and experience
through education and training. With the use of education level, fertility rate
and life expectancy as proxies for human capital (Barro (2003)) concluded
that, for a given per capita GDP, high initial human capital will lead to a
higher economic growth. Another comparative analysis of economic perfor-
mances across countries (Barro (1991)) found that the divergence in economic
growth and across countries can be attributed to the variation in human capi-
tal formation. Countries with higher human capital formation also have lower
fertility rates and higher ratios of physical investment to GDP. Such a gap
explains variations not only in economic growth, income and development but
also in productive capacities, structural economic transformation, technologi-
cal leapfrogging and advances in innovation.
12
The body of knowledge reviewed in this section provided substantial basis
to the current paper which also takes into account a set of additional control
variables as important determinants of economic growth in Sub-Saharan coun-
tries. These variables include the o�cial development aid received by each
country and an index re�ecting the growth rates of a basket of commodity
prices developed by UNCTAD.
13
4 Determinants of Economic Growth: Model Spec-
i�cation
The central hypothesis that we are trying to verify is the following: Which
of the potential determinants of economic growth have a signi�cant
impact on growth trajectories in Sub-Saharan countries? We will
consider an augmented growth model by Solow (1956) as adopted by Barro
(2003) to better understand the growth process in the region.
More speci�cally, we apply the conventional economic growth model and
use other determinants that applies to Sub-Saharan African economies. Our
model takes the following reduced form:
GDPG = f(GDPt−1, CF,GE,EXPG,ODA,FDI, FRDM,EDUC,COMM)
where GDPG is the annual growth rate of GDP per capita, CF is the
ratio of gross physical capital formation to GDP, GE is the ratio of �nal
consumption expenditure of general government to GDP, EXPG is the annual
growth rate of exports of goods and services to GDP, ODA is the net o�cial
development assistance received as a ratio to GNI, FDI is the ratio of foreign
direct investment in�ow to GDP, FRDM is the Economic Freedom index
of the country, EDUC is the mean years of schooling of the population and
COMM is an index representing the relative prices of a basket of commodities
.
The relationship between the dependent variable and the explanatory vari-
ables can be rewritten using the following econometric model speci�cation:
GDPGit = φ1GDPit−1 + φ2lCFit + φ3lGEit + φ4lEXPGit + φ5lODAit
+φ6lFDIit + φ7lFDI2it + φ8FRDMit + φ9EDUCit+ φ10COMMit + εit
where i = 1,2,...,N and t=1,2,...,T (from 2000 to 2015)
14
The subscripts i and t refer to the country and time respectively. The
variables in logarithm form are denoted with the letter l. The error term εit is
equal to αi + uit where αi is a scalar representing unobserved characteristics
of each individuals i that doesn't change with t. This scalar is country-speci�c
accounting for unobserved heterogeneity among countries and uit is a white
noise.
15
5 Data and variables
The paper uses GDP per capita growth from 2000 to 2015 as a proxy for eco-
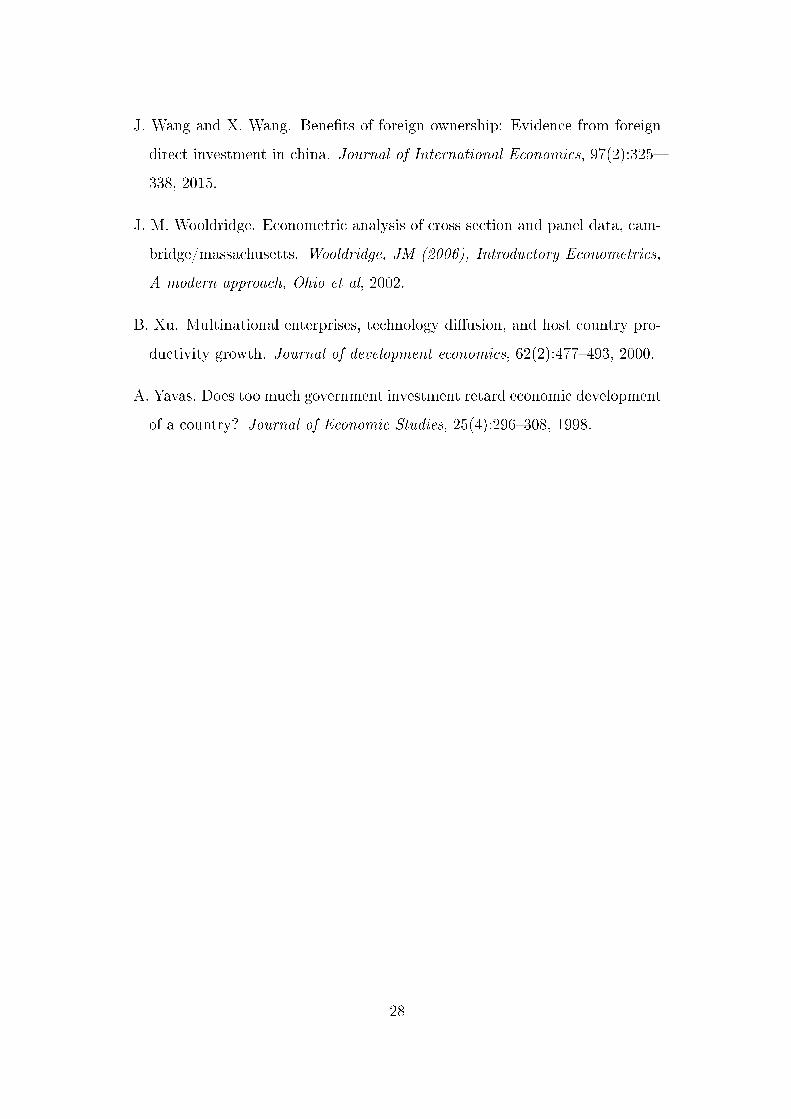
nomic growth and as the main dependent variable in the analysis. Annual data
for GDP per capita growth was obtained from the World Bank's Development
Indicators database (2017). Table 1 shows the de�nition and data sources of
the dependent and independent variables used in our model. Since data was
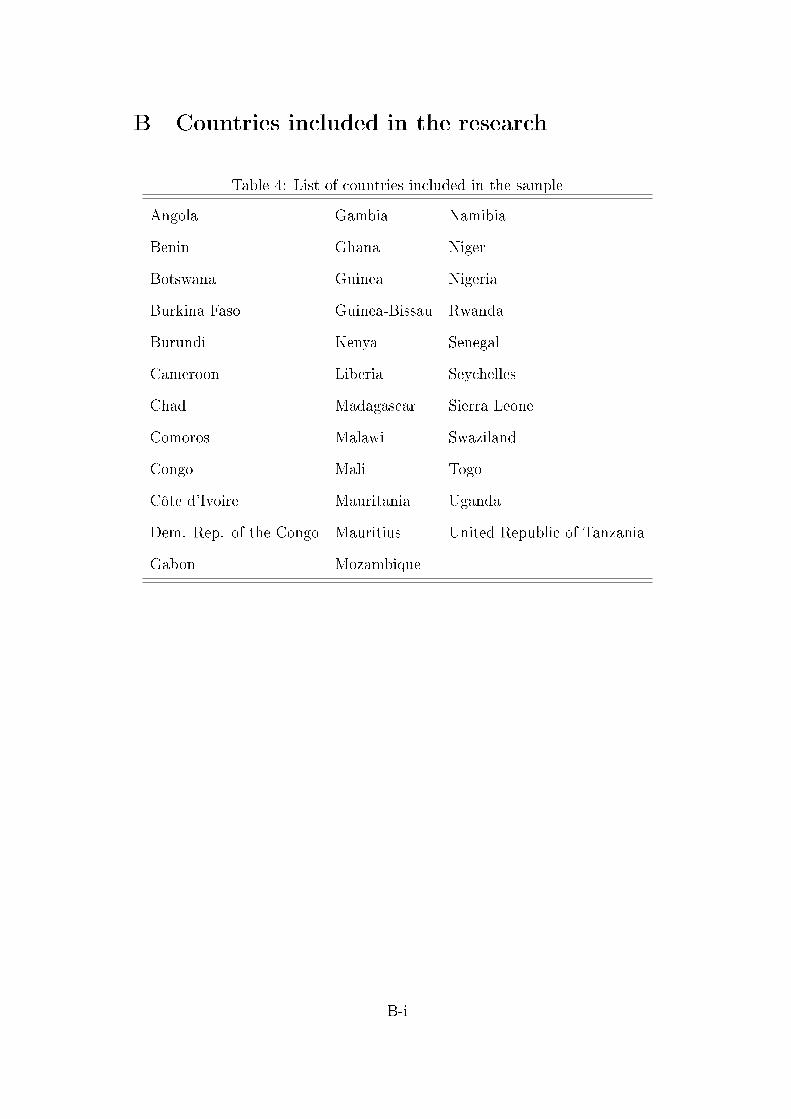
in some cases sporadic, the panel was compiled on 35 Sub-Saharan countries
(the list of countries included in the sample is included in appendix). On
the �rst round of selection, 9 Sub-Saharan countries were excluded from the
model due to lack of data availability. Then, on the second round of selection
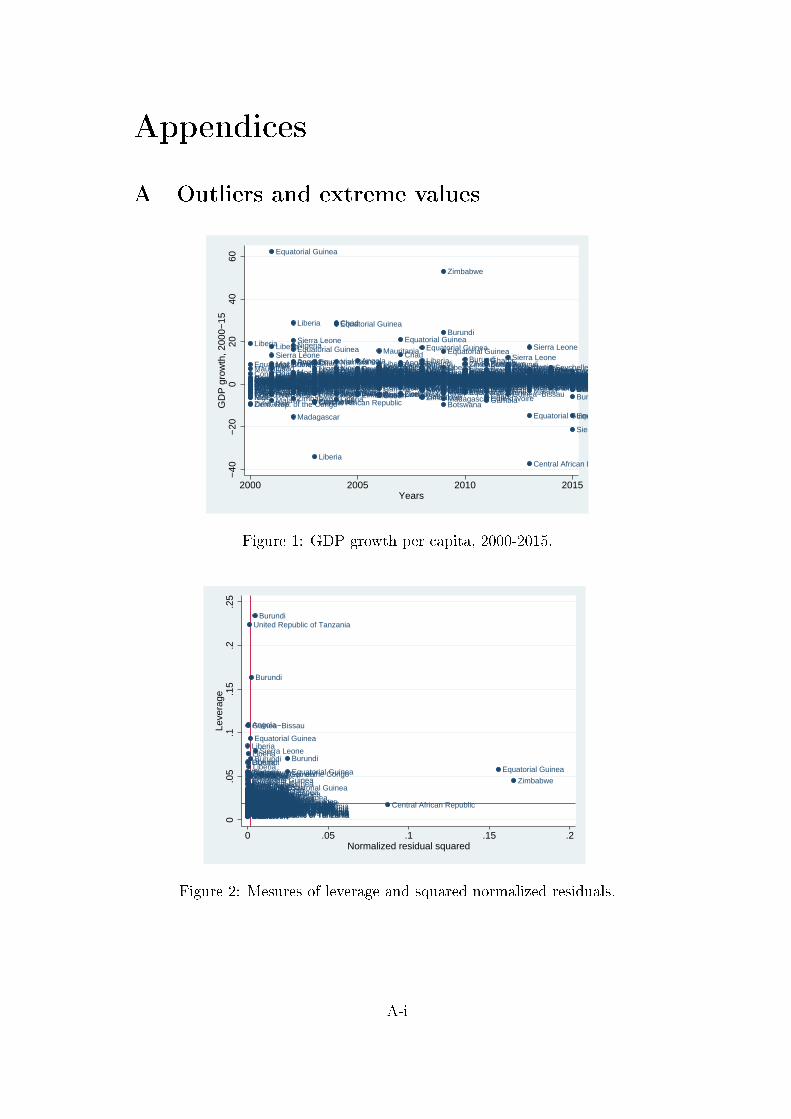
of countries, Equatorial Guinea, Central Africa and Zimbabwe were identi�ed
as outliers and therefore removed from the model due to extreme values (see
Appendix A).
6 Estimation Methodology
To estimate the coe�cients of the regression, we will use balanced panel data
from 2000 to 2015. Studying a relatively short time period, using time series
estimators would not be appropriate. The use of panel data gives us several
advantages, including the use of three estimation methods: OLS, �xed e�ects
and random e�ects. Each country studied has speci�c unobserved character-
istics that contributed to their economic growth. If these characteristics are
correlated to one of the explanatory variables of the model, then the esti-
mates with the OLS method will likely be biased (Wooldridge (2002)). This
unobserved heterogeneity can bias the results if it is linked to the explana-
tory variables of the model and not taken into account. Hence, these �xed
e�ects are systematically found in the error term so that the hypothesis of
orthogonality of the explanatory variables is violated. This problem can be
addressed by introducing the �xed and random e�ects estimators that allow
16
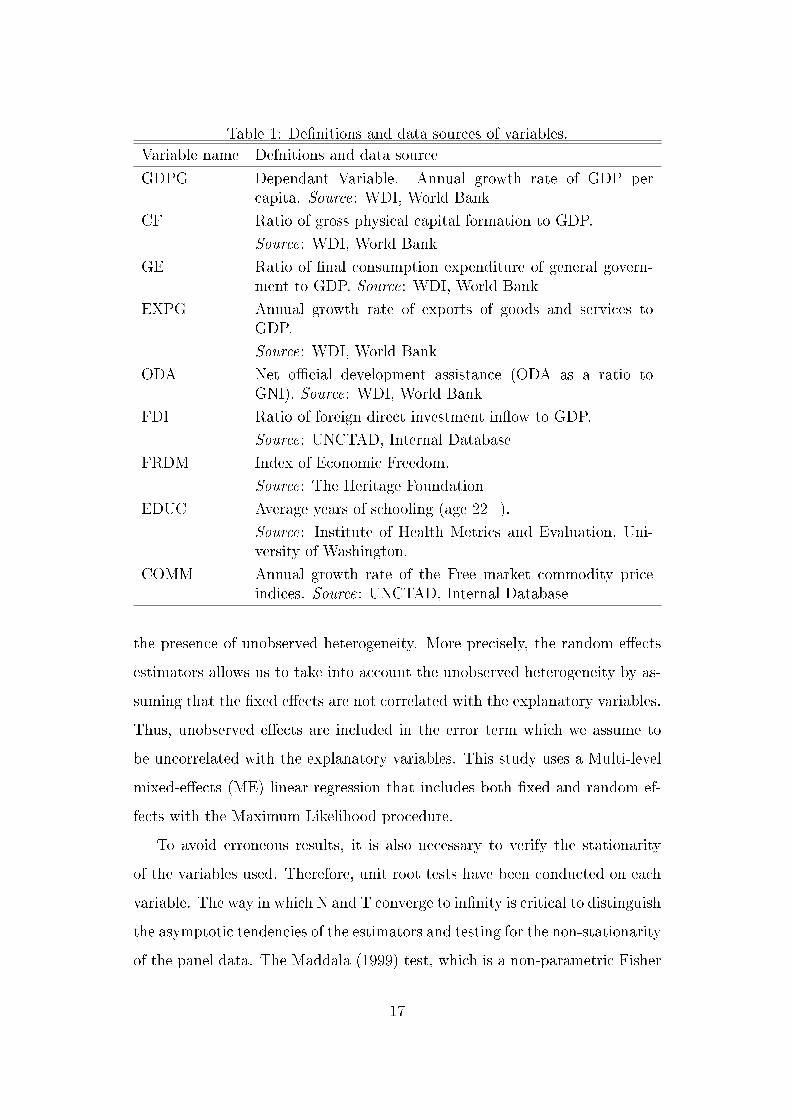
Table 1: De�nitions and data sources of variables.Variable name Defnitions and data source
GDPG Dependant Variable. Annual growth rate of GDP percapita. Source: WDI, World Bank
CF Ratio of gross physical capital formation to GDP.
Source: WDI, World Bank
GE Ratio of �nal consumption expenditure of general govern-ment to GDP. Source: WDI, World Bank
EXPG Annual growth rate of exports of goods and services toGDP.
Source: WDI, World Bank
ODA Net o�cial development assistance (ODA as a ratio toGNI). Source: WDI, World Bank
FDI Ratio of foreign direct investment in�ow to GDP.
Source: UNCTAD, Internal Database
FRDM Index of Economic Freedom.
Source: The Heritage Foundation
EDUC Average years of schooling (age 22+).
Source: Institute of Health Metrics and Evaluation, Uni-versity of Washington.
COMM Annual growth rate of the Free market commodity priceindices. Source: UNCTAD, Internal Database
the presence of unobserved heterogeneity. More precisely, the random e�ects
estimators allows us to take into account the unobserved heterogeneity by as-
suming that the �xed e�ects are not correlated with the explanatory variables.
Thus, unobserved e�ects are included in the error term which we assume to
be uncorrelated with the explanatory variables. This study uses a Multi-level
mixed-e�ects (ME) linear regression that includes both �xed and random ef-
fects with the Maximum Likelihood procedure.
To avoid erroneous results, it is also necessary to verify the stationarity
of the variables used. Therefore, unit root tests have been conducted on each
variable. The way in which N and T converge to in�nity is critical to distinguish
the asymptotic tendencies of the estimators and testing for the non-stationarity
of the panel data. The Maddala (1999) test, which is a non-parametric Fisher
17
test, is less restrictive than the Levin-Lin-Chu (LLC) test and has been used in
the analysis. The later retains the restrictive alternative hypothesis stipulating
that the autoregressive coe�cient pi is the same for all individuals.
The null hypothesis indicates that all variables follow a stationary process
and the alternative hypothesis indicates that at least one variable has a unit
root. In addition, we have also performed the Wald test to verify the pres-
ence of heteroscedasticity and the variance in�ation factor (VIF) test to test
multicollinearity (see Wooldridge (2002)).
18
7 Estimation results
Table 3 shows basic descriptive statistics for each variable. On average, the
GDP in Sub-Saharan countries grew at a rate of 2.22% cent from 2000 to 2015.
Similar interpretation can be given for capital formation, exports of goods and
services and other explanatory variables. The last column of Table 2 shows
the unit root test results (ADF Z statistic) and it can be seen that the inverse
normal Z statistics of all coe�cients are highly statistically signi�cant at 1%
or 5%. These results show that both dependent and explanatory variables are
stationary. On the basis of multicollinearity, we used the variance in�ation
factor. To take into account the presence of heteroskedasticity, we used the
observed information matrix (OIM) to estimate the variance-covariance ma-
trix. Overall, the empirical results indicate that physical capital formation, a
dynamic export sector, foreign aid, government expenditure and human cap-
ital (education) -are all positively correlated with GDP growth with di�erent
degrees of in�uence on the economy. Our results also con�rms the conditional
convergence hypothesis with a statistically signi�cant inverse relationship be-
tween initial level of GDP and GDP per capita growth of the following period.
However, the strongest variables that determine economic growth in the re-
gion are found to be physical capital formation, dynamic export sector and
ODA, which are strongly and positively correlated with GDP growth. The
results show that the role of foreign direct investment (FDI) in driving eco-
nomic growth in the region may be limited, questioning the policies in place
and suggesting a reorientation of FDI �ows (see details on this in the following
section).
19
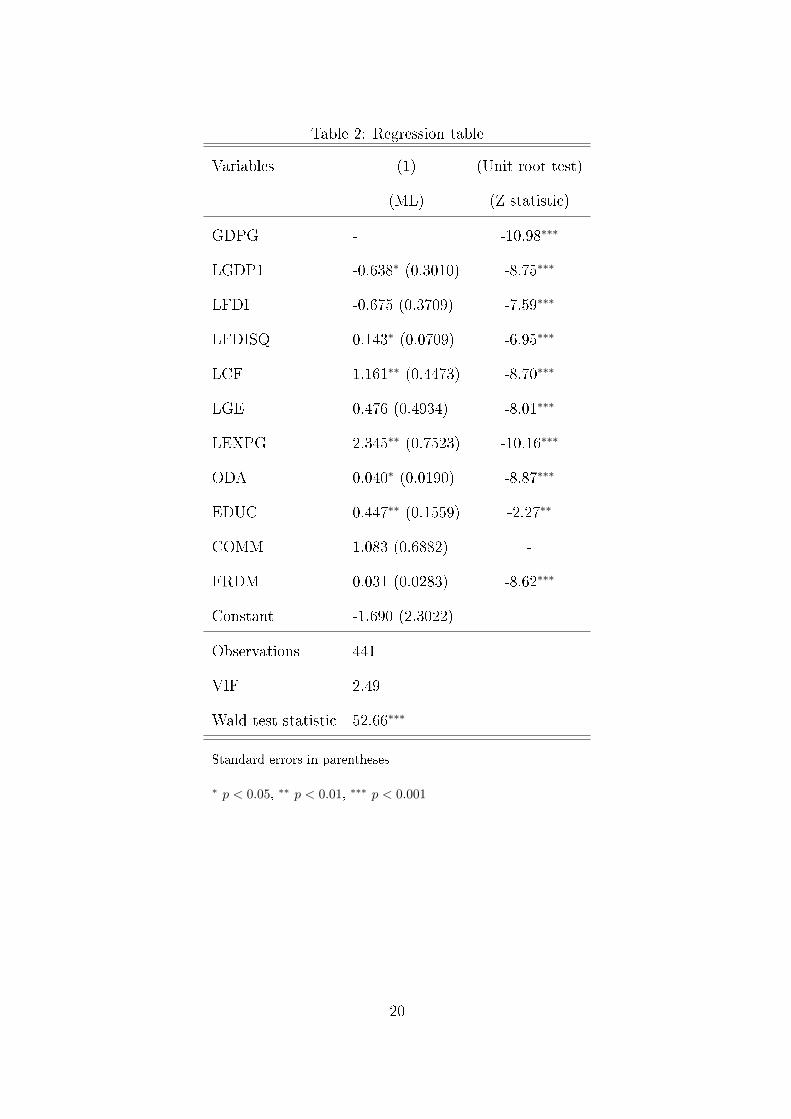
Table 2: Regression table
Variables (1) (Unit root test)
(ML) (Z statistic)
GDPG - -10.98∗∗∗
LGDP1 -0.638∗ (0.3010) -8.75∗∗∗
LFDI -0.675 (0.3709) -7.59∗∗∗
LFDISQ 0.143∗ (0.0709) -6.95∗∗∗
LCF 1.161∗∗ (0.4473) -8.70∗∗∗
LGE 0.476 (0.4934) -8.01∗∗∗
LEXPG 2.345∗∗ (0.7523) -10.16∗∗∗
ODA 0.040∗ (0.0190) -8.87∗∗∗
EDUC 0.447∗∗ (0.1559) -2.27∗∗
COMM 1.083 (0.6882) -
FRDM 0.031 (0.0283) -8.62∗∗∗
Constant -1.690 (2.3022)
Observations 441
VIF 2.49
Wald test statistic 52.66∗∗∗
Standard errors in parentheses
∗ p < 0.05, ∗∗ p < 0.01, ∗∗∗ p < 0.001
20
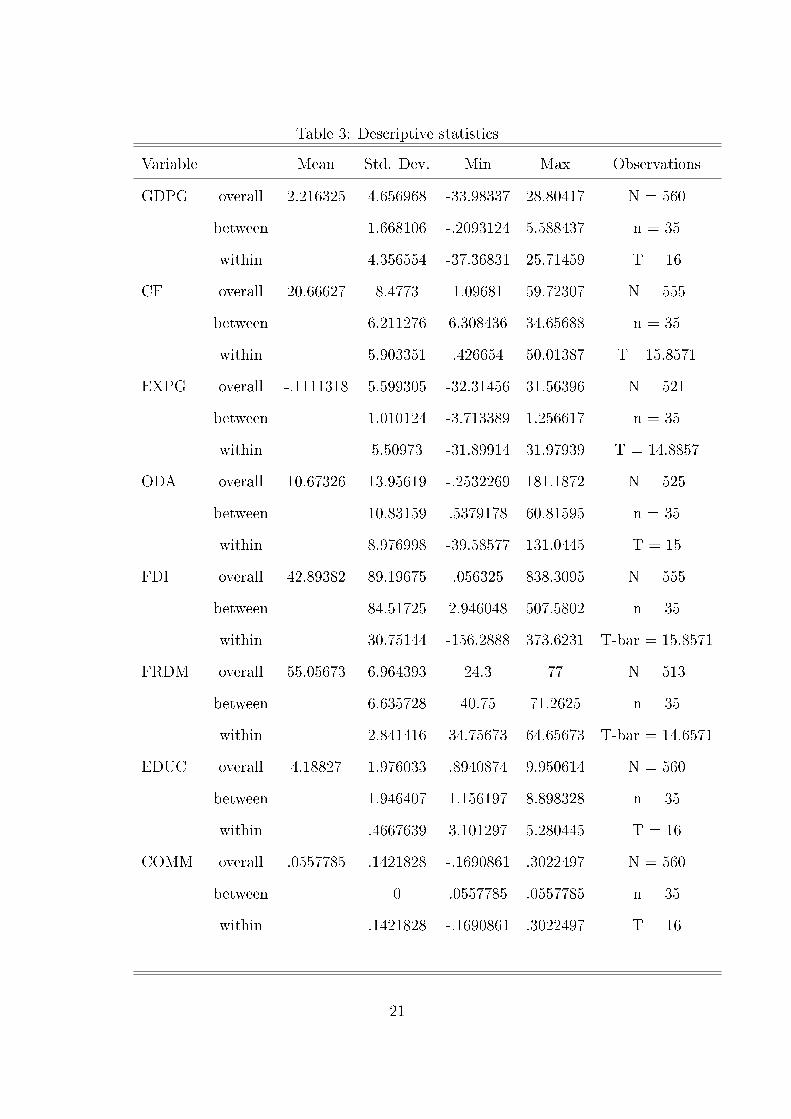
Table 3: Descriptive statistics
Variable Mean Std. Dev. Min Max Observations
GDPG overall 2.216325 4.656968 -33.98337 28.80417 N = 560
between 1.668106 -.2093124 5.588437 n = 35
within 4.356554 -37.36831 25.71459 T = 16
CF overall 20.66627 8.4773 1.09681 59.72307 N = 555
between 6.211276 6.308436 34.65688 n = 35
within 5.903351 .426654 50.01387 T= 15.8571
EXPG overall -.1111318 5.599305 -32.31456 31.56396 N = 521
between 1.010124 -3.713389 1.256617 n = 35
within 5.50973 -31.89914 31.97939 T = 14.8857
ODA overall 10.67326 13.95619 -.2532269 181.1872 N = 525
between 10.83159 .5379178 60.81595 n = 35
within 8.976998 -39.58577 131.0445 T = 15
FDI overall 42.89382 89.19675 .056325 838.3095 N = 555
between 84.51725 2.946048 507.5802 n = 35
within 30.75144 -156.2888 373.6231 T-bar = 15.8571
FRDM overall 55.05673 6.964393 24.3 77 N = 513
between 6.635728 40.75 71.2625 n = 35
within 2.841416 34.75673 64.65673 T-bar = 14.6571
EDUC overall 4.18827 1.976033 .8940874 9.950614 N = 560
between 1.946407 1.156197 8.898328 n = 35
within .4667639 3.101297 5.280445 T = 16
COMM overall .0557785 .1421828 -.1690861 .3022497 N = 560
between 0 .0557785 .0557785 n = 35
within .1421828 -.1690861 .3022497 T = 16
21
8 Conclusion and Policy Recommendations
For several years, the lack of persistent of economic growth in Sub-Saharan
Africa even during commodities boom has remained a primary preoccupation
for development experts and policy makers. High economic growth, although a
necessary condition, is not a su�cient condition in itself to ensure income con-
vergence between Sub-Saharan African countries and the rest of the developing
economies. Consequently, socio-economic vulnerabilities in SSA continued un-
abated and long term sustainability of economic growth remains a daunting
challenge. Generally, economic growth of the region remains fragile, not inclu-
sive and sporadic or enclave- based with little or no impact on jobs creation or
reducing the number of people in extreme poverty. Such a bleak economic per-
formance of SSA overshadowed the recently emerging "Rising Africa" stories.
If left to continue, it may bring back the long-standing view of "Africa Lag-
ging" or "Africa Diverging" stories to the fore of public and policy discourse
on the continent.
Generally speaking, formulating and implementing the right policies and
strategies that address the root-causes of underdevelopment in Sub-Saharan
African countries and divergence from other developing regions requires care-
ful analysis and understanding of key determinants of growth and their degree
of in�uence. This will in turn help identifying sectors with comparative ad-
vantages with an understanding of binding constraints. Understanding key
sectors of growth potential and binding constraints can greatly assist policy
makers in the design, rationalization and realignment of appropriate and tar-
geted incentives aimed at exploiting existing comparative advantages. Inter-
estingly, understanding the nature and behaviour of determinants of economic
growth in SSA can provide empirical evidence on the sources or consequences
of fragility and vulnerability of economic growth. It can also assist countries
in their e�orts to squarely deal with those variables that made growth vul-
nerable to exogenous shocks. For instance, the strong in�uence of O�cial
22
Development Assistance (ODA) and the export sector may be responsible for
the inherent vulnerabilities of growth performance to external shocks of coun-
tries in SSA. This is because ODA is strongly dependent on the political will
and strategic interest of donor countries than economic viability or necessity of
such resources to recipient countries. Using panel data covering twenty-three
years (1987-2009) and 154 recipient countries, Kim and Oh (2012) examined
whether South Korea's ODA re�ects recipient nation's needs more than the
donor's interest. They found that South Korea provides more aid to higher
income developing countries with higher growth rates, which shows the ten-
dency to serve the donor's economic interests. This shows the volatility and
vulnerability as well as e�ectiveness of development aid in supporting poorer
nations such as those in Sub-Saharan Africa.
Any interruption in the �ow of ODA may cause havoc on economic perfor-
mances of recipient countries. Moreover, dependence on ODA for development
�nancing can reduce policy space in recipient countries as donors tend to in�u-
ence or dictate domestic development polices and strategies. In this regard, the
primary focus of trade and development policies of African countries should
be to reduce their dependence on external sources of public �nance. They
should put more emphasis on generating domestic resources for �nancing their
development. From the empirical results, dynamic and vibrant export sector
(not trade as a whole) is also one of the strongest determinants of economic
growth in countries of SSA. However, these countries are known for their heavy
dependence on exports of a limited set of primary commodities, with little or
no value addition (diversi�cation or transformation). The trend in interna-
tional primary commodity prices determines or dictates export earnings of
the countries concerned. Export instabilities and volatilities in international
commodity prices greatly a�ect the resilience of the economies of SSA to exter-
nal shocks. Building economic resilience to shocks including through exports
diversi�cation- principally via manufacturing (value addition) should be the
avenue for inclusive and sustainable economic growth in the countries.
23
Further interesting �nding of the paper is that the role of foreign direct
investment in driving economic growth in the SSA was found to be minimal,
especially in the short run. There are several underlying reasons or factors
that made FDI statistically the least desirable for job creation and poverty
reduction in SSA: quality and quantity of FDI �ows to the region; FDI gov-
ernance (perceived risk, balance between out�ows and in�ows); concentration
of FDI in extractive sectors and weakness in sectoral distribution; and high
capital intensity or low labour- intensity of such �ows to Sub-Saharan African
region. This suggests modi�cations in polices and strategies towards foreign di-
rect investment including better investment targeting and carefully balancing
of its distribution across economic sectors outside of the extractive industry;
maximizing the employment intensity of FDI and realigning the �ows with
the overall development objectives of the countries as well as rede�ning the
incentives provided to foreign investors.
24
References
D. Acemoglu, S. Johnson, and J. A. Robinson. Institutions as a fundamental
cause of long-run growth. Handbook of economic growth, 1:385�472, 2005.
P. Aghion, P. Howitt, M. Brant-Collett, and C. García-Peñalosa. Endogenous
growth theory. MIT press, 1998.
B. J. Aitken and A. E. Harrison. Do domestic �rms bene�t from direct foreign
investment? evidence from venezuela. American economic review, pages
605�618, 1999.
L. Alfaro, A. Chanda, S. Kalemli-Ozcan, and S. Sayek. Fdi and economic
growth: the role of local �nancial markets. Journal of international eco-
nomics, 64(1):89�112, 2004.
P. Artelaris, P. Arvanitidis, and G. Petrakos. Theoretical and methodolog-
ical study on dynamic growth regions and factors explaining their growth
performance. Technical report, DYNERG, 2007.
S. Arvanitis and E. N. Loukis. Information and communication technologies,
human capital, workplace organization and labour productivity: A compar-
ative study based on �rm-level data for greece and switzerland. Information
Economics and Policy, 21(1):43�61, 2009.
R. J. Barro. Economic growth in a cross section of countries. The quarterly
journal of economics, 106(2):407�443, 1991.
R. J. Barro. In�ation and economic growth. Technical report, National bureau
of economic research, 1995.
R. J. Barro. Determinants of economic growth in a panel of countries. Annals
of economics and �nance, 4:231�274, 2003.
25
D. Biehl et al. Wagner' s law: an introduction to and a translation of the last
version of adolph wagner's text of 1911. Public Finance= Finances publiques,
53(1):102�11, 1998.
P. Collier, M. Fafchamps, F. Teal, S. Dercon, et al. Contract �exibility and
con�ict resolution: evidence from african manufacturing. Technical report,
Working Paper, 1998.
D. Dollar and A. Kraay. Property rights, political rights, and the development
of poor countries in the post-colonial period. World Bank Working Papers,
2000.
D. Dutta and I. Magableh. A socio-economic study of the borrowing process:
the case of microentrepreneurs in jordan. Applied Economics, 38(14):1627�
1640, 2006.
T. Egbetunde and I. O Fasanya. Public expenditure and economic growth in
nigeria: Evidence from auto-regressive distributed lag speci� cation. Zagreb
International Review of Economics and Business, 16(1):79�92, 2013.
J. L. Gallup, S. Radelet, and A. Warner. Economic growth and the income
of the poor. Manuscript, Harvard Institute for International Development,
1998.
M. Hutter. Early contributions to law and economics: Adolph wagner's
grundlegung. Journal of Economic Issues, 16(1):131�147, 1982.
E. M. Kim and J. Oh. Determinants of foreign aid: The case of south korea.
Journal of East Asian Studies, 12(2):251�274, 2012.
S. Maddala, Gangadharrao S et Wu. A comparative study of unit root tests
with panel data and a new simple test. Oxford Bulletin of Economics and
statistics, 61(S1):631�652, 1999.
26
N. G. Mankiw, D. Romer, and D. N. Weil. A contribution to the empirics of
economic growth. The quarterly journal of economics, 107(2):407�437, 1992.
H. Ndambiri, C. Ritho, S. Nganga, P. Kubowon, F. Mairura, P. Nyangweso,
E. Muiruri, and F. Cherotwo. Determinants of economic growth in sub-
saharan africa: A panel data approach. International Journal of Economics
and Management sciences, 2:18�24, 2012.
B. J. Ndulu. The political economy of economic growth in Africa, 1960-2000,
volume 2. Cambridge University Press, 2008.
W. Rathenau. In days to come. AA Knopf, 1921.
D. Rodrik. Institutions for high-quality growth: what they are and how to
acquire them. Technical report, National bureau of economic research, 2000.
P. M. Romer. Increasing returns and long-run growth. Journal of political
economy, 94(5):1002�1037, 1986.
P. M. Romer. Endogenous technological change. Journal of political Economy,
98(5, Part 2):S71�S102, 1990.
R. M. Solow. A contribution to the theory of economic growth. The quarterly
journal of economics, 70(1):65�94, 1956.
R. M. Solow. Technical progress, capital formation, and economic growth. The
American Economic Review, 52(2):76�86, 1962.
T. W. Swan. Economic growth and capital accumulation. Economic record,
32(2):334�361, 1956.
G. UNCTAD. World investment report, 2006.
G. UNCTAD. World investment report, 2008.
G. UNCTAD. World investment report, 2012.
27
J. Wang and X. Wang. Bene�ts of foreign ownership: Evidence from foreign
direct investment in china. Journal of International Economics, 97(2):325�
338, 2015.
J. M. Wooldridge. Econometric analysis of cross section and panel data, cam-
bridge/massachusetts. Wooldridge, JM (2006), Introductory Econometrics,
A modern approach, Ohio et al, 2002.
B. Xu. Multinational enterprises, technology di�usion, and host country pro-
ductivity growth. Journal of development economics, 62(2):477�493, 2000.
A. Yavas. Does too much government investment retard economic development
of a country? Journal of Economic Studies, 25(4):296�308, 1998.
28
Appendices
A Outliers and extreme values
Central African Republic
Equatorial GuineaMadagascar
Dem. Rep. of the Congo Botswana
Equatorial GuineaGambiaChadMadagascarZimbabwe
Chad Gabon
Burundi
CongoZimbabwe
GabonGambiaMalawi
NigerMaliNigerMauritaniaChad
Zimbabwe Côte d’IvoireSeychellesGambia MauritaniaChad
BurundiNiger
Central African RepublicNigerTogo
Congo GabonTogoTogoZimbabwe
CongoSenegalMauritania
Congo
Côte d’IvoireEquatorial GuineaGabon Madagascar
ZimbabweGabon
CongoSenegal GambiaSenegalKenyaNigerTogo
MauritaniaBenin
Congo MauritaniaBurkina Faso
Côte d’Ivoire MaliMauritania Burundi
Mauritania MalawiCongo Uganda
Equatorial GuineaGuinea Benin
GuineaGambia Namibia MadagascarSouth AfricaNiger
Liberia
Malawi
Mauritania MauritaniaMauritania
Equatorial GuineaCongo
MaliMozambique GuineaKenya
Swaziland TogoKenya GuineaTogo AngolaBeninSwazilandZimbabwe
Dem. Rep. of the CongoAngolaGuinea−Bissau
Guinea SenegalBotswana GuineaSenegalMali
ChadBeninSwaziland Benin Togo SenegalSenegalAngola GuineaGuinea−Bissau
Côte d’IvoireCameroon UgandaCongo
MadagascarGuineaZimbabweMadagascar Sierra LeoneEquatorial Guinea
ComorosGhana
Niger MaliNamibiaCongoGuineaCongo
GambiaMadagascar
Gambia CameroonMadagascarMauritania
CameroonGhana Togo
Equatorial Guinea
Malawi Côte d’IvoireSwaziland
Zimbabwe
CameroonBenin TogoNiger
Côte d’IvoireMauritania
Guinea−BissauAngolaMali UgandaSeychelles
Namibia MadagascarGambiaSenegalGabonTogoBenin Cameroon BurundiBurkina FasoBenin Central African RepublicUnited Republic of TanzaniaSierra LeoneSenegalGuineaMaliNiger
Central African RepublicGuineaSenegal United Republic of TanzaniaSwazilandBurkina Faso SenegalGhana Cameroon
Côte d’IvoireUnited Republic of Tanzania
Equatorial Guinea
GuineaCentral African RepublicCameroon TogoBotswana Mauritius ComorosMadagascar Mali Gambia
SwazilandSenegalCôte d’Ivoire
ChadGhanaBurkina FasoMadagascar
CameroonDem. Rep. of the Congo GhanaMauritius Madagascar
GuineaMalawiMozambique
Benin TogoTogoNiger GambiaCameroonBenin MadagascarSierra LeoneNamibia Swaziland
Burkina FasoCameroonEquatorial GuineaGabon
Rwanda Swaziland Central African RepublicGuinea−BissauMaliMadagascarCameroon GhanaBotswana
MozambiqueComoros
SenegalNamibia
GabonComorosDem. Rep. of the CongoCameroon KenyaGhana
CongoComorosZimbabweKenya NamibiaNiger Central African Republic
ChadGhana
Zimbabwe
GambiaUnited Republic of TanzaniaGuinea−Bissau
Ghana Dem. Rep. of the CongoMalawi Guinea−Bissau Central African RepublicBurkina Faso
Guinea−Bissau Côte d’IvoireGabonUnited Republic of TanzaniaKenyaSwazilandSierra Leone
TogoMali SenegalSeychelles
South AfricaCongo
GuineaBeninLiberiaBeninMozambique
South AfricaCongo
BeninMauritania
Central African RepublicMauritius ComorosLiberia
ZimbabweSwaziland BotswanaCameroonMali Burkina FasoCongoBotswana
Guinea−BissauCôte d’IvoireGhanaSwaziland GabonCôte d’IvoireUganda RwandaNiger Nigeria
LiberiaUgandaNigeriaSouth AfricaGambiaMalawi
LiberiaBeninSwazilandGuinea−BissauKenya
GabonMali Mauritius Burkina FasoSeychelles
Burkina Faso KenyaChad United Republic of Tanzania
Sierra Leone South AfricaDem. Rep. of the Congo
Burkina Faso NamibiaSenegalSeychellesChad
SwazilandCameroonKenyaSouth Africa KenyaUnited Republic of TanzaniaNamibia
Swaziland Mauritius CameroonUgandaKenyaGambia
Central African Republic
ChadBeninNamibiaNamibiaBurkina FasoMauritania UgandaUnited Republic of Tanzania MauritiusSouth AfricaRwanda Mauritius Mauritius
Sierra LeoneBotswana MozambiqueKenya Rwanda Botswana
Guinea−BissauBotswanaKenyaBurkina FasoUgandaSouth AfricaGuinea MauritiusBotswana Malawi MozambiqueMalawiCentral African Republic
NigerUnited Republic of TanzaniaUgandaMauritiusSouth Africa
Dem. Rep. of the CongoUnited Republic of TanzaniaNamibiaUnited Republic of TanzaniaNamibia NigeriaNigeria Nigeria GhanaMalawiChad
MozambiqueUnited Republic of TanzaniaKenyaGuinea−Bissau
UgandaMozambiqueSouth AfricaNiger AngolaGambiaBurkina Faso
SwazilandGhana
Liberia
Burundi
Mali Rwanda NigeriaMauritiusUgandaCentral African RepublicSeychelles
RwandaGuinea−Bissau
Guinea−BissauUnited Republic of TanzaniaMalawi Guinea−Bissau
Botswana Mozambique MauritiusBurkina Faso Sierra LeoneMauritiusMalawiSouth AfricaUganda Rwanda
Central African RepublicMaliMalawiSouth Africa NamibiaSierra Leone
NigerRwandaBurkina Faso
Chad
Sierra LeoneUnited Republic of TanzaniaSouth Africa NigeriaNigeria South AfricaMozambique Côte d’IvoireKenya
BurundiNamibiaRwanda NigeriaSouth Africa Nigeria
ChadBotswanaGhana GhanaBotswana
Burundi
Nigeria Côte d’IvoireMozambiqueRwandaMozambiqueBurundiZimbabwe
UgandaMadagascar BotswanaMalawiUganda Côte d’IvoireRwandaBotswanaNigeria United Republic of TanzaniaMozambiqueSierra Leone
AngolaRwandaUgandaAngola ZimbabweMalawi
Mauritius Rwanda ZimbabweMozambique
Burundi
GambiaRwandaNigeria
Equatorial Guinea
Mali Côte d’IvoireGuinea−BissauNigeriaAngola
Equatorial GuineaSierra LeoneGhanaNamibia
Sierra Leone
MozambiqueChad
Rwanda
Mauritania Equatorial GuineaEquatorial Guinea
Sierra Leone
Equatorial Guinea
Nigeria
BurundiChad
Equatorial Guinea
Zimbabwe
Sierra Leone
United Republic of Tanzania
GuineaLiberia
Angola
Dem. Rep. of the CongoDem. Rep. of the Congo
NigeriaDem. Rep. of the Congo
Seychelles
Comoros ComorosComoros Togo Angola
Seychelles
Liberia
Central African RepublicUganda
Comoros ChadMadagascarBurundi Angola ComorosSeychelles Burundi
Seychelles
Congo
Sierra Leone
Liberia
Burundi
SeychellesMauritius
GabonSeychelles Gabon
Angola
Sierra Leone
Dem. Rep. of the CongoLiberia
Burundi
Burundi
Angola
MauritiusMauritaniaComoros MaliBotswana
NamibiaComoros
Gabon
Angola
Rwanda
Gabon
SenegalGhanaComoros Malawi
Liberia
MozambiqueCameroon
Liberia
BeninKenyaCentral African RepublicSwazilandDem. Rep. of the Congo
Seychelles
SeychellesDem. Rep. of the Congo
South AfricaTogoNigerAngolaGuinea−Bissau
SeychellesGabon
Equatorial Guinea
Liberia
Dem. Rep. of the CongoCentral African Republic
Dem. Rep. of the CongoCôte d’Ivoire
ZimbabweBurundi
Liberia
Liberia
AngolaDem. Rep. of the Congo
SeychellesBurkina Faso
Liberia
Comoros GambiaComoros
−40
−20
020
4060
GD
P g
row
th, 2
000−
15
2000 2005 2010 2015Years
Figure 1: GDP growth per capita, 2000-2015.
Central African Republic
Equatorial Guinea
Madagascar
Dem. Rep. of the Congo
BotswanaEquatorial GuineaGambiaChadMadagascarZimbabweChadGabon
Burundi
CongoZimbabweGabonGambiaMalawiNigerMaliNigerMauritaniaChadZimbabweCôte d’Ivoire
SeychellesGambiaMauritaniaChad
Burundi
NigerCentral African RepublicNigerTogoCongoGabonTogoTogo
Zimbabwe
CongoSenegalMauritaniaCongoCôte d’Ivoire
Equatorial Guinea
GabonMadagascar
Zimbabwe
GabonCongoSenegalGambiaSenegalKenyaNigerTogoMauritaniaBeninCongoMauritaniaBurkina FasoCôte d’IvoireMali
Mauritania
BurundiMauritaniaMalawiCongoUgandaEquatorial Guinea
GuineaBeninGuineaGambiaNamibiaMadagascar
South Africa
Niger
Liberia
MalawiMauritaniaMauritaniaMauritania
Equatorial Guinea
Congo
MaliMozambiqueGuineaKenyaSwazilandTogoKenyaGuineaTogo
Angola
BeninSwaziland
Zimbabwe
Dem. Rep. of the CongoAngolaGuinea−BissauGuineaSenegalBotswanaGuineaSenegalMali
Chad
BeninSwazilandBeninTogoSenegalSenegal
Angola
Guinea
Guinea−Bissau
Côte d’IvoireCameroonUgandaCongoMadagascarGuinea
ZimbabweMadagascarSierra LeoneEquatorial GuineaComorosGhanaNigerMaliNamibiaCongoGuineaCongoGambiaMadagascarGambiaCameroonMadagascarMauritaniaCameroonGhanaTogo
Equatorial Guinea
MalawiCôte d’IvoireSwaziland
Zimbabwe
CameroonBeninTogoNigerCôte d’Ivoire
Mauritania
Guinea−BissauAngola
MaliUganda
Seychelles
NamibiaMadagascarGambiaSenegalGabonTogoBeninCameroon
BurundiBurkina FasoBeninCentral African RepublicUnited Republic of TanzaniaSierra LeoneSenegalGuineaMaliNigerCentral African RepublicGuineaSenegalUnited Republic of TanzaniaSwazilandBurkina FasoSenegal
GhanaCameroonCôte d’IvoireUnited Republic of Tanzania
Equatorial Guinea
GuineaCentral African RepublicCameroonTogoBotswanaMauritius
ComorosMadagascarMaliGambiaSwazilandSenegalCôte d’IvoireChadGhana
Burkina Faso
MadagascarCameroonDem. Rep. of the CongoGhanaMauritiusMadagascarGuineaMalawi
Mozambique
BeninTogoTogoNigerGambiaCameroonBeninMadagascarSierra LeoneNamibiaSwaziland
Burkina FasoCameroon
Equatorial Guinea
GabonRwandaSwazilandCentral African RepublicGuinea−BissauMaliMadagascarCameroonGhanaBotswanaMozambiqueComorosSenegalNamibiaGabonComorosDem. Rep. of the CongoCameroonKenyaGhana
CongoComoros
Zimbabwe
KenyaNamibiaNigerCentral African RepublicChadGhana
Zimbabwe
GambiaUnited Republic of TanzaniaGuinea−BissauGhanaDem. Rep. of the CongoMalawi
Guinea−BissauCentral African RepublicBurkina FasoGuinea−Bissau
Côte d’IvoireGabonUnited Republic of TanzaniaKenyaSwazilandSierra LeoneTogoMaliSenegal
SeychellesSouth AfricaCongo
GuineaBenin
Liberia
BeninMozambiqueSouth AfricaCongo
Benin
MauritaniaCentral African RepublicMauritiusComoros
Liberia
Zimbabwe
Swaziland
Botswana
CameroonMaliBurkina FasoCongoBotswana
Guinea−BissauCôte d’IvoireGhanaSwazilandGabonCôte d’IvoireUgandaRwandaNigerNigeria
Liberia
UgandaNigeriaSouth Africa
GambiaMalawi
Liberia
Benin
SwazilandGuinea−Bissau
KenyaGabonMali
MauritiusBurkina Faso
Seychelles
Burkina FasoKenyaChadUnited Republic of TanzaniaSierra LeoneSouth AfricaDem. Rep. of the CongoBurkina FasoNamibiaSenegal
Seychelles
Chad
Swaziland
CameroonKenya
South Africa
KenyaUnited Republic of TanzaniaNamibiaSwaziland
Mauritius
CameroonUgandaKenyaGambiaCentral African RepublicChadBeninNamibiaNamibiaBurkina Faso
Mauritania
UgandaUnited Republic of Tanzania
MauritiusSouth AfricaRwandaMauritius
MauritiusSierra LeoneBotswanaMozambiqueKenyaRwandaBotswanaGuinea−BissauBotswanaKenya
Burkina Faso
UgandaSouth AfricaGuinea
MauritiusBotswana
MalawiMozambiqueMalawiCentral African RepublicNigerUnited Republic of TanzaniaUgandaMauritiusSouth AfricaDem. Rep. of the CongoUnited Republic of TanzaniaNamibia
United Republic of TanzaniaNamibiaNigeriaNigeriaNigeriaGhanaMalawi
Chad
MozambiqueUnited Republic of TanzaniaKenyaGuinea−BissauUgandaMozambiqueSouth AfricaNiger
Angola
GambiaBurkina Faso
Swaziland
Ghana
Liberia
Burundi
MaliRwanda
NigeriaMauritius
UgandaCentral African Republic
Seychelles
Rwanda
Guinea−Bissau
Guinea−Bissau
United Republic of TanzaniaMalawiGuinea−BissauBotswanaMozambiqueMauritiusBurkina FasoSierra LeoneMauritiusMalawiSouth AfricaUgandaRwandaCentral African RepublicMaliMalawiSouth AfricaNamibiaSierra LeoneNigerRwandaBurkina FasoChadSierra LeoneUnited Republic of Tanzania
South AfricaNigeriaNigeriaSouth Africa
MozambiqueCôte d’IvoireKenya
Burundi
NamibiaRwandaNigeriaSouth AfricaNigeriaChadBotswanaGhanaGhanaBotswana
Burundi
Nigeria
Côte d’IvoireMozambiqueRwandaMozambique
BurundiZimbabwe
UgandaMadagascarBotswanaMalawiUgandaCôte d’IvoireRwanda
BotswanaNigeria
United Republic of Tanzania
MozambiqueSierra LeoneAngolaRwandaUganda
AngolaZimbabwe
MalawiMauritiusRwanda
Zimbabwe
Mozambique
Burundi
Gambia
RwandaNigeria
Equatorial Guinea
MaliCôte d’IvoireGuinea−BissauNigeriaAngola
Equatorial Guinea
Sierra LeoneGhanaNamibia
Sierra Leone
MozambiqueChadRwandaMauritaniaEquatorial GuineaEquatorial Guinea
Sierra Leone
Equatorial Guinea
Nigeria
Burundi
Chad
Equatorial Guinea
Zimbabwe
0.0
5.1
.15
.2.2
5Le
vera
ge
0 .05 .1 .15 .2Normalized residual squared
Figure 2: Mesures of leverage and squared normalized residuals.
A-i
B Countries included in the research
Table 4: List of countries included in the sample
Angola Gambia Namibia
Benin Ghana Niger
Botswana Guinea Nigeria
Burkina Faso Guinea-Bissau Rwanda
Burundi Kenya Senegal
Cameroon Liberia Seychelles
Chad Madagascar Sierra Leone
Comoros Malawi Swaziland
Congo Mali Togo
Côte d'Ivoire Mauritania Uganda
Dem. Rep. of the Congo Mauritius United Republic of Tanzania
Gabon Mozambique
B-i