Embed Size (px)
Citation preview
Available online at www.sciencedirect.com
(2008) 1368–1376
Clinical Biochemistry 41Diagnostic accuracy, reproducibility and robustness of fibrosis blood tests inchronic hepatitis C: A meta-analysis with individual data
Vincent Leroy a,b,*, Philippe Halfon c, Yannick Bacq d, Jérôme Boursier e,f,Marie Christine Rousselet f,g, Marc Bourlière h, Anne de Muret i, Nathalie Sturm b,j,
Gilles Hunault f,k, Guillaume Penaranda l, Marie-Claude Bréchot m, Candice Trocme n, Paul Calès e,f
a Clinique d'Hépato-gastroentérologie, pôle digestif-DUNE, CHU, Grenoble, Franceb INSERM/UJF U823, IAPC, IAB, Grenoble, France
c Laboratoire Alphabio, Marseille, Franced Service d'Hépato-gastroentérologie, Hôpital Trousseau, CHRU, Tours, France
e Service d'Hépato-gastroentérologie et laboratoire HIFIH, CH&U, Angers, Francef Laboratoire HIFIH, UPRES 3859, IFR 132, Université, Angers, France
g Département de Pathologie Cellulaire et Tissulaire et laboratoire HIFIH, CHU, Angers, Franceh Service d'Hépato-gastroentérologie, Hôpital Saint-Joseph, Marseille, France
i Service d'Anatomopathologie, Hôpital Trousseau, CHRU, Tours, Francej Service d'Anatomopathologie, CHU, Grenoble, France
k Département de Mathématiques Appliquées (Statistiques)/Informatique, UFR sciences, Université, Angers, Francel Département de Biostatistiques, CDL Pharma, Marseille, France
m Laboratoire de Biochimie, CHRU, Tours, Francen Laboratoire d'Enzymologie/DBPC, CHU, Grenoble, France
Received 16 February 2008; received in revised form 18 June 2008; accepted 19 June 2008Available online 11 July 2008
Abstract
Objectives: To evaluate the diagnostic accuracy of liver fibrosis tests and its influencing factors in a meta-analysis with individual data.Design and methods: Four independent centers provided four blood tests and Metavir staging from 825 patients with chronic hepatitis C.Results: FibroMeter AUROC (0.840) for significant fibrosis was superior to those of Fibrotest (0.803, p=0.049), APRI (0.789, p=0.001) and
Hepascore (0.781, pb0.001). The misclassification rate was lower for FibroMeter (23%) than for Fibrotest and Hepascore (both 28%, pb0.001).The variation in the diagnostic cut-offs of tests among centers, reflecting the overall reproducibility, was: FibroMeter: 4.2%, APRI: 24.0%,Fibrotest: 24.2%, Hepascore: 35.0%. Accordingly, the proportion of patients diagnosed with significant fibrosis changed: FibroMeter: 0.8%,Hepascore: 2.4% (p=0.02 vs FibroMeter), Fibrotest: 5.8% (pb10−3), APRI: 18.2% (pb10−3).
Conclusions: This study on clinical applicability shows significant differences in diagnostic accuracy, inter-center reproducibility, androbustness of biomarkers to changes in population characteristics between blood tests.© 2008 The Canadian Society of Clinical Chemists. Published by Elsevier Inc. All rights reserved.
Keywords: Diagnostic accuracy; Liver fibrosis; Blood markers; Liver biopsy; Non-invasive diagnosis; Viral hepatitis C; Metavir staging; Sensitivity; Specificity
Abbreviations: ALT, alanine aminotransferase; APRI, aspartate aminotransferase to platelet ratio index; AST, aspartate aminotransferase; AUROC, area under thereceiver operating characteristic; PACA, Provence Alpes — Côte d'Azur (administrative region).* Corresponding author. Clinique d'Hépato-gastroentérologie, pôle digestif-DUNE,CHU,Grenoble, BP217, 38043Grenoble CEDEX09, France. Fax: +33 4 76 76 51 79.E-mail addresses: [email protected] (V. Leroy), [email protected] (P. Halfon), [email protected] (Y. Bacq), [email protected]
(J. Boursier), [email protected] (M.C. Rousselet), [email protected] (M. Bourlière), [email protected] (A. de Muret),[email protected] (N. Sturm), [email protected] (G. Hunault), [email protected] (G. Penaranda), [email protected](M.-C. Bréchot), [email protected] (C. Trocme), [email protected] (P. Calès).
0009-9120/$ - see front matter © 2008 The Canadian Society of Clinical Chemists. Published by Elsevier Inc. All rights reserved.doi:10.1016/j.clinbiochem.2008.06.020
Table 1List of the 2 clinical and 10 blood variables included (x) in the blood tests; 2variables are common to 3 tests, 6 variables are common to 2 tests and 4variables are specific for one test
Variable Blood tests
FibroMeter Fibrotest Hepascore APRI
Age x x xSex x xAlpha-2-macroglobulin x x xPlatelets x xAST x xGammaglutamyl transpeptidase x xBilirubin x xHyaluronic acid x xProthrombin index xUrea xHaptoglobin xApolipoprotein A1 x
1369V. Leroy et al. / Clinical Biochemistry 41 (2008) 1368–1376
Introduction
Several blood tests have been proposed to evaluate fibrosisin liver diseases [1]. They may have strong clinical applications,such as initial staging of fibrosis, assessment of anti-fibrotictreatments, prognosis indicators and general screening [2–4].Blood tests are composed of direct [2] or indirect [3] markers offibrosis depending on their relationship with the connectivetissue. Some tests such as the aspartate aminotransferase (AST)to platelet ratio index (APRI) are simple and easily available inclinical practice [4]. Other tests are more complex and wereconstructed from multivariate regression analyses. Theyvariably include several indirect markers – Fibrotest – [5],direct markers – European liver fibrosis test – [6] or both directand indirect markers – FibroMeter, and Hepascore – [7]. Only aminority of tests including APRI, Fibrotest and more recentlyFibroMeter and Hepascore have so far been evaluated byexternal and independent analysis and they have rarely beencompared to one another [8–10]. In addition, their diagnosticperformance was evaluated using small sample sizes, straight-forward and limited statistical tools such as the area under thereceiver operating characteristic (AUROC), whereas moreaccurate and stringent indexes of performance could be usefulto precisely define their clinical application [11].
Therefore, we conducted a meta-analysis with individual dataaiming primarily at comprehensively characterizing and com-paring the diagnostic accuracy of four major blood tests offibrosis including FibroMeter, Hepascore, APRI and Fibrotest inpatients with chronic viral hepatitis C. The secondary aims wereto evaluate the factors influencing this diagnostic accuracy,especially the reproducibility (center effect) and robustness(population effect) by the means of new statistical methods.
Patients and methods
Data source
We systematically reviewed the literature from 1997 to 2007for studies comparing FibroMeter and Fibrotest in patients withchronic viral hepatitis C in the Medline data base and by handsearching. Hepascore and APRI, whose markers are included inthe two former tests, could thus be calculated. Threeindependent publications were retrieved. The first studyincluding one center, Angers, was the original publication thatdescribed the FibroMeter [7]. The second study included twoindependent centers, Provence — Côte d'Azur (PACA) andTours [9], and the third study included a fourth center, Grenoble[10]. The PACA center included 3 secondary and 2 tertiary caresettings. Thus, four centers, which were independent for studydesign, patient recruitment, blood marker analysis and liverhistological interpretation, provided individual data of theirpatients.
Patients
Criteria of inclusion and exclusion were very similar amongthe four centers. Patients with chronic viral hepatitis C were
prospectively included from 1994 to 2005 if they had anti-HCV antibodies, HCV RNA in serum, available liver biopsyand blood markers. Fasting blood samples were collectedimmediately before or within the 3 months after the liverbiopsy was performed. Patients were not included if they hadliver specimen b15 mm in the PACA center. Other criteria ofexclusion were other causes of liver disease, especially HIV orHBV co-infection, but also complicated cirrhosis, anti-fibrotictreatment in the past 6 months, and alcohol consumptionhigher than 30 g/day in the five years before inclusion.Overall, the four centers provided 1266 patients of whom 441were excluded because of missing data. Eventually, a corepopulation of 825 patients was included in the meta-analysis.The study protocol conformed to the ethical guidelines of thecurrent Declaration of Helsinki and was approved by localethic committees.
Blood measurements
Blood samples were processed independently in each centerand comprised the following variables: platelet count, urea,bilirubin, gamma-glutamyl transpeptidase, AST, alanine ami-notransferase (ALT), prothrombin index, apolipoprotein A1,haptoglobin, hyaluronic acid, and alpha-2-macroglobulin.Direct markers were measured either on fresh blood or frozensample of serum stored at V−20 -C. Indirect markers wereusually measured on fresh blood. Automats and assaytechniques were different according to the centers (details notprovided) except for apolipoprotein and alpha-2-macroglobulin(Dade Behring) and hyaluronic acid (Corgenix). The indexblood tests were calculated according to published formulas[4,7,12,13]. Their composite variables are described in Table 1.AST used in APRI was divided by a common upper limit ofnormal, as several studies performed in numerous laboratorieshave shown excellent interlaboratory reproducibility [14]. Thisstudy also showed that the reproducibility of blood testsbetween different laboratories and over a short time interval wasexcellent [14].
1370 V. Leroy et al. / Clinical Biochemistry 41 (2008) 1368–1376
Liver biopsy
Liver biopsies were performed using Menghini's techniquewith a 1.4–1.6mmdiameter needle. Biopsy specimens were fixedin a formalin–alcohol–acetic solution and embedded in paraffin;5 lm thick sections were stained with hematoxylin–eosin–saffron. Liver fibrosis was staged from F0 to F4 according to theMetavir staging system [15]. Three diagnostic targets weredefined as follows: significant fibrosis: F2+F3+F4, severefibrosis: F3+F4, and cirrhosis: F4. Fibrosis staging wasperformed in each center by independent blinded seniorpathologists specialized in hepatology. Readings were donetwice by the same pathologist inGrenoble and by two pathologistsin the Angers, Tours and PACA centers with a common finalreading in cases of disagreement. We did not perform centralizedre-examination of biopsy specimens since we have shown in aprevious study including some of the same pathologists that theinterobserver agreement between senior hepato-pathologists wasexcellent with Metavir staging system [16].
Statistical analysis
The diagnostic accuracy of each test was expressed as theoverall accuracy, i.e. true positives and negatives, and detailedindices such as likelihood ratio and diagnostic odds ratio[11,17,18]. AUROC were compared by the paired Hanley–McNeil test [19]. Forward stepwise binary logistic regressionprovided the regression score probability (from 0 to 1), whichcorresponds to the blood test value. The dependent variable wasthe diagnostic target (i.e. F2F3F4 for the primary end-point).Data were reported according to STARD statements [20]. Thus,data were analyzed on the intention to diagnose principle andthere was no exclusion due to false results of blood test. Inaddition, the following statistical characteristics were calcu-lated: test performance profile describing the misclassificationrate by fibrosis stage, fibrosis stage probability reporting the
Table 2General characteristics of patient populations
All Angers
N patients 825 300Sex (% male) 59.5 66.3Age (year) b 44.5±12.4 43.6±12.2Metavir fibrosis stage (%)F0 4.8 3.7F1 46.7 41.3F2 25.0 25.3F3 12.5 11.0F4 11.0 18.7
Significant fibrosis (%) 48.5 55.0Severe fibrosis (%) 23.5 29.7Metavir fibrosis score 1.8±1.1 2.0±1.2Liver specimen length (mm) 21±7 18±7Liver specimen length ≥ (%)15 mm 83.5 71.620 mm 55.4 42.9
a ANOVA or χ2 between centers.b Mean±SD.
fibrosis stage by blood test value, overall reproducibility testindex reflecting the diagnostic reproducibility among centers,and robustness addressing the diagnostic reproducibility in alarge independent population. These characteristics are detailedin the annex. The size of the population was that necessary todetect a significant difference for significant fibrosis betweenthe two most accurate tests according to previous studies. Withan a risk of 0.05, b risk of 0.2, significant fibrosis prevalence of0.50, AUROC correlation of 0.70 and bilateral testing, therequired sample size was 910 patients for the followingAUROC values: FibroMeter: 0.84, Fibrotest: 0.81.
Results
Characteristics of patients
The main characteristics of the 825 patients are presented inTable 2. Some significant differences were observed betweencenters. The most important one concerned the prevalence ofhistological fibrosis stages. The prevalence of severe fibrosisranged from 9% to 30%, and the prevalence of cirrhosis rangedfrom 1% to 19%. Biopsy length also was significantly differentamong centers. Therefore, comparisons between centers wereadjusted on these variables.
Overall performance of blood tests
The main indices of diagnostic accuracy of tests for thediagnosis of significant fibrosis (F2F3F4) are presented inTable 3. Comparison of AUROCs is presented in Table 4 for thethree diagnostic targets, i.e. significant fibrosis, severe fibrosisand cirrhosis. AUROCs from FibroMeter were significantlygreater than those of the other three tests for the diagnosis ofsignificant and severe fibrosis. For the diagnosis of cirrhosis,FibroMeter was not superior to Fibrotest (p=0.18). FibrotestAUROC was significantly greater than that of Hepascore for
PACA Tours Grenoble P a
217 159 149 –50.7 56.6 61.7 .00347.9±13.3 40.9±10.5 44.9±12.3 b .001
b .0014.6 3.8 8.7 –45.6 65.4 38.9 –29.0 21.4 22.1 –15.7 8.2 15.4 –5.1 1.3 14.8 b .00149.8 30.8 52.3 b .00120.7 9.4 30.2 b .0011.7±0.9 1.4±0.7 1.9±1.2 b .00123±7 20±7 22±8 b .001
100 80.5 85.9 b .00170.5 54.7 58.4 b .001
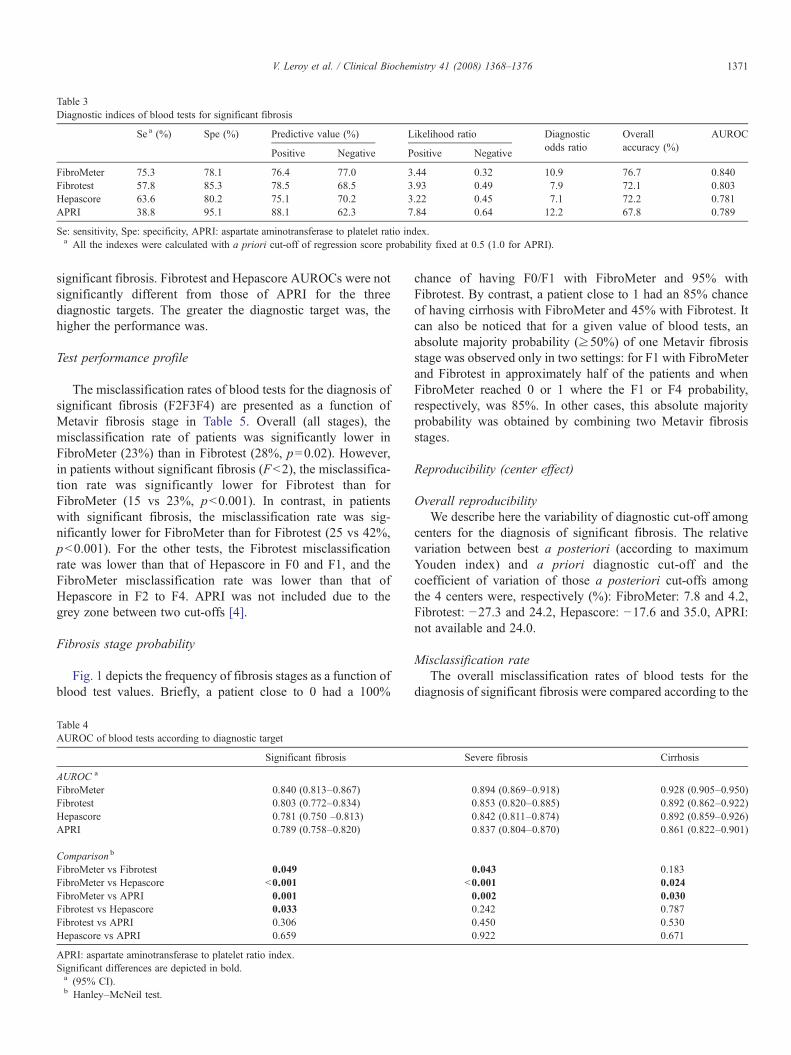
Table 3Diagnostic indices of blood tests for significant fibrosis
Se a (%) Spe (%) Predictive value (%) Likelihood ratio Diagnosticodds ratio
Overallaccuracy (%)
AUROC
Positive Negative Positive Negative
FibroMeter 75.3 78.1 76.4 77.0 3.44 0.32 10.9 76.7 0.840Fibrotest 57.8 85.3 78.5 68.5 3.93 0.49 7.9 72.1 0.803Hepascore 63.6 80.2 75.1 70.2 3.22 0.45 7.1 72.2 0.781APRI 38.8 95.1 88.1 62.3 7.84 0.64 12.2 67.8 0.789
Se: sensitivity, Spe: specificity, APRI: aspartate aminotransferase to platelet ratio index.a All the indexes were calculated with a priori cut-off of regression score probability fixed at 0.5 (1.0 for APRI).
1371V. Leroy et al. / Clinical Biochemistry 41 (2008) 1368–1376
significant fibrosis. Fibrotest and Hepascore AUROCs were notsignificantly different from those of APRI for the threediagnostic targets. The greater the diagnostic target was, thehigher the performance was.
Test performance profile
The misclassification rates of blood tests for the diagnosis ofsignificant fibrosis (F2F3F4) are presented as a function ofMetavir fibrosis stage in Table 5. Overall (all stages), themisclassification rate of patients was significantly lower inFibroMeter (23%) than in Fibrotest (28%, p=0.02). However,in patients without significant fibrosis (Fb2), the misclassifica-tion rate was significantly lower for Fibrotest than forFibroMeter (15 vs 23%, pb0.001). In contrast, in patientswith significant fibrosis, the misclassification rate was sig-nificantly lower for FibroMeter than for Fibrotest (25 vs 42%,pb0.001). For the other tests, the Fibrotest misclassificationrate was lower than that of Hepascore in F0 and F1, and theFibroMeter misclassification rate was lower than that ofHepascore in F2 to F4. APRI was not included due to thegrey zone between two cut-offs [4].
Fibrosis stage probability
Fig. 1 depicts the frequency of fibrosis stages as a function ofblood test values. Briefly, a patient close to 0 had a 100%
Table 4AUROC of blood tests according to diagnostic target
Significant fibrosis
AUROC a
FibroMeter 0.840 (0.813–0.867)Fibrotest 0.803 (0.772–0.834)Hepascore 0.781 (0.750 –0.813)APRI 0.789 (0.758–0.820)
Comparison b
FibroMeter vs Fibrotest 0.049FibroMeter vs Hepascore b0.001FibroMeter vs APRI 0.001Fibrotest vs Hepascore 0.033Fibrotest vs APRI 0.306Hepascore vs APRI 0.659
APRI: aspartate aminotransferase to platelet ratio index.Significant differences are depicted in bold.a (95% CI).b Hanley–McNeil test.
chance of having F0/F1 with FibroMeter and 95% withFibrotest. By contrast, a patient close to 1 had an 85% chanceof having cirrhosis with FibroMeter and 45% with Fibrotest. Itcan also be noticed that for a given value of blood tests, anabsolute majority probability (≥50%) of one Metavir fibrosisstage was observed only in two settings: for F1 with FibroMeterand Fibrotest in approximately half of the patients and whenFibroMeter reached 0 or 1 where the F1 or F4 probability,respectively, was 85%. In other cases, this absolute majorityprobability was obtained by combining two Metavir fibrosisstages.
Reproducibility (center effect)
Overall reproducibilityWe describe here the variability of diagnostic cut-off among
centers for the diagnosis of significant fibrosis. The relativevariation between best a posteriori (according to maximumYouden index) and a priori diagnostic cut-off and thecoefficient of variation of those a posteriori cut-offs amongthe 4 centers were, respectively (%): FibroMeter: 7.8 and 4.2,Fibrotest: −27.3 and 24.2, Hepascore: −17.6 and 35.0, APRI:not available and 24.0.
Misclassification rateThe overall misclassification rates of blood tests for the
diagnosis of significant fibrosis were compared according to the
Severe fibrosis Cirrhosis
0.894 (0.869–0.918) 0.928 (0.905–0.950)0.853 (0.820–0.885) 0.892 (0.862–0.922)0.842 (0.811–0.874) 0.892 (0.859–0.926)0.837 (0.804–0.870) 0.861 (0.822–0.901)
0.043 0.183b0.001 0.0240.002 0.0300.242 0.7870.450 0.5300.922 0.671
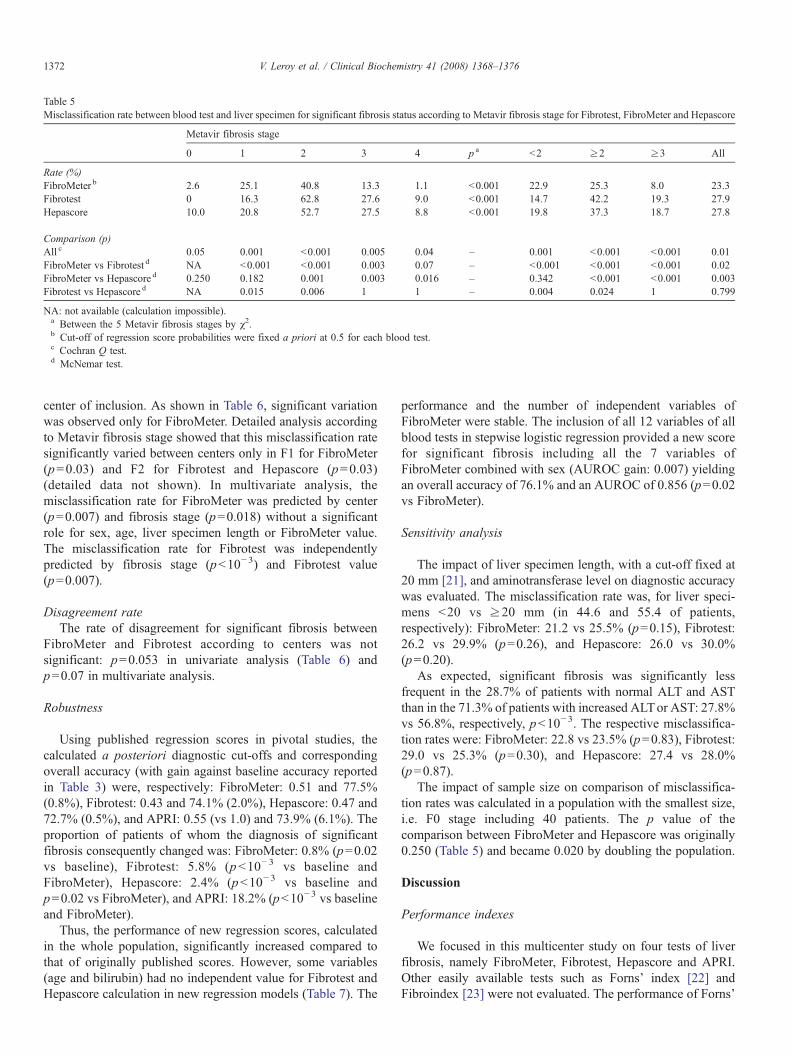
Table 5Misclassification rate between blood test and liver specimen for significant fibrosis status according to Metavir fibrosis stage for Fibrotest, FibroMeter and Hepascore
Metavir fibrosis stage
0 1 2 3 4 p a b2 ≥2 ≥3 All
Rate (%)FibroMeter b 2.6 25.1 40.8 13.3 1.1 b0.001 22.9 25.3 8.0 23.3Fibrotest 0 16.3 62.8 27.6 9.0 b0.001 14.7 42.2 19.3 27.9Hepascore 10.0 20.8 52.7 27.5 8.8 b0.001 19.8 37.3 18.7 27.8
Comparison (p)All c 0.05 0.001 b0.001 0.005 0.04 – 0.001 b0.001 b0.001 0.01FibroMeter vs Fibrotest d NA b0.001 b0.001 0.003 0.07 – b0.001 b0.001 b0.001 0.02FibroMeter vs Hepascore d 0.250 0.182 0.001 0.003 0.016 – 0.342 b0.001 b0.001 0.003Fibrotest vs Hepascore d NA 0.015 0.006 1 1 – 0.004 0.024 1 0.799
NA: not available (calculation impossible).a Between the 5 Metavir fibrosis stages by χ2.b Cut-off of regression score probabilities were fixed a priori at 0.5 for each blood test.c Cochran Q test.d McNemar test.
1372 V. Leroy et al. / Clinical Biochemistry 41 (2008) 1368–1376
center of inclusion. As shown in Table 6, significant variationwas observed only for FibroMeter. Detailed analysis accordingto Metavir fibrosis stage showed that this misclassification ratesignificantly varied between centers only in F1 for FibroMeter(p=0.03) and F2 for Fibrotest and Hepascore (p=0.03)(detailed data not shown). In multivariate analysis, themisclassification rate for FibroMeter was predicted by center(p=0.007) and fibrosis stage (p=0.018) without a significantrole for sex, age, liver specimen length or FibroMeter value.The misclassification rate for Fibrotest was independentlypredicted by fibrosis stage (pb10−3) and Fibrotest value(p=0.007).
Disagreement rateThe rate of disagreement for significant fibrosis between
FibroMeter and Fibrotest according to centers was notsignificant: p=0.053 in univariate analysis (Table 6) andp=0.07 in multivariate analysis.
Robustness
Using published regression scores in pivotal studies, thecalculated a posteriori diagnostic cut-offs and correspondingoverall accuracy (with gain against baseline accuracy reportedin Table 3) were, respectively: FibroMeter: 0.51 and 77.5%(0.8%), Fibrotest: 0.43 and 74.1% (2.0%), Hepascore: 0.47 and72.7% (0.5%), and APRI: 0.55 (vs 1.0) and 73.9% (6.1%). Theproportion of patients of whom the diagnosis of significantfibrosis consequently changed was: FibroMeter: 0.8% (p=0.02vs baseline), Fibrotest: 5.8% (pb10− 3 vs baseline andFibroMeter), Hepascore: 2.4% (pb10−3 vs baseline andp=0.02 vs FibroMeter), and APRI: 18.2% (pb10−3 vs baselineand FibroMeter).
Thus, the performance of new regression scores, calculatedin the whole population, significantly increased compared tothat of originally published scores. However, some variables(age and bilirubin) had no independent value for Fibrotest andHepascore calculation in new regression models (Table 7). The
performance and the number of independent variables ofFibroMeter were stable. The inclusion of all 12 variables of allblood tests in stepwise logistic regression provided a new scorefor significant fibrosis including all the 7 variables ofFibroMeter combined with sex (AUROC gain: 0.007) yieldingan overall accuracy of 76.1% and an AUROC of 0.856 (p=0.02vs FibroMeter).
Sensitivity analysis
The impact of liver specimen length, with a cut-off fixed at20 mm [21], and aminotransferase level on diagnostic accuracywas evaluated. The misclassification rate was, for liver speci-mens b20 vs ≥20 mm (in 44.6 and 55.4 of patients,respectively): FibroMeter: 21.2 vs 25.5% (p=0.15), Fibrotest:26.2 vs 29.9% (p=0.26), and Hepascore: 26.0 vs 30.0%(p=0.20).
As expected, significant fibrosis was significantly lessfrequent in the 28.7% of patients with normal ALT and ASTthan in the 71.3% of patients with increased ALTor AST: 27.8%vs 56.8%, respectively, pb10−3. The respective misclassifica-tion rates were: FibroMeter: 22.8 vs 23.5% (p=0.83), Fibrotest:29.0 vs 25.3% (p=0.30), and Hepascore: 27.4 vs 28.0%(p=0.87).
The impact of sample size on comparison of misclassifica-tion rates was calculated in a population with the smallest size,i.e. F0 stage including 40 patients. The p value of thecomparison between FibroMeter and Hepascore was originally0.250 (Table 5) and became 0.020 by doubling the population.
Discussion
Performance indexes
We focused in this multicenter study on four tests of liverfibrosis, namely FibroMeter, Fibrotest, Hepascore and APRI.Other easily available tests such as Forns' index [22] andFibroindex [23] were not evaluated. The performance of Forns'
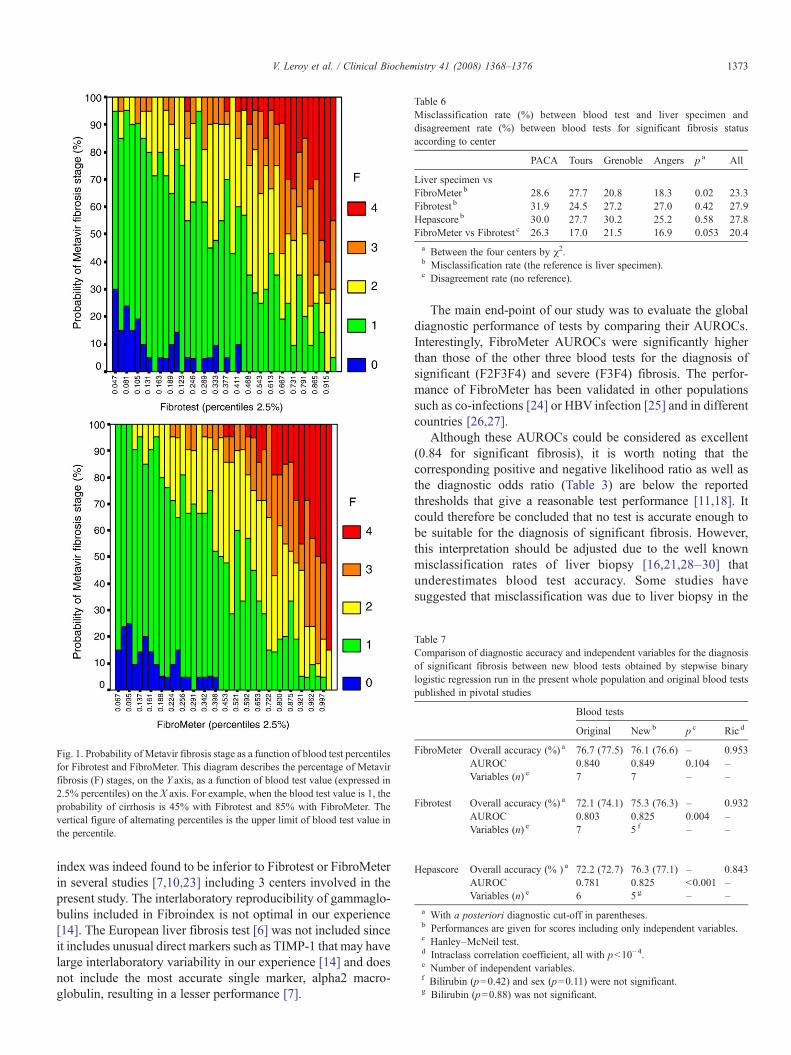
Fig. 1. Probability of Metavir fibrosis stage as a function of blood test percentilesfor Fibrotest and FibroMeter. This diagram describes the percentage of Metavirfibrosis (F) stages, on the Y axis, as a function of blood test value (expressed in2.5% percentiles) on the X axis. For example, when the blood test value is 1, theprobability of cirrhosis is 45% with Fibrotest and 85% with FibroMeter. Thevertical figure of alternating percentiles is the upper limit of blood test value inthe percentile.
Table 6Misclassification rate (%) between blood test and liver specimen anddisagreement rate (%) between blood tests for significant fibrosis statusaccording to center
PACA Tours Grenoble Angers p a All
Liver specimen vsFibroMeter b 28.6 27.7 20.8 18.3 0.02 23.3Fibrotest b 31.9 24.5 27.2 27.0 0.42 27.9Hepascore b 30.0 27.7 30.2 25.2 0.58 27.8FibroMeter vs Fibrotest c 26.3 17.0 21.5 16.9 0.053 20.4a Between the four centers by χ2.b Misclassification rate (the reference is liver specimen).c Disagreement rate (no reference).
Table 7Comparison of diagnostic accuracy and independent variables for the diagnosisof significant fibrosis between new blood tests obtained by stepwise binarylogistic regression run in the present whole population and original blood testspublished in pivotal studies
Blood tests
Original Newb p c Ric d
FibroMeter Overall accuracy (%) a 76.7 (77.5) 76.1 (76.6) – 0.953AUROC 0.840 0.849 0.104 –Variables (n) e 7 7 – –
Fibrotest Overall accuracy (%) a 72.1 (74.1) 75.3 (76.3) – 0.932AUROC 0.803 0.825 0.004 –Variables (n) e 7 5 f – –
Hepascore Overall accuracy (% ) a 72.2 (72.7) 76.3 (77.1) – 0.843AUROC 0.781 0.825 b0.001 –Variables (n) e 6 5 g – –
a With a posteriori diagnostic cut-off in parentheses.b Performances are given for scores including only independent variables.c Hanley–McNeil test.d Intraclass correlation coefficient, all with pb10−4.e Number of independent variables.f Bilirubin (p=0.42) and sex (p=0.11) were not significant.g Bilirubin (p=0.88) was not significant.
1373V. Leroy et al. / Clinical Biochemistry 41 (2008) 1368–1376
index was indeed found to be inferior to Fibrotest or FibroMeterin several studies [7,10,23] including 3 centers involved in thepresent study. The interlaboratory reproducibility of gammaglo-bulins included in Fibroindex is not optimal in our experience[14]. The European liver fibrosis test [6] was not included sinceit includes unusual direct markers such as TIMP-1 that may havelarge interlaboratory variability in our experience [14] and doesnot include the most accurate single marker, alpha2 macro-globulin, resulting in a lesser performance [7].
The main end-point of our study was to evaluate the globaldiagnostic performance of tests by comparing their AUROCs.Interestingly, FibroMeter AUROCs were significantly higherthan those of the other three blood tests for the diagnosis ofsignificant (F2F3F4) and severe (F3F4) fibrosis. The perfor-mance of FibroMeter has been validated in other populationssuch as co-infections [24] or HBV infection [25] and in differentcountries [26,27].
Although these AUROCs could be considered as excellent(0.84 for significant fibrosis), it is worth noting that thecorresponding positive and negative likelihood ratio as well asthe diagnostic odds ratio (Table 3) are below the reportedthresholds that give a reasonable test performance [11,18]. Itcould therefore be concluded that no test is accurate enough tobe suitable for the diagnosis of significant fibrosis. However,this interpretation should be adjusted due to the well knownmisclassification rates of liver biopsy [16,21,28–30] thatunderestimates blood test accuracy. Some studies havesuggested that misclassification was due to liver biopsy in the
1374 V. Leroy et al. / Clinical Biochemistry 41 (2008) 1368–1376
majority of cases [31,32]. Altogether, these results explain theapparently high rate of misclassification for the diagnosis ofsignificant fibrosis that ranged in our study from 23% forFibroMeter to 28% for Hepascore and Fibrotest. Most caseswhich were misclassified belonged to the F1 and F2 stages inwhich liver histological reproducibility is poor [16]. Con-versely, the F0 (absence of fibrosis) and F4 (cirrhosis) stages,which are very clinically relevant stages, were correctlyclassified in more than 97% of cases using the most accuratetest.
This observation means that even if a high rate ofmisclassification can be observed, especially in intermediatestages of fibrosis, blood tests may give partial but importantinformation on liver fibrosis, such as exclusion of cirrhosis. Thisled us to describe the new concept of fibrosis stage probability,which provides the predictive value of blood test for fibrosisstages. This new descriptor provides for a given blood test valuethe corresponding probability of each fibrosis stages from F0 toF4. For example, a patient with a FibroMeter at 0.15 has a 75%chance to be Metavir F1. However, this probability is dependentof the observed prevalence of fibrosis stages, and thereproducibility of this descriptor will need to be evaluated inother populations. The fibrosis stage probability also clearlyshows that, in the population studied, at the extremes of bloodtest values one or two fibrosis stages reached 100% ofprobability for FibroMeter but not for Fibrotest, such adifference having a strong clinical impact especially for thediagnosis of cirrhosis.
Factors influencing the test performance
Interlaboratory reproducibility of Fibrotest [33] and Fib-roMeter [14] are excellent but this biological characteristic isnot sufficient to evaluate clinical reproducibility and applic-ability. Indeed, it does not take into account pre-analyticalsources of variability such as fibrosis degree prevalence.Therefore, we evaluated the variability of blood tests byincluding liver biopsy specimen as an independent reference.We evaluated the global reproducibility of blood tests owing tothe coefficient of variation of the diagnostic cut-off ofregression score probability (overall reproducibility testindex). This cut-off is a cornerstone since it distinguishespatients with or without the diagnostic target. The ideal testshould have an a posteriori cut-off close to 0.5 – for the highestobserved overall accuracy – for significant fibrosis, and thelowest variability. FibroMeter was the test with a cut-off theclosest to 0.5 together with the lowest variability. Hepascore hadthe highest variability. It seems that bilirubin might explain thisvariability since this variable was not robust in the present studyand has a suboptimal interlaboratory reproducibility [14].However, it should be noted that the variability of bloodvariables had a weak impact on blood test value. As a rule, theratio was 10 to 1, i.e. a simulated change of −50% or 100% in avariable induced a 10% change in the FibroMeter [14].Moreover, the observed changes recorded in a quality controlof a single variable recorded in 317 French laboratories resultedin a maximum change of 1.7% in the FibroMeter [14].
The performance of tests, with liver specimen as reference,was sensitive to center (Table 6). In fact, this was attributable toF1 and F2 Metavir stages where the interobserver or inter-centeragreement is poor [16]. However, the disagreement ratebetween FibroMeter and Fibrotest, independent from liverspecimen, was not sensitive to centers. This comparison waspossible by test performance profiles (or disagreement rate) butnot by AUROC. The test performance profile relies on themisclassification rates of a blood test based on Metavir F stagesdetermined on liver specimens. This method clearly shows thatthe test performance significantly depends on the fibrosis stage(Table 5). Thus, e.g., Fibrotest, FibroMeter and Hepascoredisplayed a peak of misclassification rate for Metavir F2.Moreover, the test performance profiles were different since thisF2 peak was significantly lower for FibroMeter and themisclassification rates were significantly lower with FibroMetercompared to Fibrotest or Hepascore for all three stages ofsignificant fibrosis.
The robustness of blood test was evaluated according to twocouples of complementary means. Using the originallypublished regression scores, we compared the a priori and aposteriori diagnostic cut-off in the whole population. The best aposteriori blood test cut-off was close to the a priori cut-off(0.5) for FibroMeter and Hepascore resulting in a weak gain inoverall accuracy, V0.8%. The variation in diagnostic cut-offwas greater for Fibrotest with an overall accuracy gain of 2.0%.The corresponding changes in patients classified with sig-nificant fibrosis were 0.8% for FibroMeter, 2.4% for Hepascoreand 5.8% for Fibrotest, which were very significantly differentfrom the changes for FibroMeter. As an a priori cut-off of 0.5,unless otherwise specified, is applied in clinical practice, thepresent study shows that FibroMeter and Hepascore have a verylow variability in overall accuracy, whereas Fibrotest, and to alarger extent APRI, have a larger variability. From a clinicalpoint of view, those results mean that the local measurement ofblood test induces variation both in test performance and in theclassification of patients for Fibrotest based on the test set-up inthe original population. The robustness of blood test perfor-mance (AUROC, Table 6) between original regression scoresprovided by published formula or generated with the new wholepopulation was greater with FibroMeter (performance gain:0.009, p: 0.104) than with Fibrotest (gain: 0.022, p: 0.004) orHepascore (gain: 0.044, pb0.001).
Some markers were not independent variables in the newregression score for significant fibrosis of Fibrotest (bilirubinand sex) and Hepascore (bilirubin) calculated in the wholepopulation, which reflects a lower robustness. When all themarkers included in the four tests were run in a new regressionscore for significant fibrosis, only the 7 variables of FibroMeterplus sex were significant.
The performance of blood tests seemed not to depend onliver specimen length with a misclassification rate notsignificantly different below or above 20 mm, which wasconsidered as the length threshold for a reliable histologicalanalysis [21]. Likewise, the performance of blood tests wasnot significantly different between patients with normal orabnormal aminotransferases. A simulation showed that the
1375V. Leroy et al. / Clinical Biochemistry 41 (2008) 1368–1376
comparison of misclassification rates was very sensitive topopulation size. Therefore, further study on misclassificationrates should take into account the size of the fibrosis stagewith the fewest patients to reach a sufficient power. Age andsex were two independent predictors of significant fibrosiswhen all variables were included in the statistical model. Thisunderlines the importance of including these two simpleclinical variables in the evaluation of blood tests. Comorbid-ities such as metabolic syndrome should also be included infurther studies since its composite factors are independentpredictors of significant liver fibrosis due to metabolicsyndrome [34].
In conclusion, this meta-analysis with individual datevalidates the global diagnostic accuracy of FibroMeter,Fibrotest, and APRI, but not for Hepascore, and showssignificant differences in terms of performance, the highestAUROCs being observed with FibroMeter. The main factorsinfluencing test accuracy are the relative prevalence of MetavirF stages, the diagnostic target (fibrosis stages), the testrobustness, and the choice of fibrosis markers. This studyprovides new descriptors for the application of blood tests inclinical practice.
Acknowledgments
We thank other investigators from Angers: Frédéric Oberti,Sophie Michalak, Isabelle Hubert-Fouchard, Anselme Konaté,Catherine Ternisien, Alain Chevailler, Franµoise Lunel, DermotO'Toole; PACA: Denis Ouzan, Albert Tran, Danielle Botta,Christophe Renou, Christophe Sattonnet, Marie-ChristineSaint-Paul, Thierry Benderitter, Stéphane Garcia, Henri PierreBonneau ; Grenoble: Marie-Noelle Hilleret, Jean-Pierre Zarski,Patrice Faure, Jean-Charles Renversez, Francoise Morel;Clichy: Claude Degott, Valérie Paradis; and Montreal (Canada):Robert Platt.
Steering committee: Vincent Leroy, Philippe Halfon, Yan-nick Bacq, Paul Calès.
Review committee: Philippe Halfon, Yannick Bacq, DermotO'Toole, and for statistics: Guillaume Penaranda, GillesHunault, Robert Platt. Proofreading provided be Kevin Erwin.
Data analysis: Guillaume Penaranda, Gilles Hunault, PaulCalès.
Grant: PHRC in 1994 and 2002 from French Department ofHealth.
Author disclosure: Paul Calès has stock ownership inBioLiveScale Inc. that has a license for FibroMeter fromAngers University. Guillaume Penaranda and Gilles Hunault areindependent biostatisticians.
Appendix A
Diagnostic cut-off — The diagnostic cut-off of a blood testvalue that distinguishes patients with or without the diagnostictarget was fixed in two ways: a priori to 0.5 according tostatistical rules, except for APRI, and a posteriori according tothe highest Youden index (Se+Spe−1) to optimize the overallaccuracy. As the a priori cut-off of APRI was not precisely
described in the pivotal study, the following calculations did notincluded APRI.
Test performance profile — The misclassification rate ofblood test for significant fibrosis was calculated using Metavirstaging as reference as a binary variable [9]. Thus, a patient withMetavir F0 or F1 classified in the significant fibrosis group byblood tests was considered misclassified and vice versa. Themisclassification rate was calculated in each Metavir F stagedetermined by histological staging. Then, misclassification rateswere compared between a pair of blood tests by the McNemartest. The disagreement rate depicts the crude discrepancybetween two blood tests for significant fibrosis with noreference to liver biopsy.
Fibrosis stage probability — Blood tests are usuallyconstructed following a binary logistic regression, whichprovides the probability (i.e. the predictive value) of havingsignificant fibrosis when the test is above a given cut-off.However, it would be interesting in clinical practice to know theprobability of a Metavir fibrosis stage for a given blood testvalue. The present method estimates the probability of MetavirF stages as a function of blood test value. In a first step, theblood test value is divided into different classes with similarsample size according to percentiles (2.5% was chosen). Then,the histological fibrosis staging is plotted against thosepercentiles. The multiple results (maximum 200: 40 blood testpercentiles�5 fibrosis stages) are easily readable with a graphdepicting cumulative bars of fibrosis stages on the Y axis andblood test percentiles on the X axis (see Fig. 1), each vertical barincluding all the corresponding fibrosis stages for a given bloodtest value.
Overall reproducibility test index — The diagnostic cut-offis usually fixed in the original population a priori at 0.5 tomaximize the diagnostic accuracy. However, this cut-off mighthave a different value especially in other populations. Theoverall reproducibility of blood tests was evaluated through thevariability as a function of centers of the best a posteriori cut-off of original blood test value for the diagnosis of significantfibrosis. We used two descriptors: the relative variation of meana posteriori cut-off in the 4 centers against 0.5, i.e. a priorifixed cut-off, and the coefficient of variation of those aposteriori cut-offs among the 4 centers.
Robustness — The validating studies, as in the previoussteps, use the published regression scores with original bcoefficients of all markers. Here, we included the same markersin a stepwise regression model applied to the new wholepopulation, i.e. larger compared to the original population,providing a new regression score for significant fibrosis. Therobustness of blood variables was evaluated by using twodescriptors: intra- and inter-test statistical independence.Indeed, available markers were evaluated either within eachsingle blood test or together among all the blood tests in thewhole population. The robustness of blood tests was evaluatedusing two other descriptors in the whole population: thevariation between a priori and a posteriori diagnostic cut-offsof original regression scores; and the variation in testperformance provided by the original and new regressionscores.
1376 V. Leroy et al. / Clinical Biochemistry 41 (2008) 1368–1376
References
[1] Sebastiani G, Alberti A. Non invasive fibrosis biomarkers reduce but notsubstitute the need for liver biopsy. World J Gastroenterol 2006;12:3682–94.
[2] Murawaki Y, Ikuta Y, Okamoto K, Koda M, Kawasaki H. Diagnostic valueof serum markers of connective tissue turnover for predicting histologicalstaging and grading in patients with chronic hepatitis C. J Gastroenterol2001;36:399–406.
[3] Croquet V, Vuillemin E, Ternisien C, Pilette C, Oberti F, Gallois Y, et al.Prothrombin index is an indirect marker of severe liver fibrosis. Eur JGastroenterol Hepatol 2002;14:1133–41.
[4] Wai CT, Greenson JK, Fontana RJ, Kalbfleisch JD, Marrero JA,Conjeevaram HS, et al. A simple noninvasive index can predict bothsignificant fibrosis and cirrhosis in patients with chronic hepatitis C.Hepatology 2003;38:518–26.
[5] Imbert-Bismut F, Ratziu V, Pieroni L, Charlotte F, Benhamou Y, PoynardT. Biochemical markers of liver fibrosis in patients with hepatitis C virusinfection: a prospective study. Lancet 2001;357:1069–75.
[6] Rosenberg WM, Voelker M, Thiel R, Becka M, Burt A, Schuppan D, et al.Serum markers detect the presence of liver fibrosis: a cohort study.Gastroenterology 2004;127:1704–13.
[7] Cales P, Oberti F, Michalak S, Hubert-Fouchard I, Rousselet MC, KonateA, et al. A novel panel of blood markers to assess the degree of liverfibrosis. Hepatology 2005;42:1373–81.
[8] Poynard T, Imbert-Bismut F, Munteanu M, Messous D, Myers RP,Thabut D, et al. Overview of the diagnostic value of biochemical markersof liver fibrosis (FibroTest, HCV FibroSure) and necrosis (ActiTest) inpatients with chronic hepatitis C. Comp Hepatol 2004;3:8.
[9] Halfon P, Bacq Y, De Muret A, Penaranda G, Bourliere M, OuzanD, et al. Comparison of test performance profile for blood tests ofliver fibrosis in chronic hepatitis C. J Hepatol 2007;46:395–402.
[10] Leroy V, Hilleret MN, Sturm N, Trocme C, Renversez JC, Faure P, et al.Prospective comparison of six non-invasive scores for the diagnosis ofliver fibrosis in chronic hepatitis C. J Hepatol 2007;46:775–82.
[11] Parkes J, Guha IN, Roderick P, Rosenberg W. Performance of serummarker panels for liver fibrosis in chronic hepatitis C. J Hepatol 2006;44:462–74.
[12] Adams LA, Bulsara M, Rossi E, DeBoer B, Speers D, George J, et al.Hepascore: an accurate validated predictor of liver fibrosis in chronichepatitis C infection. Clin Chem 2005;51:1867–73.
[13] Castera L, Vergniol J, Foucher J, Le Bail B, Chanteloup E, Haaser M, et al.Prospective comparison of transient elastography, Fibrotest, APRI, andliver biopsy for the assessment of fibrosis in chronic hepatitis C.Gastroenterology 2005;128:343–50.
[14] Cales P, Veillon P, Konate A, Mathieu E, Ternisien C, Chevailler A, et al.Reproducibility of blood tests of liver fibrosis in clinical practice. ClinBiochem 2008;41:10–8.
[15] The French METAVIR Cooperative Study Group. Intraobserver and inter-observer variations in liver biopsy interpretation in patients with chronichepatitis C. Hepatology 1994;20:15–20.
[16] Rousselet MC, Michalak S, Dupre F, Croue A, Bedossa P, Saint-Andre JP,et al. Sources of variability in histological scoring of chronic viral hepatitis.Hepatology 2005;41:257–64.
[17] Greenhalgh. How to read a paper. Papers that report diagnostic orscreening tests. Br Med J 1997;315:540–3.
[18] Glas AS, Lijmer JG, Prins MH, Bonsel GJ, Bossuyt PM. The diagnosticodds ratio: a single indicator of test performance. J Clin Epidemiol 2003;56:1129–35.
[19] Hanley JA, McNeil BJ. A method of comparing the areas under receiveroperating characteristic curves derived from the same cases. Radiology1983;148:839–43.
[20] Bossuyt PM, Reitsma JB, Bruns DE, Gatsonis CA, Glasziou PP, Irwig LM,et al. The STARD statement for reporting studies of diagnostic accuracy:explanation and elaboration. Clin Chem 2003;49:7–18.
[21] Colloredo G, Guido M, Sonzogni A, Leandro G. Impact of liver biopsysize on histological evaluation of chronic viral hepatitis: the smaller thesample, the milder the disease. J Hepatol 2003;39:239–44.
[22] Forns X, Ampurdanes S, Llovet JM, Aponte J, Quinto L, Martinez-BauerE, et al. Identification of chronic hepatitis C patients without hepaticfibrosis by a simple predictive model. Hepatology 2002;36:986–92.
[23] Koda M, Matunaga Y, Kawakami M, Kishimoto Y, Suou T, Murawaki Y.Fibroindex, a practical index for predicting significant fibrosis in patientswith chronic hepatitis C. Hepatology 2007;45:297–306.
[24] Cacoub P, Carrat F, Bedossa P, Lambert J, Penaranda G, Perronne C, et al.Comparison of non-invasive liver fibrosis biomarkers in HIV/HCV co-infected patients: the fibrovic study — ANRS HC02. J Hepatol 2008;48:765–73.
[25] Leroy V, Sturm N, Hilleret M, Renversez P, Trocme C, Faure P, et al.Diagnostic accuracy of blood tests of liver fibrosis in chronic hepatitis B:comparison with hepatitis C. Hepatology 2007;46:900A–1A.
[26] Maor Y, Cales P, Bashari D, Kenet G, Lubetsky A, Luboshitz J, et al.Improving estimation of liver fibrosis using combination and newernoninvasive biomarker scoring systems in hepatitis C-infected haemophi-lia patients. Haemophilia 2007;13:722–9.
[27] Sombié R, Lescure F, Bougouma A, Guiard-Schmid J, Poynard T, Calès P,et al. Evaluation de la fibrose hépatique (histologie, marqueurs sériques,élastométrie) chez des patients infectés par le VHB au Burkina Faso.JAHG [in press].
[28] Bedossa P, Dargere D, Paradis V. Sampling variability of liver fibrosis inchronic hepatitis C. Hepatology 2003;38:1449–57.
[29] Regev A, Berho M, Jeffers LJ, Milikowski C, Molina EG, PyrsopoulosNT, et al. Sampling error and intraobserver variation in liver biopsy inpatients with chronic HCV infection. Am J Gastroenterol 2002;97:2614–8.
[30] Nord HJ. Biopsy diagnosis of cirrhosis: blind percutaneous versus guideddirect vision techniques—a review. Gastrointest Endosc 1982;28:102–4.
[31] Halfon P, Bourliere M, Deydier R, Botta-Fridlund D, Renou C, Tran A,et al. Independent prospective multicenter validation of biochemicalmarkers (fibrotest–actitest) for the prediction of liver fibrosis andactivity in patients with chronic hepatitis C: the Fibropaca Study. Am JGastroenterol 2006;101:547–55.
[32] Poynard T, Munteanu M, Imbert-Bismut F, Charlotte F, Thabut D, LeCalvez S, et al. Prospective analysis of discordant results betweenbiochemical markers and biopsy in patients with chronic hepatitis C. ClinChem 2004;50:1344–55.
[33] Halfon P, Imbert-Bismut F, Messous D, Antoniotti G, Benchetrit D, Cart-Lamy P, et al. A prospective assessment of the inter-laboratory variabilityof biochemical markers of fibrosis (FibroTest) and activity (ActiTest) inpatients with chronic liver disease. Comp Hepatol 2002;1:3.
[34] Tropet A, Lainé F, De Ledinghen V, Deugnier Y, Oberti F, Dib N, et al. Noninvasive tests of liver fibrosis in NAFLD. J Hepatol 2007;46(Suppl1):S287–8.
![Doxycycline improves clinical outcomes during cystic ... · Introduction Cystic fibrosis (CF) is the most common inherited genetic disorder in Caucasians worldwide [1]. It is due](https://img.pdfslide.fr/doc/110x75/5edf2429ad6a402d666a7de0/doxycycline-improves-clinical-outcomes-during-cystic-introduction-cystic-fibrosis.jpg)