Embed Size (px)
Citation preview
Mathematical Biosciences 258 (2014) 101–112
Contents lists available at ScienceDirect
Mathematical Biosciences
journal homepage: www.elsevier.com/locate/mbs
Digestion modeling in the small intestine: Impact of dietary fiber
M. Taghipoor a,b,∗, G. Barles a, C. Georgelin a, J.R. Licois a, P. Lescoat b,1
a Laboratoire de Mathématiques et Physique Théorique (UMR CNRS 7350), Fédération Denis Poisson (FR CNRS 2964), Université de Tours Faculté des Sciences et
Techniques, Parc de Grandmont, F-37200 Tours, Franceb INRA, UR83 Recherches Avicoles, F-37380 Nouzilly, France
a r t i c l e i n f o
Article history:
Received 23 April 2013
Revised 6 June 2014
Accepted 19 September 2014
Available online 13 October 2014
Keywords:
Modeling of intestinal digestion
Water holding capacity
Soluble dietary fiber
Insoluble dietary fiber
a b s t r a c t
In this work, the modeling of the digestion in the small intestine is developed by investigating specifically
the effects of dietary fiber. As our previous model, this new version takes into account the three main
phenomena of digestion: transit of the bolus, degradation of feedstuffs and absorption through the intestinal
wall. However the two main physiochemical characteristics of dietary fiber, namely viscosity and water
holding capacity, lead us to substantially modify our initial model by emphasizing the role of water and its
intricated dynamics with dry matter in the bolus. Various numerical simulations given by this new model are
qualitatively in agreement with the positive effect of insoluble dietary fiber on the velocity of bolus and on its
degradation all along the small intestine. These simulations reproduce the negative effect of soluble dietary
fiber on digestion as it has been experimentally observed. Although, this model is generic and contains a large
number of parameters but, to the best of our knowledge, it is among the first qualitative dynamical models
of fiber influence on intestinal digestion.
© 2014 Elsevier Inc. All rights reserved.
1
m
d
i
h
b
p
t
e
c
d
i
w
w
o
k
t
T
B
m
r
t
t
t
l
a
i
p
b
m
a
fi
r
n
m
c
b
a
h
0
. Introduction
Digestion in the small intestine can be described through three
ain phenomena: transit of the bolus along the small intestine, degra-
ation of macromolecules into smaller ones and absorption through
ntestinal wall. Taking into account these phenomena, the authors
ave presented in [17] a generic model of digestion in which the
olus includes only one category of macromolecules (carbohydrates,
roteins or lipids) and water.
However mixing these nutrients influences the digestion process
hrough interactions between molecules. To improve this model, the
ffects of such interactions have to be incorporated. As a first step, we
onsider the effect of dietary fiber because of its significant role on
igestion. It is known that one of the key properties of dietary fiber
s its water holding capacity; this leads us to investigate the role of
ater in the digestion process. To reach this target, dry matter and
ater in each substrate are separately accounted for. Then, the kinetic
f water is modeled by taking into account its correlation with the
inetic of the dry matter.
Unavoidably, this new model is rather complicated. Consequently
o describe and support our modeling approach, we proceed in three
∗ Present address: INRA, UMR1348 Pegase, F-35590 Saint-Gilles, France.
el.: +33 638748589.
E-mail address: [email protected] (M. Taghipoor).1 Present address: AgroParisTech, Life Science and Health Department, 16, rue Claude
ernard, F-75231, Paris cedex 05, France.
c
c
g
s
i
o
ttp://dx.doi.org/10.1016/j.mbs.2014.09.011
025-5564/© 2014 Elsevier Inc. All rights reserved.
ain steps mostly written in three sections: firstly, in Section 2, the
equired biological background on soluble and insoluble dietary fiber,
heir main physiochemical characteristics and effects on the diges-
ion are introduced. Next, each biological quantity or effect has to be
ranslated into mathematical notations or equations. In Section 3, a
ist of the main assumptions used to build the mathematical model
re described. Obviously these assumptions can be discussed and it
s important to have a clear and precise formulation of each of the
roposed hypothesis. Finally, the state variables of the model with a
rief biologic description for each variable and the associated mathe-
atical equations are given in Section 4.
The aim of this presentation in three steps is to guide the reader
ll along our modeling process, from the biological background to the
nal mathematical equations descriptions. Our aim is to have a more
eadable article in that way, although it may induce a longer paper.
Once the equations of the model are determined, we performed
umerical simulations whose aim is to check the behavior of the
odel according to the proposed biological hypotheses and/or to
ompare different sets of hypothesis. Specifically, known or assumed
iological mechanisms relating dietary fiber and digestion process
re simulated. In Section 5 we provided several simulations with
omments on the hypothesis. These numerical simulations can be
onsidered as in silico experiments. Of course, since our model is
eneric, it contains a lot of parameters and some of the hypothe-
es are still to be checked (by biological experiments), we are look-
ng for qualitative behavior with very few attentions on quantitative
utputs. This is why no sensitivity on the parameters is checked.
102 M. Taghipoor et al. / Mathematical Biosciences 258 (2014) 101–112
As
Babs
BintAns
And
W
Fs
Fins
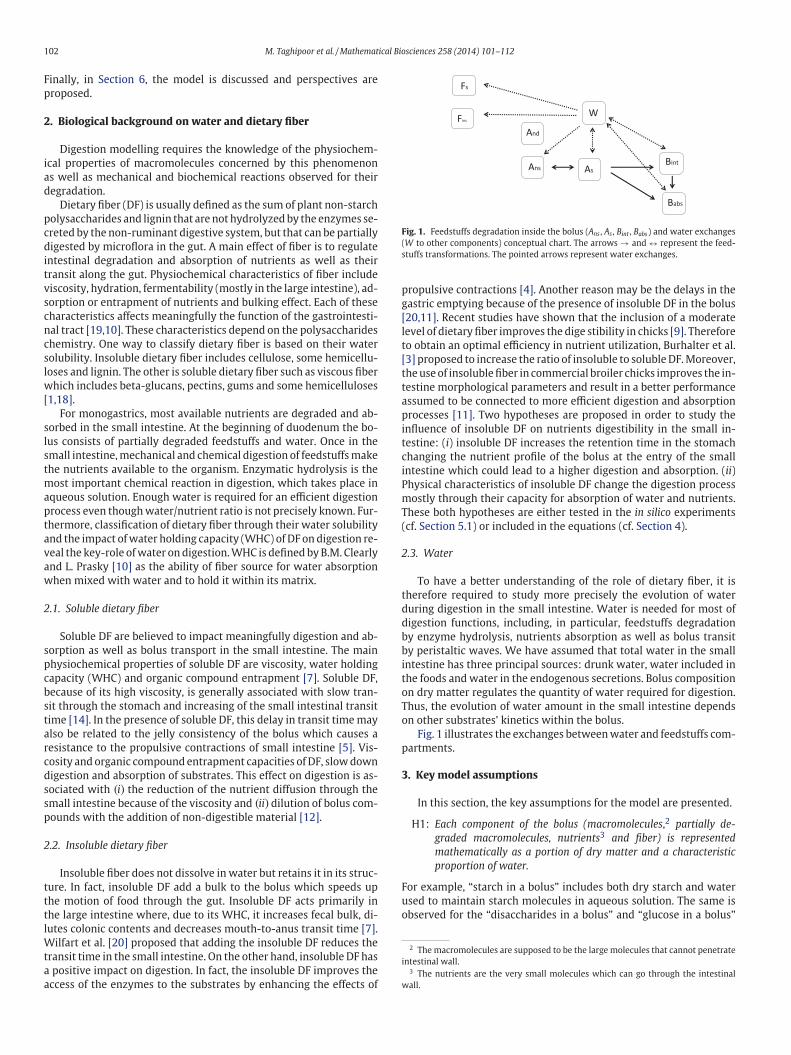
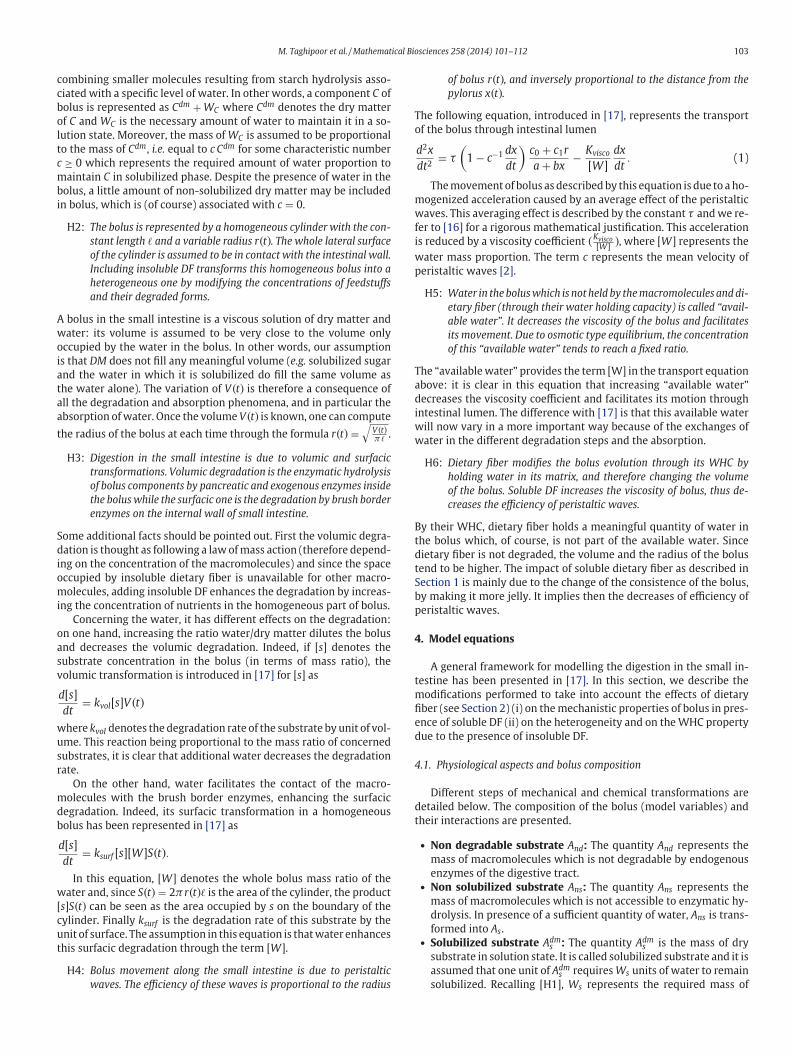
Fig. 1. Feedstuffs degradation inside the bolus (Ans , As , Bint , Babs) and water exchanges
(W to other components) conceptual chart. The arrows → and ↔ represent the feed-
stuffs transformations. The pointed arrows represent water exchanges.
p
g
[
l
t
[
t
t
a
p
i
t
c
i
P
m
T
(
2
t
d
d
b
b
i
t
o
T
o
p
3
F
u
o
2 The macromolecules are supposed to be the large molecules that cannot penetrate
intestinal wall.3 The nutrients are the very small molecules which can go through the intestinal
wall.
Finally, in Section 6, the model is discussed and perspectives are
proposed.
2. Biological background on water and dietary fiber
Digestion modelling requires the knowledge of the physiochem-
ical properties of macromolecules concerned by this phenomenon
as well as mechanical and biochemical reactions observed for their
degradation.
Dietary fiber (DF) is usually defined as the sum of plant non-starch
polysaccharides and lignin that are not hydrolyzed by the enzymes se-
creted by the non-ruminant digestive system, but that can be partially
digested by microflora in the gut. A main effect of fiber is to regulate
intestinal degradation and absorption of nutrients as well as their
transit along the gut. Physiochemical characteristics of fiber include
viscosity, hydration, fermentability (mostly in the large intestine), ad-
sorption or entrapment of nutrients and bulking effect. Each of these
characteristics affects meaningfully the function of the gastrointesti-
nal tract [19,10]. These characteristics depend on the polysaccharides
chemistry. One way to classify dietary fiber is based on their water
solubility. Insoluble dietary fiber includes cellulose, some hemicellu-
loses and lignin. The other is soluble dietary fiber such as viscous fiber
which includes beta-glucans, pectins, gums and some hemicelluloses
[1,18].
For monogastrics, most available nutrients are degraded and ab-
sorbed in the small intestine. At the beginning of duodenum the bo-
lus consists of partially degraded feedstuffs and water. Once in the
small intestine, mechanical and chemical digestion of feedstuffs make
the nutrients available to the organism. Enzymatic hydrolysis is the
most important chemical reaction in digestion, which takes place in
aqueous solution. Enough water is required for an efficient digestion
process even though water/nutrient ratio is not precisely known. Fur-
thermore, classification of dietary fiber through their water solubility
and the impact of water holding capacity (WHC) of DF on digestion re-
veal the key-role of water on digestion. WHC is defined by B.M. Clearly
and L. Prasky [10] as the ability of fiber source for water absorption
when mixed with water and to hold it within its matrix.
2.1. Soluble dietary fiber
Soluble DF are believed to impact meaningfully digestion and ab-
sorption as well as bolus transport in the small intestine. The main
physiochemical properties of soluble DF are viscosity, water holding
capacity (WHC) and organic compound entrapment [7]. Soluble DF,
because of its high viscosity, is generally associated with slow tran-
sit through the stomach and increasing of the small intestinal transit
time [14]. In the presence of soluble DF, this delay in transit time may
also be related to the jelly consistency of the bolus which causes a
resistance to the propulsive contractions of small intestine [5]. Vis-
cosity and organic compound entrapment capacities of DF, slow down
digestion and absorption of substrates. This effect on digestion is as-
sociated with (i) the reduction of the nutrient diffusion through the
small intestine because of the viscosity and (ii)dilution of bolus com-
pounds with the addition of non-digestible material [12].
2.2. Insoluble dietary fiber
Insoluble fiber does not dissolve in water but retains it in its struc-
ture. In fact, insoluble DF add a bulk to the bolus which speeds up
the motion of food through the gut. Insoluble DF acts primarily in
the large intestine where, due to its WHC, it increases fecal bulk, di-
lutes colonic contents and decreases mouth-to-anus transit time [7].
Wilfart et al. [20] proposed that adding the insoluble DF reduces the
transit time in the small intestine. On the other hand, insoluble DF has
a positive impact on digestion. In fact, the insoluble DF improves the
access of the enzymes to the substrates by enhancing the effects of
ropulsive contractions [4]. Another reason may be the delays in the
astric emptying because of the presence of insoluble DF in the bolus
20,11]. Recent studies have shown that the inclusion of a moderate
evel of dietary fiber improves the dige stibility in chicks [9]. Therefore
o obtain an optimal efficiency in nutrient utilization, Burhalter et al.
3] proposed to increase the ratio of insoluble to soluble DF. Moreover,
he use of insoluble fiber in commercial broiler chicks improves the in-
estine morphological parameters and result in a better performance
ssumed to be connected to more efficient digestion and absorption
rocesses [11]. Two hypotheses are proposed in order to study the
nfluence of insoluble DF on nutrients digestibility in the small in-
estine: (i) insoluble DF increases the retention time in the stomach
hanging the nutrient profile of the bolus at the entry of the small
ntestine which could lead to a higher digestion and absorption. (ii)
hysical characteristics of insoluble DF change the digestion process
ostly through their capacity for absorption of water and nutrients.
hese both hypotheses are either tested in the in silico experiments
cf. Section 5.1) or included in the equations (cf. Section 4).
.3. Water
To have a better understanding of the role of dietary fiber, it is
herefore required to study more precisely the evolution of water
uring digestion in the small intestine. Water is needed for most of
igestion functions, including, in particular, feedstuffs degradation
y enzyme hydrolysis, nutrients absorption as well as bolus transit
y peristaltic waves. We have assumed that total water in the small
ntestine has three principal sources: drunk water, water included in
he foods and water in the endogenous secretions. Bolus composition
n dry matter regulates the quantity of water required for digestion.
hus, the evolution of water amount in the small intestine depends
n other substrates’ kinetics within the bolus.
Fig. 1 illustrates the exchanges between water and feedstuffs com-
artments.
. Key model assumptions
In this section, the key assumptions for the model are presented.
H1: Each component of the bolus (macromolecules,2 partially de-
graded macromolecules, nutrients3 and fiber) is represented
mathematically as a portion of dry matter and a characteristic
proportion of water.
or example, “starch in a bolus” includes both dry starch and water
sed to maintain starch molecules in aqueous solution. The same is
bserved for the “disaccharides in a bolus” and “glucose in a bolus”
M. Taghipoor et al. / Mathematical Biosciences 258 (2014) 101–112 103
c
c
b
o
l
t
c
m
b
i
A
w
o
i
a
t
a
a
t
S
d
i
o
m
i
o
a
s
v
w
u
s
r
m
d
b
w
[
c
u
t
T
o
m
w
f
i
w
p
T
a
d
i
w
w
B
t
d
t
S
b
p
4
t
m
fi
e
d
4
d
t
ombining smaller molecules resulting from starch hydrolysis asso-
iated with a specific level of water. In other words, a component C of
olus is represented as Cdm + WC where Cdm denotes the dry matter
f C and WC is the necessary amount of water to maintain it in a so-
ution state. Moreover, the mass of WC is assumed to be proportional
o the mass of Cdm, i.e. equal to c Cdm for some characteristic number
≥ 0 which represents the required amount of water proportion to
aintain C in solubilized phase. Despite the presence of water in the
olus, a little amount of non-solubilized dry matter may be included
n bolus, which is (of course) associated with c = 0.
H2: The bolus is represented by a homogeneous cylinder with the con-
stant length � and a variable radius r(t). The whole lateral surface
of the cylinder is assumed to be in contact with the intestinal wall.
Including insoluble DF transforms this homogeneous bolus into a
heterogeneous one by modifying the concentrations of feedstuffs
and their degraded forms.
bolus in the small intestine is a viscous solution of dry matter and
ater: its volume is assumed to be very close to the volume only
ccupied by the water in the bolus. In other words, our assumption
s that DM does not fill any meaningful volume (e.g. solubilized sugar
nd the water in which it is solubilized do fill the same volume as
he water alone). The variation of V(t) is therefore a consequence of
ll the degradation and absorption phenomena, and in particular the
bsorption of water. Once the volume V(t) is known, one can compute
he radius of the bolus at each time through the formula r(t) =√
V(t)π�
.
H3: Digestion in the small intestine is due to volumic and surfacic
transformations. Volumic degradation is the enzymatic hydrolysis
of bolus components by pancreatic and exogenous enzymes inside
the bolus while the surfacic one is the degradation by brush border
enzymes on the internal wall of small intestine.
ome additional facts should be pointed out. First the volumic degra-
ation is thought as following a law of mass action (therefore depend-
ng on the concentration of the macromolecules) and since the space
ccupied by insoluble dietary fiber is unavailable for other macro-
olecules, adding insoluble DF enhances the degradation by increas-
ng the concentration of nutrients in the homogeneous part of bolus.
Concerning the water, it has different effects on the degradation:
n one hand, increasing the ratio water/dry matter dilutes the bolus
nd decreases the volumic degradation. Indeed, if [s] denotes the
ubstrate concentration in the bolus (in terms of mass ratio), the
olumic transformation is introduced in [17] for [s] as
d[s]
dt= kvol[s]V(t)
here kvol denotes the degradation rate of the substrate by unit of vol-
me. This reaction being proportional to the mass ratio of concerned
ubstrates, it is clear that additional water decreases the degradation
ate.
On the other hand, water facilitates the contact of the macro-
olecules with the brush border enzymes, enhancing the surfacic
egradation. Indeed, its surfacic transformation in a homogeneous
olus has been represented in [17] as
d[s]
dt= ksurf [s][W]S(t).
In this equation, [W] denotes the whole bolus mass ratio of the
ater and, since S(t) = 2π r(t)� is the area of the cylinder, the product
s]S(t) can be seen as the area occupied by s on the boundary of the
ylinder. Finally ksurf is the degradation rate of this substrate by the
nit of surface. The assumption in this equation is that water enhances
his surfacic degradation through the term [W].
H4: Bolus movement along the small intestine is due to peristaltic
waves. The efficiency of these waves is proportional to the radius
of bolus r(t), and inversely proportional to the distance from the
pylorus x(t).
he following equation, introduced in [17], represents the transport
f the bolus through intestinal lumen
d2x
dt2= τ
(1 − c−1 dx
dt
)c0 + c1r
a + bx− Kvisco
[W]
dx
dt. (1)
The movement of bolus as described by this equation is due to a ho-
ogenized acceleration caused by an average effect of the peristaltic
aves. This averaging effect is described by the constant τ and we re-
er to [16] for a rigorous mathematical justification. This acceleration
s reduced by a viscosity coefficient (Kvisco[W]
), where [W] represents the
ater mass proportion. The term c represents the mean velocity of
eristaltic waves [2].
H5: Water in the bolus which is not held by the macromolecules and di-
etary fiber (through their water holding capacity) is called “avail-
able water”. It decreases the viscosity of the bolus and facilitates
its movement. Due to osmotic type equilibrium, the concentration
of this “available water” tends to reach a fixed ratio.
he “available water” provides the term [W] in the transport equation
bove: it is clear in this equation that increasing “available water”
ecreases the viscosity coefficient and facilitates its motion through
ntestinal lumen. The difference with [17] is that this available water
ill now vary in a more important way because of the exchanges of
ater in the different degradation steps and the absorption.
H6: Dietary fiber modifies the bolus evolution through its WHC by
holding water in its matrix, and therefore changing the volume
of the bolus. Soluble DF increases the viscosity of bolus, thus de-
creases the efficiency of peristaltic waves.
y their WHC, dietary fiber holds a meaningful quantity of water in
he bolus which, of course, is not part of the available water. Since
ietary fiber is not degraded, the volume and the radius of the bolus
end to be higher. The impact of soluble dietary fiber as described in
ection 1 is mainly due to the change of the consistence of the bolus,
y making it more jelly. It implies then the decreases of efficiency of
eristaltic waves.
. Model equations
A general framework for modelling the digestion in the small in-
estine has been presented in [17]. In this section, we describe the
odifications performed to take into account the effects of dietary
ber (see Section 2) (i) on the mechanistic properties of bolus in pres-
nce of soluble DF (ii) on the heterogeneity and on the WHC property
ue to the presence of insoluble DF.
.1. Physiological aspects and bolus composition
Different steps of mechanical and chemical transformations are
etailed below. The composition of the bolus (model variables) and
heir interactions are presented.
• Non degradable substrate And: The quantity And represents the
mass of macromolecules which is not degradable by endogenous
enzymes of the digestive tract.• Non solubilized substrate Ans: The quantity Ans represents the
mass of macromolecules which is not accessible to enzymatic hy-
drolysis. In presence of a sufficient quantity of water, Ans is trans-
formed into As.• Solubilized substrate Adm
s : The quantity Adms is the mass of dry
substrate in solution state. It is called solubilized substrate and it is
assumed that one unit of Adms requires Ws units of water to remain
solubilized. Recalling [H1], Ws represents the required mass of
104 M. Taghipoor et al. / Mathematical Biosciences 258 (2014) 101–112
4
s
s
a
t
m
a
D
r
I
S
d
c
f
o
4
t
o
water to solubilize Adms . This quantity depends on the properties
of each macromolecule. The mass of Ws is assumed to be equal to
the mass of αAdms where α represents the ratio of water associated
with Adms . For simplification purposes, the mix of Adm
s and water is
represented by As .• Intermediate substrate Bdm
int: The quantity Bdm
intis the mass of dry
intermediate substrate obtained from the degradation of As by
volumic transformation [H3]. It represents the intermediate sub-
strate which cannot be absorbed by the intestinal wall before an
additional surfacic degradation. It is solubilized and Wint repre-
sents the required amount of water to maintain solubilization.
The mass of Wint is assumed to be equal to the mass of βBdmint
where β represents the ratio of water associated with Bdmint
. For
Bint = Bdmint
+ Wint , volumic transformation is represented as
As + enzymes → Bint + (Ws − Wint) (Reaction 1)
Depending on the values of Ws and Wint , the amount of Ws − Wint
of water can be released or held in the bolus.• Absorbable nutrients Bdm
abs: The quantity Bdm
absis the mass of dry
absorbable nutrients obtained from surfacic reactions (cf. [H3]).
For Babs = Bdmabs
+ Wabs, the surfacic transformation is defined as
As + enzymes → Babs + (Ws − Wabs) (Reaction 2)
Bint + enzymes → Babs + (Wint − Wabs) (Reaction 3)
Wabs is the required amount of water to maintain solubilization
and its mass is assumed to be equal to γ Bdmabs
where γ represents
the ratio of water associated with the Bdmabs
.
To the best of our knowledge, the values of α, β , γ are not available in
the literature and we make numerical experiments using our model
to describe the obtained behaviors in the different cases α < β < γor α > β > γ or α = β = γ .
• Soluble and insoluble dietary fiber: Fdmsol
and Fdminsol
represent the
dry matter of soluble and non-soluble dietary fiber respectively.
The main property of dietary fiber presented in Section 1 and
hypothesis [H5] is its water holding capacity.
Fsol = Wsol + Fdmsol
Finsol = Winsol + Fdminsol
where the mass of Wsol (Winsol) is assumed to be equal to
λsFdmsol
(λiFdminsol
) for λs and λi which represent the ratio of water as-
sociated with Fdmsol
and Fdminsol
respectively. As described in Section 1,
DF is not degradable by endogenous enzymes of the small intes-
tine.
The following diagram (1) shows the different transformations
inside the bolus.• Dry matter: Total amount of dry matter substrate in the bolus is
therefore
DM = And + Ans + Adms + Bdm
int + Bdmabs + Fdm
sol + Fdminsol.
• Water: The impact of dietary fiber on digestion is closely linked to
their WHC capacity. Though, water evolution in the bolus has to
be described to understand effects of DF on digestion.
The total water Wtot in the bolus comes from three main sources
(i) Wf eed: Water incorporated naturally in feedstuffs (e.g.: 1 g of
wheat contains 12% of water). The amount of Wf eed coming
out of the stomach is assumed to be proportional to the
ingested dry matter DM, Wf eed = Kf eed × DM.
(ii) Wsec: Water included in the endogenous secretions of saliva
and stomach which is also assumed to be proportional to
the ingested dry matter, Wsec = Ksec × DM.
(iii) Wdrink: Drunk water is assumed to be independent to the
quantity of DM.
oTotal water included in the bolus is therefore defined as the sum
of Wf eed, Wsec and Wdrink
Wtot = Wf eed + Wsec + Wdrink. (2)
A first part of this total water is used for the solubilization of
the different macromolecules and nutrients (Ws + Wint + Wabs), a
second part is bound to the fiber (Wsol + Winsol) and the remaining
part is the “available water”, W , as presented in [H5]. The evolution
of W(t) at any time t can be written as
W(t) = Wtot(t)− Ws(t)− Wint(t)− Wabs(t)− Wsol(t)− Winsol(t) .
(3)
While Wsol, Winsol are fixed, Ws, Wint, Wabs vary because of degra-
dation and absorption phenomena. The evolution of available wa-
ter W(t) is mainly due to two causes: the equilibrium related to
osmotic pressure (which can be mostly seen as an absorption phe-
nomena) and the balance of water due to degradation and absorp-
tion of nutrients.
Eq. (2) represents the initial value of Wtot , while Eq. (3) allows
to see its evolution (Wtot(t)) as a function of (i) the variation of
available water W as well as (ii) the water bound to different
types of bolus components, for 0 ≤ t ≤ Tf , where Tf represents the
required time for digestion in the small intestine.• Mass of bolus M: The total mass of bolus, M, is given by M =
DM + Wtot .• Volume of bolus V: To define the bolus volume, as explained in
[H2], the volume of each substrate in solution is assumed to be the
same as the volume filled by water associated with that substrate,
i.e. the volume of As is equal to Ws/ρw, where ρw = 1 is the water
density. The volume of bolus is therefore represented as
V(t) = Wtot(t)
ρw= π r2(t)�.
Since the length of the bolus is assumed to be fixed, the volume
evolution over time leads to compute the radius r(t) of bolus at
each time. Consequently its surface is written as S(t) = 2π r(t)�.
.2. Effects of soluble dietary fiber
As described in Section 2, soluble dietary fiber, because of its jelly
tructure, decreases the efficiency of the contractions caused by peri-
taltic waves [8,6,5], thus increases transit time of bolus. Moreover,
dding these fiber to the bolus composition decreases the degrada-
ion and absorption rate. In order to incorporate these features in the
odelling we introduce the notion of “efficient radius” associated to
notion of “efficient surface”.
efinition 4.1. The efficient radius of bolus is defined as
sol =√
(Wtot − Wsol)
2π�.
n the same way, the efficient surface of bolus is described as
sol = 2π rsol�.
When bolus contains soluble DF then rsol < r. Using both this ra-
ius (rsol) and the associated area (Ssol) in the model equations, de-
reases the acceleration of the bolus and all the surfacic effects. There-
ore this notion allows to describe (at least qualitatively) the effects
f soluble DF.
.3. Effects of insoluble dietary fiber
One of the hypotheses in the first model of digestion in [17] is
he bolus homogeneity. The mass concentration of each component
f the bolus is assumed to be its mass divided by the total mass M
f the bolus. To model the digestion in presence of insoluble DF, new
M. Taghipoor et al. / Mathematical Biosciences 258 (2014) 101–112 105
r
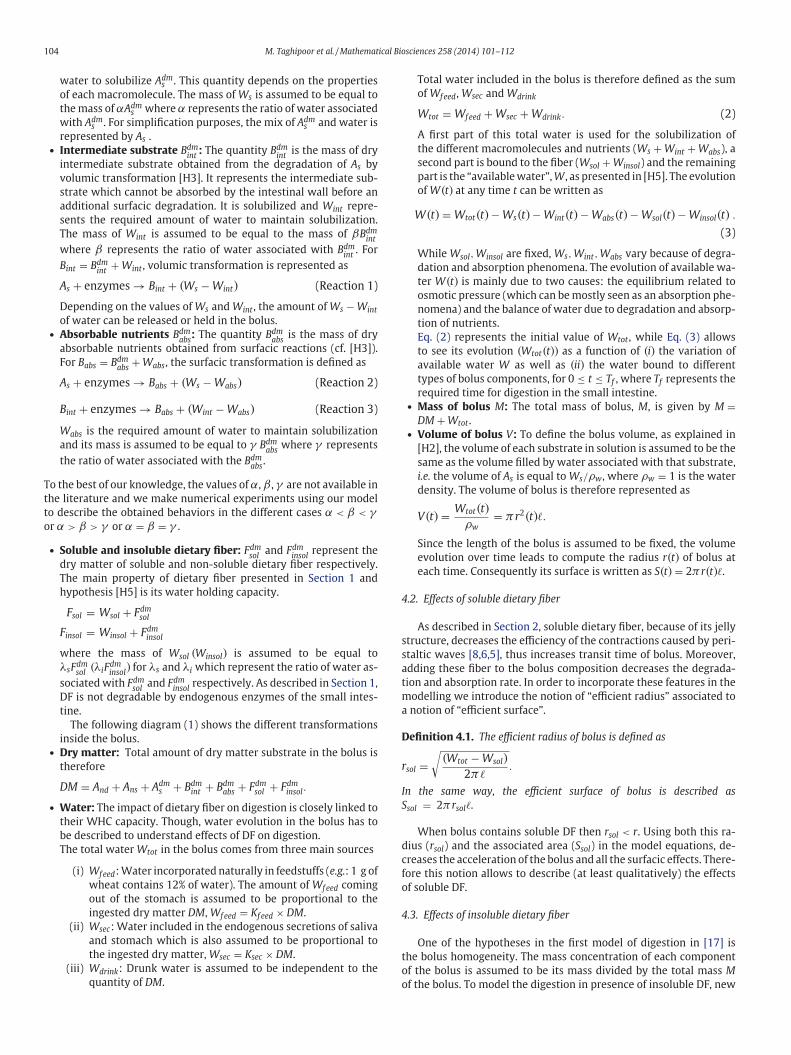
Fig. 2. Conceptual representation of insoluble fiber distribution in the bolus as as-
sumed in the model. The apparent volume Vapp (see Definition 4.3) is the white part of
the cylinder. r is the radius of bolus.
n
[
a
b
t
D
b
[
[
s
i
w
m
r
[
D
a
V
s
4
r
w
v
s
p
i
T
s
a
t
4
i
r
w
f
t
m
d
t
a
e
c
u
fi
d
v
o
T
c
m
A
t
e
A
w
(
F
t
w
p
e
c
T
e
w
4
m
otions are defined because of heterogeneity of bolus as described in
H2]. The volume filled by insoluble DF (the mix of Fdminsol
and Winsol), is
ssumed to be unavailable to the macromolecules of feedstuffs in the
olus. In the digestion model, this hypothesis is taken into account by
he following definition.
efinition 4.2. The apparent concentration of different substrates in the
olus is represented as
Adms ] = Adm
s
M − Finsol
, [Bdmint ] = Bdm
int
M − Finsol
, [Bdmabs] = Bdm
abs
M − Finsol
Ans] = Ans
M − Finsol
, [W] = W
M − Finsol
, [And] = And
M − Finsol
The degradation of macromolecules As and Bint as well as the ab-
orption of the nutrients Babs are affected by WHC property of the
nsoluble DF through this definition. Fig. 2 shows the regions of bolus
hich are filled by insoluble DF and therefore unreachable by the
acromolecules and nutrients.
Integrating the insoluble DF in the bolus changes also the region
eachable to volumic degradation (see Fig. 2). According to hypothesis
H2], Winsol is the volume filled by insoluble fiber.
efinition 4.3. The apparent volume of bolus Vapp is therefore defined
s
app = Wtot − Winsol.
The above considerations are taken into account in the following
teps of digestion described below.
.4. Transport of bolus
The averaged equation of transport of bolus introduced in [16]
eads
d2x(t)
dt2= τ
(1 − c−1 dx(t)
dt
)c0 + c1r(t)
a + bx(t)− Kvisco
[W(t)]
dx
dt,
here τ is the mean effect of the pulses by unit of time, c is mean
elocity of peristaltic waves, and x(t) is the position of bolus in the
mall intestine. The constants a, b, c0, c1 and Kvisco are the model
arameters and might be estimated from biological data [13]. Taking
nto account the properties of dietary fiber, this equation changes to
d2x(t)
dt2= τ
(1 − c−1 dx(t)
dt
)c0 + c1rsol(t)
a + bx(t)− Kvisco
[W(t)]
dx
dt. (4)
he bolus movement described by this equation depends on its po-
ition in the small intestine and on its efficient radius. Moreover, the
cceleration is slowed down by a viscosity term which depends on
he available water.
.5. Volumic transformation
Volumic transformation presented by (Reaction 1) in Section 4.1
s the degradation of Adms due to pancreatic and exogenous enzymes
esulting in production of Bdmint
.
Evolution of Adms by this transformation is represented by
dAdms
dt= −kvol(x)[A
dms ]Vapp
here kvol(x) takes into account the enzymatic activity which is a
unction of bolus position at each time t. Indeed, it has been assumed
hat the endogenous enzymes are in excess in the small intestine lu-
en. The term [Adms ]Vapp describes the dependence of volumic degra-
ation on the concentration of Adms at each unit of apparent volume i.e.
he volume filled by the insoluble DF is not accessible to the enzymes
nd macromolecules.
Consequently, integrating the insoluble fiber in the bolus influ-
nces the volumic transformation by increasing the substrates con-
entration via the Definition 4.2 and by changing the volume and
sing Vapp introduced in Definition 4.3.
As described in Section 4.4, integrating the soluble fiber modi-
es the velocity of bolus along the small intestine and therefore the
istance traveled at each time x(t). Consequently, it influences the
olumic degradation through the function kvol(x(t)).The volumic production of intermediate substrate Bdm
intis the result
f degradation of Adms
dBdmint
dt= kvol(x)[A
dms ]Vapp.
hese reactions take place in a solution and each degraded unit of Adms
auses the release of water Ws = αAdms , which is then partially used to
aintain the produced Bdmint
in a solubilized state through Wint = βBdmint
.
ccording to (Reaction 5), the result of volumic transformation is
he consumption or release of “available water” W . Thereby, volumic
volution of water is represented as
dms + Ws + enzymes → Bdm
int + Wint + (Ws − Wint) (Reaction 5)
dW
dt= k̃vol(x)[A
dms ]Vapp , (5)
here k̃vol = (α − β)kvol.
Soluble fiber can be hydrolyzed by exogenous enzymes eexo
cellulase, hemicellulases, . . . ) ingested by food
sol + eexo → Bint + (Wsol − Wint). (Reaction 4)
Hydrolysis of Fsol by exogenous enzymes follows the same evolu-
ion as the volumic transformation of Adms
dFdmsol
dt= −ks(eexo, x)[Fdm
sol ]Vapp
here [Fdmsol
] = Fsol/(M − Finsol). The function ks(eexo, x) = ks × eexo ×h̃(x) represents the degradation rate of Fsol, which depends on the
xogenous enzyme activity along the small intestine p̃h(x) and the
oncentration of exogenous enzymes.
This reaction produces the intermediate substrate Bdmint
dBdmint
dt= ks(eexo, x)[Fdm
sol ]Vapp.
he amount (Wsol − Wint) is released by (Reaction 4) and modifies the
volution of water
dW
dt= · · · + k̃s(eexo, x)[Fdm
sol ]Vapp (6)
here k̃s = (λs − β)ks(eexo, x).
.6. Surfacic transformation
Surfacic degradation is the last step of transformation of macro-
olecules in the small intestine. The produced nutrients by this
106 M. Taghipoor et al. / Mathematical Biosciences 258 (2014) 101–112
4
c
T
w
w
4
a
t
w
p
d
e
f
T
o
i
t
T
d
5
o
b
d
v
βp
T
c
s
p
p
a
w
a
degradation are then absorbed through intestinal wall. Surfacic degra-
dation depends on the fraction of As on the surface of the bolus rep-
resented by [As]Ssol therefore
dAdms
dt= −ksurf [As][W]Ssol
where ksurf stands for the rate of surfacic degradation of As and the
efficient surface Ssol has been defined by Definition 4.1. Moreover, it is
assumed that the brush-border enzymes are always in excess in the
small intestine. Surfacic degradation of Bdmint
follows the same process
as for Adms . Therefore for [Bint] defined by Definition 4.2, we have
dBdmint
dt= −k̃surf [Bint][W]Ssol.
where ksurf stands for the rate of surfacic degradation of Bint . Evolution
of water in the bolus is influenced by the surfacic degradation, i.e. the
quantity of water consumed (or released) by (Reaction 2). Therefore
the surfacic evolution of water is
dW
dt= · · · + ((β − γ )k̃surf [Bint] + (α − γ )ksurf [As])[W]Ssol. (7)
4.7. The equilibrium between As and Ans
Modifications of feedstuffs in the stomach by the enzymes and
water change most of the Ans into As = Adms + Ws and makes them
accessible to intestinal enzymes.
However, for some feedstuffs, the bolus may contain Ans at the
beginning of small intestine. In this case, the digestion of bolus con-
tains also the transformation of Ans into As. Mixing with bile acid for
lipids and producing the micelles, denaturing for the proteins and
adding water and solubilization for the dry starch are examples of the
transformation of Ans into As in the small intestine.
The solubilization of Ans which takes place in the presence of
enough quantity of W and results in the production of As, is a phe-
nomenon taken into account in the model. Solubilization is reversible
and lack of water may cause production of Ans releasing W in the
bolus.
Thereby, the balance is assumed to be reached when
As = μ([W])Ans
for μ which is an increasing function of [W]. If kequi stands for the rate
of turning back to equilibrium then the dynamical equilibrium may
be defined
dAns
dt= −kequi(μ([W])Ans − As) (8)
and therefore
dAdms
dt= kequi(μ([W])Ans − As).
The variation of water quantity caused by the equilibrium may be
represented as
dW
dt= · · · + αkequi(μ([W])Ans − As). (9)
4.8. Pancreatic and biliary secretions
Pancreatic and biliary secretions consist of a solution of nutrients
and enzymes which does not contain available water W . In fact, water
included in this solution is assumed to be associated with nutrients
and enzymes to keep them solubilized. Modelling details on these
secretions could be seen in [17]. Adding dietary fiber increases the
quantity of pancreatic secretions. However this point is not yet in-
cluded in the model. j
.9. Absorption through intestinal wall
Absorption of nutrients through intestinal wall depends on their
oncentration on the inner surface of intestinal wall
dBdmabs
dt= · · · − kabs[B
dmabs]Ssol
he passage of nutrient through intestinal wall releases the associated
ater, thus
dW
dt= · · · + γ kabs[B
dmabs]Ssol (10)
here kabs represents the rate of absorption through intestinal wall.
.10. Water equilibrium
Water equilibrium was already taken into account in [17]. The
ssumption was that [W] tends to reach a fixed ratio (10%), suggesting
he equation
d[W]
dt= −kw([W] − 0.1) (11)
here [W] = W(t)/M(t), M(t) representing the bolus mass. The su-
erposition of Eqs. (5), (6), (7) and (9)–(11) provides the equation
escribing the evolution of W along the small intestine.
The evolution of bolus mass is represented as
dM
dt= (α + 1)
dAdms
dt+ (β + 1)
dBdmint
dt+ (γ + 1)
dBdmabs
dt
+ (λsol + 1)dFdm
sol
dt+ dAns
dt+ dW
dt,
ach term of the above equation is replaced by its expression, there-
ore we obtain
dM
dt= M
M − W
( − kw(W − 0.1M)− kabs[Bdmabs]Ssol
). (12)
he variation of bolus volume depends on the absorption or secretion
f “available water” and endogenous secretions in the small intestine
.e.
dV
dt= dW
dt, (13)
herefore
dV
dt= −kw(W − 0.1M)+ secretions.
able 9 presents all the equations of the digestion model when adding
ietary fiber.
. Numerical simulations
A thorough examination of the effects of the different parameters
f the model on transport, degradation and absorption is carried out
y Scilab software. In these in silico experiments, the presence of
ietary fiber Fsol and Finsol in the bolus, the variations of the initial
alues of bolus and the sensitivity of the model on the parameters α,
and γ (cf. Section 4.1) are investigated. Tables 6 and 7 show the
arameters’ values used in the numerical simulations of the model.
able 8 shows the default initial conditions, however they have been
hanged to test different compositions of the bolus at the entry of the
mall intestine.
To the best of our knowledge, most of the actual values of the
arameters are unknown, even if the order of magnitude of these
arameters can be guessed. The only well-known facts are the input
nd output characteristic of the bolus and its kinetic. For example,
e have calibrated the parameters of the transport equation so that
standard bolus travels the 17 m from the pylorus till the ileo-caecal
unction in 7 h.
M. Taghipoor et al. / Mathematical Biosciences 258 (2014) 101–112 107
a
t
W
d
5
d
c
s
i
5
d
t
o
t
Table 1
The proportion of absorbed nutrients to DM does not vary significantly for different
scenarios of solubilization in the bolus at the entry of duodenum.
x = 0 End of the small intestine x = 17
Adms × DM−1 (%) Ans × DM−1 (%) Absorbed dry nutrients to DM ratio (%)
0 85 56
42 42 57
85 0 58
r
A
The mass of the bolus (M) at the entry of the small intestine is
ssumed to be fixed in all our following experiments. The bolus at
he entry of the small intestine contains And, Ans, As, Bint , Babs and W .
hen studying the influence of dietary fiber on digestion, the non
egradable substrate And is replaced by Fsol or Finsol.
.1. Influence of dietary fiber on intestinal absorption
As described in Section 1, the positive effect of insoluble DF in
igestion may be due to two main reasons: (i) modification of the
omposition of bolus due to the increase of retention time in the
tomach, (ii) modification of the bolus physical characteristics.
The effects of these two cases on the digestion model are studied
n this section.
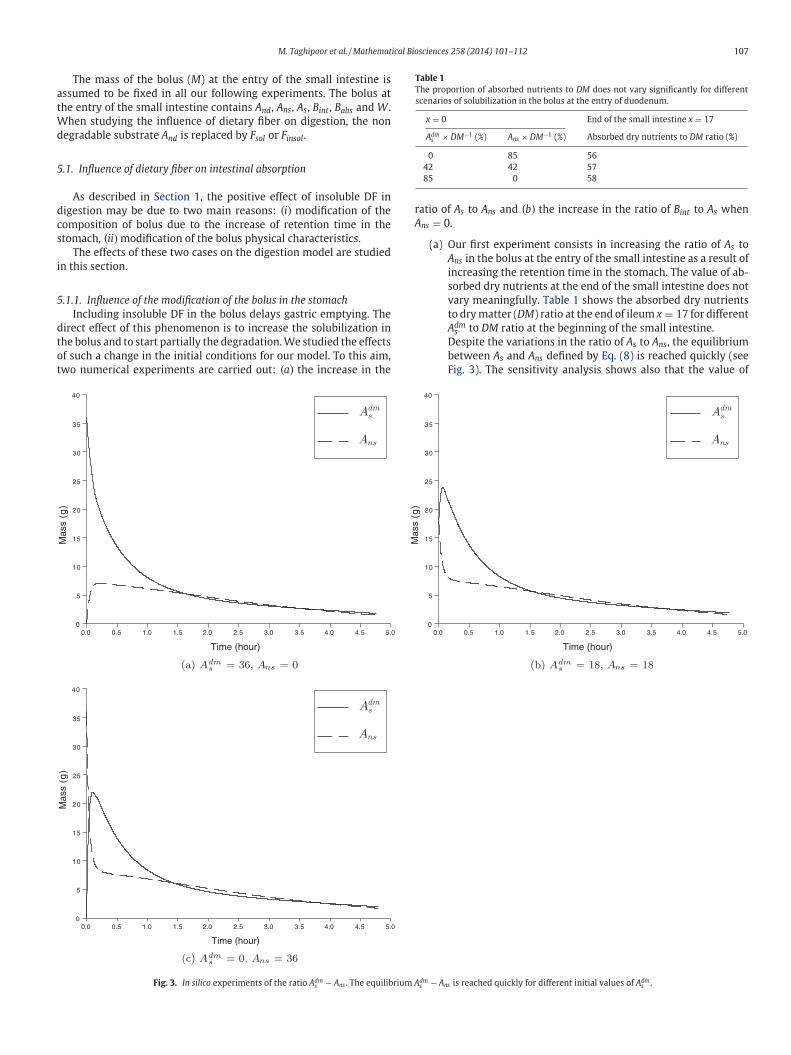
.1.1. Influence of the modification of the bolus in the stomach
Including insoluble DF in the bolus delays gastric emptying. The
irect effect of this phenomenon is to increase the solubilization in
he bolus and to start partially the degradation. We studied the effects
f such a change in the initial conditions for our model. To this aim,
wo numerical experiments are carried out: (a) the increase in the
0
5
10
15
20
25
30
35
40
0.0 0.5 1.0 1.5 2.0 2.5 3.0 3.5 4.0 4.5 5.0
Time (hour)
Mas
s (g
)
(a) Adms = 36, Ans = 0
0
5
10
15
20
25
30
35
40
0.0 0.5 1.0 1.5 2.0 2.5 3.0 3.5 4.0 4.5 5.0
Time (hour)
Mas
s (g
)
(c) Adms = 0, Ans = 36
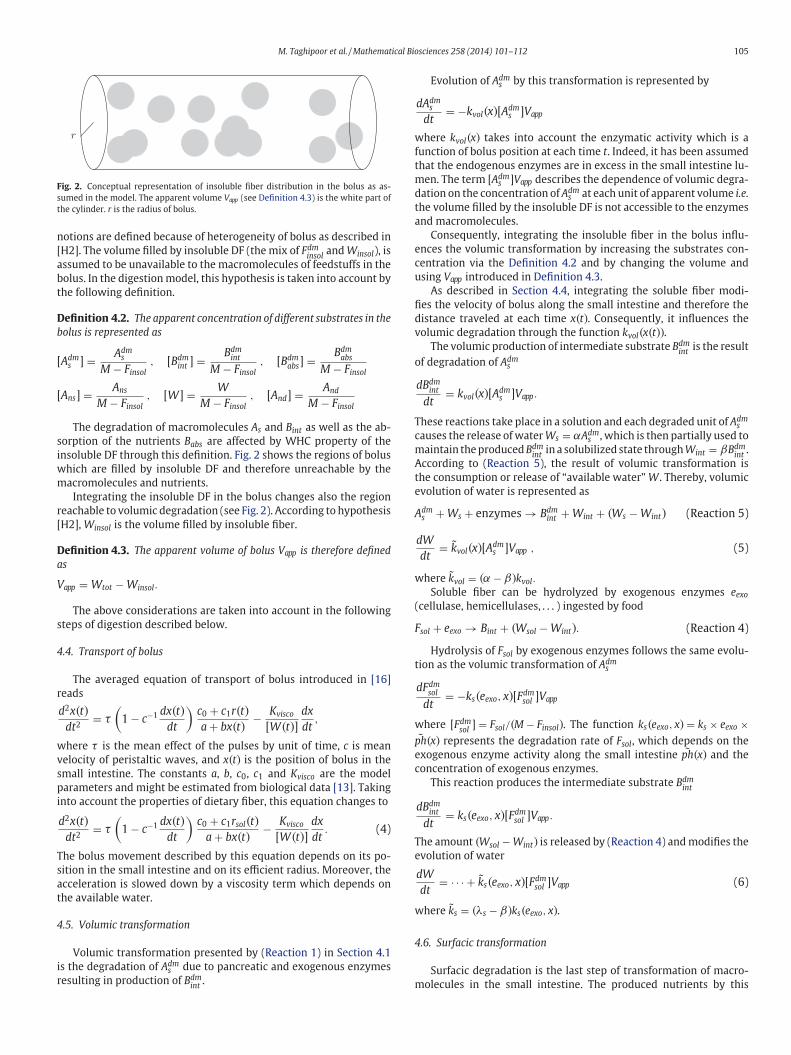
Fig. 3. In silico experiments of the ratio Adms − Ans . The equilibrium A
atio of As to Ans and (b) the increase in the ratio of Bint to As when
ns = 0.
(a) Our first experiment consists in increasing the ratio of As to
Ans in the bolus at the entry of the small intestine as a result of
increasing the retention time in the stomach. The value of ab-
sorbed dry nutrients at the end of the small intestine does not
vary meaningfully. Table 1 shows the absorbed dry nutrients
to dry matter (DM) ratio at the end of ileum x = 17 for different
Adms to DM ratio at the beginning of the small intestine.
Despite the variations in the ratio of As to Ans, the equilibrium
between As and Ans defined by Eq. (8) is reached quickly (see
Fig. 3). The sensitivity analysis shows also that the value of
0
5
10
15
20
25
30
35
40
0.0 0.5 1.0 1.5 2.0 2.5 3.0 3.5 4.0 4.5 5.0
Time (hour)
Mas
s (g
)
(b) Adms = 18, Ans = 18
dms − Ans is reached quickly for different initial values of Adm
s .
108 M. Taghipoor et al. / Mathematical Biosciences 258 (2014) 101–112
Table 2
The relation between the absorbed dry nutrients at the end of digestion and the differ-
ent initial values of Bdmint
.
x = 0 End of the small intestine x = 17
Bdmint
× DM−1 (%) As × DM−1 (%) Absorbed dry nutrients to DM ratio (%)
0 85 57
42 42 61
85 0 64
Table 3
Intestinal transit time for the different quantities of F = Fsol or Finsol in
the bolus at the entry of duodenum
x = 0 Intestinal transit time (h)
F × DM−1 (%) Bolus containing Finsol Bolus containing Fsol
0 5 5
2 4.7 5.4
7 4.3 5.9
11 4 6.5
14 3.9 6.7
Table 4
Transit time and absorbed dry nutrients at the end of the small
intestine depend on the values of α, β and γ .
Absorbed dry
nutrients to
DM ratio (%)
Retention time
in the small
intestine (h)
α = 1, β = 2, γ = 3 45 5.2
α = 2, β = 2, γ = 2 50 4.9
α = 3, β = 2, γ = 1 54 4.6
w
v
i
r
b
t
5
g
i
a
u
B
f
5
i
a
t
o
a
absorbed dry nutrients is almost independent to the variations
in the ratio of As to Ans. However, these results depend on the
choice of equilibrium rate kequi, a small value of kequi means
a small solubilization rate. It will be interesting to study the
sensitivity of the model to the value of kequi.
(b) In the second experiment, the modification in the stomach is
assumed to result in the transformation of all Ans in the bolus
into As and additionally the production of Bint . Variations in
the ratio of As to Bint inside the bolus at the entry of the small
intestine are tested. Table 2 shows the variation of absorbed
dry nutrients at the end of the small intestine.
Numerical results show the increase in absorbed dry nutrients
when the ratio of Bint to As is increased.
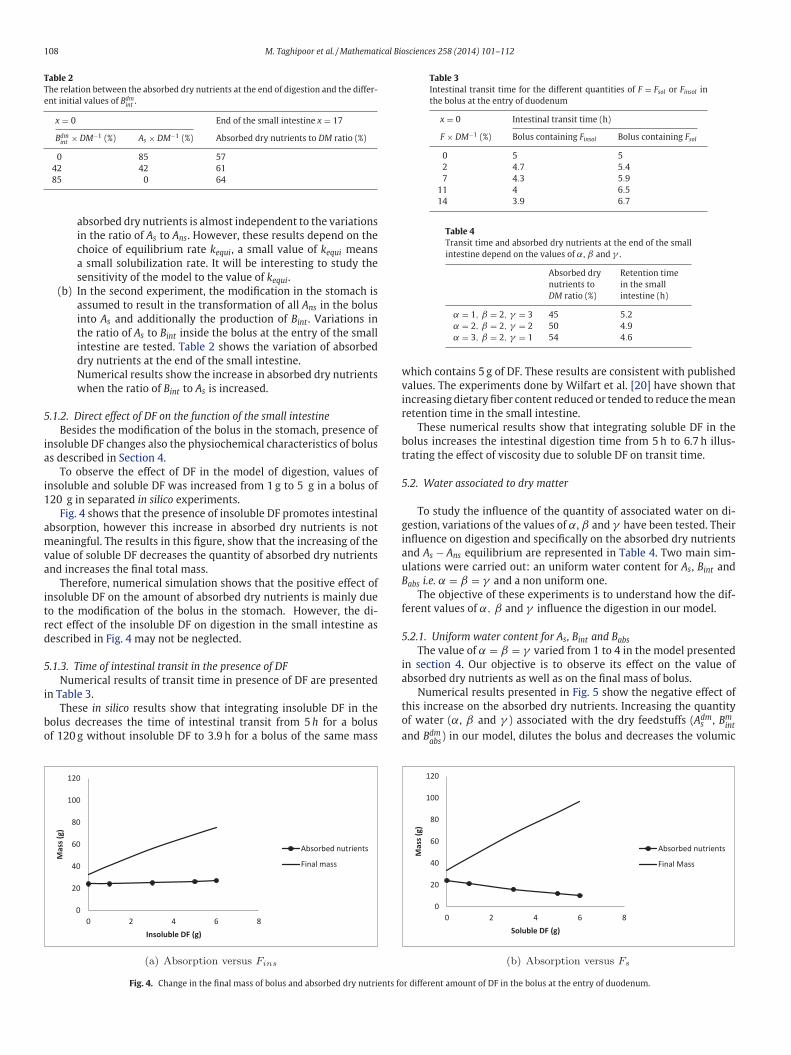
5.1.2. Direct effect of DF on the function of the small intestine
Besides the modification of the bolus in the stomach, presence of
insoluble DF changes also the physiochemical characteristics of bolus
as described in Section 4.
To observe the effect of DF in the model of digestion, values of
insoluble and soluble DF was increased from 1 g to 5 g in a bolus of
120 g in separated in silico experiments.
Fig. 4 shows that the presence of insoluble DF promotes intestinal
absorption, however this increase in absorbed dry nutrients is not
meaningful. The results in this figure, show that the increasing of the
value of soluble DF decreases the quantity of absorbed dry nutrients
and increases the final total mass.
Therefore, numerical simulation shows that the positive effect of
insoluble DF on the amount of absorbed dry nutrients is mainly due
to the modification of the bolus in the stomach. However, the di-
rect effect of the insoluble DF on digestion in the small intestine as
described in Fig. 4 may not be neglected.
5.1.3. Time of intestinal transit in the presence of DF
Numerical results of transit time in presence of DF are presented
in Table 3.
These in silico results show that integrating insoluble DF in the
bolus decreases the time of intestinal transit from 5 h for a bolus
of 120 g without insoluble DF to 3.9 h for a bolus of the same mass
Fig. 4. Change in the final mass of bolus and absorbed dry nutrients fo
hich contains 5 g of DF. These results are consistent with published
alues. The experiments done by Wilfart et al. [20] have shown that
ncreasing dietary fiber content reduced or tended to reduce the mean
etention time in the small intestine.
These numerical results show that integrating soluble DF in the
olus increases the intestinal digestion time from 5 h to 6.7 h illus-
rating the effect of viscosity due to soluble DF on transit time.
.2. Water associated to dry matter
To study the influence of the quantity of associated water on di-
estion, variations of the values of α, β and γ have been tested. Their
nfluence on digestion and specifically on the absorbed dry nutrients
nd As − Ans equilibrium are represented in Table 4. Two main sim-
lations were carried out: an uniform water content for As, Bint and
abs i.e. α = β = γ and a non uniform one.
The objective of these experiments is to understand how the dif-
erent values of α, β and γ influence the digestion in our model.
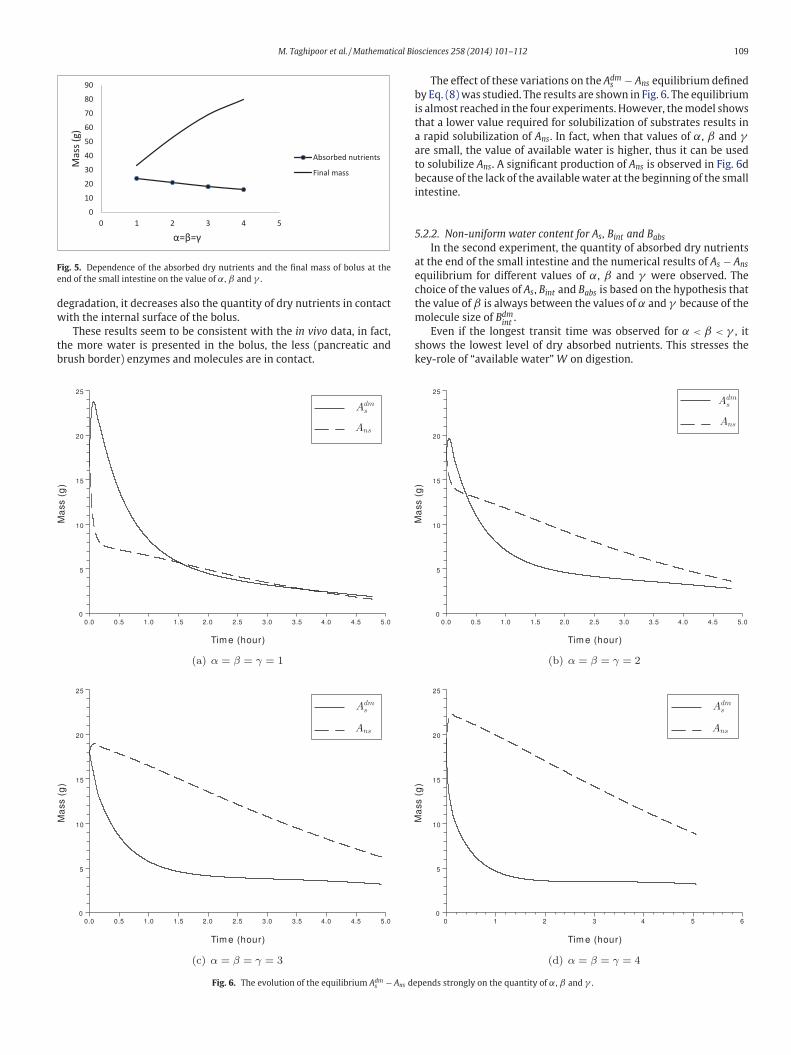
.2.1. Uniform water content for As, Bint and Babs
The value of α = β = γ varied from 1 to 4 in the model presented
n section 4. Our objective is to observe its effect on the value of
bsorbed dry nutrients as well as on the final mass of bolus.
Numerical results presented in Fig. 5 show the negative effect of
his increase on the absorbed dry nutrients. Increasing the quantity
f water (α, β and γ ) associated with the dry feedstuffs (Adms , Bm
int
nd Bdmabs
) in our model, dilutes the bolus and decreases the volumic
r different amount of DF in the bolus at the entry of duodenum.
M. Taghipoor et al. / Mathematical Biosciences 258 (2014) 101–112 109
Fig. 5. Dependence of the absorbed dry nutrients and the final mass of bolus at the
end of the small intestine on the value of α, β and γ .
d
w
t
b
b
i
t
a
a
t
b
i
5
a
e
c
t
m
s
k
egradation, it decreases also the quantity of dry nutrients in contact
ith the internal surface of the bolus.
These results seem to be consistent with the in vivo data, in fact,
he more water is presented in the bolus, the less (pancreatic and
rush border) enzymes and molecules are in contact.
Fig. 6. The evolution of the equilibrium Adms − Ans de
The effect of these variations on the Adms − Ans equilibrium defined
y Eq. (8) was studied. The results are shown in Fig. 6. The equilibrium
s almost reached in the four experiments. However, the model shows
hat a lower value required for solubilization of substrates results in
rapid solubilization of Ans. In fact, when that values of α, β and γre small, the value of available water is higher, thus it can be used
o solubilize Ans. A significant production of Ans is observed in Fig. 6d
ecause of the lack of the available water at the beginning of the small
ntestine.
.2.2. Non-uniform water content for As, Bint and Babs
In the second experiment, the quantity of absorbed dry nutrients
t the end of the small intestine and the numerical results of As − Ans
quilibrium for different values of α, β and γ were observed. The
hoice of the values of As, Bint and Babs is based on the hypothesis that
he value of β is always between the values of α and γ because of the
olecule size of Bdmint
.
Even if the longest transit time was observed for α < β < γ , it
hows the lowest level of dry absorbed nutrients. This stresses the
ey-role of “available water” W on digestion.
pends strongly on the quantity of α, β and γ .

110 M. Taghipoor et al. / Mathematical Biosciences 258 (2014) 101–112
Fig. 7. The equilibrium Adms − Ans for different quantity of α, β and γ .
Table 5
Dependence of absorbed dry nutrients to the water ratio. DM stands for the amount of
dry matter in the bolus at the entry of bolus.
Amount of water
at x = 0 inside
bolus (%)
Ratio of absorbed
dry nutrients at
x = 17 (%)
Mass of Absorbed
dry nutrients (g)
Transit
time (h)
50 50 25 5.7
60 35 26 5.2
66 28 27 4.5
a
i
v
n
d
t
(
6
i
n
r
e
f
t
p
i
i
p
v
i
d
g
b
t
d
b
c
t
w
l
s
o
s
t
o
As − Ans equilibrium is observed in two cases:
(i) Firstly, it was assumed that α > β > γ . There is a little pro-
duction of Ans from As (desolubilization) because of the lack
of water at the entry of the small intestine followed by the
degradation of As.
(ii) Secondly, it was assumed that α < β < γ . There is a rapid sol-
ubilization of Ans followed by degradation of As into Bint . The
released water by degradation of As is not sufficient to main-
tain the solution state of Bint since α < β . The required water is
provided by the transformation of As into Ans as it can be seen
in Fig. 7.
5.3. The variation of the water ratio inside the bolus
We are interested by the change in the ratio of water inside the
bolus and its influence on the absorption in the small intestine. For
the sake of simplicity, it was assumed that Wf eed = Wsec = 0.
In order to study this effect, the value of dry matter in the bolus is
assumed to be fixed at 42 g while the value of water increases in each
experiment.
In the numerical simulations, the ratio of water included in the
bolus represented 55%, 60% and 66% of bolus. The ratio of absorbed
dry nutrients to the total absorption (water and nutrients) is collected.
Results are presented in Table 5.
The numerical results of Table 5 shows that increasing the value
of water in the bolus decreases the ratio of absorbed dry nutrient to the
total absorbed matter (water + dry nutrients), even though the value of
absorbed dry nutrients increases.
In fact, in our model, at the end of each experiment the value
of Wt is approximately 55% of the total mass of bolus and this
equilibrium is achieved almost quickly (because of the choice of kw).
Therefore, increasing the value of water in this model does not have
meaningful effect on the final absorption and the slight increase
n the absorbed mass of dry nutrients is due to the change of the
olume of bolus in each experiment which promotes the access of
utrients to intestinal wall for absorption, although this increase
ilutes the bolus and decreases the volumic degradation. Here again,
his is the direct result the choice of the parameters (rate of surfacic
ksurf ) and volumic (kvol) degradation).
. Discussion
This work deepened the modelling of the digestion in the small
ntestine started in [17]. The objective was to obtain a more mecha-
istic model of digestion process by including new phenomena and
evisiting the others: DM and water are considered separately, water
volution is influenced by the degradation of other molecules, the ef-
ects of DF on the digestion are taken into account which is a first step
oward a non-homogeneous model with different types of feedstuffs.
The advantages and the drawbacks of this model as well as the
erspectives are outlined below.
One of the main characteristics of this model remains its gener-
city. The main generic phenomena of digestion have been explicitly
ncluded in the model while the ones which required the specific
roperties of feedstuffs’ molecules (effects on gastric emptying, on
iscosity, . . . etc.) have been ignored or implicitly taken into account
n the model parameters. On the one hand, the different steps of
egradation, the effects of physical characteristic of bolus on its di-
estion, the interaction between DF and feedstuffs molecules have
een considered. Moreover, some other phenomena like the separa-
ion between the enzyme activities of different feedstuffs’ molecules,
ependence of the enzyme activity with respect to the dilution of
olus, the different substrates density, the impact of DF on initial
ondition have been ignored.
To our point of view, a more realistic model was obtained by in-
egrating these new phenomena. Specifically, WHC of dietary fiber
hich in turn interferes the digestion of other feedstuffs molecules,
eads us to introduce the separation between DM and water and con-
ider all the impacts of water on digestion dynamic.
However, some other phenomena are still ignored either because
f the lack of information concerning their effects or because of their
upposed limited impact on digestion at this integrated scale. In-
eractions between different categories of feedstuffs and definition
f specific enzyme activity for different bolus contents would be a
M. Taghipoor et al. / Mathematical Biosciences 258 (2014) 101–112 111
Table 6
Parameters used for
transport parameters.
Notion Value
kvisco 28
a 2.72
b 1.23
c0 0.01
c1 25
c 7.2
τ 300
Table 7
The parameters used for
degradation equations.
Notion Value
kvol 20
ksurf 10
k̃surf 10
kabs 3500
ke log(4/3)
ks 20
kw 0.5
kequi 3
α 3
β 2
γ 1
λsol 4
λinsol 6
kf eed 0.4
kdrink 2
ksec 0.4
� 0.1
Table 8
Initial conditions.
Notion Value
x0 0
v0 15
z0 0.1
Adms 6
Bdmint
0
Bdmabs
0
Ans 31
And 0
Fsol 0
Finsol 0
v
m
o
(
h
t
s
l
o
w
t
c
i
o
c
e
b
d
Table 9
System of equations for model of digestion in presence of dietary fiber. The
secretion terms are described in [17]. In this new version of the model, the
water associated to each dry matter contained in pancreatic secretions should
be taken into account in the water equation (8).
1. d2 xdt2 = τ
(1 − c−1 dx
dt
) c0+c1 rsol
a+bx− Kvisco
[W]dxdt
2. dAns
dt= −kequi
(μ([W])Ans − As
)3.
dFdmsol
dt= −kseexop̃h(x)[Fdm
sol]Vapp
4.dAdm
s
dt= −kvol(x)[A
dms ]Vapp − ksurf [As][W]Ssol + kequi
(μ([W])Ans − As
)+ secretions
5.dBdm
int
dt= kvol(t)[A
dms ]Vapp + kseexop̃h(x)[Fdm
sol]Vapp − k̃surf [Bint][W]Ssol
+ secretions
6.dBdm
abs
dt= (k̃surf [Bint] + ksurf [As])[W]Ssol − kabs[Bdm
abs]Ssol
7. deexo
dt= −keeexo
8. dWdt
= −αkequi
(μ([W])Ans − As
) + (α − β)kvol(t)[Adms ]Vapp
+ [W]((β − γ )k̃surf [Bint] + (α − γ )ksurf [As])
+ (λs − β)kseexop̃h(x)[Fdmsol
]Vapp + γ kabs[Bdmabs
]Ssol − kw(W − 0.1M)
11. dMdt
= MM−W
( − kw(W − 0.1M)− kabs[Bdmabs
]Ssol + secretions)
12. dVdt
= −kw(W − 0.1M)+ secretions
o
s
o
p
g
fi
p
e
w
D
l
p
s
o
fi
u
a
c
o
(
fi
(
o
t
t
e
e
n
a
a
A
t
m
b
d
f
I
ery interesting improvement step of the future development of the
odel.
Modelling the influence of soluble and insoluble DF on degradation
f other feedstuffs’ molecules as well as on the movement of bolus
Experiment 5.1) is the first attempt to model a more realistic non-
omogeneous bolus. DF has normally a high WHC which increases
he volume of aqueous phase in the bolus and therefore dilutes the
olution of nutrients and enzymes [12], known to influence the vo-
umic and surfacic reactions. However, these effects depend highly
n the choice of Wsol and Winsol. Another aspect of the model is the
ater equilibrium and its impact on absorption, depending again on
he choice of parameters (Was, Wint and Wabs) which play a signifi-
ant role on the final results of digestion and should be supported by
n vivo or in vitro experiments. Experiments 5.3 stresses the role of
ther parameters (kw, kequi, ksurf , kvol). Water absorption rate kw, can
hange (even dramatically) the numerical results. The model param-
ters are listed in Tables 6–8.
In the present paper, the objective is to reproduce the dynamic
ehavior of the bolus in the presence of dietary fiber rather than to
eal with its final composition. Therefore, our choice was to focus
n the understanding of each phenomenon and its mathematical de-
cription rather than on the precise effect of the parameters’ values
n the final results. To perform the numerical simulations, model
arameters have been chosen in order to roughly fit known observed
lobal behaviors, such as the transit duration or an approximate ef-
ciency of digestion obtained from the literature and/or by the ex-
ertise of biologists. This choice of parameters allows to observe the
volution of each substrate in time which is consistent qualitatively
ith the observed biological results (positive influence of insoluble
F on digestion, negative effect of soluble DF, . . . ).
To have a more predictive model, the next step would be to ana-
yze the impact of each parameter (as well as the interaction between
arameters) on the final results using a method based on decompo-
ition of variance to perform a global sensitivity analysis [15] and to
rganize these parameters in a hierarchy according to their impact on
nal results. Then one can identify the model influential parameters
sing an adequate mathematical optimization method.
One of the advantages of this model is its capacity to be reduced
nd to be adapted to new experiments enabling parameters identifi-
ation. Reduction consists in the decreasing the number of equations
f system or the number of parameters without affecting its genericity
e.g. a bolus which does not contain the DF, results in a more simpli-
ed digestion process which in turn caused decreasing the equations
parameters) involved in the digestion model).
It is also worth pointing that values of most parameters depend
n the category of considered feedstuffs. The close collaborations be-
ween biologists and mathematicians is therefore required to iden-
ify these new parameters (literature data in biology, define new
xperiments, . . . ). This highlights one of the main interest of mod-
lling which is to ask the precise questions about the modeled phe-
omenon by crossing contrasted points of view. In fact, this approach
llows to use efficiently the existing data and to find new research
reas.
cknowledgments
The multidisciplinary collaboration on this research project be-
ween the INRA Center of Nouzilly and the Laboratoire de Mathé-
atiques et Physique Théorique was initiated within and supported
y the CaSciModOT program (CAlcul SCIentifique et MODélisation
es universités d’Orléans et de Tours) which is now a Cluster of the
rench Region Centre. This collaboration also takes place in a CNRS-
NRA PEPS program “Compréhension et Modélisation du devenir de
112 M. Taghipoor et al. / Mathematical Biosciences 258 (2014) 101–112
[
[
[
[
[
[
[
[
[
l’aliment dans le tube digestif“. This work is part of the PhD thesis of
Masoomeh Taghipoor, financed by CNRS and INRA.
The author wish to warmly thank the anonymous referees for their
very careful readings of the article, for their numerous interesting
remarks and questions which lead to a meaningful improvement of
the paper.
References
[1] J.W. Anderson, P. Baird, R.H. Davis, S. Ferreri, M. Knudtson, A. Koraym, V. Waters,C.L. Williams, Health benefits of dietary fiber, Nutr. Rev. 67(4) (2009) 188–205.
[2] L. Bueno, J. Fioramonti, Y. Ruckebusch, Mechanism of propulsion in the smallintestine, Ann. Rech. Vet. 8 (1977) 293–301.
[3] M. Burkhalter, N.R. Merchen, L.L. Bauer, S.M. Murray, A.R. Patil, J.L. Brent, G.C.Fahey, The ratio of insoluble to soluble fiber components in soybean hulls affects
ileal and total-tract nutrient digestibilities and fecal characteristics of dogs, J. Nutr.
131(7) (2001) 1978–1985.[4] M. Choct, Enzyme supplementation of poultry diets based on viscous cereals,
M.R. Bedford, G.G. Partridge (eds.), 2001, Farm Animal Nutrition, 145–160, CABInternational.
[5] D.J. Jenkins, T.M. Wolever, A.R. Leeds, M.A. Gassull, P. Haisman, J. Dilawari, D.V.Goff, G.L. Metz, K.G. Alberti, Dietary fibres, fibre analogues, and glucose tolerance:
importance of viscosity, Br. Med. J. 1(6124) (1978) 1392–1394.
[6] M. Eastwood, The physiological effect of dietary fiber – an update, Annu. Rev.Nutr. 12 (1992) 19–35
[7] K.E.B. Knudsen, The nutritional significance of dietary fiber analysis, Anim. FeedSci. Technol. 90(1–2) (2001) 3–20.
[8] FAO and Report of the Joint FAO/WHO Expert Consultation, Carbohydrates inhuman nutrition, FAO Food and Nutrition, 1998
[9] E. Jiménez-Moreno, J.M. Gonzàlez-Alvarado, R. Làzaro, G. Mateos Effects of typeof cereal, heat processing of the cereal, and fiber inclusion in the diet on gizzard
pH and nutrient utilization in broilers at different ages, Poult. Sci. 88(9) (2009)1925–1933.
[10] B.M. Clearly, L. Prasky, Advanced Dietary Fibre Technology, Wiley-Blackwell, 1stedition, 2001.
11] M. Rezaei, M.A. Karimi Torshizi, Y. Rouzbehan, The influence of different levels ofmicronized insoluble fiber on broiler performance and litter moisture, Poult. Sci.
90(9) (2011) 2008–2012.
12] B.O. Schneeman. Dietary fiber and gastrointestinal function, Nutr. Res. 18(4)(1998) 625–632.
13] J. Rivest, J.F. Bernier, C. Pomar, A dynamic model of protein digestion in the smallintestine of pigs, J. Anim. Sci. 78 2000 328–340.
14] M. Siljeström, E. Westerlund, I. Björck, J. Holm, N.-G. Asp, O. Theander, The effectsof various thermal processes on dietary fiber and starch content of whole grain
wheat and white flour, J. Cereal Sci. 4(4) (1986) 315–323.
15] A. Saltelli, K. Chan, E.M. Scott (eds.) Sensitivity Analysis, Wiley Series in Probabilityand Statistics. John Wiley & Sons, Ltd. 2009.
16] M. Taghipoor, G. Barles, C. Georgelin, J.R. Licois, P. Lescoat, (2013) Mathematicalhomogenization in the modelling of digestion in the small intestine, Maths Action,
6 (1) p. 1–19.17] M. Taghipoor, G. Barles, C. Georgelin, J.R. Licois, P. Lescoat. Mathematical mod-
elling of transport and degradation of feedstuffs in the small intestine. J. Theor.
Biol. 294 (2011) 114–121.18] A. Tharakan. Modelling of physical and chemical processes in the small intestine
(PhD thesis), University of Birmingham, 2009.19] C. Wenk. The role of dietary fibre in the digestive physiology of the pig, Anim.
Feed Sci. Technol. 90(1-2) (2001) 21–33.[20] A. Wilfart, L. Montagne, H. Simmins, J. Noblet, J. van Milgen. Digesta transit in
different segments of the gastrointestinal tract of pigs as affected by insoluble
fibre supplied by wheat bran, Br. J. Nutr. 98(1) (2007) 54–62.


![Optical Fiber Communicationfiber.hardfree.net/2011/open_data/fiber_edu.pdf · 2011-01-20 · 2 1. 광통신의개요 광통신[ Optical Fiber Communication ]이란? ☞기존의금속심선을이용한유선통신이나주파수를이용한무선통신과는달리광섬유케이블[](https://img.pdfslide.fr/doc/110x75/5f0333cf7e708231d4080b25/optical-fiber-2011-01-20-2-1-eeoe-e-optical-fiber-communication.jpg)