Embed Size (px)
Citation preview
PHYSICAL REVIEW B 68, 035312 ~2003!
Direct comparison of recombination dynamics in cubic and hexagonal GaNÕAlN quantum dots
J. Simon,1,2 N. T. Pelekanos,2 C. Adelmann,1 E. Martinez-Guerrero,1 R. Andre,1 B. Daudin,1 Le Si Dang,1 and H. Mariette11CEA-CNRS Joint Group Nanophysique et Semiconducteurs, De´partement de Recherche Fondamentale sur la Matie`re Condense´e,
CEA Grenoble, 17 rue des Martyrs, 38054 Grenoble Cedex 9, Franceand Laboratoire Spectrome´trie Physique (CNRS UMR5588), Universite´ J. Fourier, Grenoble I, BP 87,
38402 Saint Martin d’He`res Cedex, France2Microelectronics Research Group, FORTH/IESL, P.O. Box 1527, 71110 Heraklion, Greece
~Received 9 July 2002; revised manuscript received 28 January 2003; published 14 July 2003!
We report on time-integrated and -resolved photoluminescence~PL! data on self-assembled GaN quantumdots ~QD’s! embedded in AlN, in both cubic@zinc-blende~ZB!# and hexagonal@wurtzite ~Wz!# crystallo-graphic phases. The comparison of the optical properties of ZB and Wz nitride QD’s allows us to distinguishpure dimensionality effects from the influence of the large polarization-induced electric fields present in the Wznanostructures. Specifically, the PL energy of the ZB QD’s is always higher than the bulk cubic GaN band-gapenergy, in contrast to the Wz QD’s where a 7-MV/cm polarization field gives rise to below-gap PL emission forsufficiently large QD’s. As a further consequence of the internal field, the low-temperature PL decay times ofthe Wz QD’s are significantly longer than the ZB ones, and increase strongly with the QD height in contrast tothe ZB ones, which exhibit only a small size dependence. For both types of QD’s, the PL intensity is found tobe weakly dependent on temperature, underscoring the strong zero-dimensional exciton localization in theGaN/AlN system. In spite of the strong localization, however, we show that the nonradiative channels cannotbe neglected and have a significant contribution in the PL decay time for both ZB and Wz QD’s.
DOI: 10.1103/PhysRevB.68.035312 PACS number~s!: 78.67.Hc, 78.55.Cr, 78.47.1p
hn’sNhellsmit
dyl-th,chgr
igtom
ionngzas,th
i
lyb
er-’smntec. II.lesareZB-
y of
tu-be
D’s
i-ki-aliveion°C
ski-alin
sngaN
on
I. INTRODUCTION
Wurtzite ~Wz! InGaN/GaN quantum wells~QW’s! havebeen extensively studied for their use in blue and green ligemitting devices.1,2 More recently, a lot of effort has beededicated also to the optical study of Wz GaN/AlGaN QWAside from their potential use in UV laser diodes, the GaAlGaN system is, in principle, well suited to investigate tgeneric optical properties of nitride QW’s, since the weconsist of a binary compound and are free of the local coposition fluctuations present in InGaN QW’s. However,was found that two effects dominate the recombinationnamics of Wz GaN/AlGaN QW’s and raise serious difficuties for understanding their properties. The first one ispresence of very large polarization-induced electric fields3–8
of the order of MV/cm, perpendicular to the QW plane. Sufields separate spatially the electrons and holes leadinreduced wave-function overlap and increased radiativecombination times. As an example, in a GaN/Al0.24Ga0.76Nheterostructure the polarization field was found to be as has 1.3 MV/cm,8 a value which cannot be ascribed merelypiezoelectric effects, but rather is the outcome of the cobined action of piezoelectric and spontaneous polarizatin the structure. The second limiting effect is the varyifrom sample-to-sample degree of in-plane exciton localition due to QW width and polarization field fluctuationwhich can overshadow the intrinsic effects that governrecombination dynamics in GaN QW’s.
In this work, we compare systematically the photolumnescence~PL! and time-resolved photoluminescence~TRPL!properties of cubic@zinc-blende~ZB!# and hexagonal~Wz!GaN/AlN quantum dots~QD’s!. Studying QD’s instead ofQW’s allows us to deal at all temperatures with stronglocalized excitons, rather than a thermodynamic balance
0163-1829/2003/68~3!/035312~7!/$20.00 68 0353
t-
./
-
-
e
toe-
h
-s
-
e
-
e-
tween free and localized excitons in the QW case. Furthmore, comparing the optical properties of ZB and Wz QDallows the deconvolution of pure dimensionality effects frothe influence of the giant 7-MV/cm polarization field presein the Wz QD’s.9 The paper is organized as follows: thsamples and the experimental setup are described in SeThe PL results on several ZB and Wz GaN/AlN QD sampare discussed in Sec. III. In Sec. IV, we report and compthe low-temperature TRPL results obtained on Wz andGaN/AlN QD’s. The dynamic behavior as a function of temperature is presented for both phases in Sec. V. A summarthe main results and conclusions is reported in Sec. VI.
II. SAMPLES AND EXPERIMENT
It is well known that even though nitrides are grown narally in the Wz phase, under certain conditions, they caninduced to grow also in the ZB phase.10 The QD samplesdiscussed here are multiple period self-assembled GaN Qon AlN, grown by molecular-beam epitaxy on~100!SiC/Sisubstrates for the ZB phase and onc-axis GaN/Al2O3 for theWz one. The growth was monitoredin situ using reflectionhigh-energy electron diffraction, which allows to control ether the formation of two-dimensional layers or the StransKrastanow transition for the formation of QD’s. The metfluxes were provided by standard effusion cells, while actnitrogen was derived from the radio-frequency dissociatof N2 using a plasma cell. The samples were grown at 700and at stochiometry conditions proper to induce the StranKrastanow transition.9 The QD’s studied here have a typicheight of 30 Å with a diameter-to-height aspect ratio of 5the Wz case,11 and of 10 in the ZB case.12 The QD density isa few times 1011 cm22.13 More specifically, the two samplestudied in detail in TRPL spectroscopy have the followicharacteristics: the Wz sample consists of 72 periods of GQD’s separated by 100-Å-thick AlN spacer layers, grown
©2003 The American Physical Society12-1
p-/n
Å
ar2Hithn
s,thnuion
itya
ina
ire
ei
thakis
te
hi,
otu
ieo-
eldonlys a
s istheehechs.ci-ec-b-e
heZBedesheor
onBitatehed-ri-
eneenm’s.pi-
bedon-
do
ed
olsars
J. SIMONet al. PHYSICAL REVIEW B 68, 035312 ~2003!
a 0.5-mm-thick AlN buffer layer deposited directly on a saphire substrate. The ZB sample was grown on a 3C-SiCpseudosubstrate, covered by a 500-Å AlN buffer layer, afollowed by ten periods of GaN QD’s separated by 100-thick AlN layers.
The TRPL experiments were performed in a standstreak camera setup having an instrument response ofand the excitation source was 1-ps pulses with a 76-Mrepetition rate of a frequency-tripled Ti-sapphire laser wlx5266 nm. Using this setup we were able to extract lodecay times~2–10 ns! by fitting the acquired decay curvetaking into account corrections related to contributions tostreak signal from more than one linear region of the sisoidal high voltage. The average power density of excitatwas 10 W/cm2, for which the generated per pulse excitodensity is two orders-of-magnitude below the QD denstherefore, we can safely assume in our analysis that wedealing with single-exciton recombination and that screeneffects in the Wz QD’s are negligible. It should be noted ththe energy of excitation (Ex54.67 eV) is below the AlNenergy gap and, hence, the GaN QD’s were pumped by dabsorption in the QD excited states.
III. PHOTOLUMINESCENCE EXPERIMENTS
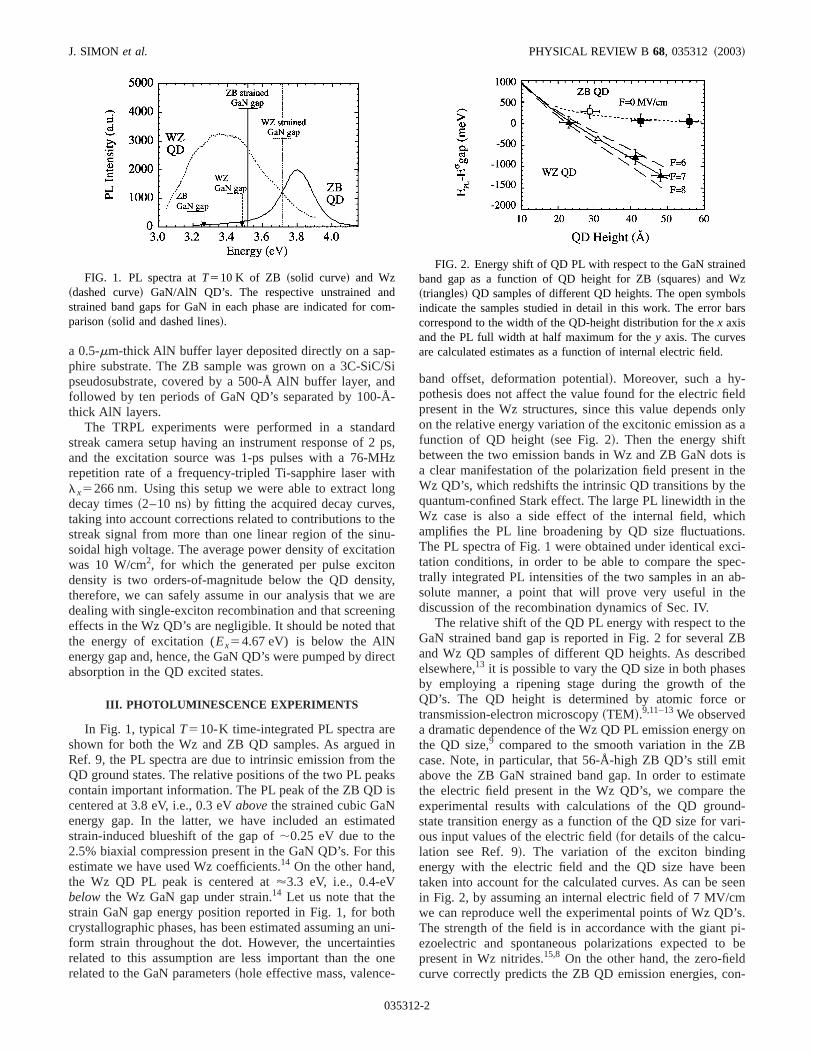
In Fig. 1, typicalT510-K time-integrated PL spectra arshown for both the Wz and ZB QD samples. As arguedRef. 9, the PL spectra are due to intrinsic emission fromQD ground states. The relative positions of the two PL pecontain important information. The PL peak of the ZB QDcentered at 3.8 eV, i.e., 0.3 eVabovethe strained cubic GaNenergy gap. In the latter, we have included an estimastrain-induced blueshift of the gap of;0.25 eV due to the2.5% biaxial compression present in the GaN QD’s. For testimate we have used Wz coefficients.14 On the other handthe Wz QD PL peak is centered at'3.3 eV, i.e., 0.4-eVbelow the Wz GaN gap under strain.14 Let us note that thestrain GaN gap energy position reported in Fig. 1, for bcrystallographic phases, has been estimated assuming anform strain throughout the dot. However, the uncertaintrelated to this assumption are less important than therelated to the GaN parameters~hole effective mass, valence
FIG. 1. PL spectra atT510 K of ZB ~solid curve! and Wz~dashed curve! GaN/AlN QD’s. The respective unstrained anstrained band gaps for GaN in each phase are indicated for cparison~solid and dashed lines!.
03531
Sid-
dps,z
g
e-n
,regt
ct
nes
d
s
hni-
sne
band offset, deformation potential!. Moreover, such a hy-pothesis does not affect the value found for the electric fipresent in the Wz structures, since this value dependson the relative energy variation of the excitonic emission afunction of QD height~see Fig. 2!. Then the energy shiftbetween the two emission bands in Wz and ZB GaN dota clear manifestation of the polarization field present inWz QD’s, which redshifts the intrinsic QD transitions by thquantum-confined Stark effect. The large PL linewidth in tWz case is also a side effect of the internal field, whiamplifies the PL line broadening by QD size fluctuationThe PL spectra of Fig. 1 were obtained under identical extation conditions, in order to be able to compare the sptrally integrated PL intensities of the two samples in an asolute manner, a point that will prove very useful in thdiscussion of the recombination dynamics of Sec. IV.
The relative shift of the QD PL energy with respect to tGaN strained band gap is reported in Fig. 2 for severaland Wz QD samples of different QD heights. As describelsewhere,13 it is possible to vary the QD size in both phasby employing a ripening stage during the growth of tQD’s. The QD height is determined by atomic forcetransmission-electron microscopy~TEM!.9,11–13We observeda dramatic dependence of the Wz QD PL emission energythe QD size,9 compared to the smooth variation in the Zcase. Note, in particular, that 56-Å-high ZB QD’s still emabove the ZB GaN strained band gap. In order to estimthe electric field present in the Wz QD’s, we compare texperimental results with calculations of the QD grounstate transition energy as a function of the QD size for vaous input values of the electric field~for details of the calcu-lation see Ref. 9!. The variation of the exciton bindingenergy with the electric field and the QD size have betaken into account for the calculated curves. As can be sin Fig. 2, by assuming an internal electric field of 7 MV/cwe can reproduce well the experimental points of Wz QDThe strength of the field is in accordance with the giantezoelectric and spontaneous polarizations expected topresent in Wz nitrides.15,8 On the other hand, the zero-fielcurve correctly predicts the ZB QD emission energies, c
m-
FIG. 2. Energy shift of QD PL with respect to the GaN strainband gap as a function of QD height for ZB~squares! and Wz~triangles! QD samples of different QD heights. The open symbindicate the samples studied in detail in this work. The error bcorrespond to the width of the QD-height distribution for thex axisand the PL full width at half maximum for they axis. The curvesare calculated estimates as a function of internal electric field.
2-2
in. 2QoD
Lna
’siW
de
nerÅ.
a
ve
efor
’s
-it
the
r
n
not
-. 1iso
y
c
DIRECT COMPARISON OF RECOMBINATION DYNAMICS . . . PHYSICAL REVIEW B 68, 035312 ~2003!
firming the absence of any internal field in the ZB QD’sagreement with symmetry arguments. Knowing from Figthe exact dependence of the PL emission energy on theheight for both phases, we can associate every spectral cponent of the PL spectra of Fig. 1 with a corresponding Qheight.
IV. LOW-TEMPERATURE TRPL EXPERIMENTS
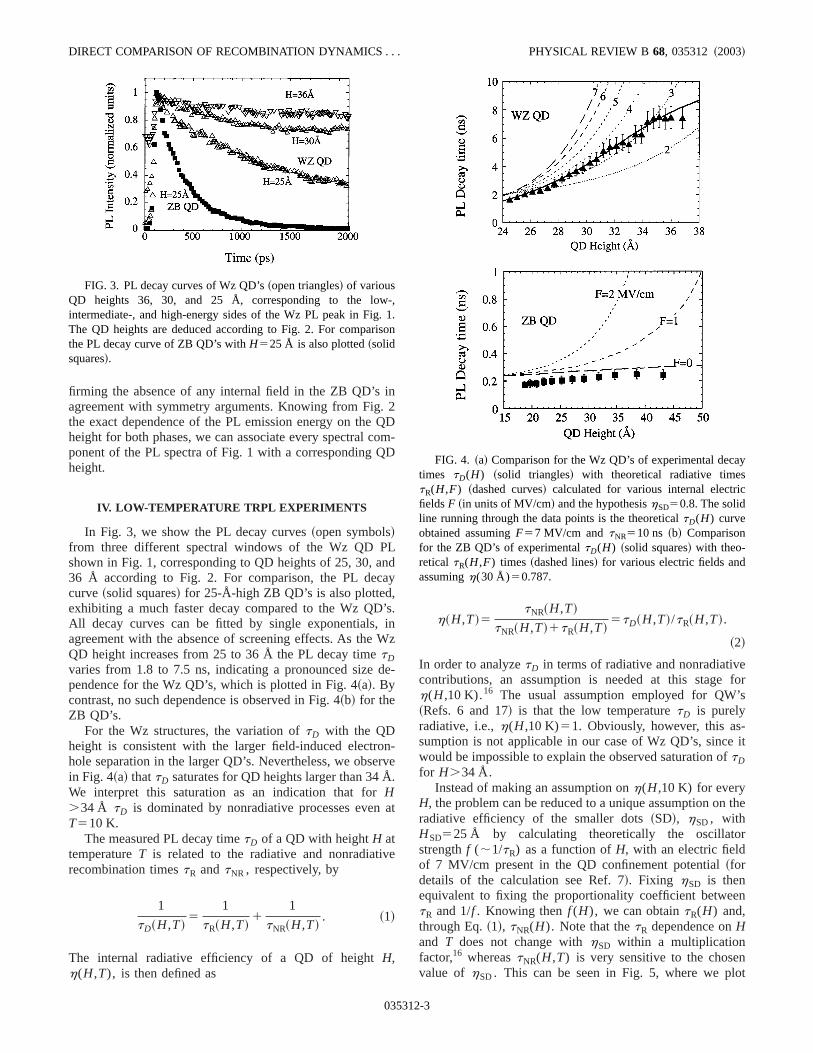
In Fig. 3, we show the PL decay curves~open symbols!from three different spectral windows of the Wz QD Pshown in Fig. 1, corresponding to QD heights of 25, 30, a36 Å according to Fig. 2. For comparison, the PL deccurve~solid squares! for 25-Å-high ZB QD’s is also plotted,exhibiting a much faster decay compared to the Wz QDAll decay curves can be fitted by single exponentials,agreement with the absence of screening effects. As theQD height increases from 25 to 36 Å the PL decay timetDvaries from 1.8 to 7.5 ns, indicating a pronounced sizependence for the Wz QD’s, which is plotted in Fig. 4~a!. Bycontrast, no such dependence is observed in Fig. 4~b! for theZB QD’s.
For the Wz structures, the variation oftD with the QDheight is consistent with the larger field-induced electrohole separation in the larger QD’s. Nevertheless, we obsin Fig. 4~a! thattD saturates for QD heights larger than 34We interpret this saturation as an indication that forH.34 Å tD is dominated by nonradiative processes evenT510 K.
The measured PL decay timetD of a QD with heightH attemperatureT is related to the radiative and nonradiatirecombination timestR andtNR, respectively, by
1
tD~H,T!5
1
tR~H,T!1
1
tNR~H,T!. ~1!
The internal radiative efficiency of a QD of heightH,h(H,T), is then defined as
FIG. 3. PL decay curves of Wz QD’s~open triangles! of variousQD heights 36, 30, and 25 Å, corresponding to the lowintermediate-, and high-energy sides of the Wz PL peak in FigThe QD heights are deduced according to Fig. 2. For comparthe PL decay curve of ZB QD’s withH525 Å is also plotted~solidsquares!.
03531
Dm-
dy
.n
z
-
-ve
t
h~H,T!5tNR~H,T!
tNR~H,T!1tR~H,T!5tD~H,T!/tR~H,T!.
~2!
In order to analyzetD in terms of radiative and nonradiativcontributions, an assumption is needed at this stageh(H,10 K).16 The usual assumption employed for QW~Refs. 6 and 17! is that the low temperaturetD is purelyradiative, i.e.,h(H,10 K)51. Obviously, however, this assumption is not applicable in our case of Wz QD’s, sincewould be impossible to explain the observed saturation oftDfor H.34 Å.
Instead of making an assumption onh(H,10 K) for everyH, the problem can be reduced to a unique assumption onradiative efficiency of the smaller dots~SD!, hSD, withHSD525 Å by calculating theoretically the oscillatostrengthf (;1/tR) as a function ofH, with an electric fieldof 7 MV/cm present in the QD confinement potential~fordetails of the calculation see Ref. 7!. Fixing hSD is thenequivalent to fixing the proportionality coefficient betweetR and 1/f . Knowing thenf (H), we can obtaintR(H) and,through Eq.~1!, tNR(H). Note that thetR dependence onHand T does not change withhSD within a multiplicationfactor,16 whereastNR(H,T) is very sensitive to the chosevalue of hSD. This can be seen in Fig. 5, where we pl
,.n
FIG. 4. ~a! Comparison for the Wz QD’s of experimental decatimes tD(H) ~solid triangles! with theoretical radiative timestR(H,F) ~dashed curves! calculated for various internal electrifieldsF ~in units of MV/cm! and the hypothesishSD50.8. The solidline running through the data points is the theoreticaltD(H) curveobtained assumingF57 MV/cm and tNR510 ns ~b! Comparisonfor the ZB QD’s of experimentaltD(H) ~solid squares! with theo-retical tR(H,F) times ~dashed lines! for various electric fields andassumingh(30 Å)50.787.
2-3
s,in
lletio
nthar
the-
e
ofth
gn-e
at
meswee-e
er-
ithita-dci-e
nce
g.
r
J. SIMONet al. PHYSICAL REVIEW B 68, 035312 ~2003!
tNR(H) for different values ofhSD andF57 MV/cm: tNR
is found to decrease withH whenhSD.0.8, and to increasewhenhSD,0.8. A TEM study has shown that the Wz QD’though free of misfit dislocations, nucleate next to threadedge dislocations of the AlN matrix,18 which may be one ofthe main sources of nonradiative recombination. SmaQD’s are expected to have larger wave-function penetrain the AlN and therefore shortertNR. Hence, we concludefrom Fig. 5 thathSD"0.8. On the other hand, this size depedence oftNR should be rather moderate based on the factdue to the very large internal field in the QD’s the carrierssqueezed at the opposite GaN/AlN heterointerfaces,19 wherethey face approximately the same triangular potential inQD-height range with no significant variation in the wavfunction tail. In what follows, we assume thathSD50.8,which corresponds to the simplest situation for whichtNR isindependent ofH and equal to;10 ns. This assumptionallows us to analyze the experimentaltD as a function of QDheight @Fig. 4~a!#.
The dashed lines in Fig. 4~a! representtR obtained fromcalculations off for various values of electric field with thassumptionhSD50.8. First of all, we note that thetR curvesfail to reproduce the experimentaltD , whatever the fieldvalue in the GaN QD, which confirms the contributionnonradiative channels even at low temperature. On the ohand, the solid curve running through the experimentaltDpoints is obtained by Eq.~1! assumingtNR510 ns is inde-pendent ofH, andtR(H) is the dashed curve correspondinto a 7-MV/cm field in the QD, in agreement with the coclusions of Fig. 2. Clearly, the solid curve reproduces wthe experimental points, including the saturation oftD forthe larger dots. In Fig. 6~a! we plot for the Wz QD’s~tri-angles! h(H,10 K) as a function ofH, deduced by dividingthe experimentaltD(H) by the tR(H) curve for 7 MV/cm.We observe a drastic reduction ofh from 0.8 for the smallerdots (H525 Å) to 0.25 for the larger ones (H536 Å). Thisstrong decrease reflects the strong reduction of oscillstrength due to the electric field.
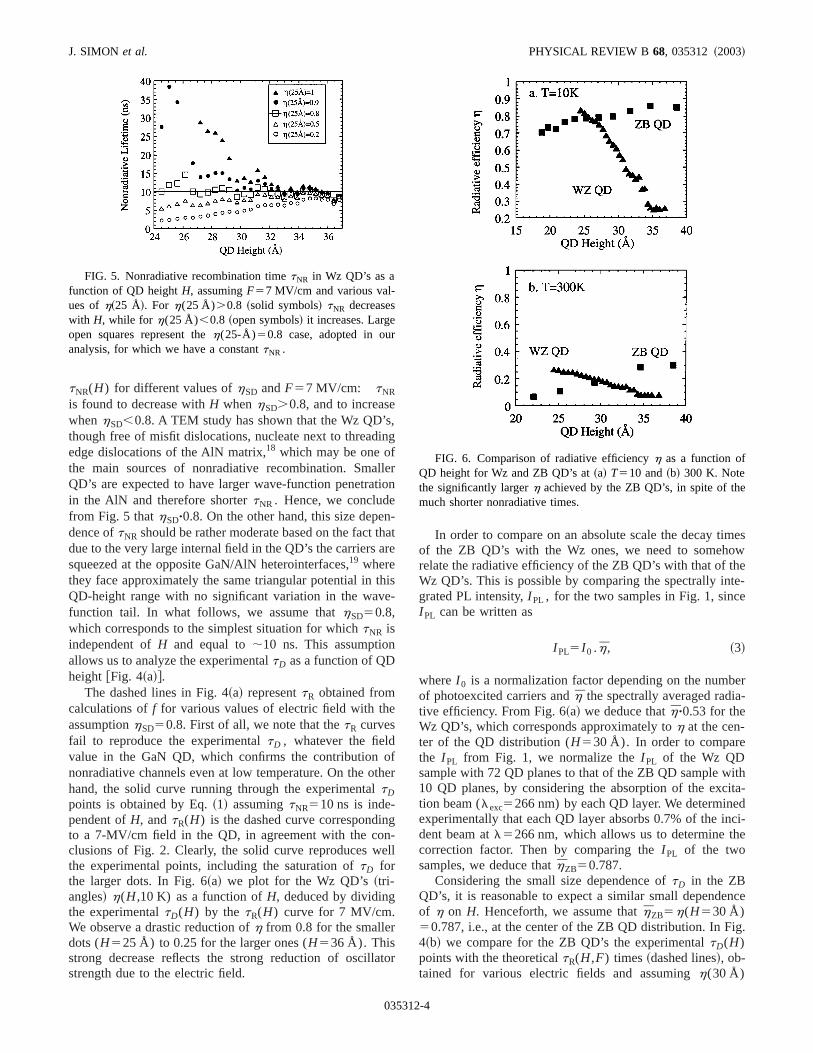
FIG. 5. Nonradiative recombination timetNR in Wz QD’s as afunction of QD heightH, assumingF57 MV/cm and various val-ues ofh~25 Å!. For h(25 Å).0.8 ~solid symbols! tNR decreaseswith H, while for h(25 Å),0.8 ~open symbols! it increases. Largeopen squares represent theh(25-Å)50.8 case, adopted in ouanalysis, for which we have a constanttNR .
03531
g
rn
-ate
is
er
ll
or
In order to compare on an absolute scale the decay tiof the ZB QD’s with the Wz ones, we need to somehorelate the radiative efficiency of the ZB QD’s with that of thWz QD’s. This is possible by comparing the spectrally intgrated PL intensity,I PL , for the two samples in Fig. 1, sincI PL can be written as
I PL5I 0 .h, ~3!
whereI 0 is a normalization factor depending on the numbof photoexcited carriers andh the spectrally averaged radiative efficiency. From Fig. 6~a! we deduce thath"0.53 for theWz QD’s, which corresponds approximately toh at the cen-ter of the QD distribution (H530 Å). In order to comparethe I PL from Fig. 1, we normalize theI PL of the Wz QDsample with 72 QD planes to that of the ZB QD sample w10 QD planes, by considering the absorption of the exction beam (lexc5266 nm) by each QD layer. We determineexperimentally that each QD layer absorbs 0.7% of the indent beam atl5266 nm, which allows us to determine thcorrection factor. Then by comparing theI PL of the twosamples, we deduce thathZB50.787.
Considering the small size dependence oftD in the ZBQD’s, it is reasonable to expect a similar small dependeof h on H. Henceforth, we assume thathZB5h(H530 Å)50.787, i.e., at the center of the ZB QD distribution. In Fi4~b! we compare for the ZB QD’s the experimentaltD(H)points with the theoreticaltR(H,F) times~dashed lines!, ob-tained for various electric fields and assumingh(30 Å)
FIG. 6. Comparison of radiative efficiencyh as a function ofQD height for Wz and ZB QD’s at~a! T510 and~b! 300 K. Notethe significantly largerh achieved by the ZB QD’s, in spite of themuch shorter nonradiative times.
2-4
th
in
o
bth
ca
-d
s
naoo
al
in
3
-Å-
nes ofW
rs of
hiersheris
veer,
toits
m
ty
-
0%
DIRECT COMPARISON OF RECOMBINATION DYNAMICS . . . PHYSICAL REVIEW B 68, 035312 ~2003!
50.787. Clearly, only the zero-field curve can reproducesmall size dependence oftD for the ZB QD’s, as expected.
Knowing tD andtR we can deducetNR, which is foundto be "0.8 ns for the ZB QD’s and almost independent ofH.Its absolute value is about ten times lower than the oneferred for the Wz QD’s. This difference intNR between thetwo types of QD’s can be attributed to the larger densitydefects in the ZB samples~see below!. Finally, we determineh(H,10 K) for the ZB QD’s, which is reported in Fig. 6~a!.Contrary to Wz QD’s,hZB increases withH from 0.7 to 0.86asH varies from 20 to 35 Å. Such a different behavior canaccounted for by the absence of any polarization field incase of ZB QD’s.
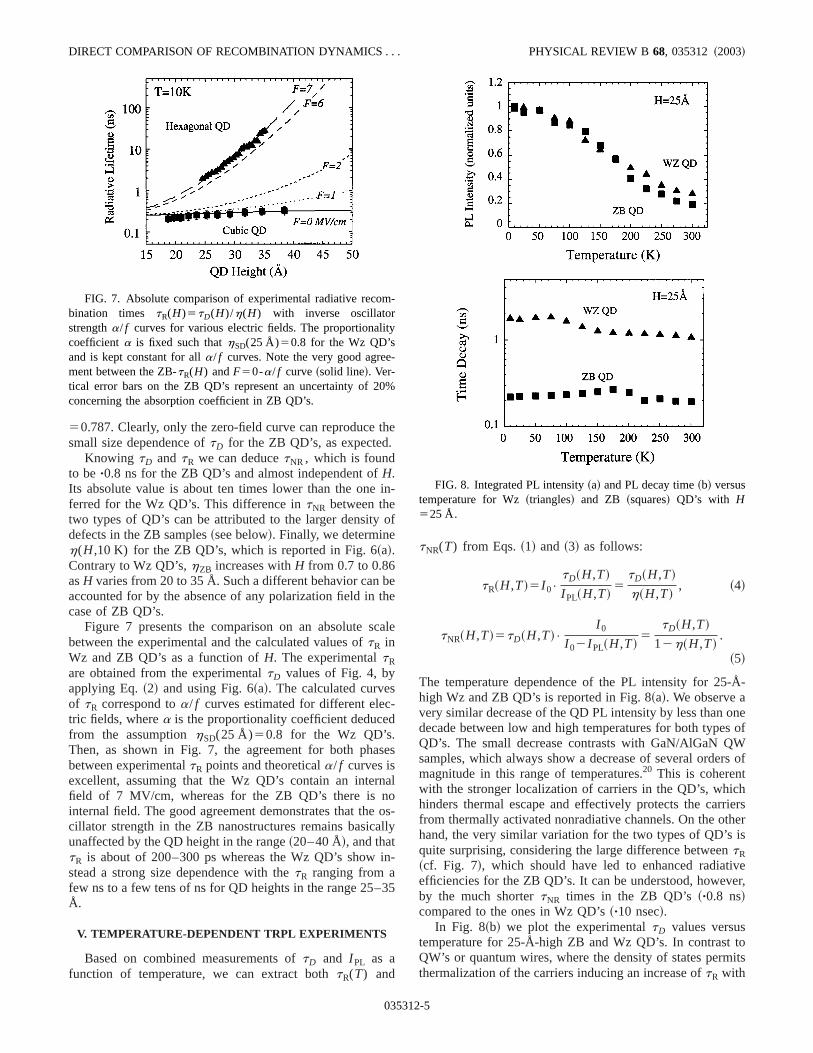
Figure 7 presents the comparison on an absolute sbetween the experimental and the calculated values oftR inWz and ZB QD’s as a function ofH. The experimentaltRare obtained from the experimentaltD values of Fig. 4, byapplying Eq.~2! and using Fig. 6~a!. The calculated curvesof tR correspond toa/ f curves estimated for different electric fields, wherea is the proportionality coefficient deducefrom the assumptionhSD(25 Å)50.8 for the Wz QD’s.Then, as shown in Fig. 7, the agreement for both phabetween experimentaltR points and theoreticala/ f curves isexcellent, assuming that the Wz QD’s contain an interfield of 7 MV/cm, whereas for the ZB QD’s there is ninternal field. The good agreement demonstrates that thecillator strength in the ZB nanostructures remains basicunaffected by the QD height in the range~20–40 Å!, and thattR is about of 200–300 ps whereas the Wz QD’s showstead a strong size dependence with thetR ranging from afew ns to a few tens of ns for QD heights in the range 25–Å.
V. TEMPERATURE-DEPENDENT TRPL EXPERIMENTS
Based on combined measurements oftD and I PL as afunction of temperature, we can extract bothtR(T) and
FIG. 7. Absolute comparison of experimental radiative recobination times tR(H)5tD(H)/h(H) with inverse oscillatorstrengtha/ f curves for various electric fields. The proportionalicoefficienta is fixed such thathSD(25 Å)50.8 for the Wz QD’sand is kept constant for alla/ f curves. Note the very good agreement between the ZB-tR(H) andF50-a/ f curve~solid line!. Ver-tical error bars on the ZB QD’s represent an uncertainty of 2concerning the absorption coefficient in ZB QD’s.
03531
e
-
f
ee
le
es
l
s-ly
-
5
tNR(T) from Eqs.~1! and ~3! as follows:
tR~H,T!5I 0•tD~H,T!
I PL~H,T!5
tD~H,T!
h~H,T!, ~4!
tNR~H,T!5tD~H,T!•I 0
I 02I PL~H,T!5
tD~H,T!
12h~H,T!.
~5!
The temperature dependence of the PL intensity for 25high Wz and ZB QD’s is reported in Fig. 8~a!. We observe avery similar decrease of the QD PL intensity by less than odecade between low and high temperatures for both typeQD’s. The small decrease contrasts with GaN/AlGaN Qsamples, which always show a decrease of several ordemagnitude in this range of temperatures.20 This is coherentwith the stronger localization of carriers in the QD’s, whichinders thermal escape and effectively protects the carrfrom thermally activated nonradiative channels. On the othand, the very similar variation for the two types of QD’squite surprising, considering the large difference betweentR~cf. Fig. 7!, which should have led to enhanced radiatiefficiencies for the ZB QD’s. It can be understood, howevby the much shortertNR times in the ZB QD’s~"0.8 ns!compared to the ones in Wz QD’s~"10 nsec!.
In Fig. 8~b! we plot the experimentaltD values versustemperature for 25-Å-high ZB and Wz QD’s. In contrastQW’s or quantum wires, where the density of states permthermalization of the carriers inducing an increase oftR with
-
FIG. 8. Integrated PL intensity~a! and PL decay time~b! versustemperature for Wz~triangles! and ZB ~squares! QD’s with H525 Å.
2-5
ocilean-
-
ta
gem
thngea-
tu
ul
b
ects
ear
ture,y an
itiveve-
ra-
byuldthe
tworstne,Å.
adn-
oma’s,ffect
ra-
cy
eringe ofntno-in
ic
eenOurlo-y-
on-reble
th
J. SIMONet al. PHYSICAL REVIEW B 68, 035312 ~2003!
temperature,21–24 the discrete density of states in the caseQD’s forbids any temperature-induced variation of the oslator strength.25 Hence, provided that radiative processdominate in the PL decay, we do not expect any significtemperature variation oftD in our QD’s, in qualitative agreement with Fig. 3~b!.
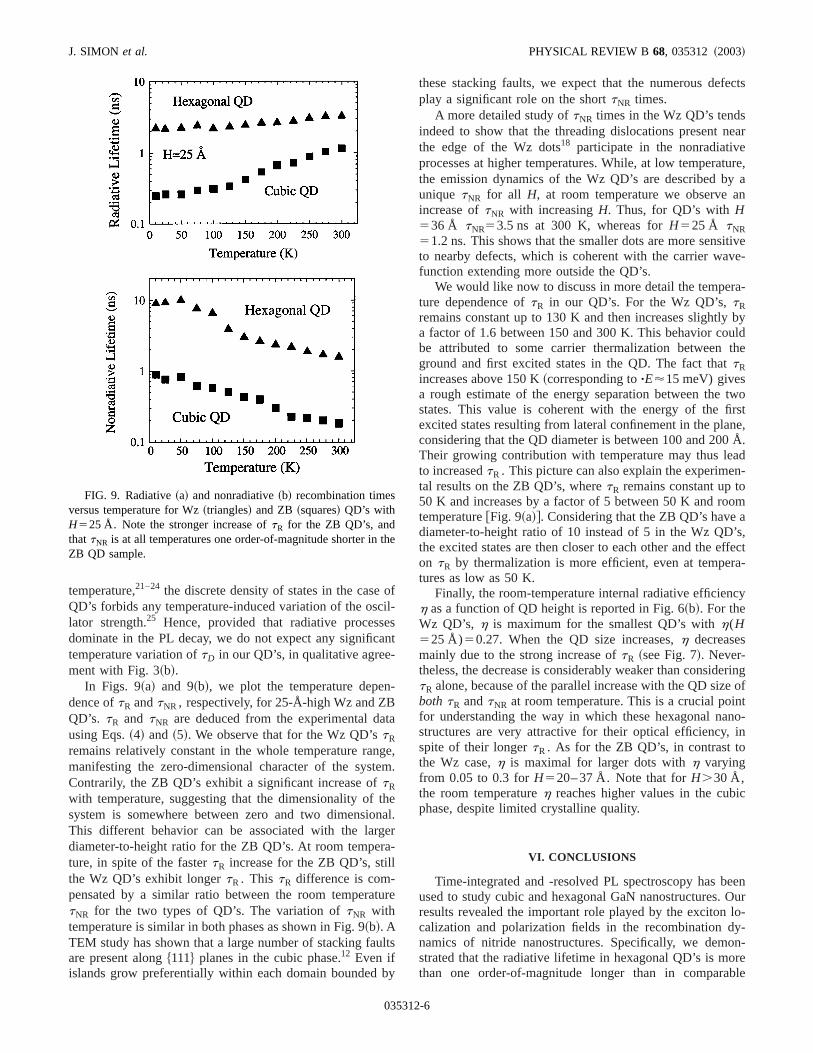
In Figs. 9~a! and 9~b!, we plot the temperature dependence oftR andtNR, respectively, for 25-Å-high Wz and ZBQD’s. tR and tNR are deduced from the experimental dausing Eqs.~4! and ~5!. We observe that for the Wz QD’stR
remains relatively constant in the whole temperature ranmanifesting the zero-dimensional character of the systContrarily, the ZB QD’s exhibit a significant increase oftR
with temperature, suggesting that the dimensionality ofsystem is somewhere between zero and two dimensioThis different behavior can be associated with the lardiameter-to-height ratio for the ZB QD’s. At room temperture, in spite of the fastertR increase for the ZB QD’s, stillthe Wz QD’s exhibit longertR. This tR difference is com-pensated by a similar ratio between the room temperatNR for the two types of QD’s. The variation oftNR withtemperature is similar in both phases as shown in Fig. 9~b!. ATEM study has shown that a large number of stacking faare present along$111% planes in the cubic phase.12 Even ifislands grow preferentially within each domain bounded
FIG. 9. Radiative~a! and nonradiative~b! recombination timesversus temperature for Wz~triangles! and ZB ~squares! QD’s withH525 Å. Note the stronger increase oftR for the ZB QD’s, andthattNR is at all temperatures one order-of-magnitude shorter inZB QD sample.
03531
f-st
e,.
eal.r
re
ts
y
these stacking faults, we expect that the numerous defplay a significant role on the shorttNR times.
A more detailed study oftNR times in the Wz QD’s tendsindeed to show that the threading dislocations present nthe edge of the Wz dots18 participate in the nonradiativeprocesses at higher temperatures. While, at low temperathe emission dynamics of the Wz QD’s are described bunique tNR for all H, at room temperature we observe aincrease oftNR with increasingH. Thus, for QD’s withH536 Å tNR53.5 ns at 300 K, whereas forH525 Å tNR51.2 ns. This shows that the smaller dots are more sensto nearby defects, which is coherent with the carrier wafunction extending more outside the QD’s.
We would like now to discuss in more detail the tempeture dependence oftR in our QD’s. For the Wz QD’s,tRremains constant up to 130 K and then increases slightlya factor of 1.6 between 150 and 300 K. This behavior cobe attributed to some carrier thermalization betweenground and first excited states in the QD. The fact thattRincreases above 150 K~corresponding to"E'15 meV) givesa rough estimate of the energy separation between thestates. This value is coherent with the energy of the fiexcited states resulting from lateral confinement in the placonsidering that the QD diameter is between 100 and 200Their growing contribution with temperature may thus leto increasedtR. This picture can also explain the experimetal results on the ZB QD’s, wheretR remains constant up to50 K and increases by a factor of 5 between 50 K and rotemperature@Fig. 9~a!#. Considering that the ZB QD’s havediameter-to-height ratio of 10 instead of 5 in the Wz QDthe excited states are then closer to each other and the eon tR by thermalization is more efficient, even at tempetures as low as 50 K.
Finally, the room-temperature internal radiative efficienh as a function of QD height is reported in Fig. 6~b!. For theWz QD’s, h is maximum for the smallest QD’s withh(H525 Å)50.27. When the QD size increases,h decreasesmainly due to the strong increase oftR ~see Fig. 7!. Never-theless, the decrease is considerably weaker than considtR alone, because of the parallel increase with the QD sizboth tR andtNR at room temperature. This is a crucial poifor understanding the way in which these hexagonal nastructures are very attractive for their optical efficiency,spite of their longertR. As for the ZB QD’s, in contrast tothe Wz case,h is maximal for larger dots withh varyingfrom 0.05 to 0.3 forH520– 37 Å. Note that forH.30 Å,the room temperatureh reaches higher values in the cubphase, despite limited crystalline quality.
VI. CONCLUSIONS
Time-integrated and -resolved PL spectroscopy has bused to study cubic and hexagonal GaN nanostructures.results revealed the important role played by the excitoncalization and polarization fields in the recombination dnamics of nitride nanostructures. Specifically, we demstrated that the radiative lifetime in hexagonal QD’s is mothan one order-of-magnitude longer than in compara
e
2-6
eeratceive
stue-
’s,cu-
DIRECT COMPARISON OF RECOMBINATION DYNAMICS . . . PHYSICAL REVIEW B 68, 035312 ~2003!
cubic QD’s, a fact unambiguously related to the presencthe internal polarization fields in hexagonal QD’s. Furthmore, we observed a strong size dependence of the radidecay times in the hexagonal QD’s, also as a consequenthe strong polarization field. We showed that nonradiatprocesses should be taken into account even at low temp
a,ar
pp
.
le
-
.
R
v.d
N
. Tte
03531
of-iveof
era-
tures (T510 K), and that in hexagonal QD’s they are at leaone order-of-magnitude less efficient than in cubic QD’s dto superior crystalline quality. In spite of this, we found comparable radiative efficiencies in the two types of QDmainly because of the much faster radiative times in thebic phase.
E.J.pl.
.
,
G.
u-tus
C.
un.
har-ci.
1S. Nakamura, M. Senoh, S.-I. Nagahama, N. Isawa, T. YamadMatsuhita, Y. Sugimoto, and H. Kiyoku, Jpn. J. Appl. Phys., P2 36, L1059 ~1997!.
2S. Nakamura, M. Senoh, N. Isawa, and S.-I. Nagahama, APhys. Lett.67, 1868~1996!.
3M. Smith, J. Y. Lin, H. X. Jiang, A. Salvador, A. Botchkarev, WKim, and H. Morkoc, Appl. Phys. Lett.69, 2453~1996!.
4J. S. Im, H. Kollmer, J. Off, A. Sohmer, F. Scholz, and A. Hangiter, Phys. Rev. B57, R9435~1998!.
5M. Leroux, N. Grandjean, M. Lau¨gt, J. Massies, B. Gil, P. Lefevre, and P. Bigenwald, Phys. Rev. B58, R13 371~1998!.
6P. Lefebvre, J. Alle`gre, B. Gil, H. Mathieu, N. Grandjean, MLeroux, J. Massies, and P. Bigenwald, Phys. Rev. B59, 15 363~1999!.
7R. Langer, J. Simon, V. Ortiz, N. T. Pelekanos, A. Barski,Andre, and M. Godlewski, Appl. Phys. Lett.74, 3827~1999!; R.Andre, J. Cibert, and Le Si Dang, Phys. Rev. B52, 12 013~1995!.
8J. Simon, R. Langer, A. Barski, and N. T. Pelekanos, Phys. Re61, 7211~2000!; J. Simon, R. Langer, A. Barski, M. Zervos, anN. T. Pelekanos, Phys. Status Solidi A188, 867 ~2001!.
9F. Widmann, J. Simon, B. Daudin, G. Feuillet, J. L. Rouviere,T. Pelekanos, and G. Fishman, Phys. Rev. B58, R15 989~1998!.
10For a review, see, for instance, O. Brand, inGroup III NitrideSemiconductor Compounds~Clarendon, Oxford, 1998!.
11C. Adelmann, J. Brault, J.-L. Rouvie`re, H. Mariette, G. Mula, andB. Daudin, J. Appl. Phys.91, 5498~2002!.
12E. Martinez-Guerrero, C. Adelmann, F. Chabuel, J. Simon, NPelekanos, G. Mula, B. Daudin, G. Feuillet, and H. MarietAppl. Phys. Lett.77, 809 ~2000!.
T.t
l.
-
.
B
.
.,
13B. Daudin, G. Feuillet, H. Mariette, G. Mula, N. T. Pelekanos,Molva, J. L. Rouvie`re, C. Adelmann, E. Martinez-Guerrero,Barjon, F. Chabuel, B. Bataillou, and J. Simon, Jpn. J. ApPhys., Part 140, 1892~2001!.
14B. Gil, O. Briot, and R. L. Aulombard, Phys. Rev. B52, R17 028~1995!.
15F. Bernardini, V. Fiorentini, and D. Vanderbilt, Phys. Rev. B56,R10 024~1997!.
16M. Gurioli, A. Vinattieri, M. Colocci, C. Deparis, J. Massies, GNeu, A. Bosacchi, and S. Franchi, Phys. Rev. B44, 3115~1991!.
17P. Lefebvre, J. Allegre, B. Gil, A. Kavokin, H. Mathieu, W. KimA. Salvador, A. Botchkarev, and H. Morkoc, Phys. Rev. B57,R9447~1998!.
18J. L. Rouviere, J. Simon, N. T. Pelekanos, B. Daudin, andFeuillet, Appl. Phys. Lett.75, 2632~1999!.
19A. D. Andreev and E. P. O’Reilly, Phys. Rev. B62, 15 851~2000!.
20J. Simon, E. Martinez-Guerrero, C. Adelmann, G. Mula, B. Dadin, G. Feuillet, H. Mariette, and N. T. Pelekanos, Phys. StaSolidi B 224, 13 ~2001!.
21J. Feldmann, G. Peter, E. O. Golbel, P. Dawson, K. Moore,Foxon, and R. J. Elliot, Phys. Rev. Lett.59, 2337~1987!.
22L. C. Andreani, F. Tassone, and F. Bassani, Solid State Comm77, 641 ~1991!.
23D. S. Citrin, Phys. Rev. Lett.69, 3353~1992!.24M. Colocci, M. Gurioli, and J. Martinez-Pastor, J. Phys. IV3, 3
~1993!.25S. Fafard, S. Raymond, G. Wang, R. Leon, D. Leonard, S. C
boneau, J. L. Merz, P. M. Petroff, and J. E. Bowers, Surf. S361Õ362, 778 ~1996!.
2-7


![Operacní systémy [5pt]Pametphoenix.inf.upol.cz/~krajcap/courses/2016ZS/YOS/lecture04.pdfpamet’ RAM je relativn e drah a =)nemus v zdy dosta covat aktu aln e pou z van a data (nap](https://img.pdfslide.fr/doc/110x75/600c23e14da4ef13b17d4cdd/operacn-systmy-5pt-krajcapcourses2016zsyoslecture04pdf-pameta-ram-je.jpg)