Embed Size (px)
Citation preview
Dynamic rheological analysis of a miscible blend
showing strong interactions
Haijun Caia, Abdellatif Ait-Kadib, Josee Brissona,*
aDepartement de chimie, Faculte des sciences et de genie, Centre de recherche en science et ingenierie des macromolecules (CERSIM),
Universite Laval, Quebec, Que., Canada G1K 7P4bDepartement de genie chimique, Faculte des sciences et de genie, Centre de recherche en science et ingenierie des macromolecules (CERSIM),
Universite Laval, Quebec, Que., Canada G1K 7P4
Received 14 June 2002; received in revised form 9 December 2002; accepted 13 December 2002
Abstract
The rheological behavior of miscible blends was studied through oscillatory shear measurements. Two miscible blends were selected to
compare with athermal blending cases, i.e. the hydrogen bonding poly(4-vinyl phenol)/poly(ethylene oxide) (PVPh/PEO) blend and the
weakly interacting polystyrene/poly(2,6-dimethyl-1,4-phenylene oxide) (PS/PPO) blend. The homopolymers and the blends were
characterized over a wide experimental window using the time–temperature superposition principle.
The horizontal shift factor, aT, does not vary appreciably with composition for PS/PPO, whereas a strong compositional dependence is
observed for the PVPh/PEO blends. Additions of up to 30 wt% of PEO to PVPh produce only minor changes in the value of rubber plateau
modulus ðG0NÞ; while G0
N increases steadily after this concentration. The G0N values follow athermal blending models [J. Polym. Sci., Part B:
Polym. Phys. 25 (1987) 2511; J. Polym. Sci., Part B: Polym. Phys. 26 (1988) 2329] in the case of PS/PPO but not of PVPh/PEO. Values of h0b
for PVPh/PEO blends were estimated from weighed relaxation spectra. The three measured parameters, aT, G0N and h0 show a turning point
around 20–30 wt% of PEO, which corresponds to a 41–54 mol% of PEO, in correlation with the previously reported observation of a
maximum in the deformation-induced uniaxial orientation behavior of PEO component near this composition [Macromolecules 32 (1999)
8509].
q 2003 Elsevier Science Ltd. All rights reserved.
Keywords: Poly(4-vinyl phenol) blend; Rheology; Hydrogen bonds
1. Introduction
In the past years, our group has studied orientation
behavior upon deformation of miscible blends containing
poly(4-vinyl phenol) (PVPh) [1–3]. PVPh can be described
as a polystyrene with a hydroxyl function attached on the
para position of each aromatic group. It has been reported to
form miscible blends with other polymers that contain
accessible ‘proton-acceptor’ groups, such as carbonyl, ester
and ether groups, through the formation of hydrogen bond
interactions [4,5]. For blends with polyethylene oxide
(PEO), a maximum in deformation-induced uniaxial
orientation of the PEO component was observed for
30 wt% PEO [3]. This unusual behavior promoted the
choice of the PVPh/PEO blend for the present study.
To better understand the influence of hydrogen bonds on
the rheological behavior of PVPh/PEO blends, it was
decided to compare the PVPh/PEO blend with predictions
using the athermal blending cases reported by Wu [6] and
Tsenoglou [7], which suppose that interactions do not
modify the entanglement probability with respect to the case
of the pure polymers. In order to further verify the effect of
interactions, a miscible, weakly interacting blend was also
selected to compare with PVPh/PEO. Because of the strong
structural similarity between polystyrene (PS) and PVPh,
which differs only by the presence of a para-substitution
with a hydroxyl function in PVPh, miscible blends based on
PS were sought. Unfortunately, PS/PEO blends are
immiscible. The main miscible blend over a large
temperature window with PS reported in the literature is
with poly(phenylene oxide)(PPO) [8,9]. Prest and Porter [9]
have previously reported rheological characterization of
PS/PPO blends. In their work, the rubbery plateau modulus
0032-3861/03/$ - see front matter q 2003 Elsevier Science Ltd. All rights reserved.
doi:10.1016/S0032-3861(03)00019-3
Polymer 44 (2003) 1481–1489
www.elsevier.com/locate/polymer
* Corresponding author. Tel.: þ1-418-656-3536; fax: þ1-418-656-7916.
E-mail address: [email protected] (J. Brisson).
and the WLF parameters at Tg were determined. Therefore,
as the rheological behavior of this system is already well
known, only a few compositions were measured in the
present work.
On the other hand, little is known on rheology of PVPh-
based blends. The only work reported in the literature is that
of Akiba and Akiyama [10]. They have shown that, for PS
and PVPh of relatively low molecular weights, compo-
sitional dependence and magnitude of zero-shear viscosity
of miscible PVPh/PVME blends are almost same as those of
PS/PVME blends under iso-free volume conditions. The
fact that viscoelastic properties between the two blends
varied negligibly indicated that, for the molecular weights
studied, hydrogen bonds present in PVPh/PVME induced
little influence on long time scale rheological properties,
such as zero-shear viscosity ðh0Þ:
In order to shed light on the origin of the peculiar behavior
upon deformation of the PVPh/PEO blend, the objective of
the present paper is to contribute to the understanding of the
effect of hydrogen bonding on the overall behavior of
PVPh/PEO blends. To enlighten the effect of hydrogen bonds
on rheology, dynamic rheological data in the linear
viscoelastic regime (LVE) were obtained and compared to
those of athermal blending cases that show no effect of
interactions on entanglement probability. Changes in G0N; h0
and horizontal shift factor (aT) were compared for both
studied systems. A forthcoming paper will discuss specifi-
cally the determination of molecular weight between chain
entanglements (Me) and interchain friction coefficients ðjÞ:
2. Experimental
2.1. Materials and characterization
Molecular weights, polydispersities and sources of
selected polymers are listed in Table 1. Molecular weight
and polydispersity of the pure constituents were determined
by gel permeation chromatography (GPC) using a Waters
HPLC pump model 515, a Rheodyne Injector model 7125,
several separated Styragel columns, a light scattering Dawn
DSPF detector and a refractive detector Optilab 903 from
Wyatt. HPLC grade tetrahydrofuran (THF) filtered through
0.2 mm filters was used as a solvent.
Prior to all other measurements (e.g. differential scanning
calorimetry DSC and rheological characterization), samples
were thoroughly dried under dynamic vacuum for at least 2
weeks.
The glass transition temperature (Tg) was determined by
DSC (Perkin–Elmer DSC-7). DSC scans were recorded
using a heating rate of 20 8C/min and a sample capsule of
15–25 mg after calibration with indium. Tg is taken as the
midpoint of the transition. The occurrence of a single Tg was
taken as confirmation of miscibility.
PVPh and PEO were blended at a concentration of 2–4%
in THF at approximately 60 8C. PVPh/PEO blends were
obtained by evaporating the solvent in a fume hood,
followed by further drying for 2–4 weeks in a vacuum
oven at a temperature close to Tg of each blend.
PS and PPO were blended at a concentration of 2.5% in
benzene. The solution was subsequently frozen in liquid
nitrogen and placed in a FTS system freeze-dryer (Model
#FD-3-85A-MP) at 280 8C under a pressure of 200 Torr for
several hours, allowing the complete sublimation of the
solvent. The resulting white powder blend was subsequently
broken down into finer particles with a mortar and pestle,
and further dried for several days in a vacuum oven at a
temperature in the vicinity of Tg to remove any residual
solvent.
2.2. Rheological measurements
Rheological measurements were carried out on a
Rheometric Scientific ARES-II rheometer and a Bohlin
CS and CVO rheometer using parallel plate geometry. Disk-
shaped samples having 25 mm diameter and 1.5 mm
thickness were pressed using a Carver laboratory press.
Strain sweep tests were performed first to determine the
linear viscoelastic zone for each blend at very low strain
(0.5–20%). All experiments were carried out under dry
nitrogen atmosphere. Test temperature was varied from
Tg þ 10 to Tg þ 100 8C for all blends. Storage modulus, G0,
loss modulus, G00, and loss tangent, tan d as a function of
frequency were obtained by performing frequency sweep
tests at each temperature. For each blend, tests under the
same experimental conditions were repeated two to three
times in order to confirm reproducibility.
Master curves for G0, G00 and tan d were obtained using
the time–temperature superposition principle at a reference
temperature Tref ¼ Tg þ 15 8C for pure polymers and
blends.
Relaxation spectra, HðtÞ; were calculated from the
shifted data, i.e. G0ðaTvÞ and G00ðaTvÞ; where aT is the
Table 1
Selected polymers
Polymer Mw (g/mol) Mw/Mn Sourcem
Poly(4-vinyl phenol) 78,900 2.5–2.8 TriQuest, Corpus Christi
Poly(ethylene oxide) 6600 1.24 Aldrich Chemical
Polystyrene 276,000 2.01 Dow Chemical
Poly(2,6-dimethyl 1,4-phenylene oxide) 40,000 2.19 General Electric
H. Cai et al. / Polymer 44 (2003) 1481–14891482
horizontal shift factor, using a neural network program
(NNSPEC software) developed by Grandjean, Ait-Kadi and
Cote [11]. For PVPh-rich blend compositions, samples were
brittle and Tg higher, which forced us to use high
temperatures where sample degradation was fast even
under dry nitrogen atmosphere. Thus, rheological measure-
ments were limited and the zero-shear viscosity, h0; was
calculated from the following equation [11]
h0 ¼ðþ1
21tHðtÞdðln tÞ ð1Þ
where HðtÞ is calculated from the limited and discrete linear
viscoelastic data, e.g. G0ðvÞ and G00ðvÞ; using a software
based on neural network models.
3. Results and discussion
3.1. Selected blend systems
As mentioned in Section 1, one of the aims of this work
was to shed light on the peculiar behavior upon defor-
mation-induced orientation of PVPh/PEO blends. In order
to better understand the influence of hydrogen bond
interactions, a comparison with athermal models and with
a weakly interacting blend was sought. This posed the
problem of choosing which weakly interacting miscible
blend could better serve this purpose, while being
sufficiently similar, chemically, to offer a sensible compari-
son with the PVPh/PEO blend. In the case of weak
interactions, the number of miscible blends is limited.
PEO-based blends were rejected, as polymers miscible with
PEO (polyacrylic acid, polymethacrylic acid, polyurea,
arboxymethyl dextran) form hydrogen bonds, and com-
plexation of the two polymers is often observed [12].
Miscible PVPh-based blends, likewise, form hydrogen
bonds. Therefore, because of its chemical similarity to
PVPh, PS-based blends were sought. PS is known to form
miscible blends with PPO and with poly(vinyl methyl ether)
(PVME). The PS/PVME blend system presents a lower
critical solution temperature (LCST), which limits the
experimental temperature window in which the system is
miscible, and was also rejected [12]. PS/PPO was therefore
selected. Unfortunately, on a thermal point of view, it is not
ideal, as Tgs of the pure polymers are quite different, Tg of
PPO being higher than that of PS, whereas the reverse is
observed for PEO and PVPh.
Once the blend systems are selected, a choice must be
made in terms of molecular weight. In this specific instance,
this choice was made with respect to number of entangle-
ments in the polymer chain. It has been shown by Aoki and
Tanaka [13] that, when the difference in the number of
entanglement couplings ðne ¼ Mw=MeÞ is very large
between the two components of a miscible blend, the
plateau modulus ðG0NÞ of the blend cannot be determined by
conventional methods, i.e. from the storage modulus at the
frequency where tan d is a minimum. Further, we also aimed
at choosing molecular weights for which the polymers were
in an entangled state. Therefore, from the polymers
available commercially, we selected a PVPh of ne ¼ 2:7
and a PEO of ne ¼ 2:6; while for PS we used ne ¼ 10 and
for PPO ne ¼ 11: Molecular weights, polymer source and
polydispersities are reported in Table 1.
3.2. Rheological behavior of the blends
It has been reported that PVPh and PEO form miscible
blends exhibiting strong interactions, i.e. hydrogen bonds
between the hydroxyl proton of PVPh and the accessible
ether oxygen of PEO [14].
In a previous study on molecular orientation upon
uniaxial deformation [3], a maximum in deformation-
induced orientation of the PEO component was observed.
Only compositions in which PEO crystallization was absent
were studied. The blends therefore formed a single
amorphous phase, as attested by the presence of a single
Tg transition and the absence of a melt endothermic peak in
DSC. The same PVPh/PEO blend compositions are used in
the present study for comparison purposes. The Tgs of pure
polymers and blends are reported in Table 2.
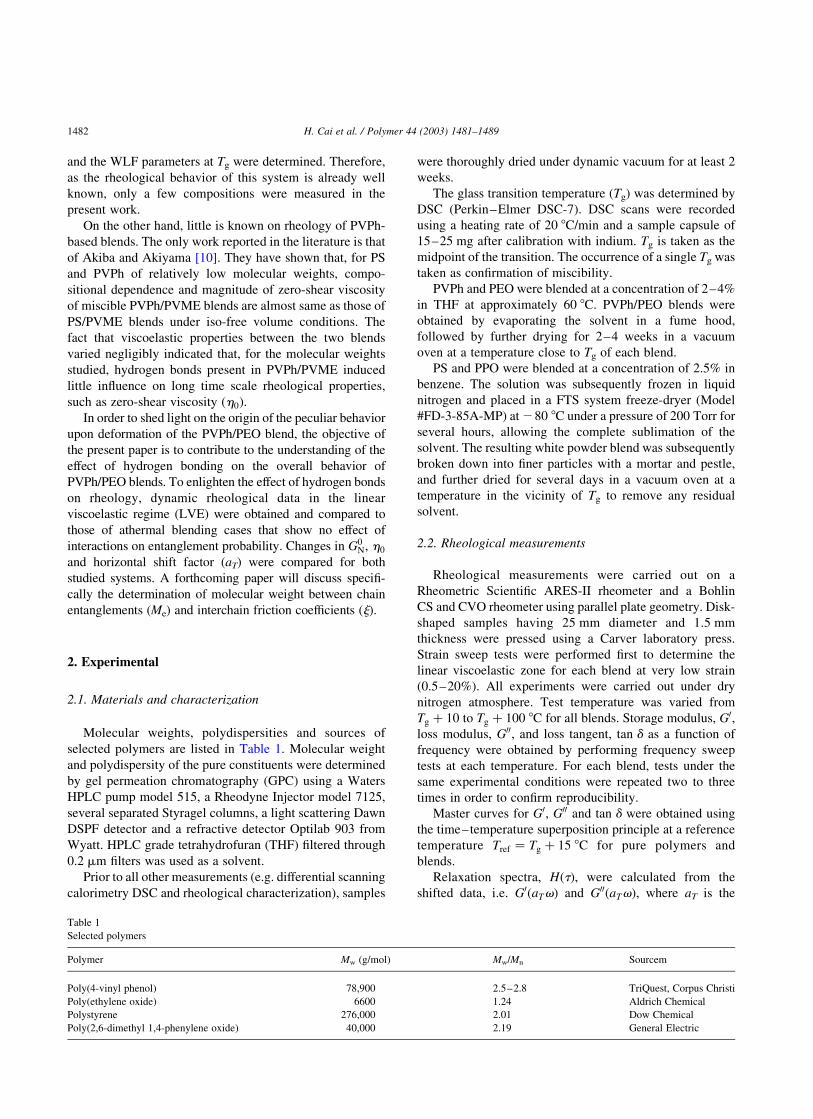
Figs. 1 and 2 show typical storage and loss moduli master
curves at Tg þ 15 for representative PS/PPO and PVPh/PEO
blend, respectively. The behavior is found to be thermo-
rheologically simple in all cases, and the empirical time–
temperature superposition (tTS) principle applies to all the
studied pure polymers and blends. For the pure PS and the
PS/PPO (60/40, wt) blend, the minimum in loss tangent
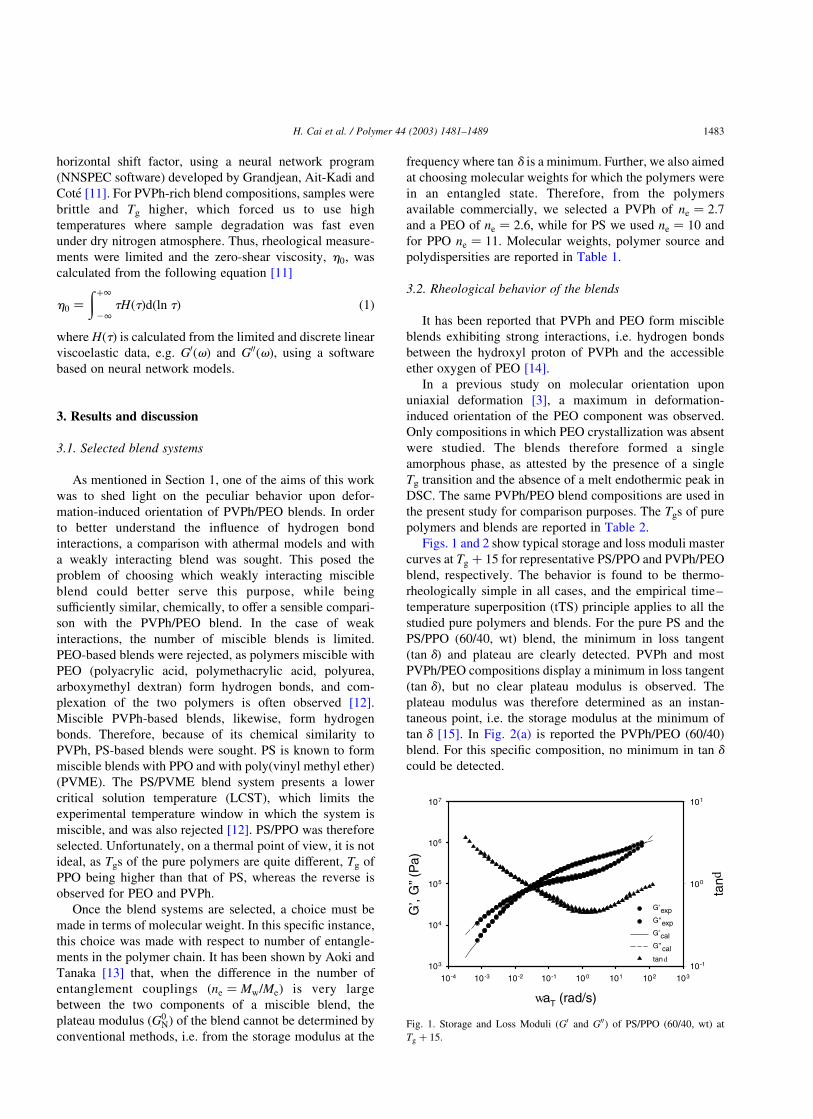
ðtan dÞ and plateau are clearly detected. PVPh and most
PVPh/PEO compositions display a minimum in loss tangent
ðtan dÞ; but no clear plateau modulus is observed. The
plateau modulus was therefore determined as an instan-
taneous point, i.e. the storage modulus at the minimum of
tan d [15]. In Fig. 2(a) is reported the PVPh/PEO (60/40)
blend. For this specific composition, no minimum in tan d
could be detected.
Fig. 1. Storage and Loss Moduli (G0 and G00) of PS/PPO (60/40, wt) at
Tg þ 15:
H. Cai et al. / Polymer 44 (2003) 1481–1489 1483
In the terminal region, the rheological behavior of PS and
PS/PPO is close to what is normally expected at the low
frequencies, i.e. G0 / v2 and G00 / v: However, the
rheological window is more limited for PVPh and for
PVPh/PEO blends due to thermal degradation at high
temperature and to brittleness of these blends. Some sets of
rheological data cannot be extended to the terminal zone
where G0 / v2 and G00 / v; in particular for the PVPh-rich
blends with PEO compositions up to 20 wt%.
3.3. Determination of G0N
G0N is a key parameter to determine Me [16]. Usually, for
amorphous polymers, G0N can be estimated from the storage
modulus at the frequency where a minimum of the loss
tangent ðtan dÞ occurs. In the present work, except for the
PVPh/PEO (60/40, wt) blend, the plateau modulus for all
other blends (PS/PPO, PVPh/PEO) was obtained by G0N ¼
ðG0Þtan d!minimum: For the PVPh/PEO (60/40, wt) blend, no
minimum in tan d was observed. This is attributed to the
limited temperature range accessible for this blend compo-
sition whose Tg ¼ 33 8C. Test temperature was varied from
43 8C ðTg þ 10Þ to 133 8C ðTg þ 100 8CÞ in order to be
within the applicability range of the WLF equation, and thus
far away from the low frequency terminal zone. Therefore,
the plateau modulus was deduced from the crossover
modulus, Gc, using the following semi-empirical equation
[17]
logðG0N=GcÞ ¼ 0:380 þ
2:63ðlog pÞ
1 þ 2:45ðlog pÞð2Þ
where p is the polydispersity ðp , 3Þ; and Gc ¼ G0ðvcÞ ¼
G00ðvcÞ: This equation was proposed by Wu [17], taking into
account the effects of molecular weight distribution. The
validity of the equation was confirmed theoretically and
experimentally for several amorphous and crystalline
polymers [17]. Wu [6,17] and Tsenoglou [7] indicated that
the above techniques for measuring G0N are also applicable
for a binary miscible blend. The polydispersity of the PVPh/
PEO blend as estimated using the polydispersities of the
pure polymers is 2:6 ^ 0:1: It must be noted that as
reported in Table 2, this approach yielded, within exper-
imental error, similar values to those of the minimum in
tan d for compositions where the latter were observed, thus
Table 2
Tg, G0N and h0 values of PS/PPO and PVPh/PEO blends
Sample ID PEO (mol%) Tg (8C) G0NðMPaÞ ) ðG0Þtan d!minimum G0
NðMPaÞ ) Gc h0 at Tg þ 15 (Pa s)
PS 98 0.151 ^ 0.001 0.149 ^ 0.008 6.82 £ 104
PS/PPO (60/40, wt) 143 0.400 ^ 0.008 0.403 ^ 0.007 2.26 £ 107
PS/PPO (50/50, wt) 151 0.455 ^ 0.005 0.449 ^ 0.013 3.19 £ 107
PPO 217 1.190 ^ 0.006 1.187 ^ 0.005 3.07 £ 10þ11
PVPh 0 177 0.148 ^ 0.006 0.140 ^ 0.049 6.33 £ 106
PVPh/PEO (95/5, wt) 13 154 0.147 ^ 0.009 0.143 ^ 0.033 3.56 £ 107
PVPh/PEO (85/15, wt) 32 131 0.153 ^ 0.006 0.150 ^ 0.008 4.17 £ 107
PVPh/PEO (82/18, wt) 37 120 0.157 ^ 0.004 0.153 ^ 0.003 1.24 £ 108
PVPh/PEO (80/20, wt) 41 115 0.160 ^ 0.005 0.154 ^ 0.020 1.70 £ 108
PVPh/PEO (77/23, wt) 45 101 0.168 ^ 0.013 0.166 ^ 0.009 2.49 £ 107
PVPh/PEO (75/25, wt) 48 92 0.172 ^ 0.009 0.175 ^ 0.004 1.50 £ 107
PVPh/PEO (70/30, wt) 54 88 0.194 ^ 0.018 0.198 ^ 0.013 2.12 £ 107
PVPh/PEO (65/35, wt) 59 67 0.227 ^ 0.016 0.224 ^ 0.023 6.72 £ 107
PVPh/PEO (60/40, wt) 65 33 0.326 ^ 0.007 1.10 £ 108
PEO 100 261 0.907 ^ 0.043
Fig. 2. Storage and loss Moduli (G0 and G00) of PVPh/PEO blends at Tg þ 15
(a) PVPh/PEO (60/40, wt), (b) PVPh/PEO (70/30, wt).
H. Cai et al. / Polymer 44 (2003) 1481–14891484
confirming the validity of the approach for the PVPh/PEO
blend studied here.
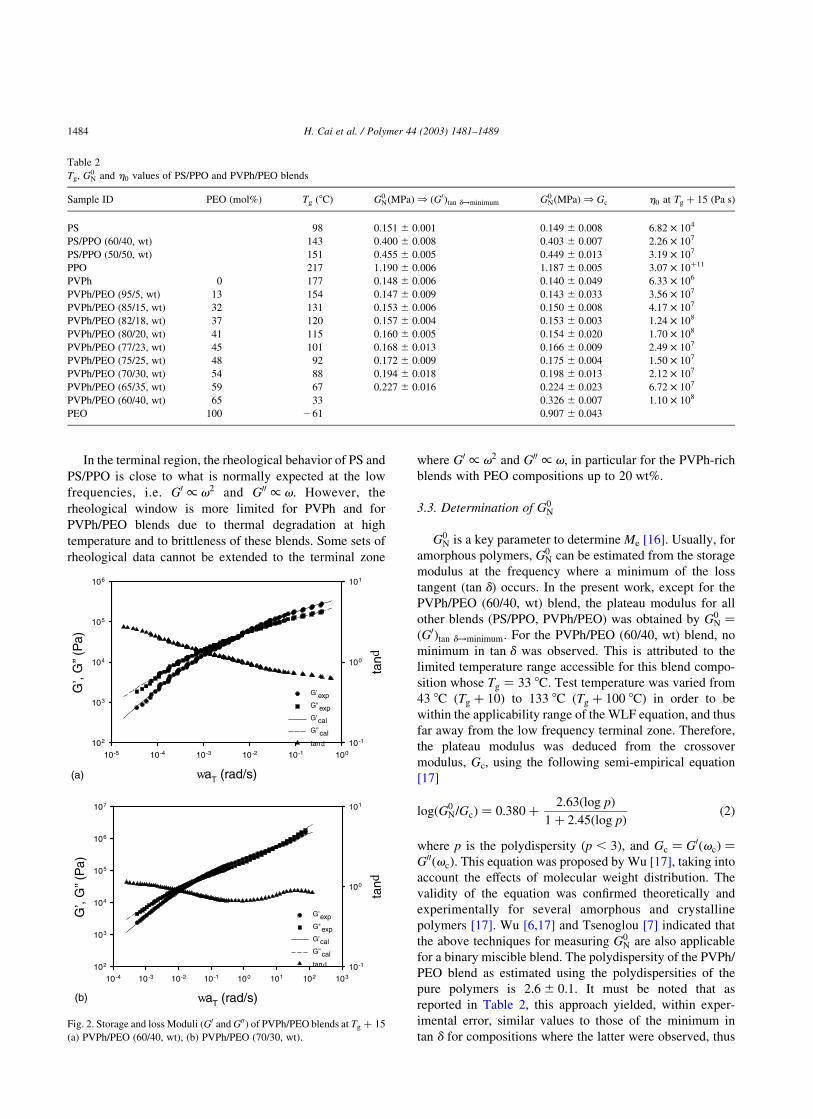
The plateau moduli G0N for PVPh/PEO blends are also
shown in Fig. 3, with respect to weight fraction. As can be
seen, G0N is almost insensitive to blend composition up to
30 wt% of PEO. Above this concentration, G0N appreciably
increases with PEO concentration.
Wu [6] proposed an athermal blending model for
miscible blends, as expressed by
G0Nb ¼ f1G0
N1 þ f2G0N2 ð3Þ
where G0Nj is the plateau modulus of the blend ( j ¼ b) or the
constituent ( j ¼ 1 or 2), and fi (i ¼ 1 or 2) the volume
fraction. In the athermal blending case, specific interchain
interactions exert little influence on entanglement prob-
ability, which is unperturbed with respect to individual
components.
Tsenoglou [7], on the other hand, proposed a random
formation of chain entanglement between chains of the two
components in a miscible blend. The blending rule for the
athermal case is then given by
ðG0NbÞ
1=2 ¼ f1ðG0N1Þ
1=2 þ f2ðG0N2Þ
1=2 ð4Þ
which is based on the fact that entanglement probability
between dissimilar chains is proportional to the geometric
average of the entanglement probability between similar
chains.
Lomellini [18] has already compared the weakly
interacting PS/PPO blends with the mentioned two athermal
blending cases. G0N values of PS/PPO were reasonably close
to the model predictions using Tsenoglou’s athermal case
blending rule. On the other hand, Wu’s model showed an
increased entanglement probability with reference to
Tsenoglou’s athermal case. Lomellini proposed that the
weak interactions in PS/PPO blends exert little influence on
the entanglement probability, and thus result in an athermal
case described by the above-mentioned equations. Further,
Aoki and Tanaka [13] showed, for PMMA/SAN blends, that
variations in the Flory–Huggins interaction parameter (x)
did not change the linearity of G0N vs. blend composition
curves. However, although the specific values of x were not
determined, it is known from small-angle neutron scattering
that the PMMA/SAN blends are weakly interacting with x
values averaging 20.011 [19]. Whereas small variations in
x may not affect G0N and entanglements markedly, strong
interchain interactions are proposed to have a stronger
influence. In the present case, the experimentally deter-
mined G0N values of PVPh/PEO are significantly lower than
both the Wu and the Tsenoglou model predictions, up to a
concentration of 40 wt% PEO, as seen in Fig. 3. This is
attributed to the presence of stronger interchain interactions,
which may exert a repulsive effect on the entanglement
probability of the PVPh/PEO blends. Therefore, a PVPh/
PEO blend is not athermally entangled according to neither
Wu’s model nor Tsenoglou’s model.
G0N values deviate significantly from those calculated by
the athermal case blending rules, and the rheology of
PVPh/PEO differs significantly from that of the weakly
interacting PS/PPO. This is mainly attributed to the formation
of strong hydrogen bonds in PVPh/PEO mixtures, which are
not accounted for by the athermal models.
3.4. Determination of h0
Zero-shear viscosity of a miscible blend, h0b; is directly
related to global interchain friction coefficient (j) [16]. The
zero-shear viscosity (h0) can be either directly obtained by
inspection of the experimental data or else estimated from
the relaxation spectrum, HðtÞ; using Eq. (1).
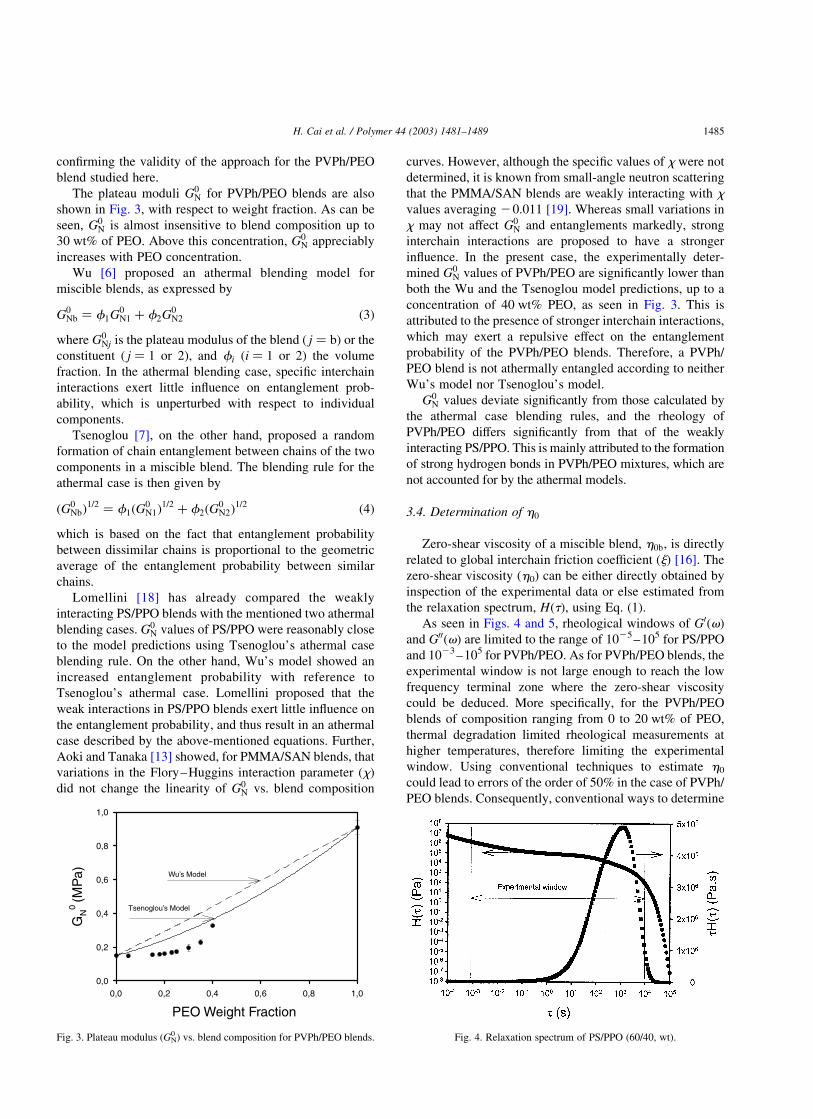
As seen in Figs. 4 and 5, rheological windows of G0ðvÞ
and G00ðvÞ are limited to the range of 1025–105 for PS/PPO
and 1023–105 for PVPh/PEO. As for PVPh/PEO blends, the
experimental window is not large enough to reach the low
frequency terminal zone where the zero-shear viscosity
could be deduced. More specifically, for the PVPh/PEO
blends of composition ranging from 0 to 20 wt% of PEO,
thermal degradation limited rheological measurements at
higher temperatures, therefore limiting the experimental
window. Using conventional techniques to estimate h0
could lead to errors of the order of 50% in the case of PVPh/
PEO blends. Consequently, conventional ways to determine
Fig. 3. Plateau modulus (GN0 ) vs. blend composition for PVPh/PEO blends. Fig. 4. Relaxation spectrum of PS/PPO (60/40, wt).
H. Cai et al. / Polymer 44 (2003) 1481–1489 1485
h0, such as h0 ¼ limv!0 G00ðvÞ=v; are not applicable to the
PVPh/PEO system.
Based on these rheological data, however, the relaxation
spectra determined by the neutral network model can be
extended to a larger range, as shown in Figs. 4 and 5 for
typical relaxation spectra of PS/PPO and PVPh/PEO blends,
respectively. This has been done following the approach
developed by Grandjean, Ait-Kadi and Cote [11]. The
relaxation spectrum reflects the response of the polymer to a
given deformation history by considering the weighted
contributions of each relaxation mode. The relatively large
range can be viewed as an extrapolation of the experimental
data to the lower and higher frequencies. In the case of PS/
PPO blends, as seen in Fig. 4, this extrapolation is limited.
For PVPh/PEO blends, it encompassed an important section
of the peak. Care was therefore taken to fit as accurately as
possible for the experimental section of the curve, as well as
to verify the initial model settings and optimization
parameters, which can affect the resultant relaxation spectra.
Typical relaxation spectra are obtained when the spectrum
is Gaussian-shaped. The relaxation spectra of PVPh and
PVPh/PEO are broader than those of PS and PS/PPO.
Similar results were obtained by Stadler et al. [20–23], who
reported that hydrogen bond formation in the functionalized
polybutadienes results in a broadened relaxation time
spectrum and an increase in zero-shear viscosity. Further,
G0 and G00 curves were recalculated from the relaxation
spectra deduced by the neural network model using the
following equations [11,16]
G0ðvÞ ¼ðþ1
21
v2t2
1 þ v2t2HðtÞdðln tÞ ð5Þ
G00ðvÞ ¼ðþ1
21
vt
1 þ v2t2HðtÞdðln tÞ ð6Þ
Results appear as a solid line for G0 and a dotted line for G00
in Figs. 1 and 2. The excellent fit between the calculated and
experimental G0 and G00 data guarantees in part the
correctness of the calculated relaxation spectra, at least
within the experimental window explored for each sample.
Until now h0 values of PS/PPO at Tg or at temperatures
equally distant from the Tg have not been reported in the
literature. For the PS/PPO blends, for which limited
compositions have been studied, h0 values always increases
with PPO composition at Tg þ 15 as reported in Table 2. On
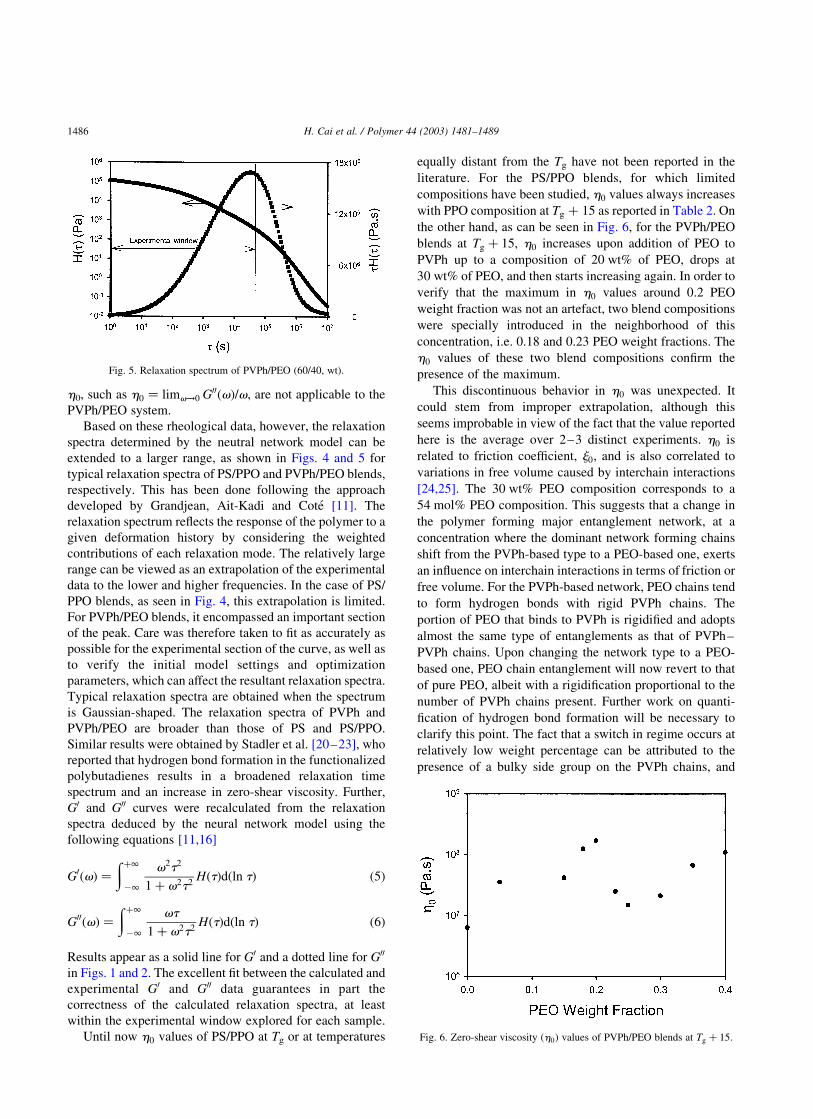
the other hand, as can be seen in Fig. 6, for the PVPh/PEO
blends at Tg þ 15; h0 increases upon addition of PEO to
PVPh up to a composition of 20 wt% of PEO, drops at
30 wt% of PEO, and then starts increasing again. In order to
verify that the maximum in h0 values around 0.2 PEO
weight fraction was not an artefact, two blend compositions
were specially introduced in the neighborhood of this
concentration, i.e. 0.18 and 0.23 PEO weight fractions. The
h0 values of these two blend compositions confirm the
presence of the maximum.
This discontinuous behavior in h0 was unexpected. It
could stem from improper extrapolation, although this
seems improbable in view of the fact that the value reported
here is the average over 2–3 distinct experiments. h0 is
related to friction coefficient, j0; and is also correlated to
variations in free volume caused by interchain interactions
[24,25]. The 30 wt% PEO composition corresponds to a
54 mol% PEO composition. This suggests that a change in
the polymer forming major entanglement network, at a
concentration where the dominant network forming chains
shift from the PVPh-based type to a PEO-based one, exerts
an influence on interchain interactions in terms of friction or
free volume. For the PVPh-based network, PEO chains tend
to form hydrogen bonds with rigid PVPh chains. The
portion of PEO that binds to PVPh is rigidified and adopts
almost the same type of entanglements as that of PVPh–
PVPh chains. Upon changing the network type to a PEO-
based one, PEO chain entanglement will now revert to that
of pure PEO, albeit with a rigidification proportional to the
number of PVPh chains present. Further work on quanti-
fication of hydrogen bond formation will be necessary to
clarify this point. The fact that a switch in regime occurs at
relatively low weight percentage can be attributed to the
presence of a bulky side group on the PVPh chains, and
Fig. 5. Relaxation spectrum of PVPh/PEO (60/40, wt).
Fig. 6. Zero-shear viscosity ðh0Þ values of PVPh/PEO blends at Tg þ 15:
H. Cai et al. / Polymer 44 (2003) 1481–14891486
therefore molar percentages describe more aptly the
network state.
3.5. Determination of WLF parameters
For all studied polymers and blends, master curves have
been obtained at Tref ¼ Tg þ 15 8C. It can be recalled that
one of the major aims of this study was to shed light on the
specific orientation behavior of the PVPh/PEO system [3].
As deformation is normally conducted at a constant
temperature vs. Tg, it was imperative to select such a
reference temperature for the determination of the rheolo-
gical parameters. The horizontal shift factors (aT) as a
function of temperature for both PS/PPO and PVPh/PEO
samples is represented by the WLF equation
log aT ¼ logh0ðTÞ
h0ðT0Þ¼
2C01ðT 2 T0Þ
C02 þ ðT 2 T0Þ
ð7Þ
where C01 ¼ 8:86; C0
2 ¼ 101:6: An adjustable parameter, T0
is generally found to be about 50 8C above Tg for various
polymer systems [13,26]. At T0, the rheological behavior of
different blend compositions can be compared under iso-
free volume conditions [8]. For the PS/PPO blends, T0 2
Tg ø 66:5; and T0 for the two blend compositions studied
follows a linear relationship with the weight fraction of
PPO, as is the case for most miscible blends having
negligible thermodynamic interactions reported in the
literature [13,26]. Both Wu [7] and Aoki [13] mentioned
that the free volume of miscible blends tends to be linearly
additive, and the free volume additivity results in a decrease
in melt viscosity.
Doolittle [27] proposed that the melt viscosity was
related to the fractional free volume, f, as expressed by
ln h ¼ ln A þB
fð8Þ
where A and B are constants. Therefore, the maximum in h0
observed in Fig. 6 indicates a minimum in free volume,
which could be due to a decrease in average distances
between interacting groups upon hydrogen bond formation.
This may also be responsible for the observed non-linearity
in T0 in Fig. 7, as in the presence of a decrease in free
volume, a higher temperature may be needed to reach iso-
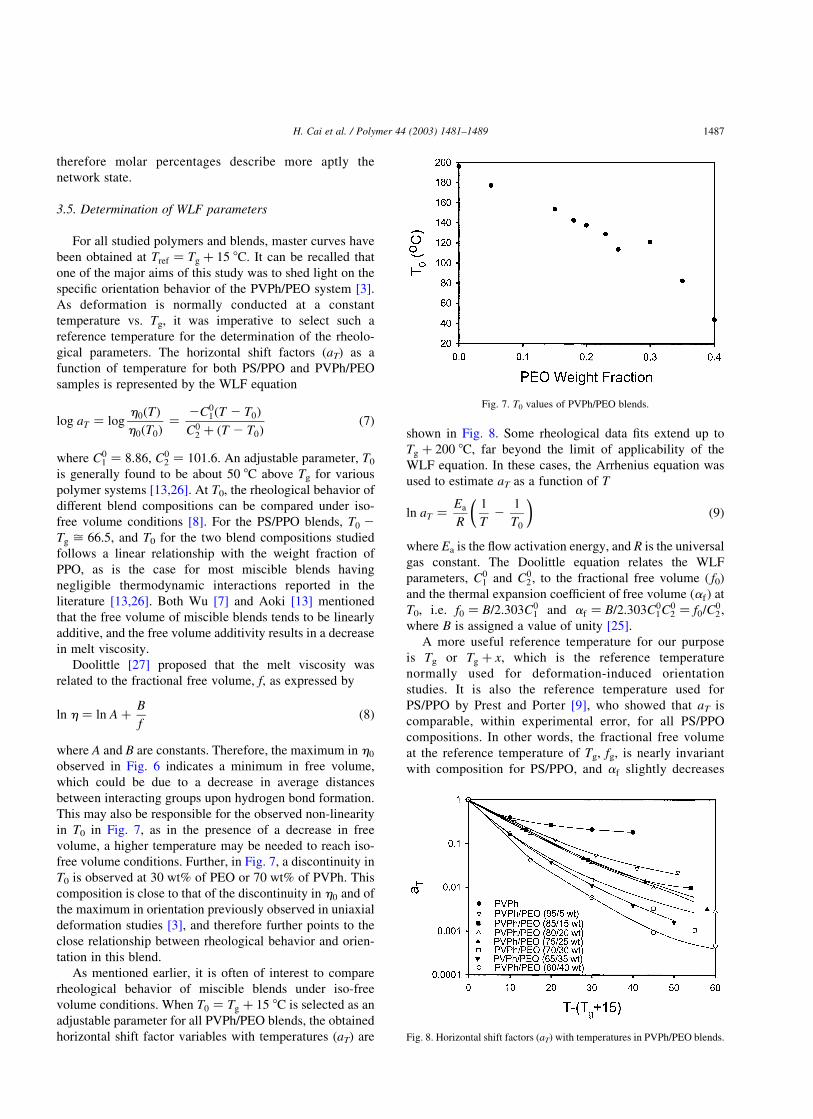
free volume conditions. Further, in Fig. 7, a discontinuity in
T0 is observed at 30 wt% of PEO or 70 wt% of PVPh. This
composition is close to that of the discontinuity in h0 and of
the maximum in orientation previously observed in uniaxial
deformation studies [3], and therefore further points to the
close relationship between rheological behavior and orien-
tation in this blend.
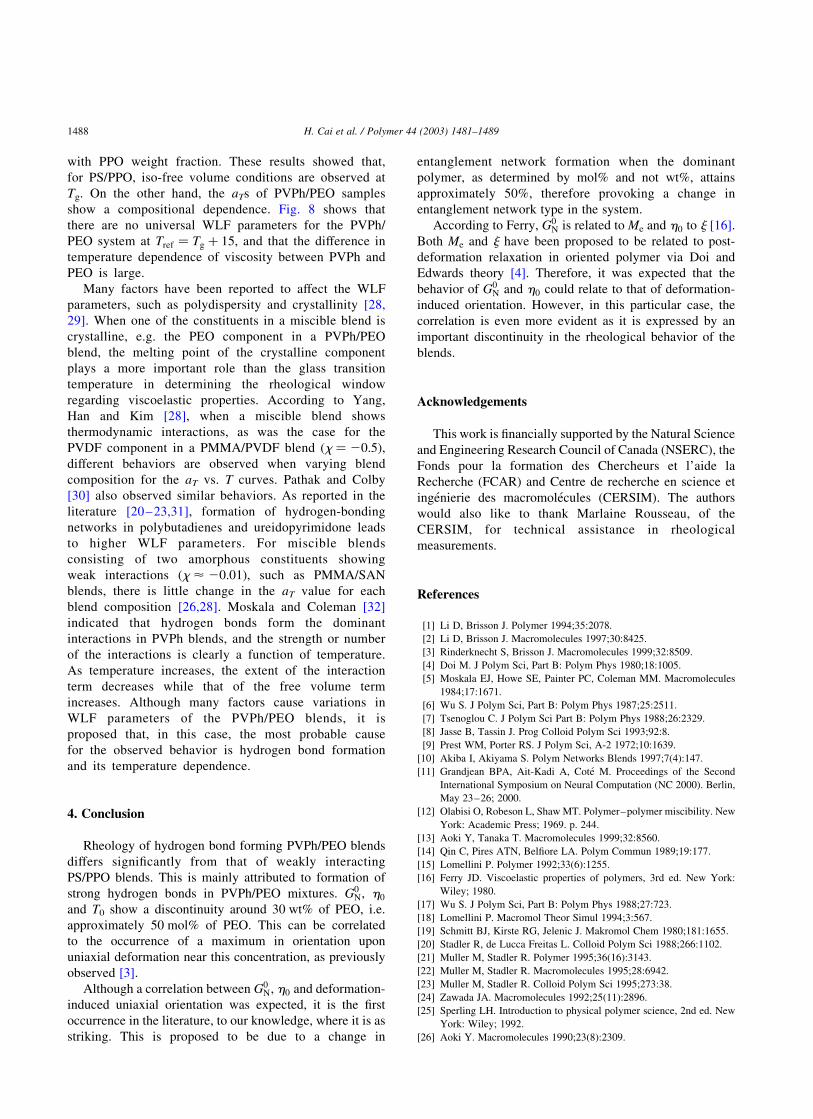
As mentioned earlier, it is often of interest to compare
rheological behavior of miscible blends under iso-free
volume conditions. When T0 ¼ Tg þ 15 8C is selected as an
adjustable parameter for all PVPh/PEO blends, the obtained
horizontal shift factor variables with temperatures (aT) are
shown in Fig. 8. Some rheological data fits extend up to
Tg þ 200 8C, far beyond the limit of applicability of the
WLF equation. In these cases, the Arrhenius equation was
used to estimate aT as a function of T
ln aT ¼Ea
R
1
T2
1
T0
� �ð9Þ
where Ea is the flow activation energy, and R is the universal
gas constant. The Doolittle equation relates the WLF
parameters, C01 and C0
2 ; to the fractional free volume ( f0)
and the thermal expansion coefficient of free volume ðafÞ at
T0, i.e. f0 ¼ B=2:303C01 and af ¼ B=2:303C0
1C02 ¼ f0=C
02 ;
where B is assigned a value of unity [25].
A more useful reference temperature for our purpose
is Tg or Tg þ x; which is the reference temperature
normally used for deformation-induced orientation
studies. It is also the reference temperature used for
PS/PPO by Prest and Porter [9], who showed that aT is
comparable, within experimental error, for all PS/PPO
compositions. In other words, the fractional free volume
at the reference temperature of Tg, fg, is nearly invariant
with composition for PS/PPO, and af slightly decreases
Fig. 7. T0 values of PVPh/PEO blends.
Fig. 8. Horizontal shift factors (aT) with temperatures in PVPh/PEO blends.
H. Cai et al. / Polymer 44 (2003) 1481–1489 1487
with PPO weight fraction. These results showed that,
for PS/PPO, iso-free volume conditions are observed at
Tg. On the other hand, the aTs of PVPh/PEO samples
show a compositional dependence. Fig. 8 shows that
there are no universal WLF parameters for the PVPh/
PEO system at Tref ¼ Tg þ 15; and that the difference in
temperature dependence of viscosity between PVPh and
PEO is large.
Many factors have been reported to affect the WLF
parameters, such as polydispersity and crystallinity [28,
29]. When one of the constituents in a miscible blend is
crystalline, e.g. the PEO component in a PVPh/PEO
blend, the melting point of the crystalline component
plays a more important role than the glass transition
temperature in determining the rheological window
regarding viscoelastic properties. According to Yang,
Han and Kim [28], when a miscible blend shows
thermodynamic interactions, as was the case for the
PVDF component in a PMMA/PVDF blend ðx ¼ 20:5Þ;
different behaviors are observed when varying blend
composition for the aT vs. T curves. Pathak and Colby
[30] also observed similar behaviors. As reported in the
literature [20–23,31], formation of hydrogen-bonding
networks in polybutadienes and ureidopyrimidone leads
to higher WLF parameters. For miscible blends
consisting of two amorphous constituents showing
weak interactions ðx < 20:01Þ; such as PMMA/SAN
blends, there is little change in the aT value for each
blend composition [26,28]. Moskala and Coleman [32]
indicated that hydrogen bonds form the dominant
interactions in PVPh blends, and the strength or number
of the interactions is clearly a function of temperature.
As temperature increases, the extent of the interaction
term decreases while that of the free volume term
increases. Although many factors cause variations in
WLF parameters of the PVPh/PEO blends, it is
proposed that, in this case, the most probable cause
for the observed behavior is hydrogen bond formation
and its temperature dependence.
4. Conclusion
Rheology of hydrogen bond forming PVPh/PEO blends
differs significantly from that of weakly interacting
PS/PPO blends. This is mainly attributed to formation of
strong hydrogen bonds in PVPh/PEO mixtures. G0N; h0
and T0 show a discontinuity around 30 wt% of PEO, i.e.
approximately 50 mol% of PEO. This can be correlated
to the occurrence of a maximum in orientation upon
uniaxial deformation near this concentration, as previously
observed [3].
Although a correlation between G0N; h0 and deformation-
induced uniaxial orientation was expected, it is the first
occurrence in the literature, to our knowledge, where it is as
striking. This is proposed to be due to a change in
entanglement network formation when the dominant
polymer, as determined by mol% and not wt%, attains
approximately 50%, therefore provoking a change in
entanglement network type in the system.
According to Ferry, G0N is related to Me and h0 to j [16].
Both Me and j have been proposed to be related to post-
deformation relaxation in oriented polymer via Doi and
Edwards theory [4]. Therefore, it was expected that the
behavior of G0N and h0 could relate to that of deformation-
induced orientation. However, in this particular case, the
correlation is even more evident as it is expressed by an
important discontinuity in the rheological behavior of the
blends.
Acknowledgements
This work is financially supported by the Natural Science
and Engineering Research Council of Canada (NSERC), the
Fonds pour la formation des Chercheurs et l’aide la
Recherche (FCAR) and Centre de recherche en science et
ingenierie des macromolecules (CERSIM). The authors
would also like to thank Marlaine Rousseau, of the
CERSIM, for technical assistance in rheological
measurements.
References
[1] Li D, Brisson J. Polymer 1994;35:2078.
[2] Li D, Brisson J. Macromolecules 1997;30:8425.
[3] Rinderknecht S, Brisson J. Macromolecules 1999;32:8509.
[4] Doi M. J Polym Sci, Part B: Polym Phys 1980;18:1005.
[5] Moskala EJ, Howe SE, Painter PC, Coleman MM. Macromolecules
1984;17:1671.
[6] Wu S. J Polym Sci, Part B: Polym Phys 1987;25:2511.
[7] Tsenoglou C. J Polym Sci Part B: Polym Phys 1988;26:2329.
[8] Jasse B, Tassin J. Prog Colloid Polym Sci 1993;92:8.
[9] Prest WM, Porter RS. J Polym Sci, A-2 1972;10:1639.
[10] Akiba I, Akiyama S. Polym Networks Blends 1997;7(4):147.
[11] Grandjean BPA, Ait-Kadi A, Cote M. Proceedings of the Second
International Symposium on Neural Computation (NC 2000). Berlin,
May 23–26; 2000.
[12] Olabisi O, Robeson L, Shaw MT. Polymer–polymer miscibility. New
York: Academic Press; 1969. p. 244.
[13] Aoki Y, Tanaka T. Macromolecules 1999;32:8560.
[14] Qin C, Pires ATN, Belfiore LA. Polym Commun 1989;19:177.
[15] Lomellini P. Polymer 1992;33(6):1255.
[16] Ferry JD. Viscoelastic properties of polymers, 3rd ed. New York:
Wiley; 1980.
[17] Wu S. J Polym Sci, Part B: Polym Phys 1988;27:723.
[18] Lomellini P. Macromol Theor Simul 1994;3:567.
[19] Schmitt BJ, Kirste RG, Jelenic J. Makromol Chem 1980;181:1655.
[20] Stadler R, de Lucca Freitas L. Colloid Polym Sci 1988;266:1102.
[21] Muller M, Stadler R. Polymer 1995;36(16):3143.
[22] Muller M, Stadler R. Macromolecules 1995;28:6942.
[23] Muller M, Stadler R. Colloid Polym Sci 1995;273:38.
[24] Zawada JA. Macromolecules 1992;25(11):2896.
[25] Sperling LH. Introduction to physical polymer science, 2nd ed. New
York: Wiley; 1992.
[26] Aoki Y. Macromolecules 1990;23(8):2309.
H. Cai et al. / Polymer 44 (2003) 1481–14891488

[27] Doolittle AK. J Appl Phys 1951;1471.
[28] Yang H, Han CD, Kim JK. Polymer 1994;35(7):1503.
[29] Klopffer M, Bokobza L, Monnerie L. Polymer 1998;39(15):3445.
[30] Pathak JA, Colby RH. Macromolecules 1998;31:8988.
[31] Lange RFM, Gurp MV, Meijer EW. J Polym Sci, Polym Chem Ed
1999;37:3657.
[32] Moskala EJ, Howe SE, Painter PC, Coleman MM. Macromolecules
1984;17(9):1671.
H. Cai et al. / Polymer 44 (2003) 1481–1489 1489


![[Blend Web Mix 2014] Le service design comme modèle de conception : énième méthode UX ou véritable révolution ?](https://img.pdfslide.fr/doc/110x75/55a100111a28ab252e8b4786/blend-web-mix-2014-le-service-design-comme-modele-de-conception-enieme-methode-ux-ou-veritable-revolution-.jpg)


!["Diantre, l'UX rend sourd" [Blend Web Mix Lyon 2015]](https://img.pdfslide.fr/doc/110x75/5a6d4a3c7f8b9ab8418b624b/diantre-lux-rend-sourd-blend-web-mix-lyon-2015.jpg)