Embed Size (px)
Citation preview
Zahia Djouadi1, 2
Samuele Bottani1, 3
Marie-Alix Duval1, 2
Rainer Siebert1
Hervé Tricoire1, 4
Luc Valentin1, 3
1Groupe InterfacesPhysique-Biologie,Institut de Physique Nucléaire,Orsay, France
2Université d’Evry Val d’Essonne,Evry, France
3GMPIB4IJMUniversité Denis Diderot Paris 7,Paris, France
Dynamics of single-stranded DNA migration indenaturing polyacrylamide slab-gel electrophoresis
We describe an original apparatus for the study of the dynamics of single strandedDNA migration. Four detectors based on laser-induced fluorescence (LIF) are equidis-tantly placed on one migration lane, allowing repeated measurements of the sameDNA band at different positions along migration. This article presents the characteris-tics and performances of this system and focuses on the data analysis, showing howthe multiple detection scheme enables the study of band broadening and band resolu-tion during a migration run. Our results suggest the existence of anomalous (nonther-mal) diffusion of DNA molecules during the electrophoretic process.
Keywords: DNA sequencing / Slab gels / Band width / Dispersion EL 4589
1 Introduction
Electrophoresis is a powerful method used in DNA frag-ment separation for sequencing. Since the developmentof methods for rapid DNA sequence analysis in the mid-1970s [1, 2] and the synthesis of fluorescent oligonucleo-tides, automation of most of the processes has beenachieved [3–7]. In order to improve separation efficiency,several theoretical and experimental studies have beendevoted to the understanding of the mechanismsinvolved in this technique. Two main theoretical modelshave been developed to understand the underlying phy-sics in the electrophoresis process, the biased reptationmodel (BRM) [8, 9] and the biased reptation model includ-ing fluctuations (BRF) [10]. These two models predict aplateau of electrophoretic mobility � of the fragmentsabove a certain limit of size (noted M*) depending on themodel. When this plateau is reached the mobilitybecomes field- dependent only and the size separationis impossible.
Another parameter affecting DNA separation is bandbroadening. Different factors contributing to band widthhave been identified [11] but their relative contributionsare still not well understood and the part of each of themis difficult to reveal or evaluate experimentally. The princi-pal reason to this is the difficulty to measure the time evo-lution of band enlargement during one single migration
run contributing thus to hinder the study of physics ofDNA band migration dynamics. This reason motivatedthe development of our dedicated apparatus with fourequidistant detectors arranged along one single lane ofmigration. We show how this system reveals unreportedpeculiarities of the band enlargement mechanism and wediscuss applications of this system for DNA electrophor-esis which will be developed in forthcoming articles.
2 Materials and methods
2.1 Instrumentation
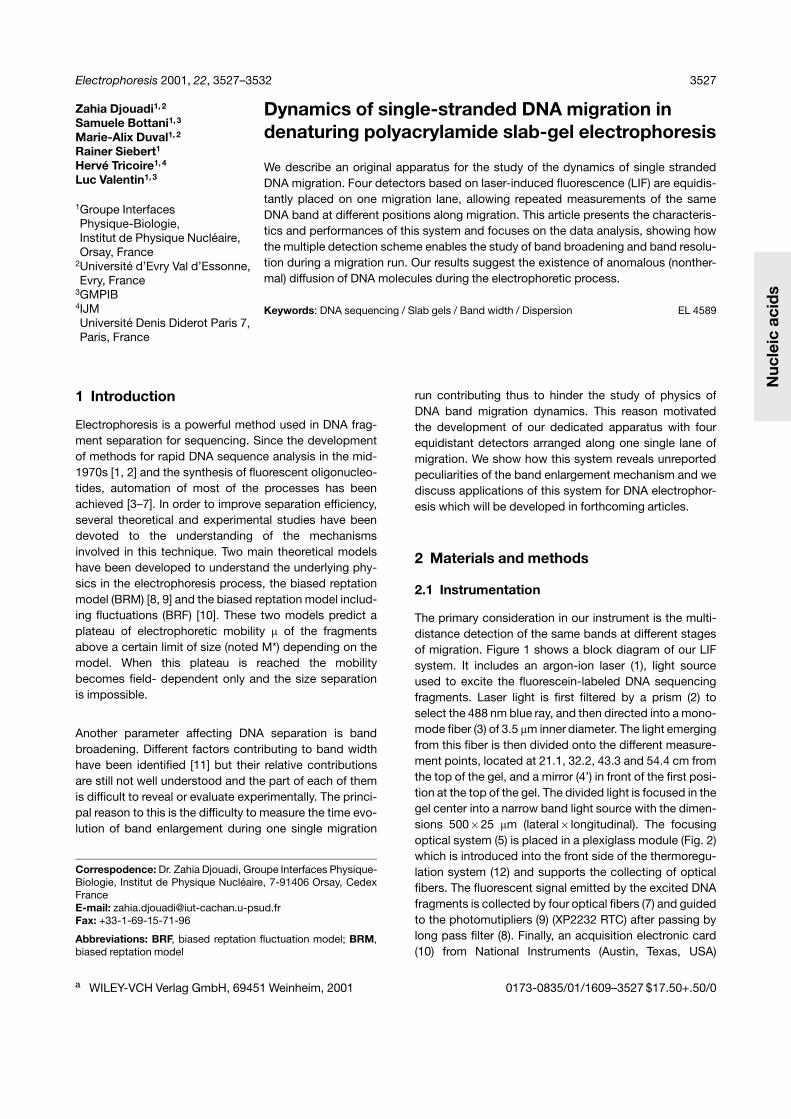
The primary consideration in our instrument is the multi-distance detection of the same bands at different stagesof migration. Figure 1 shows a block diagram of our LIFsystem. It includes an argon-ion laser (1), light sourceused to excite the fluorescein-labeled DNA sequencingfragments. Laser light is first filtered by a prism (2) toselect the 488 nm blue ray, and then directed into a mono-mode fiber (3) of 3.5 �m inner diameter. The light emergingfrom this fiber is then divided onto the different measure-ment points, located at 21.1, 32.2, 43.3 and 54.4 cm fromthe top of the gel, and a mirror (4’) in front of the first posi-tion at the top of the gel. The divided light is focused in thegel center into a narrow band light source with the dimen-sions 500�25 �m (lateral�longitudinal). The focusingoptical system (5) is placed in a plexiglass module (Fig. 2)which is introduced into the front side of the thermoregu-lation system (12) and supports the collecting of opticalfibers. The fluorescent signal emitted by the excited DNAfragments is collected by four optical fibers (7) and guidedto the photomutipliers (9) (XP2232 RTC) after passing bylong pass filter (8). Finally, an acquisition electronic card(10) from National Instruments (Austin, Texas, USA)
Correspodence: Dr. Zahia Djouadi, Groupe Interfaces Physique-Biologie, Institut de Physique Nucléaire, 7-91406 Orsay, CedexFranceE-mail: [email protected]: +33-1-69-15-71-96
Abbreviations: BRF, biased reptation fluctuation model; BRM,biased reptation model
Electrophoresis 2001, 22, 3527–3532 3527
ª WILEY-VCH Verlag GmbH, 69451 Weinheim, 2001 0173-0835/01/1609–3527 $17.50+.50/0
Nuc
leic
acid
s
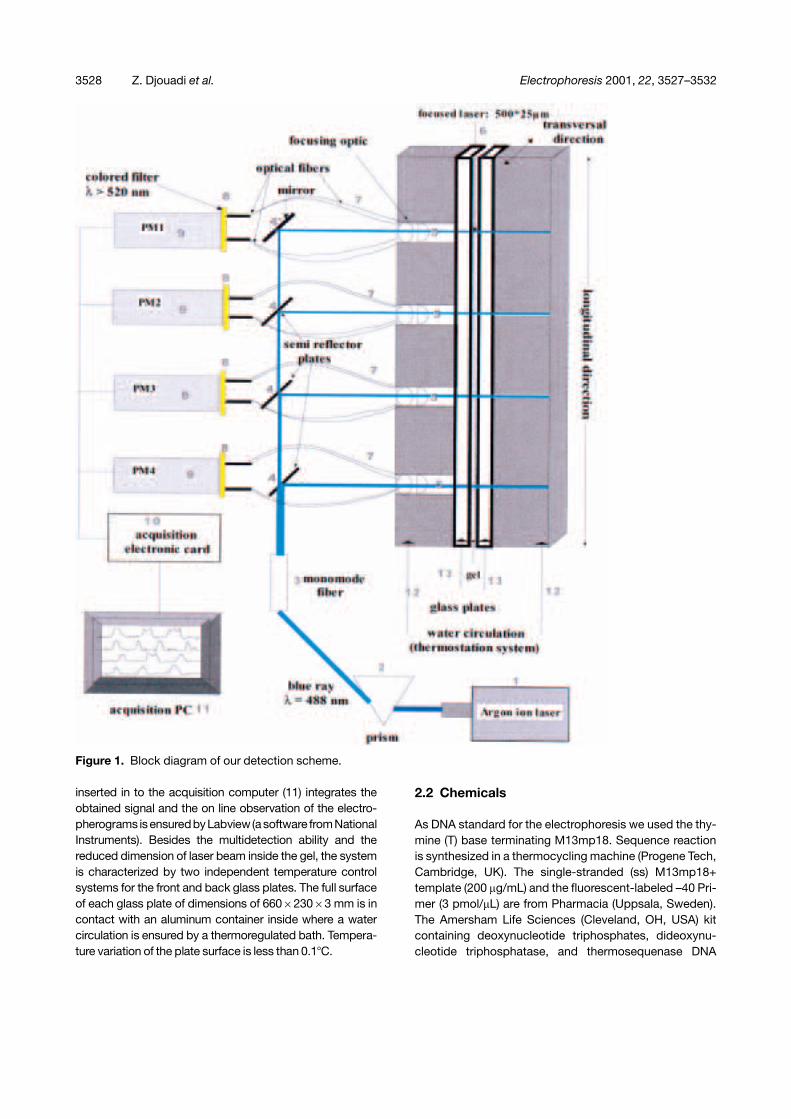
Figure 1. Block diagram of our detection scheme.
inserted in to the acquisition computer (11) integrates theobtained signal and the on line observation of the electro-pherograms isensuredbyLabview(a software fromNationalInstruments). Besides the multidetection ability and thereduced dimension of laser beam inside the gel, the systemis characterized by two independent temperature controlsystems for the front and back glass plates. The full surfaceof each glass plate of dimensions of 660�230�3 mm is incontact with an aluminum container inside where a watercirculation is ensured by a thermoregulated bath. Tempera-ture variation of the plate surface is less than 0.1�C.
2.2 Chemicals
As DNA standard for the electrophoresis we used the thy-mine (T) base terminating M13mp18. Sequence reactionis synthesized in a thermocycling machine (Progene Tech,Cambridge, UK). The single-stranded (ss) M13mp18+template (200 �g/mL) and the fluorescent-labeled –40 Pri-mer (3 pmol/�L) are from Pharmacia (Uppsala, Sweden).The Amersham Life Sciences (Cleveland, OH, USA) kitcontaining deoxynucleotide triphosphates, dideoxynu-cleotide triphosphatase, and thermosequenase DNA
3528 Z. Djouadi et al. Electrophoresis 2001, 22, 3527–3532
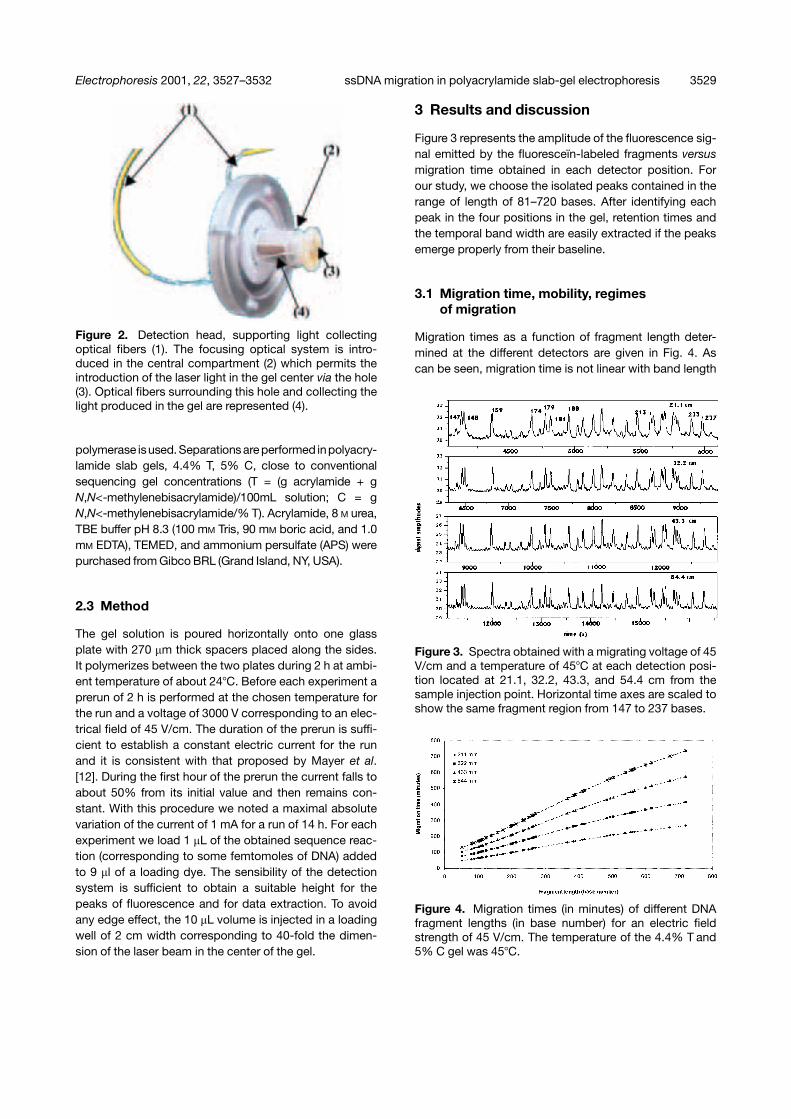
Figure 2. Detection head, supporting light collectingoptical fibers (1). The focusing optical system is intro-duced in the central compartment (2) which permits theintroduction of the laser light in the gel center via the hole(3). Optical fibers surrounding this hole and collecting thelight produced in the gel are represented (4).
polymerase isused. Separationsare performed inpolyacry-lamide slab gels, 4.4% T, 5% C, close to conventionalsequencing gel concentrations (T = (g acrylamide + gN,N<-methylenebisacrylamide)/100mL solution; C = gN,N<-methylenebisacrylamide/% T). Acrylamide, 8 M urea,TBE buffer pH 8.3 (100 mM Tris, 90 mM boric acid, and 1.0mM EDTA), TEMED, and ammonium persulfate (APS) werepurchased from Gibco BRL (Grand Island, NY, USA).
2.3 Method
The gel solution is poured horizontally onto one glassplate with 270 �m thick spacers placed along the sides.It polymerizes between the two plates during 2 h at ambi-ent temperature of about 24�C. Before each experiment aprerun of 2 h is performed at the chosen temperature forthe run and a voltage of 3000 V corresponding to an elec-trical field of 45 V/cm. The duration of the prerun is suffi-cient to establish a constant electric current for the runand it is consistent with that proposed by Mayer et al.[12]. During the first hour of the prerun the current falls toabout 50% from its initial value and then remains con-stant. With this procedure we noted a maximal absolutevariation of the current of 1 mA for a run of 14 h. For eachexperiment we load 1 �L of the obtained sequence reac-tion (corresponding to some femtomoles of DNA) addedto 9 �l of a loading dye. The sensibility of the detectionsystem is sufficient to obtain a suitable height for thepeaks of fluorescence and for data extraction. To avoidany edge effect, the 10 �L volume is injected in a loadingwell of 2 cm width corresponding to 40-fold the dimen-sion of the laser beam in the center of the gel.
3 Results and discussion
Figure 3 represents the amplitude of the fluorescence sig-nal emitted by the fluoresceïn-labeled fragments versusmigration time obtained in each detector position. Forour study, we choose the isolated peaks contained in therange of length of 81–720 bases. After identifying eachpeak in the four positions in the gel, retention times andthe temporal band width are easily extracted if the peaksemerge properly from their baseline.
3.1 Migration time, mobility, regimesof migration
Migration times as a function of fragment length deter-mined at the different detectors are given in Fig. 4. Ascan be seen, migration time is not linear with band length
Figure 3. Spectra obtained with a migrating voltage of 45V/cm and a temperature of 45�C at each detection posi-tion located at 21.1, 32.2, 43.3, and 54.4 cm from thesample injection point. Horizontal time axes are scaled toshow the same fragment region from 147 to 237 bases.
Figure 4. Migration times (in minutes) of different DNAfragment lengths (in base number) for an electric fieldstrength of 45 V/cm. The temperature of the 4.4% T and5% C gel was 45�C.
Electrophoresis 2001, 22, 3527–3532 ssDNA migration in polyacrylamide slab-gel electrophoresis 3529
and of course depends on the distance of migration. Thechanges of the curvature reflect the different regimes ofmigration [13]. Migration time is first used to determinethe band velocity. In fact, knowing the distance separat-ing two consecutive detectors (d = 111 mm), one canapproach the instantaneous velocity in each detectionposition. We first determine the average migration velo-city between the detection points i and i + 1 by Eq. (1):
� V i i�1 �� dti�1 � ti
� 1ti�1 � ti
� ti�1
tiV t� �dt (1)
where i = 1, 2, or 3. V(t) is first assumed to be a second-degree polynomial function whose coefficients are deter-mined by resolving the system of the three equationsobtained from the right side of Eq. (1). The determinationof V(t) has shown that the instantaneous velocity is notconstant during migration, a detailed discussion is givenin a previous paper [14]. Therefore, it is important to takeinto account the instantaneous values instead of meanones to determine the parameters depending on velocityor mobility.
3.2 Band width measurements and bandenlargement
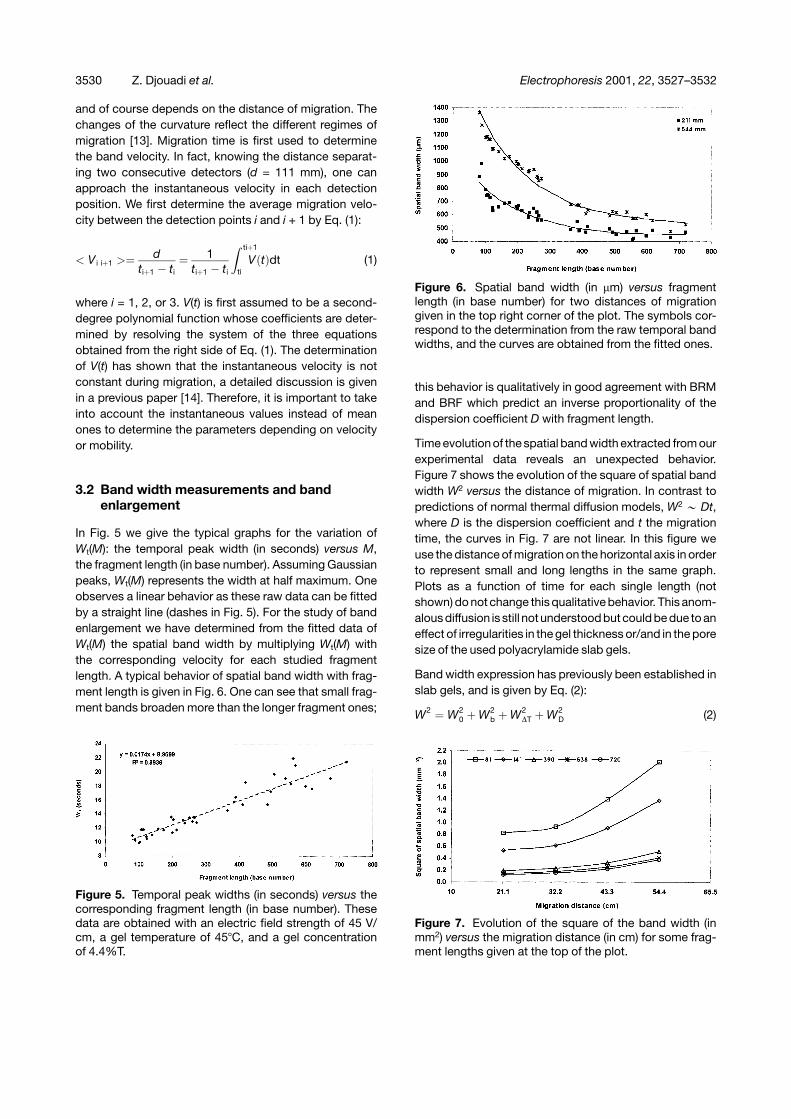
In Fig. 5 we give the typical graphs for the variation ofWt(M): the temporal peak width (in seconds) versus M,the fragment length (in base number). Assuming Gaussianpeaks, Wt(M) represents the width at half maximum. Oneobserves a linear behavior as these raw data can be fittedby a straight line (dashes in Fig. 5). For the study of bandenlargement we have determined from the fitted data ofWt(M) the spatial band width by multiplying Wt(M) withthe corresponding velocity for each studied fragmentlength. A typical behavior of spatial band width with frag-ment length is given in Fig. 6. One can see that small frag-ment bands broaden more than the longer fragment ones;
Figure 5. Temporal peak widths (in seconds) versus thecorresponding fragment length (in base number). Thesedata are obtained with an electric field strength of 45 V/cm, a gel temperature of 45�C, and a gel concentrationof 4.4%T.
Figure 6. Spatial band width (in �m) versus fragmentlength (in base number) for two distances of migrationgiven in the top right corner of the plot. The symbols cor-respond to the determination from the raw temporal bandwidths, and the curves are obtained from the fitted ones.
this behavior is qualitatively in good agreement with BRMand BRF which predict an inverse proportionality of thedispersion coefficient D with fragment length.
Time evolution of the spatial band width extracted from ourexperimental data reveals an unexpected behavior.Figure 7 shows the evolution of the square of spatial bandwidth W2 versus the distance of migration. In contrast topredictions of normal thermal diffusion models, W2 � Dt,where D is the dispersion coefficient and t the migrationtime, the curves in Fig. 7 are not linear. In this figure weuse the distance of migration on the horizontal axis in orderto represent small and long lengths in the same graph.Plots as a function of time for each single length (notshown) do not change this qualitative behavior. This anom-alous diffusion is still not understood but could be due to aneffect of irregularities in the gel thickness or/and in the poresize of the used polyacrylamide slab gels.
Band width expression has previously been established inslab gels, and is given by Eq. (2):
W2 � W20 � W2
b � W2�T � W2
D (2)
Figure 7. Evolution of the square of the band width (inmm2) versus the migration distance (in cm) for some frag-ment lengths given at the top of the plot.
3530 Z. Djouadi et al. Electrophoresis 2001, 22, 3527–3532
where W0 is the initial (loading) width, Wb is a contribu-tion due to laser beam width inside the gel, WD is theBrownian (thermal) diffusion part, and W�T is due totemperature gradient in the gel thickness. Thanks tothe multiple detection points, it is possible with our sys-tem to perform a coherent evaluation of band width dur-ing migration and extract an apparent longitudinal dis-persion coefficient. Indeed, the width measured at thefirst detector (� 20 cm from the injection point) can beused as reference starting width (W0 in Eq. 2) for broad-ening measurements. This is an important advantage forprecise measurements, since with conventional instru-ments it is only possible to estimate through severalhypothesis the starting band width from the loadingwidth of the sample in the loading well. With our sys-tem, we can obtain three enlargements for the dis-tances of 11, 22, and 33 cm of migration and deducecorresponding diffusion coefficients.
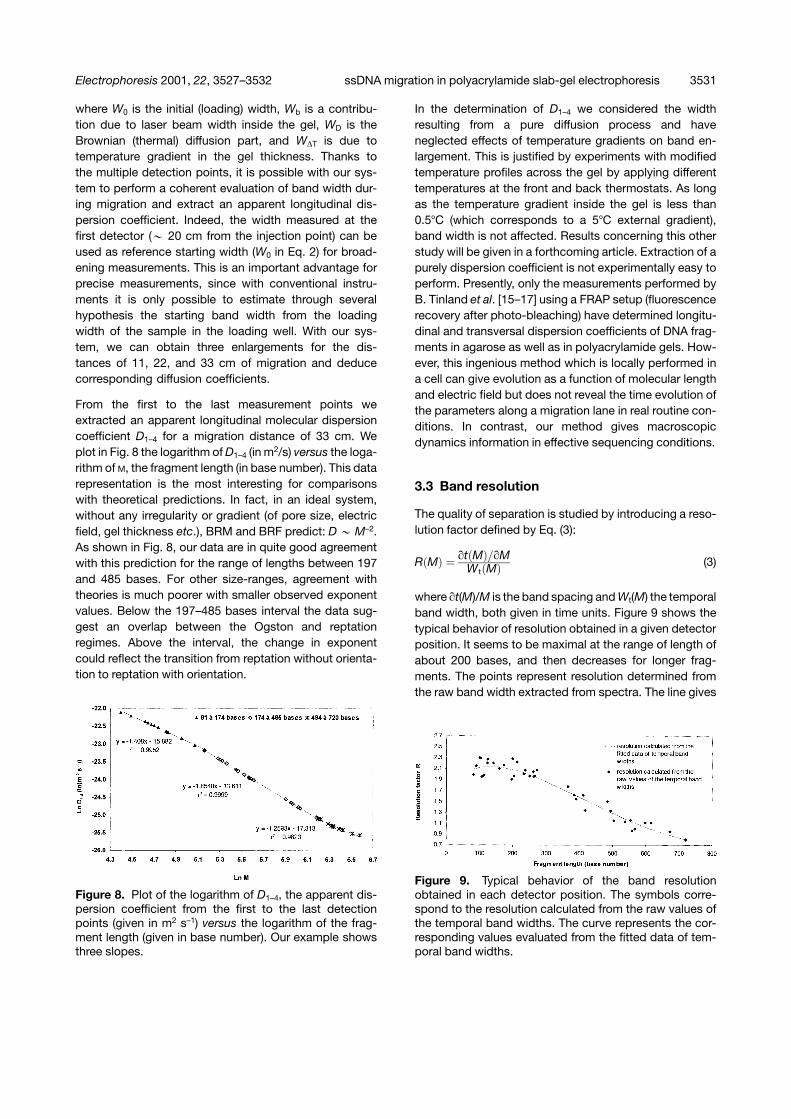
From the first to the last measurement points weextracted an apparent longitudinal molecular dispersioncoefficient D1–4 for a migration distance of 33 cm. Weplot in Fig. 8 the logarithm of D1–4 (in m2/s) versus the loga-rithm of M, the fragment length (in base number). This datarepresentation is the most interesting for comparisonswith theoretical predictions. In fact, in an ideal system,without any irregularity or gradient (of pore size, electricfield, gel thickness etc.), BRM and BRF predict: D � M–2.As shown in Fig. 8, our data are in quite good agreementwith this prediction for the range of lengths between 197and 485 bases. For other size-ranges, agreement withtheories is much poorer with smaller observed exponentvalues. Below the 197–485 bases interval the data sug-gest an overlap between the Ogston and reptationregimes. Above the interval, the change in exponentcould reflect the transition from reptation without orienta-tion to reptation with orientation.
Figure 8. Plot of the logarithm of D1–4, the apparent dis-persion coefficient from the first to the last detectionpoints (given in m2 s–1) versus the logarithm of the frag-ment length (given in base number). Our example showsthree slopes.
In the determination of D1–4 we considered the widthresulting from a pure diffusion process and haveneglected effects of temperature gradients on band en-largement. This is justified by experiments with modifiedtemperature profiles across the gel by applying differenttemperatures at the front and back thermostats. As longas the temperature gradient inside the gel is less than0.5�C (which corresponds to a 5�C external gradient),band width is not affected. Results concerning this otherstudy will be given in a forthcoming article. Extraction of apurely dispersion coefficient is not experimentally easy toperform. Presently, only the measurements performed byB. Tinland et al. [15–17] using a FRAP setup (fluorescencerecovery after photo-bleaching) have determined longitu-dinal and transversal dispersion coefficients of DNA frag-ments in agarose as well as in polyacrylamide gels. How-ever, this ingenious method which is locally performed ina cell can give evolution as a function of molecular lengthand electric field but does not reveal the time evolution ofthe parameters along a migration lane in real routine con-ditions. In contrast, our method gives macroscopicdynamics information in effective sequencing conditions.
3.3 Band resolution
The quality of separation is studied by introducing a reso-lution factor defined by Eq. (3):
R�M� � �t M� ���MWt M� � (3)
where �t(M)/M is the band spacing and Wt(M) the temporalband width, both given in time units. Figure 9 shows thetypical behavior of resolution obtained in a given detectorposition. It seems to be maximal at the range of length ofabout 200 bases, and then decreases for longer frag-ments. The points represent resolution determined fromthe raw band width extracted from spectra. The line gives
Figure 9. Typical behavior of the band resolutionobtained in each detector position. The symbols corre-spond to the resolution calculated from the raw values ofthe temporal band widths. The curve represents the cor-responding values evaluated from the fitted data of tem-poral band widths.
Electrophoresis 2001, 22, 3527–3532 ssDNA migration in polyacrylamide slab-gel electrophoresis 3531
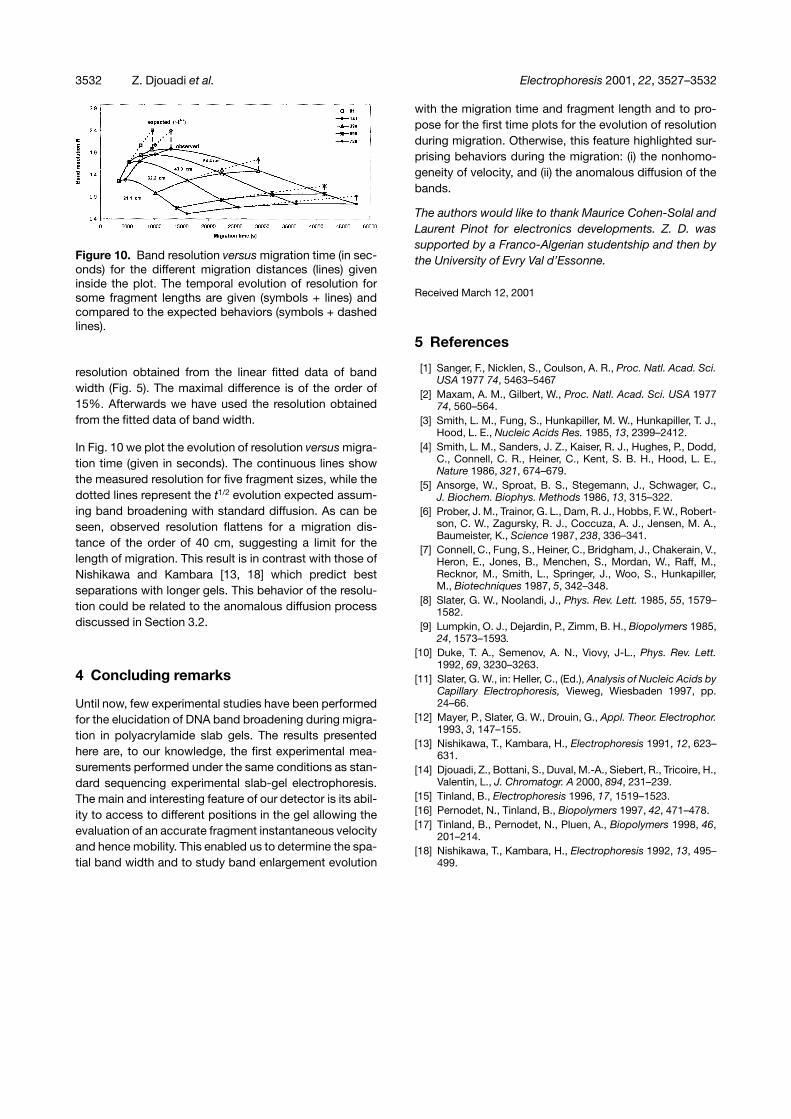
Figure 10. Band resolution versus migration time (in sec-onds) for the different migration distances (lines) giveninside the plot. The temporal evolution of resolution forsome fragment lengths are given (symbols + lines) andcompared to the expected behaviors (symbols + dashedlines).
resolution obtained from the linear fitted data of bandwidth (Fig. 5). The maximal difference is of the order of15%. Afterwards we have used the resolution obtainedfrom the fitted data of band width.
In Fig. 10 we plot the evolution of resolution versus migra-tion time (given in seconds). The continuous lines showthe measured resolution for five fragment sizes, while thedotted lines represent the t1/2 evolution expected assum-ing band broadening with standard diffusion. As can beseen, observed resolution flattens for a migration dis-tance of the order of 40 cm, suggesting a limit for thelength of migration. This result is in contrast with those ofNishikawa and Kambara [13, 18] which predict bestseparations with longer gels. This behavior of the resolu-tion could be related to the anomalous diffusion processdiscussed in Section 3.2.
4 Concluding remarks
Until now, few experimental studies have been performedfor the elucidation of DNA band broadening during migra-tion in polyacrylamide slab gels. The results presentedhere are, to our knowledge, the first experimental mea-surements performed under the same conditions as stan-dard sequencing experimental slab-gel electrophoresis.The main and interesting feature of our detector is its abil-ity to access to different positions in the gel allowing theevaluation of an accurate fragment instantaneous velocityand hence mobility. This enabled us to determine the spa-tial band width and to study band enlargement evolution
with the migration time and fragment length and to pro-pose for the first time plots for the evolution of resolutionduring migration. Otherwise, this feature highlighted sur-prising behaviors during the migration: (i) the nonhomo-geneity of velocity, and (ii) the anomalous diffusion of thebands.
The authors would like to thank Maurice Cohen-Solal andLaurent Pinot for electronics developments. Z. D. wassupported by a Franco-Algerian studentship and then bythe University of Evry Val d’Essonne.
Received March 12, 2001
5 References
[1] Sanger, F., Nicklen, S., Coulson, A. R., Proc. Natl. Acad. Sci.USA 1977 74, 5463–5467
[2] Maxam, A. M., Gilbert, W., Proc. Natl. Acad. Sci. USA 197774, 560–564.
[3] Smith, L. M., Fung, S., Hunkapiller, M. W., Hunkapiller, T. J.,Hood, L. E., Nucleic Acids Res. 1985, 13, 2399–2412.
[4] Smith, L. M., Sanders, J. Z., Kaiser, R. J., Hughes, P., Dodd,C., Connell, C. R., Heiner, C., Kent, S. B. H., Hood, L. E.,Nature 1986, 321, 674–679.
[5] Ansorge, W., Sproat, B. S., Stegemann, J., Schwager, C.,J. Biochem. Biophys. Methods 1986, 13, 315–322.
[6] Prober, J. M., Trainor, G. L., Dam, R. J., Hobbs, F. W., Robert-son, C. W., Zagursky, R. J., Coccuza, A. J., Jensen, M. A.,Baumeister, K., Science 1987, 238, 336–341.
[7] Connell, C., Fung, S., Heiner, C., Bridgham, J., Chakerain, V.,Heron, E., Jones, B., Menchen, S., Mordan, W., Raff, M.,Recknor, M., Smith, L., Springer, J., Woo, S., Hunkapiller,M., Biotechniques 1987, 5, 342–348.
[8] Slater, G. W., Noolandi, J., Phys. Rev. Lett. 1985, 55, 1579–1582.
[9] Lumpkin, O. J., Dejardin, P., Zimm, B. H., Biopolymers 1985,24, 1573–1593.
[10] Duke, T. A., Semenov, A. N., Viovy, J-L., Phys. Rev. Lett.1992, 69, 3230–3263.
[11] Slater, G. W., in: Heller, C., (Ed.), Analysis of Nucleic Acids byCapillary Electrophoresis, Vieweg, Wiesbaden 1997, pp.24–66.
[12] Mayer, P., Slater, G. W., Drouin, G., Appl. Theor. Electrophor.1993, 3, 147–155.
[13] Nishikawa, T., Kambara, H., Electrophoresis 1991, 12, 623–631.
[14] Djouadi, Z., Bottani, S., Duval, M.-A., Siebert, R., Tricoire, H.,Valentin, L., J. Chromatogr. A 2000, 894, 231–239.
[15] Tinland, B., Electrophoresis 1996, 17, 1519–1523.[16] Pernodet, N., Tinland, B., Biopolymers 1997, 42, 471–478.[17] Tinland, B., Pernodet, N., Pluen, A., Biopolymers 1998, 46,
201–214.[18] Nishikawa, T., Kambara, H., Electrophoresis 1992, 13, 495–
499.
3532 Z. Djouadi et al. Electrophoresis 2001, 22, 3527–3532