Embed Size (px)
Citation preview
Infection, Genetics and Evolution xxx (2014) xxx–xxx
Contents lists available at ScienceDirect
Infection, Genetics and Evolution
journal homepage: www.elsevier .com/locate /meegid
Erosion of quantitative host resistance in the apple � Venturia inaequalispathosystem
http://dx.doi.org/10.1016/j.meegid.2014.02.0031567-1348/� 2014 Elsevier B.V. All rights reserved.
⇑ Corresponding author at: INRA, UMR1345 Institut de Recherche en Horticultureet Semences – IRHS, SFR 4207 QUASAV, 49071 Beaucouzé Cedex, France. Tel.: +33(0)2 41 22 57 23; fax: +33 (0)2 41 22 57 55.
E-mail address: [email protected] (V. Caffier).1 Present address: INRA, UMR 1095, Genetics, Diversity and Ecophysiology of
Cereals, 63100 Clermont-Ferrand, France.
Please cite this article in press as: Caffier, V., et al. Erosion of quantitative host resistance in the apple � Venturia inaequalis pathosystem. Infect.Evol. (2014), http://dx.doi.org/10.1016/j.meegid.2014.02.003
Valérie Caffier a,b,c,⇑, Pauline Lasserre-Zuber a,b,c,1, Michel Giraud d, Matthieu Lascostes e, René Stievenard e,Arnaud Lemarquand f, Eric van de Weg g, Pascale Expert a,b,c, Caroline Denancé a,b,c, Frédérique Didelot a,b,c,Bruno Le Cam a,b,c, Charles-Eric Durel a,b,c
a INRA, UMR1345 Institut de Recherche en Horticulture et Semences – IRHS, SFR 4207 QUASAV, 49071 Beaucouzé Cedex, Franceb AgroCampus-Ouest, UMR1345 Institut de Recherche en Horticulture et Semences – IRHS, 49045 Angers, Francec Université d’Angers, UMR1345 Institut de Recherche en Horticulture et Semences – IRHS, 49045 Angers, Franced CTIFL – Centre Technique Interprofessionnel des Fruits et Légumes, Centre de Lanxade, 24130 Prigonrieux, Francee CRRG – Centre Régional de Ressources Génétiques, Ferme du Héron, 59650 Villeneuve d’Ascq, Francef INRA, Unité Expérimentale Horticole N�34 0449, Centre d’Angers-Nantes, 49071 Beaucouzé Cedex, Franceg Plant Breeding, Wageningen University and Research Centre, Droevendaalsesteeg 1, P.O. Box 16, 6700 AA Wageningen, The Netherlands
a r t i c l e i n f o
Article history:Available online xxxx
Keywords:Partial resistanceAggressivenessApple scabMalus � domesticaDurabilityEpistasis
a b s t r a c t
Theoretical approaches predict that host quantitative resistance selects for pathogens with a high level ofpathogenicity, leading to erosion of the resistance. This process of erosion has, however, rarely beenexperimentally demonstrated. To investigate the erosion of apple quantitative resistance to scab disease,we surveyed scab incidence over time in a network of three orchards planted with susceptible and quan-titatively resistant apple genotypes. We sampled Venturia inaequalis isolates from two of these orchardsat the beginning of the experiment and we tested their quantitative components of pathogenicity (i.e.,global disease severity, lesion density, lesion size, latent period) under controlled conditions. The diseaseseverity produced by the isolates on the quantitatively resistant apple genotypes differed between thesites. Our study showed that quantitative resistance may be subject to erosion and even complete break-down, depending on the site. We observed this evolution over time for apple genotypes that combine twobroad-spectrum scab resistance QTLs, F11 and F17, showing a significant synergic effect of this combina-tion in favour of resistance (i.e., favourable epistatic effect). We showed that isolates sampled in the orch-ard where the resistance was inefficient presented a similar level of pathogenicity on both applegenotypes with quantitative resistance and susceptible genotypes. As a consequence, our results revealeda case where the use of quantitative resistance may result in the emergence of a generalist pathogen pop-ulation that has extended its pathogenicity range by performing similarly on susceptible and resistantgenotypes. This emphasizes the need to develop quantitative resistances conducive to trade-offs withinthe pathogen populations concerned.
� 2014 Elsevier B.V. All rights reserved.
1. Introduction
Plant genetic resistance to pathogens offers an interesting alter-native to disease control methods based on the use of pesticides,but lacks durability due to the rapid evolution of pathogen popula-tions. Pathogen populations are able to adapt, frequently resulting
in the breakdown of the resistance in the case of major resistancegenes faced with the qualitative component of pathogenicity, i.e.,the ability of a pathogen to infect a plant. Quantitative resistancebased on quantitative trait loci (QTL) induces a partial reductionof pathogen development. Various mechanisms may underliequantitative resistance, including basal defence, chemical warfare,defence signal transduction or weaker forms of major resistancegenes (Poland et al., 2009), and quantitative resistance may eitherbe specific to some isolates of a pathogen or be broad-spectrum(i.e., efficient against all isolates of a pathogen). Quantitative resis-tance affects quantitative components of pathogenicity (e.g., rate ofinfection, latent period, rate of sporulation), which are dependenton the host, the pathogen and the interaction between host and
Genet.
Table 1Description of the apple genotypes of cv. Prima x cv. Fiesta progeny used in thepresent study.
Class Applegenotype
Orchard Pathogenicitytest (1)
Pathogenicitytest (2)
Class0 J25 x x xJ32 xJ51 xJ61 xJ108 xJ119 x xJ150 x
ClassF11 J66 x x xJ151 xJ153 x x
ClassF17 J99 x xJ160 x x x
ClassF11F17 J28 xJ63 x x xJ80 x xJ115 x
x used in the orchard or pathogenicity test.
2 V. Caffier et al. / Infection, Genetics and Evolution xxx (2014) xxx–xxx
pathogen (Lannou, 2012). Quantitative resistance is frequently as-sumed to be more durable than qualitative resistance (Parlevliet,2002), which has been experimentally shown, for example, in thecase of wheat leaf rust on the cultivar, ‘Apache’ (Papaix et al.,2011). However, isolates sampled from partial resistant cultivarscan induce a higher amount of disease on partial resistant cultivarsthan isolates sampled on susceptible ones, as observed for Mycosp-haerella graminicola on wheat (Cowger and Mundt, 2002), Phytoph-thora infestans on potato (Flier et al., 2003; Andrivon et al., 2007;Montarry et al., 2008) and Plasmopara viticola on grapevine (Del-motte et al., 2013). Over several generations, quantitative resis-tance can select for isolates with an increased rate of infection, ashortened latent period or an increased size of lesions, as shownfor Blumeria graminis f.sp. hordei on barley, Puccinia recondita f.sp.tritici on wheat, and Cochliobolus heterostrophus on maize (Kolmerand Leonard, 1986; Newton and McGurk, 1991; Lehman andShaner, 1997, 2007), respectively. Experiments using isolatesinoculated in mixtures on different partially resistant cultivarscan result in a modification of the isolate frequencies accordingto the host (Zhan et al., 2002; Lê Van et al., 2013). Thus, directionalselection might also occur in pathogen populations that infectcultivars with quantitative resistance but at a slower rate than inpathogen populations that infect cultivars carrying major resis-tance genes (Gould et al., 1991; Zhan et al., 2002; Sommerhalderet al., 2011). This is in agreement with simulation models (Gandonand Michalakis, 2000; McDonald and Linde, 2002), suggesting thatquantitative resistance may select for isolates with a high level ofpathogenicity due to within-host competition, which may lead toerosion of the resistance.
Even if differential efficiencies of quantitative resistance havebeen shown among sites (Andrivon et al., 2007) and among path-ogen isolates (Talukder et al., 2004; Le Guen et al., 2007; Marcelet al., 2008; Delmotte et al., 2013), the erosion of quantitative resis-tance at one site over time has rarely been demonstrated (Mundtet al., 2002). It is indeed difficult to detect gradual changes in effi-ciencies of quantitative resistance (McDonald and Linde, 2002),since these efficiencies are influenced by environmental conditions(Young, 1996; Pariaud et al., 2009; Lannou, 2012). As for the man-agement of cultivars in space and time, it is crucial to determine ifthe process of erosion induces higher, lower or similar levels ofpathogenicity on susceptible plants. For wheat leaf rust (Lehmanand Shaner, 1997) and potato late blight (Andrivon et al., 2007),isolates that were well adapted to a quantitative resistance pre-sented a reduced level of pathogenicity on susceptible hosts orother quantitatively resistant hosts. In such cases, the pathogenpopulation is composed of several specialised isolates (i.e., ‘special-ists’). Each specialist has a higher multiplication rate on its host oforigin (i.e., specific interactions between host and pathogen). Incontrast, in the case of a broad-spectrum quantitative resistancewith no specific interaction between host and pathogen, theoreti-cal modelling (Gandon and Michalakis, 2000) predicted that suchresistance selects for isolates able to produce a higher level of dis-ease, i.e., the isolates that are well adapted to the susceptible hostsare also well adapted to the quantitatively resistant hosts. In such acase, the pathogen population would consist of a ‘generalist’ with ahigh multiplication rate on all hosts, but this has not yet been ade-quately experimentally documented.
In our study, we investigated the erosion of apple quantitativeresistance to scab caused by the fungus Venturia inaequalis, whichhas a high evolutionary potential (Gladieux et al., 2008; Bus et al.,2011; Lê Van et al., 2012). Many quantitative resistance factors toscab have been identified in apple (Durel et al., 2003; Liebhardet al., 2003; Calenge et al., 2004; Soufflet-Freslon et al., 2008),either broad-spectrum or specific. Our aims were (1) to comparequantitative components of pathogenicity of V. inaequalis popula-tions towards two broad-spectrum quantitative resistance factors
Please cite this article in press as: Caffier, V., et al. Erosion of quantitative hosEvol. (2014), http://dx.doi.org/10.1016/j.meegid.2014.02.003
(alone or in combination) at different sites, (2) to test the hypoth-esis that the isolates with a high level of pathogenicity on quanti-tative resistance also have a high level of pathogenicity onsusceptible hosts, and (3) to compare the erosion of the quantita-tive resistances in three sites over an 8-year period.
2. Materials and methods
2.1. Orchard network
We used progenies of the cross between cv. Prima and cv. Fiesta(referred to as the ‘‘J progeny’’) produced by the former CPRO-DLO,which is now part of Wageningen-UR Plant Breeding, The Nether-lands (Maliepaard et al., 1998). This progeny segregates for the twomajor genes, Rvi1 (=Vg) and Rvi6 (=Vf), present in cv. Prima at theheterozygous state (Maliepaard et al., 1998; Durel et al., 2000),and for two broad-spectrum QTLs on linkage groups 11 and 17 (re-ferred to as F11 and F17 in the present study) detected in cv. Fiestaboth in the greenhouse and in the field (Durel et al., 2003, 2004;Liebhard et al., 2003). Using molecular markers (Maliepaardet al., 1998; Schouten et al., 2012), we selected 16 apple genotypes(Table 1) that carried either no resistant allele for both QTLs(Class0 = both QTLs at the homozygous ‘susceptible/susceptible’state), only one resistant allele for QTL F11 (ClassF11 = QTL F11at the heterozygous ‘resistant/susceptible’ state while QTL F17 isat the homozygous susceptible state), only one resistant allele forQTL F17 (ClassF17 = QTL F17 at the heterozygous ‘resistant/suscep-tible’ state while QTL F11 is at the homozygous susceptible state),or two resistant alleles, one for each of the QTLs, F11 and F17(ClassF11F17 = both QTLs F11 and F17 at the heterozygous ‘resis-tant/susceptible’ state), from the 161 progenies. The selected geno-types did not carry the major resistance genes Rvi1 or Rvi6. For thesake of simplicity, ‘‘presence/absence of the favourable allele of agiven QTL’’ is indicated by ‘‘presence/absence of the QTL’’ in thetext.
Each genotype was grafted onto the apple rootstock, ‘Pajam 2’,and planted in an orchard network. This network was composedof three orchards located at three sites at a distance of more than300 km from each other, representing three different environ-ments and climates (Lanxade in South-Western France, Angers inNorth-Western France, and Villeneuve d’Ascq in Northern France,referred to as ‘‘Villeneuve’’ in the text). One replicate per genotypewas planted in a randomised three-block design in each orchard.
t resistance in the apple � Venturia inaequalis pathosystem. Infect. Genet.
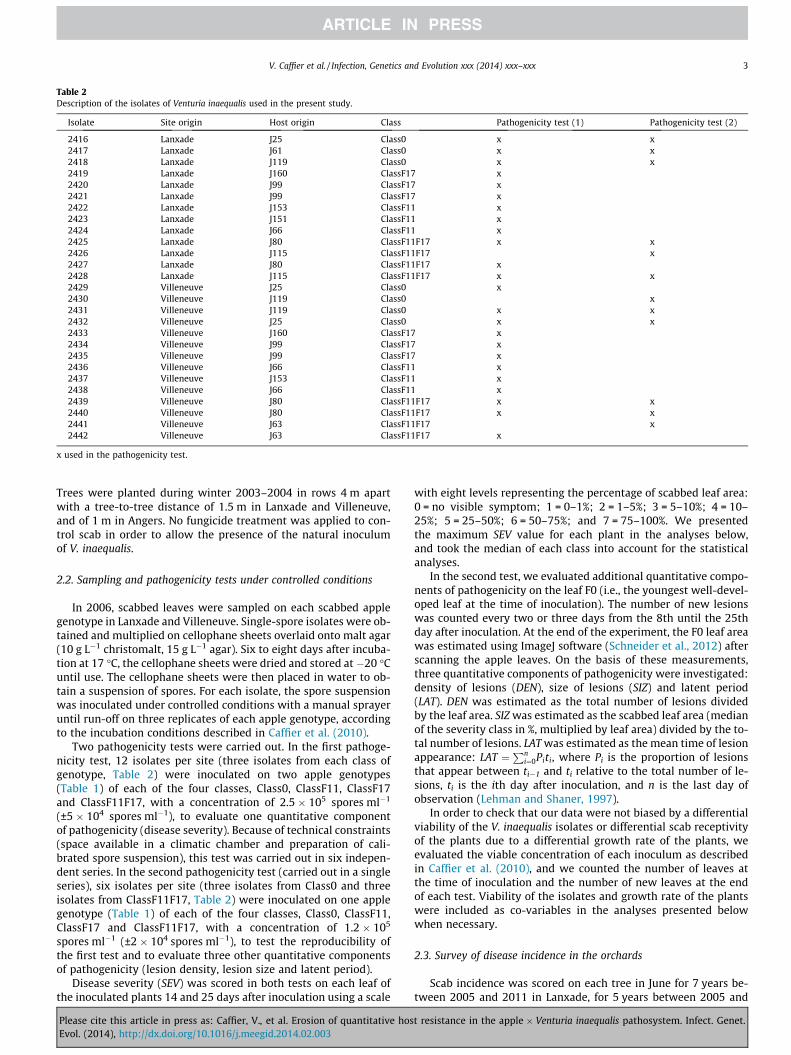
Table 2Description of the isolates of Venturia inaequalis used in the present study.
Isolate Site origin Host origin Class Pathogenicity test (1) Pathogenicity test (2)
2416 Lanxade J25 Class0 x x2417 Lanxade J61 Class0 x x2418 Lanxade J119 Class0 x x2419 Lanxade J160 ClassF17 x2420 Lanxade J99 ClassF17 x2421 Lanxade J99 ClassF17 x2422 Lanxade J153 ClassF11 x2423 Lanxade J151 ClassF11 x2424 Lanxade J66 ClassF11 x2425 Lanxade J80 ClassF11F17 x x2426 Lanxade J115 ClassF11F17 x2427 Lanxade J80 ClassF11F17 x2428 Lanxade J115 ClassF11F17 x x2429 Villeneuve J25 Class0 x2430 Villeneuve J119 Class0 x2431 Villeneuve J119 Class0 x x2432 Villeneuve J25 Class0 x x2433 Villeneuve J160 ClassF17 x2434 Villeneuve J99 ClassF17 x2435 Villeneuve J99 ClassF17 x2436 Villeneuve J66 ClassF11 x2437 Villeneuve J153 ClassF11 x2438 Villeneuve J66 ClassF11 x2439 Villeneuve J80 ClassF11F17 x x2440 Villeneuve J80 ClassF11F17 x x2441 Villeneuve J63 ClassF11F17 x2442 Villeneuve J63 ClassF11F17 x
x used in the pathogenicity test.
V. Caffier et al. / Infection, Genetics and Evolution xxx (2014) xxx–xxx 3
Trees were planted during winter 2003–2004 in rows 4 m apartwith a tree-to-tree distance of 1.5 m in Lanxade and Villeneuve,and of 1 m in Angers. No fungicide treatment was applied to con-trol scab in order to allow the presence of the natural inoculumof V. inaequalis.
2.2. Sampling and pathogenicity tests under controlled conditions
In 2006, scabbed leaves were sampled on each scabbed applegenotype in Lanxade and Villeneuve. Single-spore isolates were ob-tained and multiplied on cellophane sheets overlaid onto malt agar(10 g L�1 christomalt, 15 g L�1 agar). Six to eight days after incuba-tion at 17 �C, the cellophane sheets were dried and stored at �20 �Cuntil use. The cellophane sheets were then placed in water to ob-tain a suspension of spores. For each isolate, the spore suspensionwas inoculated under controlled conditions with a manual sprayeruntil run-off on three replicates of each apple genotype, accordingto the incubation conditions described in Caffier et al. (2010).
Two pathogenicity tests were carried out. In the first pathoge-nicity test, 12 isolates per site (three isolates from each class ofgenotype, Table 2) were inoculated on two apple genotypes(Table 1) of each of the four classes, Class0, ClassF11, ClassF17and ClassF11F17, with a concentration of 2.5 � 105 spores ml�1
(±5 � 104 spores ml�1), to evaluate one quantitative componentof pathogenicity (disease severity). Because of technical constraints(space available in a climatic chamber and preparation of cali-brated spore suspension), this test was carried out in six indepen-dent series. In the second pathogenicity test (carried out in a singleseries), six isolates per site (three isolates from Class0 and threeisolates from ClassF11F17, Table 2) were inoculated on one applegenotype (Table 1) of each of the four classes, Class0, ClassF11,ClassF17 and ClassF11F17, with a concentration of 1.2 � 105
spores ml�1 (±2 � 104 spores ml�1), to test the reproducibility ofthe first test and to evaluate three other quantitative componentsof pathogenicity (lesion density, lesion size and latent period).
Disease severity (SEV) was scored in both tests on each leaf ofthe inoculated plants 14 and 25 days after inoculation using a scale
Please cite this article in press as: Caffier, V., et al. Erosion of quantitative hosEvol. (2014), http://dx.doi.org/10.1016/j.meegid.2014.02.003
with eight levels representing the percentage of scabbed leaf area:0 = no visible symptom; 1 = 0–1%; 2 = 1–5%; 3 = 5–10%; 4 = 10–25%; 5 = 25–50%; 6 = 50–75%; and 7 = 75–100%. We presentedthe maximum SEV value for each plant in the analyses below,and took the median of each class into account for the statisticalanalyses.
In the second test, we evaluated additional quantitative compo-nents of pathogenicity on the leaf F0 (i.e., the youngest well-devel-oped leaf at the time of inoculation). The number of new lesionswas counted every two or three days from the 8th until the 25thday after inoculation. At the end of the experiment, the F0 leaf areawas estimated using ImageJ software (Schneider et al., 2012) afterscanning the apple leaves. On the basis of these measurements,three quantitative components of pathogenicity were investigated:density of lesions (DEN), size of lesions (SIZ) and latent period(LAT). DEN was estimated as the total number of lesions dividedby the leaf area. SIZ was estimated as the scabbed leaf area (medianof the severity class in %, multiplied by leaf area) divided by the to-tal number of lesions. LAT was estimated as the mean time of lesionappearance: LAT ¼
Pni¼0Piti, where Pi is the proportion of lesions
that appear between ti�1 and ti relative to the total number of le-sions, ti is the ith day after inoculation, and n is the last day ofobservation (Lehman and Shaner, 1997).
In order to check that our data were not biased by a differentialviability of the V. inaequalis isolates or differential scab receptivityof the plants due to a differential growth rate of the plants, weevaluated the viable concentration of each inoculum as describedin Caffier et al. (2010), and we counted the number of leaves atthe time of inoculation and the number of new leaves at the endof each test. Viability of the isolates and growth rate of the plantswere included as co-variables in the analyses presented belowwhen necessary.
2.3. Survey of disease incidence in the orchards
Scab incidence was scored on each tree in June for 7 years be-tween 2005 and 2011 in Lanxade, for 5 years between 2005 and
t resistance in the apple � Venturia inaequalis pathosystem. Infect. Genet.
4 V. Caffier et al. / Infection, Genetics and Evolution xxx (2014) xxx–xxx
2012 in Angers, and for 3 years between 2005 and 2008 in Ville-neuve, as the percentage of infected leaves on the whole tree.The scoring scale was an ordinal scale adapted from Lateur andPopuler (1994), with nine levels of disease incidence, describedas intervals around the following values of disease percentage:0%, 1%, 3%, 12.5%, 25%, 37.5%, 50%, 75% and 90%. Two annotators,one standing on each side of the tree, agreed on a common scorefor each tree.
2.4. Statistical analysis
2.4.1. Test of pathogenicity (isolates sampled in 2006)First, for each site, the variation of each quantitative component
(SEV for the first test; SEV, DEN, SIZ and LAT for the second test) onthe classes of genotypes was explored using an ANOVA with twoexplanatory factors (‘genotype class’ and ‘isolate’) and theirinteraction. For the first test, ‘genotype’ and ‘series’ were includedas additional factors. When the ‘genotype class’ had a significanteffect, the means of each class were compared with a Tukey test.
Then, for each class of genotypes, the effect of the site of originof the isolates (Lanxade or Villeneuve) on the quantitative compo-nents of pathogenicity of the isolates (SEV for the first test; SEV,DEN, SIZ and LAT for the second test) was tested using a linearmixed effect model (LME). The ‘isolate’ factor was treated as a ran-dom factor nested within the ‘site’ factor. For the first test, the‘genotype’ and ‘series’ factors were included in the analysis. Themodel was fitted by maximising the log-likelihood. DEN was in-cluded as a co-variable in the models for the analysis of SIZ andLAT since lesion density can affect these components (Pariaudet al., 2009).
Finally, for each site, the relationships between disease severityof the isolates assessed on each of the resistant classes (ClassF11,ClassF17 and ClassF11F17) and disease severity of the same iso-lates assessed on Class0 were evaluated with linear regressionanalyses.
2.4.2. Survey of disease incidence in the orchardsFirst, the disease incidence on Class0 was compared among the
three sites for each of the years 2005, 2006 and 2008, using an AN-OVA with three factors, ‘site’, ‘genotype’ and ‘block’, and theirinteractions. When the ‘site’ factor had a significant effect, themeans of the three sites were compared with a Tukey test.
The disease incidence within each site was then comparedamong the four classes of genotypes for each year using a linearmixed effect model (LME). The ‘genotype’ was treated as a randomfactor nested in the class of genotypes, with ‘block’ as a fixed factor.The model was fitted by maximising the log-likelihood. The inter-action effects between QTLs F11 and F17 were also tested withineach site and year in an ANOVA where the presence/absence ofeach QTL and their interaction were considered as factors.
Finally, since the disease incidence on Class0 fluctuated fromyear to year at each site, the relative disease incidence of each treewas divided by the mean of disease incidence on all genotypesfrom Class0 of each year at each site. In order to evaluate if the effi-ciency of the resistance decreased over time, the evolution of rela-tive disease incidence over time was analysed by a generalisedleast squares model (GLS) for each site to estimate the parametersof the linear regression, taking autocorrelations between the obser-vations into account when necessary. In this model, we tested theeffects of ‘year’, ‘genotype’, ‘block’ and interaction between ‘year’and ‘genotype’ for each class (ClassF11, ClassF17 and ClassF11F17).
For all of these statistical analyses, the data were submitted toarcsine square root transformation to normalise and homogenisethe residuals when necessary. All statistical analyses were per-formed with R software, version 2.15.2 (R Core Team, 2012), using
Please cite this article in press as: Caffier, V., et al. Erosion of quantitative hosEvol. (2014), http://dx.doi.org/10.1016/j.meegid.2014.02.003
the ‘Rcmdr’ package (Fox, 2005) and the ‘nlme’ package (Pinheiroet al., 2012).
3. Results
3.1. Characterisation of the pathogenicity of V. inaequalis populationsin 2006 in Lanxade and Villeneuve
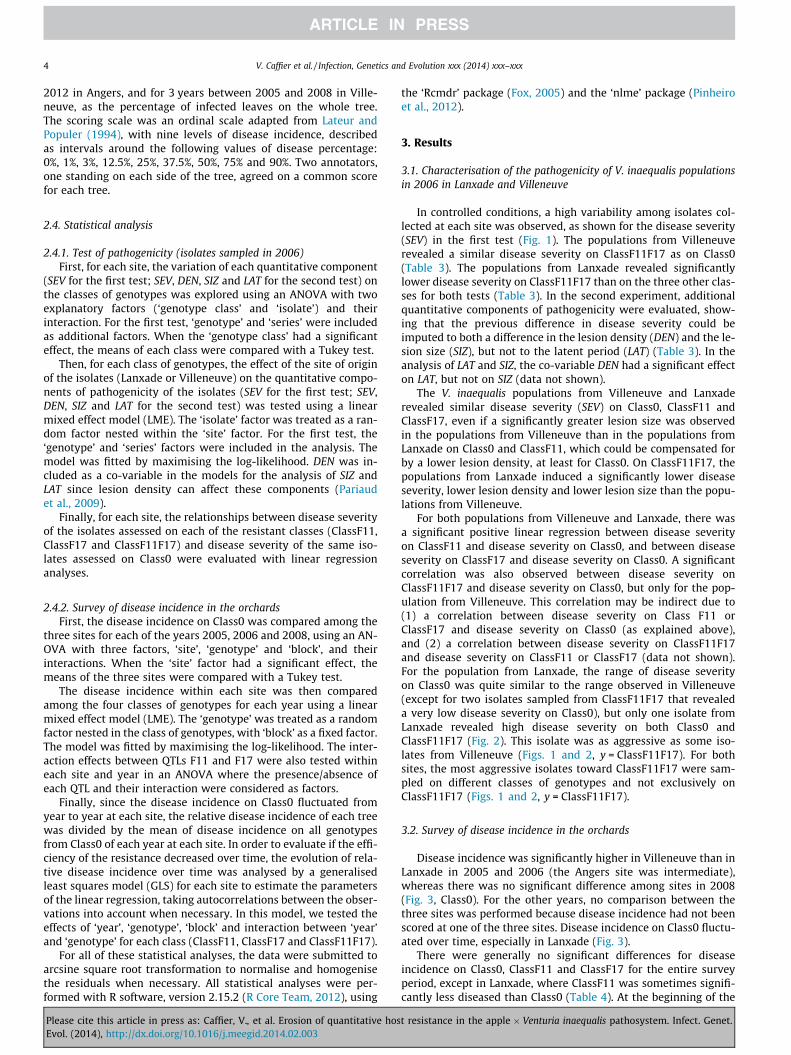
In controlled conditions, a high variability among isolates col-lected at each site was observed, as shown for the disease severity(SEV) in the first test (Fig. 1). The populations from Villeneuverevealed a similar disease severity on ClassF11F17 as on Class0(Table 3). The populations from Lanxade revealed significantlylower disease severity on ClassF11F17 than on the three other clas-ses for both tests (Table 3). In the second experiment, additionalquantitative components of pathogenicity were evaluated, show-ing that the previous difference in disease severity could beimputed to both a difference in the lesion density (DEN) and the le-sion size (SIZ), but not to the latent period (LAT) (Table 3). In theanalysis of LAT and SIZ, the co-variable DEN had a significant effecton LAT, but not on SIZ (data not shown).
The V. inaequalis populations from Villeneuve and Lanxaderevealed similar disease severity (SEV) on Class0, ClassF11 andClassF17, even if a significantly greater lesion size was observedin the populations from Villeneuve than in the populations fromLanxade on Class0 and ClassF11, which could be compensated forby a lower lesion density, at least for Class0. On ClassF11F17, thepopulations from Lanxade induced a significantly lower diseaseseverity, lower lesion density and lower lesion size than the popu-lations from Villeneuve.
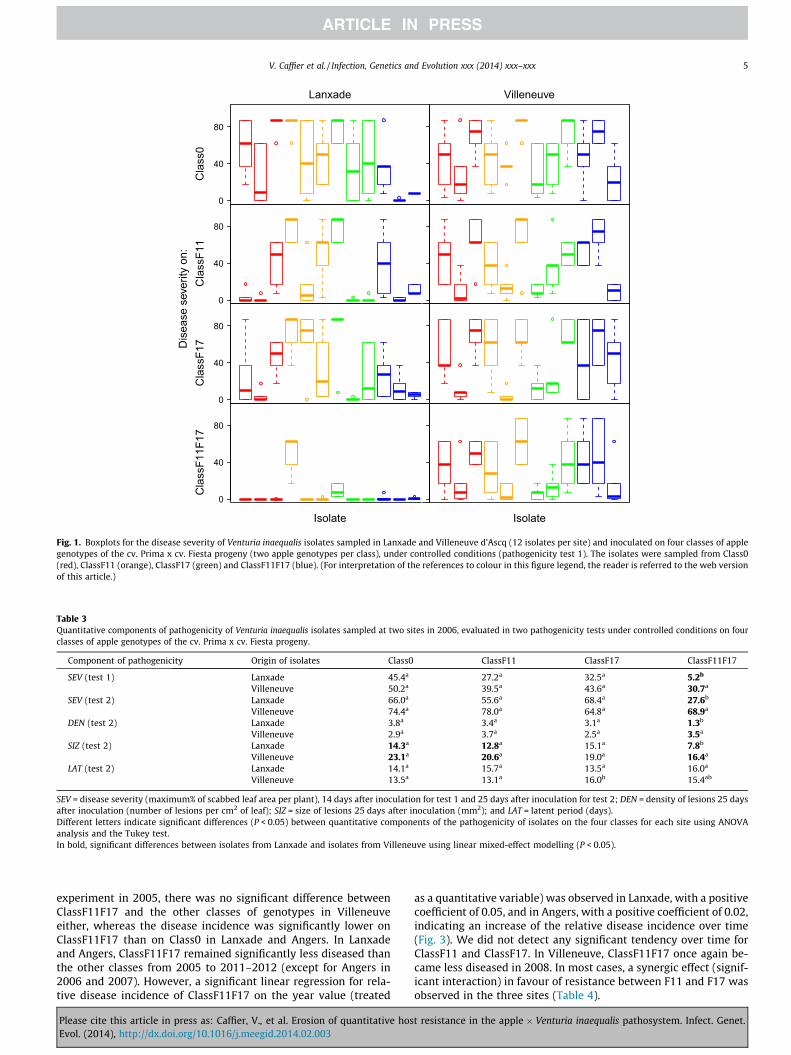
For both populations from Villeneuve and Lanxade, there wasa significant positive linear regression between disease severityon ClassF11 and disease severity on Class0, and between diseaseseverity on ClassF17 and disease severity on Class0. A significantcorrelation was also observed between disease severity onClassF11F17 and disease severity on Class0, but only for the pop-ulation from Villeneuve. This correlation may be indirect due to(1) a correlation between disease severity on Class F11 orClassF17 and disease severity on Class0 (as explained above),and (2) a correlation between disease severity on ClassF11F17and disease severity on ClassF11 or ClassF17 (data not shown).For the population from Lanxade, the range of disease severityon Class0 was quite similar to the range observed in Villeneuve(except for two isolates sampled from ClassF11F17 that revealeda very low disease severity on Class0), but only one isolate fromLanxade revealed high disease severity on both Class0 andClassF11F17 (Fig. 2). This isolate was as aggressive as some iso-lates from Villeneuve (Figs. 1 and 2, y = ClassF11F17). For bothsites, the most aggressive isolates toward ClassF11F17 were sam-pled on different classes of genotypes and not exclusively onClassF11F17 (Figs. 1 and 2, y = ClassF11F17).
3.2. Survey of disease incidence in the orchards
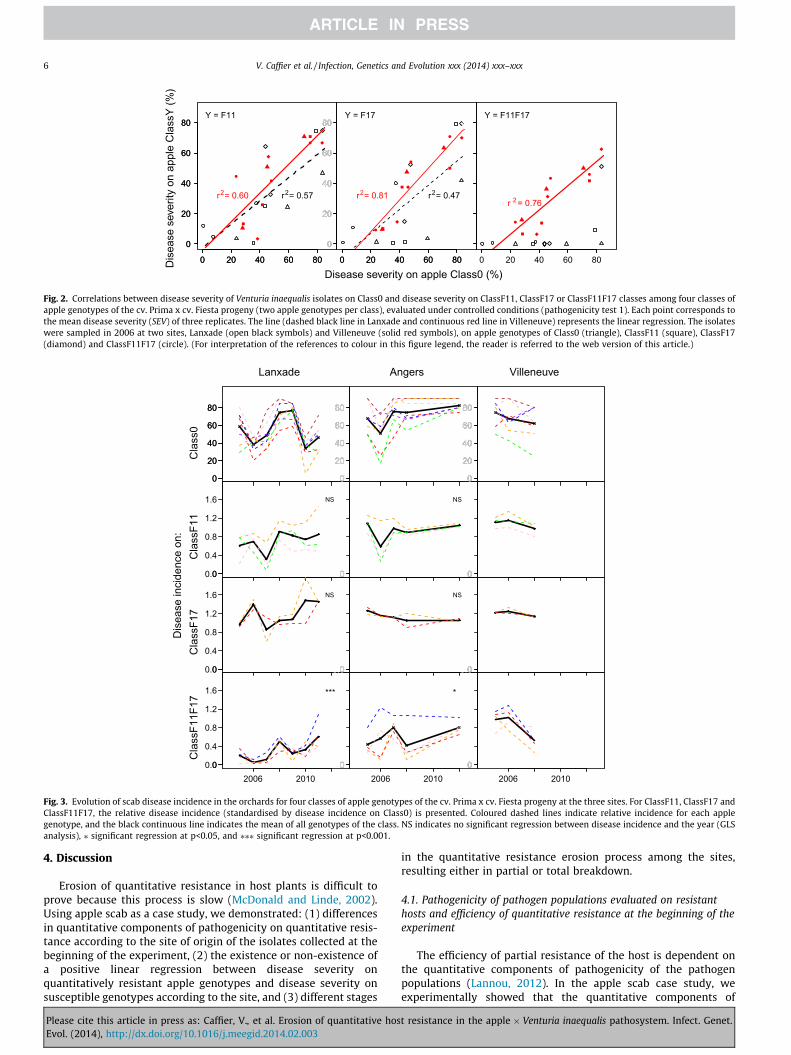
Disease incidence was significantly higher in Villeneuve than inLanxade in 2005 and 2006 (the Angers site was intermediate),whereas there was no significant difference among sites in 2008(Fig. 3, Class0). For the other years, no comparison between thethree sites was performed because disease incidence had not beenscored at one of the three sites. Disease incidence on Class0 fluctu-ated over time, especially in Lanxade (Fig. 3).
There were generally no significant differences for diseaseincidence on Class0, ClassF11 and ClassF17 for the entire surveyperiod, except in Lanxade, where ClassF11 was sometimes signifi-cantly less diseased than Class0 (Table 4). At the beginning of the
t resistance in the apple � Venturia inaequalis pathosystem. Infect. Genet.
0
40
80
Cla
ss0
Lanxade
0
40
80
Cla
ssF1
1D
isea
se s
ever
ity o
n:
0
40
80
Cla
ssF1
7
0
40
80
Cla
ssF1
1F17
Isolate
0
40
80
Villeneuve
0
40
80
0
40
80
0
40
80
Isolate
Fig. 1. Boxplots for the disease severity of Venturia inaequalis isolates sampled in Lanxade and Villeneuve d’Ascq (12 isolates per site) and inoculated on four classes of applegenotypes of the cv. Prima x cv. Fiesta progeny (two apple genotypes per class), under controlled conditions (pathogenicity test 1). The isolates were sampled from Class0(red), ClassF11 (orange), ClassF17 (green) and ClassF11F17 (blue). (For interpretation of the references to colour in this figure legend, the reader is referred to the web versionof this article.)
Table 3Quantitative components of pathogenicity of Venturia inaequalis isolates sampled at two sites in 2006, evaluated in two pathogenicity tests under controlled conditions on fourclasses of apple genotypes of the cv. Prima x cv. Fiesta progeny.
Component of pathogenicity Origin of isolates Class0 ClassF11 ClassF17 ClassF11F17
SEV (test 1) Lanxade 45.4a 27.2a 32.5a 5.2b
Villeneuve 50.2a 39.5a 43.6a 30.7a
SEV (test 2) Lanxade 66.0a 55.6a 68.4a 27.6b
Villeneuve 74.4a 78.0a 64.8a 68.9a
DEN (test 2) Lanxade 3.8a 3.4a 3.1a 1.3b
Villeneuve 2.9a 3.7a 2.5a 3.5a
SIZ (test 2) Lanxade 14.3a 12.8a 15.1a 7.8b
Villeneuve 23.1a 20.6a 19.0a 16.4a
LAT (test 2) Lanxade 14.1a 15.7a 13.5a 16.0a
Villeneuve 13.5a 13.1a 16.0b 15.4ab
SEV = disease severity (maximum% of scabbed leaf area per plant), 14 days after inoculation for test 1 and 25 days after inoculation for test 2; DEN = density of lesions 25 daysafter inoculation (number of lesions per cm2 of leaf); SIZ = size of lesions 25 days after inoculation (mm2); and LAT = latent period (days).Different letters indicate significant differences (P < 0.05) between quantitative components of the pathogenicity of isolates on the four classes for each site using ANOVAanalysis and the Tukey test.In bold, significant differences between isolates from Lanxade and isolates from Villeneuve using linear mixed-effect modelling (P < 0.05).
V. Caffier et al. / Infection, Genetics and Evolution xxx (2014) xxx–xxx 5
experiment in 2005, there was no significant difference betweenClassF11F17 and the other classes of genotypes in Villeneuveeither, whereas the disease incidence was significantly lower onClassF11F17 than on Class0 in Lanxade and Angers. In Lanxadeand Angers, ClassF11F17 remained significantly less diseased thanthe other classes from 2005 to 2011–2012 (except for Angers in2006 and 2007). However, a significant linear regression for rela-tive disease incidence of ClassF11F17 on the year value (treated
Please cite this article in press as: Caffier, V., et al. Erosion of quantitative hosEvol. (2014), http://dx.doi.org/10.1016/j.meegid.2014.02.003
as a quantitative variable) was observed in Lanxade, with a positivecoefficient of 0.05, and in Angers, with a positive coefficient of 0.02,indicating an increase of the relative disease incidence over time(Fig. 3). We did not detect any significant tendency over time forClassF11 and ClassF17. In Villeneuve, ClassF11F17 once again be-came less diseased in 2008. In most cases, a synergic effect (signif-icant interaction) in favour of resistance between F11 and F17 wasobserved in the three sites (Table 4).
t resistance in the apple � Venturia inaequalis pathosystem. Infect. Genet.
0 20 40 60 80
0
20
40
60
80
0 20 40 60 80
0
20
40
60
80
Dis
ease
sev
erity
on
appl
e C
lass
Y (%
)
Y = F11
r = 0.60 2 r = 0.57 2
0 20 40 60 80
0
20
40
60
80
0 20 40 60 80
0
20
40
60
80
Disease severity on apple Class0 (%)
Y = F17
r = 0.81 2 r = 0.47 2
0 20 40 60 80
0
20
40
60
80
0 20 40 60 80
0
20
40
60
80Y = F11F17
r = 0.76 2
Fig. 2. Correlations between disease severity of Venturia inaequalis isolates on Class0 and disease severity on ClassF11, ClassF17 or ClassF11F17 classes among four classes ofapple genotypes of the cv. Prima x cv. Fiesta progeny (two apple genotypes per class), evaluated under controlled conditions (pathogenicity test 1). Each point corresponds tothe mean disease severity (SEV) of three replicates. The line (dashed black line in Lanxade and continuous red line in Villeneuve) represents the linear regression. The isolateswere sampled in 2006 at two sites, Lanxade (open black symbols) and Villeneuve (solid red symbols), on apple genotypes of Class0 (triangle), ClassF11 (square), ClassF17(diamond) and ClassF11F17 (circle). (For interpretation of the references to colour in this figure legend, the reader is referred to the web version of this article.)
0
20
40
60
80
2006 20100
20
40
60
80
Cla
ss0
Lanxade
02006 2010
0.0
0.4
0.8
1.2
1.6
Cla
ssF1
1
NS
02006 2010
0.0
0.4
0.8
1.2
1.6
Dis
ease
inci
denc
e on
:C
lass
F17
NS
02006 2010
0.0
0.4
0.8
1.2
1.6
Cla
ssF1
1F17
***
0
20
40
60
80
2006 20100
20
40
60
80
Angers
02006 2010
0.0
0.4
0.8
1.2
1.6 NS
02006 2010
0.0
0.4
0.8
1.2
1.6 NS
02006 2010
0.0
0.4
0.8
1.2
1.6 *
0
20
40
60
80
2006 20100
20
40
60
80
Villeneuve
02006 2010
0.0
0.4
0.8
1.2
1.6
02006 2010
0.0
0.4
0.8
1.2
1.6
02006 2010
0.0
0.4
0.8
1.2
1.6
Fig. 3. Evolution of scab disease incidence in the orchards for four classes of apple genotypes of the cv. Prima x cv. Fiesta progeny at the three sites. For ClassF11, ClassF17 andClassF11F17, the relative disease incidence (standardised by disease incidence on Class0) is presented. Coloured dashed lines indicate relative incidence for each applegenotype, and the black continuous line indicates the mean of all genotypes of the class. NS indicates no significant regression between disease incidence and the year (GLSanalysis), ⁄ significant regression at p<0.05, and ⁄⁄⁄ significant regression at p<0.001.
6 V. Caffier et al. / Infection, Genetics and Evolution xxx (2014) xxx–xxx
4. Discussion
Erosion of quantitative resistance in host plants is difficult toprove because this process is slow (McDonald and Linde, 2002).Using apple scab as a case study, we demonstrated: (1) differencesin quantitative components of pathogenicity on quantitative resis-tance according to the site of origin of the isolates collected at thebeginning of the experiment, (2) the existence or non-existence ofa positive linear regression between disease severity onquantitatively resistant apple genotypes and disease severity onsusceptible genotypes according to the site, and (3) different stages
Please cite this article in press as: Caffier, V., et al. Erosion of quantitative hosEvol. (2014), http://dx.doi.org/10.1016/j.meegid.2014.02.003
in the quantitative resistance erosion process among the sites,resulting either in partial or total breakdown.
4.1. Pathogenicity of pathogen populations evaluated on resistanthosts and efficiency of quantitative resistance at the beginning of theexperiment
The efficiency of partial resistance of the host is dependent onthe quantitative components of pathogenicity of the pathogenpopulations (Lannou, 2012). In the apple scab case study, weexperimentally showed that the quantitative components of
t resistance in the apple � Venturia inaequalis pathosystem. Infect. Genet.
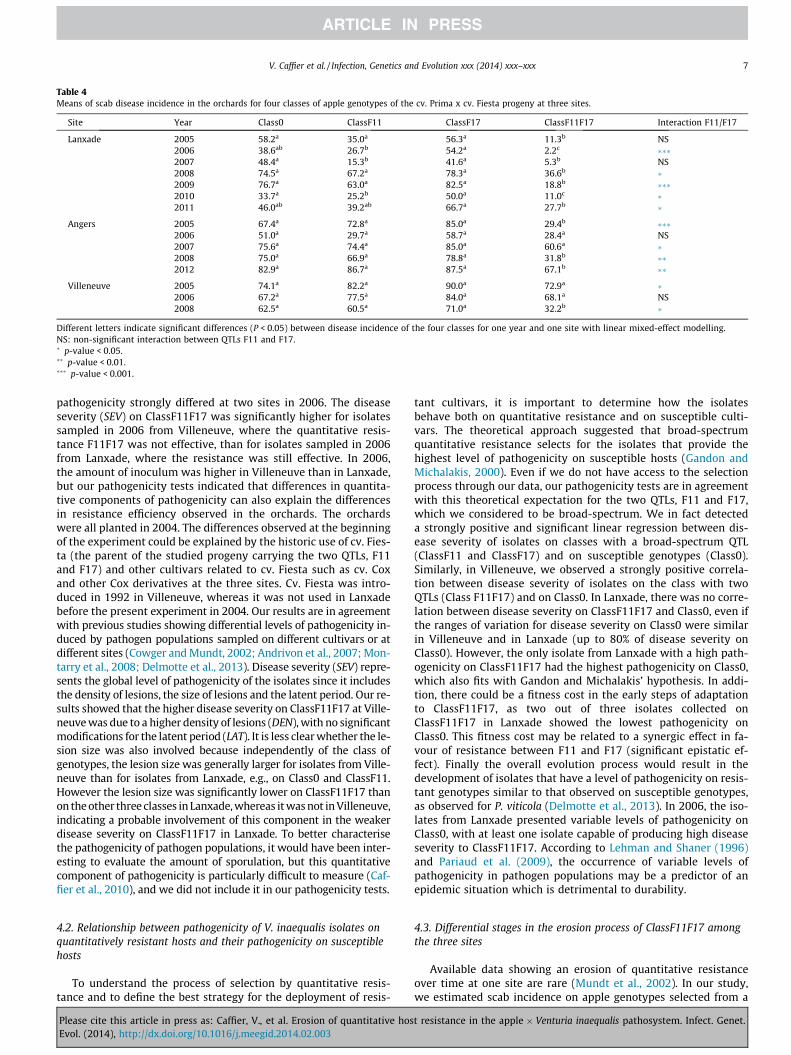
Table 4Means of scab disease incidence in the orchards for four classes of apple genotypes of the cv. Prima x cv. Fiesta progeny at three sites.
Site Year Class0 ClassF11 ClassF17 ClassF11F17 Interaction F11/F17
Lanxade 2005 58.2a 35.0a 56.3a 11.3b NS2006 38.6ab 26.7b 54.2a 2.2c ���2007 48.4a 15.3b 41.6a 5.3b NS2008 74.5a 67.2a 78.3a 36.6b �2009 76.7a 63.0a 82.5a 18.8b ���2010 33.7a 25.2b 50.0a 11.0c �2011 46.0ab 39.2ab 66.7a 27.7b �
Angers 2005 67.4a 72.8a 85.0a 29.4b ���2006 51.0a 29.7a 58.7a 28.4a NS2007 75.6a 74.4a 85.0a 60.6a �2008 75.0a 66.9a 78.8a 31.8b ��2012 82.9a 86.7a 87.5a 67.1b ��
Villeneuve 2005 74.1a 82.2a 90.0a 72.9a �2006 67.2a 77.5a 84.0a 68.1a NS2008 62.5a 60.5a 71.0a 32.2b �
Different letters indicate significant differences (P < 0.05) between disease incidence of the four classes for one year and one site with linear mixed-effect modelling.NS: non-significant interaction between QTLs F11 and F17.� p-value < 0.05.�� p-value < 0.01.��� p-value < 0.001.
V. Caffier et al. / Infection, Genetics and Evolution xxx (2014) xxx–xxx 7
pathogenicity strongly differed at two sites in 2006. The diseaseseverity (SEV) on ClassF11F17 was significantly higher for isolatessampled in 2006 from Villeneuve, where the quantitative resis-tance F11F17 was not effective, than for isolates sampled in 2006from Lanxade, where the resistance was still effective. In 2006,the amount of inoculum was higher in Villeneuve than in Lanxade,but our pathogenicity tests indicated that differences in quantita-tive components of pathogenicity can also explain the differencesin resistance efficiency observed in the orchards. The orchardswere all planted in 2004. The differences observed at the beginningof the experiment could be explained by the historic use of cv. Fies-ta (the parent of the studied progeny carrying the two QTLs, F11and F17) and other cultivars related to cv. Fiesta such as cv. Coxand other Cox derivatives at the three sites. Cv. Fiesta was intro-duced in 1992 in Villeneuve, whereas it was not used in Lanxadebefore the present experiment in 2004. Our results are in agreementwith previous studies showing differential levels of pathogenicity in-duced by pathogen populations sampled on different cultivars or atdifferent sites (Cowger and Mundt, 2002; Andrivon et al., 2007; Mon-tarry et al., 2008; Delmotte et al., 2013). Disease severity (SEV) repre-sents the global level of pathogenicity of the isolates since it includesthe density of lesions, the size of lesions and the latent period. Our re-sults showed that the higher disease severity on ClassF11F17 at Ville-neuve was due to a higher density of lesions (DEN), with no significantmodifications for the latent period (LAT). It is less clear whether the le-sion size was also involved because independently of the class ofgenotypes, the lesion size was generally larger for isolates from Ville-neuve than for isolates from Lanxade, e.g., on Class0 and ClassF11.However the lesion size was significantly lower on ClassF11F17 thanon the other three classes in Lanxade, whereas it was not in Villeneuve,indicating a probable involvement of this component in the weakerdisease severity on ClassF11F17 in Lanxade. To better characterisethe pathogenicity of pathogen populations, it would have been inter-esting to evaluate the amount of sporulation, but this quantitativecomponent of pathogenicity is particularly difficult to measure (Caf-fier et al., 2010), and we did not include it in our pathogenicity tests.
4.2. Relationship between pathogenicity of V. inaequalis isolates onquantitatively resistant hosts and their pathogenicity on susceptiblehosts
To understand the process of selection by quantitative resis-tance and to define the best strategy for the deployment of resis-
Please cite this article in press as: Caffier, V., et al. Erosion of quantitative hosEvol. (2014), http://dx.doi.org/10.1016/j.meegid.2014.02.003
tant cultivars, it is important to determine how the isolatesbehave both on quantitative resistance and on susceptible culti-vars. The theoretical approach suggested that broad-spectrumquantitative resistance selects for the isolates that provide thehighest level of pathogenicity on susceptible hosts (Gandon andMichalakis, 2000). Even if we do not have access to the selectionprocess through our data, our pathogenicity tests are in agreementwith this theoretical expectation for the two QTLs, F11 and F17,which we considered to be broad-spectrum. We in fact detecteda strongly positive and significant linear regression between dis-ease severity of isolates on classes with a broad-spectrum QTL(ClassF11 and ClassF17) and on susceptible genotypes (Class0).Similarly, in Villeneuve, we observed a strongly positive correla-tion between disease severity of isolates on the class with twoQTLs (Class F11F17) and on Class0. In Lanxade, there was no corre-lation between disease severity on ClassF11F17 and Class0, even ifthe ranges of variation for disease severity on Class0 were similarin Villeneuve and in Lanxade (up to 80% of disease severity onClass0). However, the only isolate from Lanxade with a high path-ogenicity on ClassF11F17 had the highest pathogenicity on Class0,which also fits with Gandon and Michalakis’ hypothesis. In addi-tion, there could be a fitness cost in the early steps of adaptationto ClassF11F17, as two out of three isolates collected onClassF11F17 in Lanxade showed the lowest pathogenicity onClass0. This fitness cost may be related to a synergic effect in fa-vour of resistance between F11 and F17 (significant epistatic ef-fect). Finally the overall evolution process would result in thedevelopment of isolates that have a level of pathogenicity on resis-tant genotypes similar to that observed on susceptible genotypes,as observed for P. viticola (Delmotte et al., 2013). In 2006, the iso-lates from Lanxade presented variable levels of pathogenicity onClass0, with at least one isolate capable of producing high diseaseseverity to ClassF11F17. According to Lehman and Shaner (1996)and Pariaud et al. (2009), the occurrence of variable levels ofpathogenicity in pathogen populations may be a predictor of anepidemic situation which is detrimental to durability.
4.3. Differential stages in the erosion process of ClassF11F17 amongthe three sites
Available data showing an erosion of quantitative resistanceover time at one site are rare (Mundt et al., 2002). In our study,we estimated scab incidence on apple genotypes selected from a
t resistance in the apple � Venturia inaequalis pathosystem. Infect. Genet.
8 V. Caffier et al. / Infection, Genetics and Evolution xxx (2014) xxx–xxx
progeny segregating for two QTLs (F11 and F17), and we followedthe evolution of the disease incidence on the classes with one(ClassF11, ClassF17) or two (ClassF11F17) QTLs standardised bythe disease incidence on the susceptible class (Class0). At the Lanx-ade site (South-Western France), we observed the erosion of theresistance carried by ClassF11F17, with a relative disease incidencethat increased from 20% to 60% over a 7-year period. Selectionpressures exerted by apple are cumulative over time within anorchard since V. inaequalis presents several asexual generationseach year and survives in winter under a sexual form on leaf litterwithin the orchard (MacHardy, 1996; Bowen et al., 2011). Wehypothesize that this cumulative effect may favour the erosion ofthe quantitative resistance. In Angers (North-Western France),the relative disease incidence increased from 40% to 80% over an8-year period on ClassF11F17. In Villeneuve (Northern France),the breakdown appeared complete with a very high disease inci-dence on all classes of genotypes from the start of the survey in2005. This suggests that selection pressure exerted on pathogenpopulations by quantitative resistance over a long period can resultin an apparently complete breakdown, as observed in Potato virus Yafter successive passages on a pepper cultivar with quantitativeresistance (Montarry et al., 2012). However, in Villeneuve, thebreakdown of the quantitative resistance may also have been exac-erbated by climatic conditions that were very favourable to scab(as shown by the disease incidence on Class0). This could lead tothe ineffectiveness of a quantitative resistance because of a veryhigh level of inoculum, whereas the quantitative resistance is stillefficient in the case of a smaller amount of inoculum, as observedin 2008.
The erosion of quantitative resistance may also have been fa-voured by the experimental design based on a mixture of applegenotypes. Theoretical (Lannou, 2001; Marshall et al., 2009) andexperimental (Chin and Wolfe, 1984; Villaréal and Lannou, 2000)studies showed that cultivar mixtures with major resistance genesslow down the appearance of isolates adapted to all hosts due tobalancing selection for adaptation to host genotypes. Since ourexperimental design did not include orchards with a single classof genotypes, we cannot draw any conclusions concerning thispoint, but it can be hypothesized that balancing selection did notoccur in our orchards because (1) all apple genotypes belongedto the same progeny and shared related genetic backgrounds,and (2) ClassF11 and ClassF17 may have favoured a progressive(step-by-step) pathogen adaptation onto ClassF11F17 (positivecorrelation between pathogenicity on ClassF11 or ClassF17 andpathogenicity on ClassF11F17). We therefore assume that the ero-sion observed here may have been exacerbated, and we could ex-pect that it would be slower in a pure stand of genotypes carrying acombination of quantitative resistances.
4.4. Concluding remarks
Our study showed that quantitative resistance may be subjectto erosion and, apparently, even complete breakdown. We ob-served this evolution over time in experimental orchards for applegenotypes that combine the two broad-spectrum QTLs, F11 andF17. In this case study, we showed that isolates of V. inaequaliscan combine a high level of pathogenicity both on apple genotypeswith quantitative resistance and on susceptible genotypes. As aconsequence, there may be a risk of emergence of a generalistpathogen population. Since diverse mechanisms have been pro-posed to explain quantitative resistance (Poland et al., 2009; Kouand Wang, 2010; Vergne et al., 2010), we can expect that differentcorresponding adaptation processes will be necessary in patho-gens, with only some of them leading to a risk of emergence of gen-eralist pathogen populations. Knowledge of the evolution ofpathogenicity over time at the same site is still required, as well
Please cite this article in press as: Caffier, V., et al. Erosion of quantitative hosEvol. (2014), http://dx.doi.org/10.1016/j.meegid.2014.02.003
as extended comparisons of isolates sampled on resistant and sus-ceptible cultivars at a single site, to better understand the processof selection in relation to resistant and susceptible cultivars. Deci-phering the molecular mechanisms underlying QTL F11 and F17and their combination in the apple scab pathosystem is also neces-sary to fully understand the erosion process observed, to evaluatein which cases the use of quantitative resistances would be moredurable and to test the hypothesis that epistatic interactions be-tween resistance QTLs may be more difficult to erode than thecombination of QTLs acting only additively. These results stressthe need to look for diversified quantitative resistance factors thatcombine complementary modes of action on the pathogen, result-ing in trade-offs between quantitative components of pathogenic-ity (Lannou, 2012; Azzimonti et al., 2013; Pariaud et al., 2013), andto optimise the management of cultivar distribution in space andtime (Sapoukhina et al., 2013) to limit the possibilities of step-by-step evolution in pathogen populations (Bourget et al., 2013).
Acknowledgements
We thank L. Bervas, P. Billy, C. Brouard, P. Cochet, J-M. Jourdain,F. Lecomte, M. Lubret, J. Maquaire, G. Orain and B. Rocand for orch-ard management, M-N. Bellanger, F. Le Breton, B. Petit, and C. Tothfor disease assessment in the orchard, and D. Besnard, J. Besnard,M. Boucourt, J. Chameau, N. Dousset, S. Hanteville and L. Lecloutfor the production of plants for pathogenicity tests. This workwas funded by the CTPS programme ‘‘Durabilité des résistancesvariétales à des bioagresseurs 2006–2008’’ and the ANR grant,‘‘ANR-05-PADD-05, CEDRE’’.
References
Andrivon, D., Pilet, F., Montarry, J., Hafidi, M., Corbière, R., Achbani, E.H., Pellé, R.,Ellissèche, D., 2007. Adaptation of Phytophthora infestans to partial resistance inpotato: Evidence from French and Moroccan populations. Phytopathology 97,338–343.
Azzimonti, G., Lannou, C., Sache, I., Goyeau, H., 2013. Components of quantitativeresistance to leaf rust in wheat cultivars: diversity, variability and specificity.Plant Pathol. 62, 970–981.
Bourget, R., Chaumont, L., Sapoukhina, N., 2013. Timing of pathogen adaptation to amulticomponent treatment. PloS ONE 8, e71926.
Bowen, J.K., Mesarich, C.H., Bus, V.G.M., Beresford, R.M., Plummer, K.M., Templeton,M.D., 2011. Venturia inaequalis: the causal agent of apple scab. Mol. Plant Pathol.12, 105–122.
Bus, V.G.M., Rikkerink, E.H.A., Caffier, V., Durel, C.E., Plummer, K.M., 2011. Revisionof the nomenclature of the differential host-pathogen interactions of Venturiainaequalis and Malus. Annu. Rev. Phytopathol. 49, 391–413.
Caffier, V., Didelot, F., Pumo, B., Causeur, D., Durel, C.E., Parisi, L., 2010.Aggressiveness of eight Venturia inaequalis isolates virulent or avirulent to themajor resistance gene Rvi6 on a non-Rvi6 apple cultivar. Plant Pathol. 59, 1072–1080.
Calenge, F., Faure, A., Goerre, M., Gebhardt, C., Van de Weg, W.E., Parisi, L., Durel,C.E., 2004. Quantitative trait loci (QTL) analysis reveals both broad-spectrumand isolate-specific QTL for scab resistance in an apple progeny challenged witheight isolates of Venturia inaequalis. Phytopathology 94, 370–379.
Chin, K.M., Wolfe, M.S., 1984. Selection on Erysiphe graminis in pure and mixedstands of barley. Plant Pathol. 33, 535–545.
Cowger, C., Mundt, C.C., 2002. Aggressiveness of Mycosphaerella graminicola isolatesfrom susceptible and partially resistant wheat cultivars. Phytopathology 92,624–630.
Delmotte, F., Mestre, P., Schneider, C., Kassemeyer, H.H., Kozma, P., Richart-Cervera,S., Rouxel, M., Delière, L., 2013. Rapid and multiregional adaptation to hostpartial resistance in a plant pathogenic oomycete: Evidence from Europeanpopulations of Plasmopara viticola, the causal agent of grapevine downy mildew.Infect. Genet. Evol., http://dx.doi.org/10.1016/j.meegid.2013.10.017.
Durel, C.E., Van de Weg, W.E., Venisse, J.S., Parisi, L., 2000. Localisation of a majorgene for apple scab resistance on the European genetic map of the Prima xFiesta cross. IOBC (WPRS) Bulletin 23, 245–248.
Durel, C.E., Parisi, L., Laurens, F., Van de Weg, W.E., Liebhard, R., Jourjon, M.F., 2003.Genetic dissection of partial resistance to race 6 of Venturia inaequalis in apple.Genome 46, 224–234.
Durel, C.E., Calenge, F., Parisi, L., Van de Weg, W.E., Kodde, L.P., Liebhard, R., Gessler,C., Thiermann, M., Dunemann, F., Gennari, F., Tartarini, S., Lespinasse, Y., 2004.An overview of the position and robustness of scab resistance QTLs and majorgenes by aligning genetic maps of five apple progenies. Acta Hortic. 663, 135–140.
t resistance in the apple � Venturia inaequalis pathosystem. Infect. Genet.
V. Caffier et al. / Infection, Genetics and Evolution xxx (2014) xxx–xxx 9
Flier, W.G., van den Bosch, G.B.M., Turkensteen, L.J., 2003. Stability of partialresistance in potato cultivars exposed to aggressive strains of Phytophthorainfestans. Plant Pathol. 52, 326–337.
Fox, J., 2005. The R commander: a basic statistics graphical user interface to R. J.Stat. Software 14, 1–42.
Gandon, S., Michalakis, Y., 2000. Evolution of parasite virulence against qualitativeor quantitative host resistance. Proc. R. Soc. Lond. B Biol. Sci. 267, 985–990.
Gladieux, P., Zhang, X.G., Afoufa-Bastien, D., Valdebenito Sanhueza, R.M., Sbaghi, M.,Le Cam, B., 2008. On the origin and spread of the scab disease of apple: out ofcentral Asia. PloS ONE 1, e1455.
Gould, F., Kennedy, G.G., Johnson, M.T., 1991. Effects of natural enemies on the rateof herbivore adaptation to resistant host plants. Entomol. Exp. Appl. 58, 1–14.
Kolmer, J.A., Leonard, K.J., 1986. Genetic selection and adaptation of Cochliobolusheterostrophus to corn hosts with partial resistance. Phytopathology 76, 774–777.
Kou, Y.J., Wang, S.P., 2010. Broad-spectrum and durability: understanding ofquantitative disease resistance. Curr. Opin. Plant Biol. 13, 181–185.
Lannou, C., 2001. Intrapathotype diversity for aggressiveness and pathogenevolution in cultivar mixtures. Phytopathology 91, 500–510.
Lannou, C., 2012. Variation and selection of quantitative traits in plant pathogens.Annu. Rev. Phytopathol. 50, 319–338.
Lateur, M., Populer, C., 1994. Screening fruit tree genetic resources in Belgium fordisease resistance and other desirable characters. Euphytica 77, 147–153.
Le Guen, V., Garcia, D., Mattos, C.R.R., Doare, F., Lespinasse, D., Seguin, M., 2007.Bypassing of a polygenic Microcyclus ulei resistance in rubber tree, analyzed byQTL detection. New Phytol. 173, 335–345.
Lê Van, A., Gladieux, P., Lemaire, C., Cornille, A., Giraud, T., Durel, C.E., Caffier, V., LeCam, B., 2012. Evolution of pathogenicity traits in the apple scab fungalpathogen in response to the domestication of its host. Evol. Appl. 5, 694–704.
Lê Van, A., Caffier, V., Lasserre-Zuber, P., Chauveau, A., Brunel, D., Le Cam, B., Durel,C.E., 2013. Differential selection pressures exerted by host resistancequantitative trait loci on a pathogen population: a case study in an apple xVenturia inaequalis pathosystem. New phytol. 197, 899–908.
Lehman, J.S., Shaner, G., 1996. Genetic variation in latent period among isolates ofPuccinia recondita f.sp. tritici on partially resistant wheat cultivars.Phytopathology 86, 633–641.
Lehman, J.S., Shaner, G., 1997. Selection of populations of Puccinia recondita f.sp.tritici for shortened latent period on a partially resistant wheat cultivar.Phytopathology 87, 170–176.
Lehman, J.S., Shaner, G., 2007. Heritability of latent period estimated from wild-typeand selected populations of Puccinia triticina. Phytopathology 97, 1022–1029.
Liebhard, R., Koller, B., Patocchi, A., Kellerhals, M., Pfammatter, W., Jermini, M.,Gessler, C., 2003. Mapping quantitative field resistance against apple scab in a‘Fiesta’ x ‘Discovery’ progeny. Phytopathology 93, 493–501.
MacHardy, W.E., 1996. Apple Scab: Biology, Epidemiology, and Management. APSPress, St. Paul, Minnesota, USA.
Maliepaard, C., Alston, F.H., van Arkel, G., Brown, L.M., Chevreau, E., Dunemann, F.,Evans, K.M., Gardiner, S., Guilford, P., van Heusden, A.W., Janse, J., Laurens, F.,Lynn, J.R., Manganaris, A.G., DEN Nijs, A.P.M., Periam, N., Rikkerink, E., Roche, P.,Ryder, C., Sansavini, S., Schmidt, H., Tartarini, S., Verhaegh, J.J., Vrielink-vanGinkel, M., King, G.J., 1998. Aligning male and female linkage maps of apple(Malus pumila Mill) using multi-allelic markers. Theor. Appl. Genet. 97, 60–73.
Marcel, T.C., Gorguet, B., Ta, M.T., Kohutova, Z., Vels, A., Niks, R.E., 2008. Isolatespecificity of quantitative trait loci for partial resistance of barley to Pucciniahordei confirmed in mapping populations and near-isogenic lines. New Phytol.177, 743–755.
Marshall, B., Newton, A.C., Zhan, J., 2009. Quantitative evolution of aggressiveness ofpowdery mildew under two-cultivar barley mixtures. Plant Pathol. 58, 378–388.
McDonald, B.A., Linde, C., 2002. Pathogen population genetics, evolutionarypotential, and durable resistance. Annu. Rev. Phytopathol. 40, 349–379.
Please cite this article in press as: Caffier, V., et al. Erosion of quantitative hosEvol. (2014), http://dx.doi.org/10.1016/j.meegid.2014.02.003
Montarry, J., Glais, I., Corbiere, R., Andrivon, D., 2008. Adaptation to the mostabundant host genotype in an agricultural plant-pathogen system - potato lateblight. J. Evol. Biol. 21, 1397–1407.
Montarry, J., Cartier, E., Jacquemond, M., Palloix, A., Moury, B., 2012. Virusadaptation to quantitative plant resistance. erosion or breakdown? J. Evol.Biol. 25, 2242–2252.
Mundt, C.C., Cowger, C., Garrett, K.A., 2002. Relevance of integrated diseasemanagement to resistance durability. Euphytica 124, 245–252.
Newton, A.C., McGurk, L., 1991. Recurrent selection for adaptation of Erysiphegraminis f.sp. hordei to partial resistance and the effect of environment onexpression of partial resistance of barley. J. Phytopathol. 132, 328–338.
Papaix, J., Goyeau, H., Du Cheyron, P., Monod, H., Lannou, C., 2011. Influence ofcultivated landscape composition on variety resistance. an assessment based onwheat leaf rust epidemics. New Phytol. 191, 1095–1107.
Pariaud, B., Ravigné, V., Halkett, F., Goyeau, H., Carlier, J., Lannou, C., 2009.Aggressiveness and its role in the adaptation of plant pathogens. Plant Pathol.58, 409–424.
Pariaud, B., van den Berg, F., van den Bosch, F., Powers, S.J., Kaltz, O., Lannou, C.,2013. Shared influence of pathogen and host genetics on a trade-off betweenlatent period and spore production capacity in the wheat pathogen, Pucciniatriticina. Evol. Appl. 6, 303–312.
Parlevliet, J.E., 2002. Durability of resistance against fungal, bacterial and viralpathogens; present situation. Euphytica 124, 147–156.
Pinheiro, J., Bates, D., DebRoy, S., Sarkar, D., R Development Core Team, 2012. NlmeLinear and Nonlinear Mixed Effects Models. R Package Version 3.1-105.
Poland, J.A., Balint-Kurti, P.J., Wisser, R.J., Pratt, R.C., Nelson, R.J., 2009. Shades ofgray: the world of quantitative disease resistance. Trends Plant Sci. 14, 21–29.
R Core Team, 2012. R: A language and environment for statistical computing. RFoundation for Statistical Computing [http://www.R-project.org]. Vienna, Austria.
Sapoukhina, N., Paillard, S., Dedryver, F., de Vallavieille-Pope, C., 2013. Quantitativeplant resistance in cultivar mixtures: wheat yellow rust as a modeling casestudy. New Phytol. 200, 888–897.
Schneider, C.A., Rasband, W.S., Eliceiri, K.W., 2012. NIH image to ImageJ: 25 years ofimage analysis. Nat. Meth. 9, 671–675.
Schouten, H.J., van de Weg, W.E., Carling, J., Khan, S.A., McKay, S.J., van Kaauwen,M.P.W., Wittenberg, A.H.J., Koehorst-van Putten, H.J.J., Noordijk, Y., Gao, Z.S.,Rees, D.J.G., Van Dyk, M.M., Jaccoud, D., Considine, M.J., Kilian, A., 2012.Diversity arrays technology (DArT) markers in apple for genetic linkage maps.Mol. Breeding 29, 645–660.
Sommerhalder, R.J., McDonald, B.A., Mascher, F., Zhan, J.S., 2011. Effect of hosts oncompetition among clones and evidence of differential selection betweenpathogenic and saprophytic phases in experimental populations of the wheatpathogen Phaeosphaeria nodorum. BMC Evol. Biol. 11, 188.
Soufflet-Freslon, V., Gianfranceschi, L., Patocchi, A., Durel, C.E., 2008. Inheritancestudies of apple scab resistance and identification of Rvi14, a new major genethat acts together with other broad-spectrum QTL. Genome 51, 657–667.
Talukder, Z.I., Tharreau, D., Price, A.H., 2004. Quantitative trait loci analysis suggeststhat partial resistance to rice blast is mostly determined by race-specificinteractions. New Phytol. 162, 197–209.
Vergne, E., Grand, X., Ballini, E., Chalvon, V., Saindrenan, P., Tharreau, D., Notteghem,J.L., Morel, J.B., 2010. Preformed expression of defense is a hallmark of partialresistance to rice blast fungal pathogen Magnaporthe oryzae. BMC Plant Biol. 10,206.
Villaréal, L.M.M.A., Lannou, C., 2000. Selection for increased spore efficacy by hostgenetic background in a wheat powdery mildew population. Phytopathology90, 1300–1306.
Young, N.D., 1996. QTL mapping and quantitative disease resistance in plants. Annu.Rev. Phytopathol. 34, 479–501.
Zhan, J., Mundt, C.C., Hoffer, M.E., McDonald, B.A., 2002. Local adaptation and effectof host genotype on the rate of pathogen evolution: an experimental test in aplant pathosystem. J. Evol. Biol. 15, 634–647.
t resistance in the apple � Venturia inaequalis pathosystem. Infect. Genet.