Embed Size (px)
Citation preview
ents,
rties” byte retention.g the:ranerried out as
analyzedporometry.
h theing the porefrom that
tionaccount
Journal of Colloid and Interface Science 262 (2003) 200–211www.elsevier.com/locate/jcis
Evaluation of the “DSPM” model on a titania membrane: measuremof charged and uncharged solute retention, electrokinetic charge
pore size, and water permeability
C. Labbez,a,∗ P. Fievet,a F. Thomas,b A. Szymczyk,a A. Vidonne,a A. Foissy,a and P. Pagettia
a Laboratoire de Chimie des Matériaux et Interfaces, Université de Franche-Comté, 16, route de Gray, 25030 Besançon Cedex, Franceb Laboratoire Environnement et Minéralurgie (UMR 7569 CNRS-INPL), BP 40-5401, Vandoeuvre les Nancy Cedex, France
Received 1 October 2002; accepted 21 December 2002
Abstract
The DSPM (Donnan steric partitioning pore model) was evaluated in the case of a titania membrane with “nanofiltration propemeasuring the electrokinetic charge, pore size, and water permeability of the membrane, along with charged and uncharged soluThe zeta potential values (ζ ) were determined from measurements of the electrophoretic mobility (EM) of titania powder forminfiltering layer of the membrane. Zeta potential values were converted into membrane volume charge(X) by assuming two limiting casesa constant surface charge (σ scst) and a constant surface potential (ψs
cst). The mean pore radius and thickness/porosity ratio of the membwere determined by permporometry and from water permeability measurements, respectively. Retention measurements were caa function of the permeate volume flux for both neutral solutes (polyethylene glycol PEG of different size) and salts (KCl, MgSO4, K2SO4,and MgCl2) at various pH values. Ionic retentions showed minimum values near the IEP of the membrane. Retention data wereusing the DSPM. Very good agreement was found between the pore radius calculated by the model and that determined by permX values calculated from fitting retention data using the DSPM were also in satisfactorily agreement withX values calculated from EMmeasurements assuming a constant surface potential for a large pH range. Furthermore, the DSPM leads toX values (XDSPM) between thosecalculated from EM (XEM) using the two limiting bounds. In other words,XDSPM was higher thanXEM assumingψs
cst at pH values farfrom the isoelectric point (IEP) and lower thanXEM assumingσ scst. These results show that the DSPM is in qualitative agreement witcharge regulation theory (increase of the pore surface potential and decrease of the pore surface charge density with decreassize). On the other hand, the thickness/porosity ratio of the membrane calculated from solute retention data differed significantlydetermined from water permeability measurements. Moreover, a single value ofx/Ak could not be determined from PEG and salt retendata. This means that thex/Ak parameter loses its physical meaning and includes physical phenomena which are not taken intoby the DSPM. Nevertheless, the model satisfactorily predicted the limiting retention, as this is not influenced by thex/Ak parameter. 2003 Elsevier Science (USA). All rights reserved.
Keywords: Ceramic membrane; Zeta potential; Salt retention; Extended Nernst–Planck equation; Charged membrane; Charge regulation
-rthe-ranethe
onlyon
tion
suchrane
ores,clu-
theiriffer-
aterien-alsop-
sion, be
1. Introduction
Nanofiltration (NF) and low ultrafiltration (UF) membranes are widely used in many industrial sectors. Neveless the mechanisms of transport through these membare not yet fully understood [1]. Most authors agree thatseparation ability of these membranes is controlled notby a simple sieving mechanism (steric effect) dependingthe sizes of the hydrated components of the feed solu
* Corresponding author.E-mail address: [email protected] (C. Labbez).
0021-9797/03/$ – see front matter 2003 Elsevier Science (USA). All rights rdoi:10.1016/S0021-9797(02)00245-X
s
and membrane pores but also by complex mechanismsas electrostatic interactions between the charged memband charged solution species. In the case of very small pfurther complex phenomena occur, such as dielectric exsion caused by the interaction of charged species withimage electric charges at interfaces between media of dent dielectric constants and also by a decrease in the wdielectric constant due to a considerable water dipole ortation near the membrane/solution interface, which maylead to significant ion retention [2,3]. Quantifying the searation ability of a membrane requires that these excluphenomena, as well as the characteristics of the systemknown.
eserved.
C. Labbez et al. / Journal of Colloid and Interface Science 262 (2003) 200–211 201
eu-arethe
adi-malarergeory,nanonudetingib-lu-fullyon aw-sity
tes
rip-tri-at-andely,em-ttingbu-ieldrves
ainre-
ateaveion
andrizativeaveverge
raltita-ntaeticita-in
umered
y.
eterseri-PM.the
ions
en-hatbleon iscrip-
re-anet, aceeace
ticalt thesre
emi-iven.
par-ithTheandicalradi-ionvar-
n beions.
tosol-side
entionin
qua-
tions
Most widely adopted models for describing ion and ntral solute retention with NF and low UF membranesderived from the space charge model [4–6], based ontheory of irreversible thermodynamics, assuming that grents of both ion concentration and electric potential norto the pore surface are nil [5–14]. These approximationsvalid if both small pore and reasonably small surface chadensity conditions are satisfied. In the scope of this theBowen et al. [7,8] developed in 1997 the so-called Donsteric partitioning pore model (DSPM), which is basedthe extended Nernst–Planck equation, modified to inclsteric effects, and a modified Donnan equation accounfor the sieving effect as well. This latter gives the equilrium partition of ions between external and internal sotions of the membrane. The DSPM has been successused to describe retention of neutral solutes and ionstitania membrane with nanofiltration properties [15]. Hoever, a single value for the membrane-thickness-to-pororatio (x/Ak) could not be determined from neutral soluand salts retention data [15].
More recent model development also includes a desction of the dielectric exclusion [2,3,16], the pore size disbution, and an increase of solvent viscosity [17], whichtempts to account for the nonuniformity of membranesthe effect of confinement on water properties. Unfortunatbecause of a lack of relevant experimental data for mbranes, the dielectric exclusion is often used as a new fiparameter [3,16]. Moreover, inclusion of pore size distrition and additional viscosity in pores does not seem to ybetter descriptions of ion and neutral solute retention cu[3,17].
The literature shows that few authors tried to obtmore experimental data than the classically measuredtention versus permeate volume flux in order to evaluthe transport models [2]. Hagmeyer and Gimbel [16] htried to predict the performance of organic nanofiltratmembranes by determining zeta potential values(ζ ) fromstreaming potential measurements. A.E. YaroshchukV.R. Ribitsh used non-steady-state membrane charactetion techniques to study the transport properties of aclayers of NF membranes [18,19]. Palmeri et al. [10] hused electrophoretic mobility while Combe et al. [11] hacarried out powder titration to calculate the surface chadensity in order to predict ionic retention by a ZrO2 and aZrO2/MgO NF membrane, respectively.
The aim of this work is to characterize the structuparameters and the surface electrical properties of ania membrane close to the NF range by three experimetechniques in order to evaluate the DSPM. Electrophormobility (EM) measurements were performed on the tnia powder forming the filtering layer of the membraneorder to calculate the corresponding zeta potential(ζ ). ζwas then used to evaluate the effective membrane volcharge(X). Porosity and water permeability were measuin order to determine the mean pore radius (rp) and the thick-ness/porosity ratio (x/Ak) of the membrane, respectivel
-
l
These directly measured electrical and structural paramwere compared with those calculated from retention expments of different salts and neutral solutes using the DSFinally, the directly measured parameters were used inDSPM in order to compare the predicted solute retentwith those experimentally obtained.
It should be noted that the pore wall surface charge dsity can differ from the free wall surface charge density (tof particles) due to overlapping of the wall electric doulayers inside pores of such membranes. This phenomencalled charge regulation [20,21]. Since the complete destion of this phenomenon inside such confined structuresquires additional fitting parameters, the effective membrvolume charge was simply evaluated by assuming, firsconstant surface charge (σ s
cst) and, second, constant surfapotential (ψs
cst) at the pore entrance.σ scst means that the por
wall surface charge density is identical to the free surfcharge density (measured on particles).ψs
cst means that thepore wall surface potential at the pore entrance is idento the free surface potential, i.e., the Donnan potential afeed-membrane interface is equal toζ . As the assumptionof σ s
cst andψscst give the upper and lower bounds of the po
wall surface charge, respectively, one can perform a squantitative evaluation of the DSPM in terms of effectvolume charge prediction and then of retention predictio
2. Theory
2.1. Theoretical basis of the DSPM
2.1.1. Assumptions of the DSPMThe porous membrane is considered to consist of a
allel association of identical straight cylindrical pores wa constant volume charge density in the axial direction.membrane volume charge density is sufficiently smallsalt solutions are sufficiently diluted so that both electrpotential and ion concentrations can be considered asally constant. As solutions are diluted, the coupling motcomponent/component and the differences between theious average velocities (mass, molar, and volume) caneglected and activities can be replaced by concentratMoreover, the membrane pore size is sufficiently largeneglect dielectric interactions. Finally, it is assumed thatvated ion radii (and hence hydratation) are unchanged inpores.
2.1.2. Theoretical backgroundAs the theoretical description of the DSPM has be
given in detail elsewhere [7,8,14], just a brief presentaof the model is given below (all symbols are definedAppendix A).
The DSPM is based on the extended Nernst–Planck etion (ENP) to describe the transport of componenti throughmembrane fine pores. Considering the previous assump
202 C. Labbez et al. / Journal of Colloid and Interface Science 262 (2003) 200–211
lds:
tialin Tar thenttionntsingthe
) ofneun by
ndtheane
er to
umelve
ribed
ry(13
s/poply
on
nceyer.(
cen-es
12).omstan
ge
o-ce,
theply
and modifying the ENP to include hindered transport yie
(1)ji = −Di,p
dcmi
dx− zic
mi Di,p
F
RT
dψ
dx+Ki,cc
mi Jv.
From this equation, concentration and electrical potengradients (Eqs. (2) and (3)) can be expressed as shownble 1. Hindrance factors (Eq. (5)) are used to account fohindered diffusive and convective transport of componeiwithin pores of the membrane. A modified Donnan equa(Eq. (10)), including a steric term (Eq. (11)) which accoufor finite component size, is used to describe the partitionof components at both interfaces membrane/solution. Inpresent study, the hydrodynamic (Stokes) radii (Eq. (9)components have been used. The conditions for electrotrality inside and outside the membrane pores are giveEq. (12).
Solving the differential equations for concentration aelectric potential gradients, Eqs. (2) and (3), allowsdetermination of the solute retention for given membr(X,x/Ak and rp) and solution (Ci,f , ri,Di,∞, T , . . .)
parameters. Calculations can also be performed in orddetermine membrane parameters(X, rp,x/Ak), providedthat the feed solution parameters(Ci,f , ri ,Di,∞, T , . . .) andcomponent retentions as functions of the permeate volflux are known. The numerical procedure used to sothese equations and to fit to the retention data is descelsewhere [12–14].
It should be noted that the limiting retention of binaelectrolytes and neutral solutes expressed by Eqs.and (14), respectively, are independent on the thicknesrosity ratio of the membrane. In addition, it could be simdemonstrated from Eq. (13) that the limiting retention(Rlim)
of ions is not affected by the correction of ion diffusicoefficient (due to pore viscosity), asRlim depends onlyon the diffusivity ratioD1p/D2p . The limiting retention ofneutral solutes is not influenced, as well.
2.2. Derivation of the membrane volume charge fromelectrokinetic measurements
Generally, it is assumed that the surface charge balathe mobile charges of the electrical double electric laHence, one can show that the surface charge densityσ s )of a cylindrical pore wall can be defined as
(15)σ s = − 1
rp
rp∫0
F
n∑i=1
zicmi r dr.
Since uniform radial potential is assumed, the radial contrations of ions are also constant. Hence Eq. (15) becom
(16)σ s = −Frp
2
n∑i=1
zicmi = FrpX
2,
whereX is the membrane volume charge defined by Eq. (To derive the pore wall surface charge density fr
EM measurements performed on powder, either a con
-
-
)-
s
t
Table 1Summary of the main equations used for modeling (DSPM)
Concentration gradient inside membrane pore:
(2)dcm
i
dx= Jv
Ki,dDi
(Ki,cc
mi −Ci,p
)− zicmi
RTFdψm
dx
Potential gradient inside membrane pore:
(3)dψm
dx=∑n
i=1zi Jv
Ki,dDi(Ki,cc
mi
−Ci,p)
FRT
∑ni=1(z
2icmi)
,
where
(4)Di,p =Ki,dDi,∞Hindrance factors:
(5)Ki,d =K−1(λi ,0), Ki,c = (2− φi )G(λi,0)
Hydrodynamic drag coefficients:
(6)K−1(λi ,0)= 1.0− 2.30λi + 1.154λ2i + 0.224λ3
i ,
(7)G(λi,0)= 1.0+ 0.054λi − 0.988λ2i + 0.441λ3
i ,
where
(8)λi = ri
rp
Hydrodynamic radius of componenti:
(9)ri = kT
6πη0Di,∞Donnan-steric partitioning:
(10)cmi
Ci= φi exp
(− ziF
RTψD
)
Steric partitioning:
(11)φi = (1− λi)2
Electroneutrality conditions:
(12)n∑
i=1
ziCi = 0,n∑
i=2
zicmi = −X
Limiting retention of a binary electrolyte:
(13)Rlim = cm1 K1,c + cm2 K2,c
2−
z1D1,pD2,p
+ z2
2(z21c
m1D1,pD2,p
+ z22c
m2
)Limiting retention of a neutral solutei:
(14)Rlim = 1− φiKi,c
electrostatic potential (ψscst) or a constant surface char
density (σ scst) can be assumed.
In the first limiting case, if the surface electrostatic ptential (ψs ) of the pore wall at the membrane–feed interfai.e., the Donnan potential at the feed side (ψD,1), is equalto ψs of the isolated surface (assumed to be equal toelectrokinetic potential of particle surface), it can be sim
C. Labbez et al. / Journal of Colloid and Interface Science 262 (2003) 200–211 203
porelume
ace
sy
ten-withble
d
or isula-qui-
uireriza-n of
onalim-rfaces ford in
ty
lume
lnetic
meer aal
fac-nesb-troningof
inverM
(a)
(b)
(c)
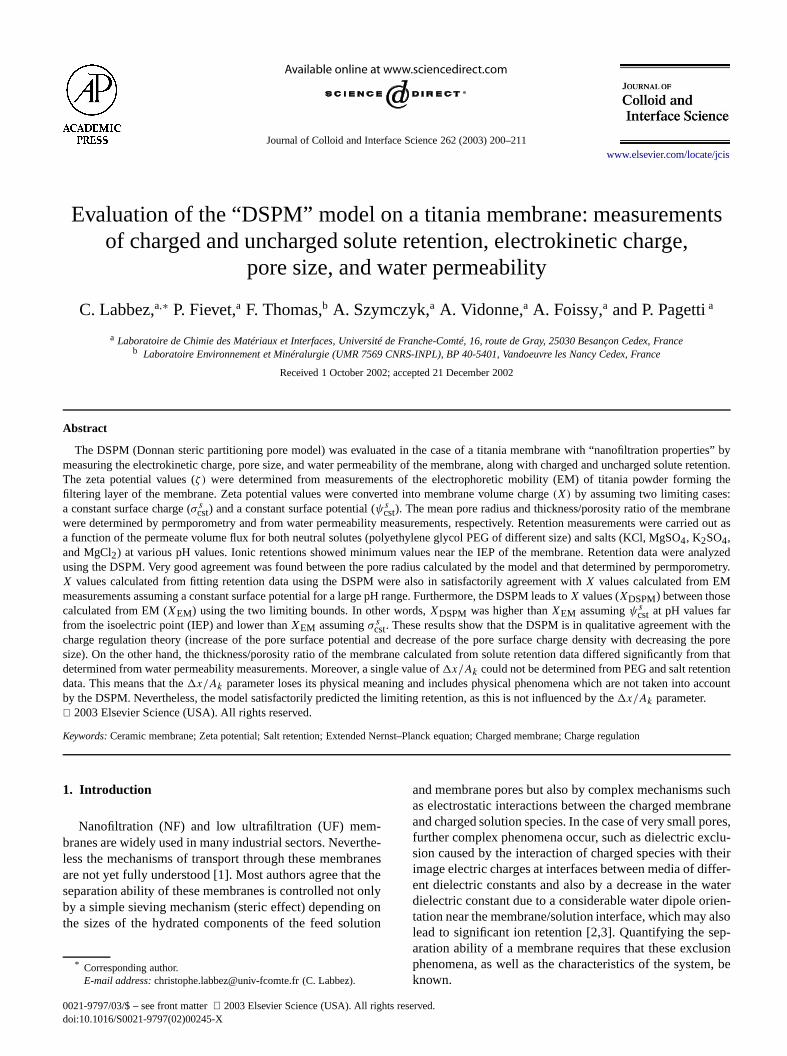
Fig. 1. (a) Pore wall surface charge density versus pore radius, (b)wall surface electrostatic potential versus pore radius, (c) membrane vocharge versus pore radius for an isolated surface withσs = 3.4 mC m–2 andψs = 42.1 mV; σscst: constant surface charge density;ψs
cst: constant surfacepotential.
demonstrated with Eqs. (10) and (16) thatσ s of the pore wallwould decrease with decreasing pore size. Hence,σ s of thepore wall would be smaller than that of the isolated surf(see Fig. 1a).
In the second limiting case, ifσ s of the pore wall isequal toσ s of the isolated surface, it would be also eato demonstrate from Eqs. (10) and (16) thatψD,1 wouldincrease with decreasing the pore size (see Fig. 1b).
In a real system, neither the surface electrostatic potial nor the surface charge is constant, but they changethe pore size due to the overlapping of the electrical doulayers inside the pores. In the same time,σ s decreases an
ψD,1 increases with decreasing pore size. This behavicalled charge regulation [20,21]. To describe charge regtion inside a confined medium, the surface parameters (elibrium constant, total number of ionizable sites, etc.) reqto be known. However, besides the numerous charactetion methods and measurements that require the definitiothe surface chemistry, this often needs the use of additifitting parameters. Consequently, in this study the two liting cases (constant surface potential and constant sucharge density which lead to the lower and upper boundthe pore wall charge density, respectively) were applieorder to evaluate the membrane volume charge.
In the first limiting case (σ scst) the surface charge densi
is related to the electrokinetic potential(ζ ) through theGouy–Chapmann equation and, thus, the membrane vocharge(X) can be defined as [15]
X = sign(ζ )2
rpF
(2εrε0RT
n∑i
Ci,f
(17)×[exp
(−ziF ζ
RT
)− 1
])0.5
,
whereCi,f the concentration of ion i in the feed solution.In the second limiting case (ψs
cst), the Donnan potentiaat the feed side is assumed to be equal to the electrokipotential, then, according to Eqs. (10) and (16),X can berelated toζ by
(18)X = −n∑
i=1
ziCi,f φi exp
(−ziF
RTζ
).
Figure 1c shows the variation of the membrane volucharge as a function of the pore radius, assuming eithconstant surface charge (σ s
cst) or a constant surface potenti(ψs
cst) which leads to the upper and lower bounds forX,respectively.
3. Experimental
3.1. Membranes
The ceramic membranes used in this study are manutured by TAMI Industry (Nyons, France). These membrahave a multilayer structure with a titania filtering layer elaorated using a colloidal sol–gel process. Scanning elecmicroscopy (SEM) observations revealed a titania filterlayer of thickness∼1.6 µm. The physical characteristicsmembranes are given in Table 2.
Membranes are cast into two different forms:
– Tubes of 10 mm in external diameter and 600 mmlength, composed of three identical channels in clowith a hydraulic diameter of 3.6 mm (Clover CéRAINSIDE).
– Flat rectangular sheets (25× 75× 2 mm).
204 C. Labbez et al. / Journal of Colloid and Interface Science 262 (2003) 200–211
labbedt as.flux
m 1sshed
g,as
22]he
u-anse ofute-nsicdatatwasn-ten-ble
resmul-ionaan--endn ofcy-bledis
ated
asthe
thed inerenia
thelesh a
eahe
mm,ers
arying-45
lesition,100
oft-ac-six
atandyer(ex-ake
mi-d as
-as-
oten-ring
ted
Table 2Physical characteristics of multilayered ceramic membranes
Support Intermediate Filteringlayer layer
Nature Al2O3–TiO2 ZrO2 TiO2 (rutile)Thickness (µm) 1000 10 1–2Mean pore radius 0.5 µm 0.1 µm 2 nmPorosity (%) 35 40 –
3.2. Filtration equipment
Filtration experiments were performed on a Tami1000C filtration unit. The experimental setup is descrielsewhere [15]. All experiments were carried out aconstant temperature of 40±1 ◦C on the tubular membraneRetentions were measured as a function of the permeateby varying the transmembrane pressure difference froto 8 bar. The cross-flow velocity range was 3 to 12 m–1.After each change of solute, the membrane was wawith a NaOH solution (15 g/l) during 30 min and with aHNO3 solution (0.05 M) during 15 min. After each washinthe membrane was rinsed with water until natural pH wobtained.
The concentration polarization (CP) phenomenon [was taken into account for all experimental results. Tsemiempirical relation of Dittus and Boelter [23] for turblent flow in channels was used to calculate the mass trfer coefficient in the boundary layer on the upstream sidthe membrane. This relation, given elsewhere [14], is soldependent. From this mass transfer coefficient, the intriretention was calculated. Consequently, all the retentionreported in this work are intrinsic (Rint) ones. For almosall the transmembrane pressure, the cross-flow velocityhigher than 5 m s–1 so that the retention corrected for cocentration polarization was very close to be observed retion (the correction of the feed concentration is negligiP < 6 bar and reaches less than 20% at 7 bar).
3.3. Permporometry measurements
This method is based on controlled blocking of poby capillary condensation of a condensable gas and sitaneous measurement of a noncondensable gas diffusflux, through the remaining open pores. The main advtages of this method are to discriminate between deadpores and active pores and to allow the determinatiothe pore sizes of supported membranes. In this work,clohexane and O2 were used as humid and noncondensagases, respectively. The measurement of the pore sizetribution was performed on flat membrane and was repethree times.
3.4. Electrophoretic measurements
The electrokinetic potential of the filtering layer wobtained by measuring the electrophoretic mobility of
-
l
-
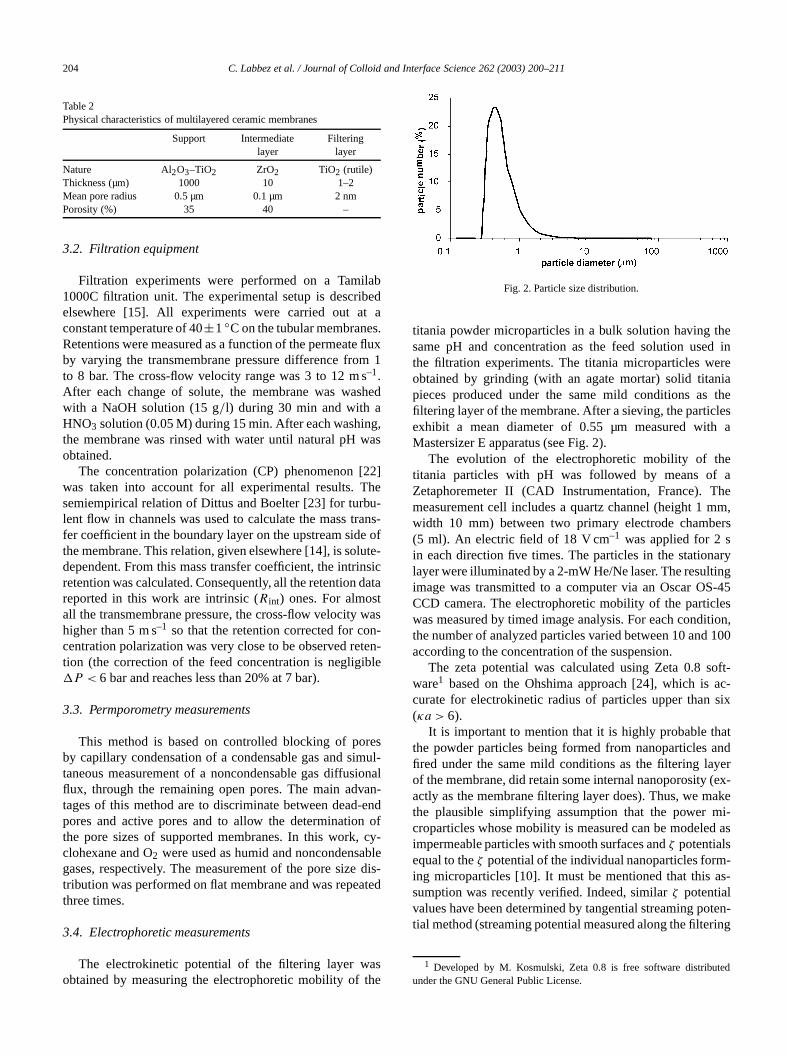
Fig. 2. Particle size distribution.
titania powder microparticles in a bulk solution havingsame pH and concentration as the feed solution usethe filtration experiments. The titania microparticles wobtained by grinding (with an agate mortar) solid titapieces produced under the same mild conditions asfiltering layer of the membrane. After a sieving, the particexhibit a mean diameter of 0.55 µm measured witMastersizer E apparatus (see Fig. 2).
The evolution of the electrophoretic mobility of thtitania particles with pH was followed by means ofZetaphoremeter II (CAD Instrumentation, France). Tmeasurement cell includes a quartz channel (height 1width 10 mm) between two primary electrode chamb(5 ml). An electric field of 18 V cm–1 was applied for 2 sin each direction five times. The particles in the stationlayer were illuminated by a 2-mW He/Ne laser. The resultimage was transmitted to a computer via an Oscar OSCCD camera. The electrophoretic mobility of the particwas measured by timed image analysis. For each condthe number of analyzed particles varied between 10 andaccording to the concentration of the suspension.
The zeta potential was calculated using Zeta 0.8 sware1 based on the Ohshima approach [24], which iscurate for electrokinetic radius of particles upper than(κa > 6).
It is important to mention that it is highly probable ththe powder particles being formed from nanoparticlesfired under the same mild conditions as the filtering laof the membrane, did retain some internal nanoporosityactly as the membrane filtering layer does). Thus, we mthe plausible simplifying assumption that the powercroparticles whose mobility is measured can be modeleimpermeable particles with smooth surfaces andζ potentialsequal to theζ potential of the individual nanoparticles forming microparticles [10]. It must be mentioned that thissumption was recently verified. Indeed, similarζ potentialvalues have been determined by tangential streaming ptial method (streaming potential measured along the filte
1 Developed by M. Kosmulski, Zeta 0.8 is free software distribuunder the GNU General Public License.
C. Labbez et al. / Journal of Colloid and Interface Science 262 (2003) 200–211 205
re-
ht.en-mlure-d twbou
r
ntt aofanic
ere.edtoe
n of
othem-s. Ine re-
ural
olu-
,ntionodelex-ten-ral
larthe
M—
e ra-nd.t.3).
aspleiaa
orereed a
nthe
ood
try,GsheEG
aytote
layer of the tubular membrane). These results will be psented in a forthcoming publication [25].
Particles suspensions (100 mg l−1) in electrolyte solu-tions of 1 mol m–3 were prepared and dispersed overnigAliquots (50 ml) were then used to equilibrate the suspsion at each pH value (for 10 min). Approximately 20of that suspension was introduced into the cell for measments. For each pH value, measurements were repeatetimes. The average number of measured particles was a50 for each measurement.
3.5. Chemicals
All solutions were prepared from Milli-Q quality wate(conductivity< 1 µS cm–1).
3.5.1. Uncharged solutesSolutions of polyethylene glycol (PEG) with differe
molecular weights (200, 400, 600, 1000, 1500 Da) aconcentration of 2 g l−1 were filtered. The concentrationsPEG in feed and permeate were determined by total orgcontent (TOC) measurements.
3.5.2. Single salt solutionsThe salts used in the experiments (EM and filtration) w
KCl, K2SO4, MgCl2, and MgSO4 of pure analytical gradeFor filtration experiments, salt solutions were analyzeither by conductimetry (when the conductivity dueH3O+ and OH− ions is negligible compared to that of thelectrolyte) or by atomic absorption.
Experiments were performed at a fixed concentratio1 mol m–3 wirh the pH value varying from 3 to 9.
4. Results and discussion
4.1. Characterization of membrane pore size
The mean pore size of the membrane is used for bevaluating steric effects and calculating the effective mbrane volume charge from zeta potential measurementthis study, the pore size was determined by analyzing thtention of neutral solutes and by permporometry.
4.1.1. Retention of neutral solutesIn the scope of the DSPM model, the membrane struct
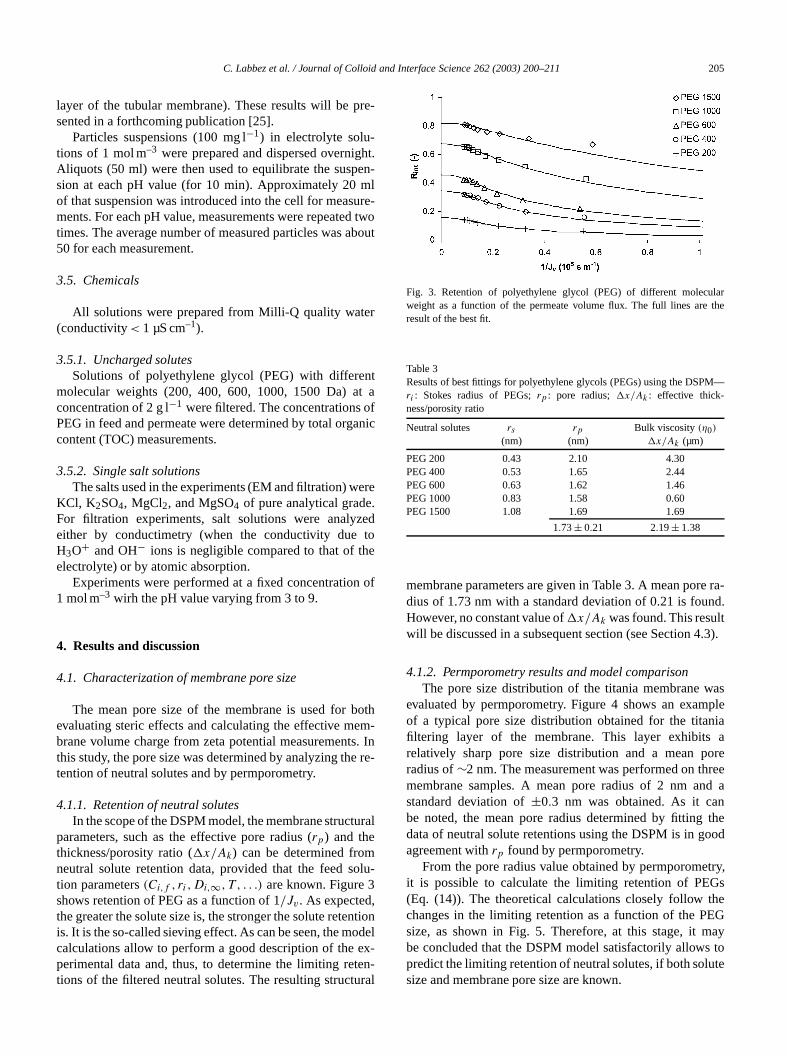
parameters, such as the effective pore radius (rp) and thethickness/porosity ratio (x/Ak) can be determined fromneutral solute retention data, provided that the feed stion parameters(Ci,f , ri,Di,∞, T , . . .) are known. Figure 3shows retention of PEG as a function of 1/Jv . As expectedthe greater the solute size is, the stronger the solute reteis. It is the so-called sieving effect. As can be seen, the mcalculations allow to perform a good description of theperimental data and, thus, to determine the limiting retions of the filtered neutral solutes. The resulting structu
ot
Fig. 3. Retention of polyethylene glycol (PEG) of different molecuweight as a function of the permeate volume flux. The full lines areresult of the best fit.
Table 3Results of best fittings for polyethylene glycols (PEGs) using the DSPri : Stokes radius of PEGs;rp : pore radius;x/Ak : effective thick-ness/porosity ratio
Neutral solutes rs rp Bulk viscosity(η0)
(nm) (nm) x/Ak (µm)
PEG 200 0.43 2.10 4.30PEG 400 0.53 1.65 2.44PEG 600 0.63 1.62 1.46PEG 1000 0.83 1.58 0.60PEG 1500 1.08 1.69 1.69
1.73± 0.21 2.19± 1.38
membrane parameters are given in Table 3. A mean pordius of 1.73 nm with a standard deviation of 0.21 is fouHowever, no constant value ofx/Ak was found. This resulwill be discussed in a subsequent section (see Section 4
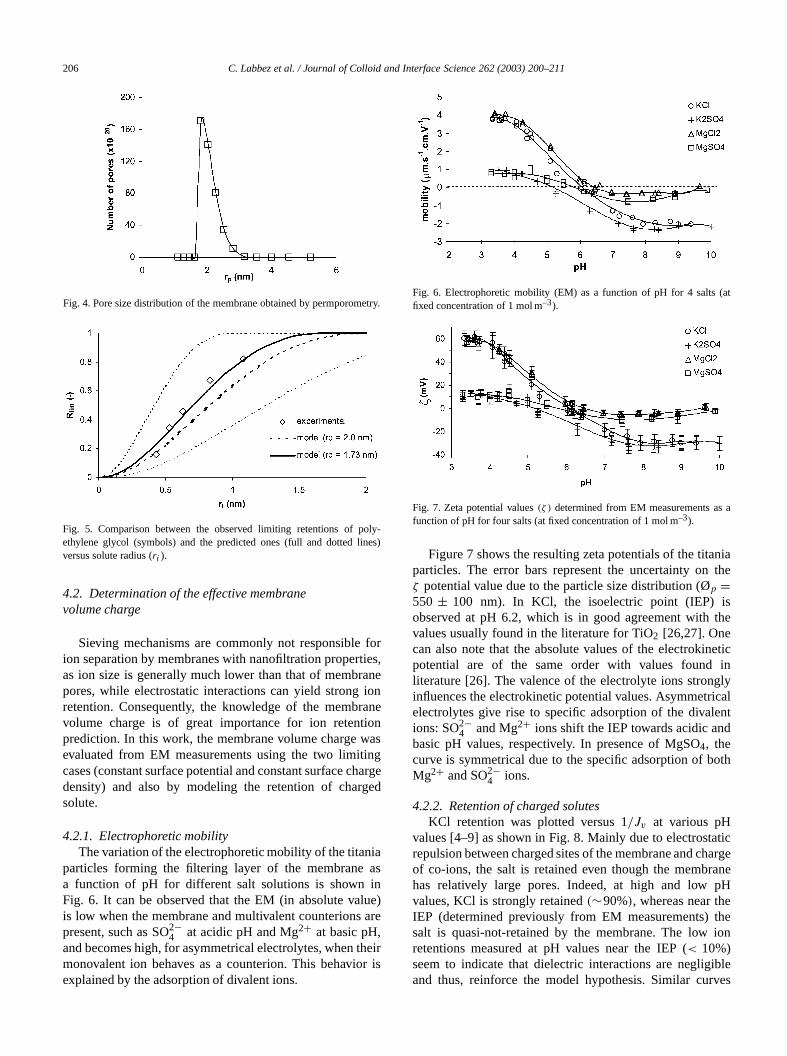
4.1.2. Permporometry results and model comparisonThe pore size distribution of the titania membrane w
evaluated by permporometry. Figure 4 shows an examof a typical pore size distribution obtained for the titanfiltering layer of the membrane. This layer exhibitsrelatively sharp pore size distribution and a mean pradius of∼2 nm. The measurement was performed on thmembrane samples. A mean pore radius of 2 nm anstandard deviation of±0.3 nm was obtained. As it cabe noted, the mean pore radius determined by fittingdata of neutral solute retentions using the DSPM is in gagreement withrp found by permporometry.
From the pore radius value obtained by permporomeit is possible to calculate the limiting retention of PE(Eq. (14)). The theoretical calculations closely follow tchanges in the limiting retention as a function of the Psize, as shown in Fig. 5. Therefore, at this stage, it mbe concluded that the DSPM model satisfactorily allowspredict the limiting retention of neutral solutes, if both solusize and membrane pore size are known.
206 C. Labbez et al. / Journal of Colloid and Interface Science 262 (2003) 200–211
etry.
oly-nes)
forties,aneion
raneionwasinghargged
iaasinlue)are
theiror is
(at
s a
niathe
isthe
eticin
glyicallentd
oth
atichargeranepHetheion
ibleves
Fig. 4. Pore size distribution of the membrane obtained by permporom
Fig. 5. Comparison between the observed limiting retentions of pethylene glycol (symbols) and the predicted ones (full and dotted liversus solute radius (ri ).
4.2. Determination of the effective membranevolume charge
Sieving mechanisms are commonly not responsibleion separation by membranes with nanofiltration properas ion size is generally much lower than that of membrpores, while electrostatic interactions can yield strongretention. Consequently, the knowledge of the membvolume charge is of great importance for ion retentprediction. In this work, the membrane volume chargeevaluated from EM measurements using the two limitcases (constant surface potential and constant surface cdensity) and also by modeling the retention of charsolute.
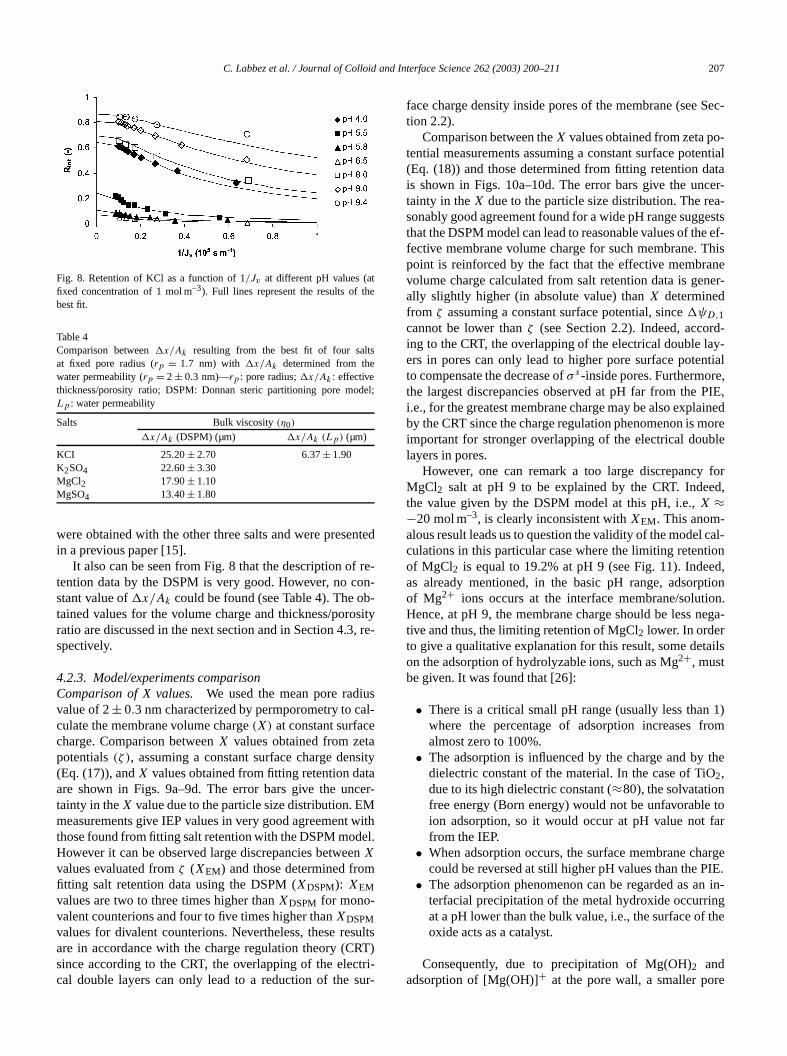
4.2.1. Electrophoretic mobilityThe variation of the electrophoretic mobility of the titan
particles forming the filtering layer of the membranea function of pH for different salt solutions is shownFig. 6. It can be observed that the EM (in absolute vais low when the membrane and multivalent counterionspresent, such as SO2−
4 at acidic pH and Mg2+ at basic pH,and becomes high, for asymmetrical electrolytes, whenmonovalent ion behaves as a counterion. This behaviexplained by the adsorption of divalent ions.
e
Fig. 6. Electrophoretic mobility (EM) as a function of pH for 4 saltsfixed concentration of 1 mol m–3).
Fig. 7. Zeta potential values(ζ ) determined from EM measurements afunction of pH for four salts (at fixed concentration of 1 mol m–3).
Figure 7 shows the resulting zeta potentials of the titaparticles. The error bars represent the uncertainty onζ potential value due to the particle size distribution (Øp =550 ± 100 nm). In KCl, the isoelectric point (IEP)observed at pH 6.2, which is in good agreement withvalues usually found in the literature for TiO2 [26,27]. Onecan also note that the absolute values of the electrokinpotential are of the same order with values foundliterature [26]. The valence of the electrolyte ions stroninfluences the electrokinetic potential values. Asymmetrelectrolytes give rise to specific adsorption of the divaions: SO2−
4 and Mg2+ ions shift the IEP towards acidic anbasic pH values, respectively. In presence of MgSO4, thecurve is symmetrical due to the specific adsorption of bMg2+ and SO2−
4 ions.
4.2.2. Retention of charged solutesKCl retention was plotted versus 1/Jv at various pH
values [4–9] as shown in Fig. 8. Mainly due to electrostrepulsion between charged sites of the membrane and cof co-ions, the salt is retained even though the membhas relatively large pores. Indeed, at high and lowvalues, KCl is strongly retained(∼90%), whereas near thIEP (determined previously from EM measurements)salt is quasi-not-retained by the membrane. The lowretentions measured at pH values near the IEP (< 10%)seem to indicate that dielectric interactions are negligand thus, reinforce the model hypothesis. Similar cur
C. Labbez et al. / Journal of Colloid and Interface Science 262 (2003) 200–211 207
te
s
del;
nted
re-on-b-sity, re-
usal-easitytacer-Mwithel.n
sultsRT)tri-ur-
Sec-
-entialatacer-a-estse ef-Thisne
ner-
d-ay-ntial,
PIE,inedore
ble
fored,
cal-ioned,tion
ion.ega-
ails
1)rom
the
tofar
argeIE.n in-ngthe
e
Fig. 8. Retention of KCl as a function of 1/Jv at different pH values (afixed concentration of 1 mol m–3). Full lines represent the results of thbest fit.
Table 4Comparison betweenx/Ak resulting from the best fit of four saltat fixed pore radius (rp = 1.7 nm) with x/Ak determined from thewater permeability (rp = 2 ± 0.3 nm)—rp : pore radius;x/Ak : effectivethickness/porosity ratio; DSPM: Donnan steric partitioning pore moLp : water permeability
Salts Bulk viscosity(η0)
x/Ak (DSPM) (µm) x/Ak (Lp) (µm)
KCI 25.20± 2.70 6.37± 1.90K2SO4 22.60± 3.30MgCl2 17.90± 1.10MgSO4 13.40± 1.80
were obtained with the other three salts and were presein a previous paper [15].
It also can be seen from Fig. 8 that the description oftention data by the DSPM is very good. However, no cstant value ofx/Ak could be found (see Table 4). The otained values for the volume charge and thickness/pororatio are discussed in the next section and in Section 4.3spectively.
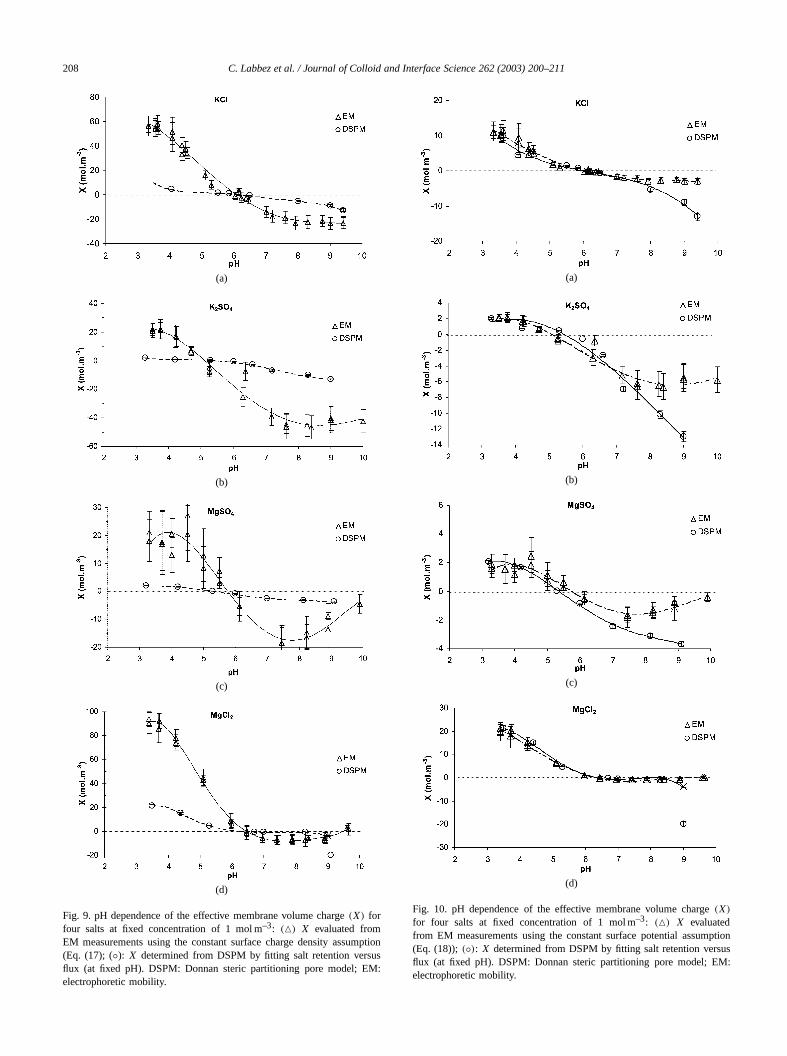
4.2.3. Model/experiments comparisonComparison of X values. We used the mean pore radivalue of 2± 0.3 nm characterized by permporometry to cculate the membrane volume charge(X) at constant surfaccharge. Comparison betweenX values obtained from zetpotentials(ζ ), assuming a constant surface charge den(Eq. (17)), andX values obtained from fitting retention daare shown in Figs. 9a–9d. The error bars give the untainty in theX value due to the particle size distribution. Emeasurements give IEP values in very good agreementthose found from fitting salt retention with the DSPM modHowever it can be observed large discrepancies betweeX
values evaluated fromζ (XEM) and those determined fromfitting salt retention data using the DSPM (XDSPM): XEMvalues are two to three times higher thanXDSPM for mono-valent counterions and four to five times higher thanXDSPMvalues for divalent counterions. Nevertheless, these reare in accordance with the charge regulation theory (Csince according to the CRT, the overlapping of the eleccal double layers can only lead to a reduction of the s
face charge density inside pores of the membrane (seetion 2.2).
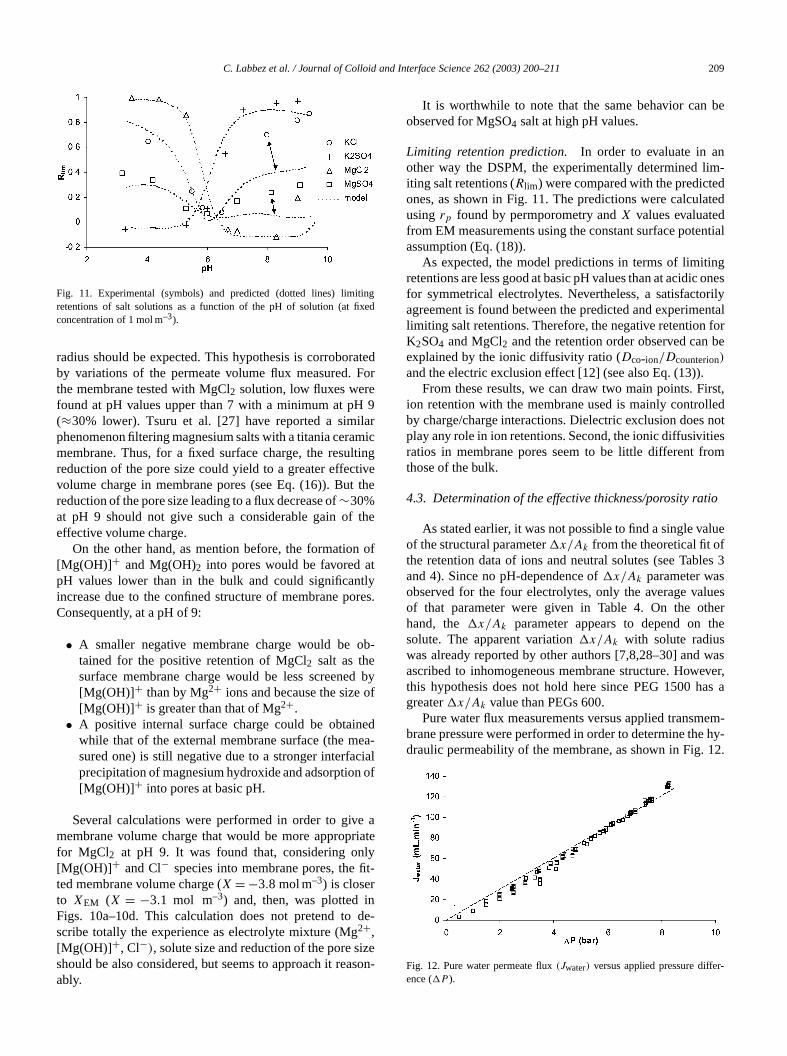
Comparison between theX values obtained from zeta potential measurements assuming a constant surface pot(Eq. (18)) and those determined from fitting retention dis shown in Figs. 10a–10d. The error bars give the untainty in theX due to the particle size distribution. The resonably good agreement found for a wide pH range suggthat the DSPM model can lead to reasonable values of thfective membrane volume charge for such membrane.point is reinforced by the fact that the effective membravolume charge calculated from salt retention data is geally slightly higher (in absolute value) thanX determinedfrom ζ assuming a constant surface potential, sinceψD,1cannot be lower thanζ (see Section 2.2). Indeed, accoring to the CRT, the overlapping of the electrical double lers in pores can only lead to higher pore surface poteto compensate the decrease ofσ s -inside pores. Furthermorethe largest discrepancies observed at pH far from thei.e., for the greatest membrane charge may be also explaby the CRT since the charge regulation phenomenon is mimportant for stronger overlapping of the electrical doulayers in pores.
However, one can remark a too large discrepancyMgCl2 salt at pH 9 to be explained by the CRT. Indethe value given by the DSPM model at this pH, i.e.,X ≈−20 mol m–3, is clearly inconsistent withXEM. This anom-alous result leads us to question the validity of the modelculations in this particular case where the limiting retentof MgCl2 is equal to 19.2% at pH 9 (see Fig. 11). Indeas already mentioned, in the basic pH range, adsorpof Mg2+ ions occurs at the interface membrane/solutHence, at pH 9, the membrane charge should be less ntive and thus, the limiting retention of MgCl2 lower. In orderto give a qualitative explanation for this result, some deton the adsorption of hydrolyzable ions, such as Mg2+, mustbe given. It was found that [26]:
• There is a critical small pH range (usually less thanwhere the percentage of adsorption increases falmost zero to 100%.
• The adsorption is influenced by the charge and bydielectric constant of the material. In the case of TiO2,due to its high dielectric constant (≈80), the solvatationfree energy (Born energy) would not be unfavorableion adsorption, so it would occur at pH value notfrom the IEP.
• When adsorption occurs, the surface membrane chcould be reversed at still higher pH values than the P
• The adsorption phenomenon can be regarded as aterfacial precipitation of the metal hydroxide occurriat a pH lower than the bulk value, i.e., the surface ofoxide acts as a catalyst.
Consequently, due to precipitation of Mg(OH)2 andadsorption of [Mg(OH)]+ at the pore wall, a smaller por
208 C. Labbez et al. / Journal of Colloid and Interface Science 262 (2003) 200–211
mptiousM:
ptionusM:
(a)
(b)
(c)
(d)
Fig. 9. pH dependence of the effective membrane volume charge(X) forfour salts at fixed concentration of 1 mol m–3: (�) X evaluated fromEM measurements using the constant surface charge density assu(Eq. (17); (◦): X determined from DSPM by fitting salt retention versflux (at fixed pH). DSPM: Donnan steric partitioning pore model; Eelectrophoretic mobility.
n
(a)
(b)
(c)
(d)
Fig. 10. pH dependence of the effective membrane volume charge(X)
for four salts at fixed concentration of 1 mol m–3: (�) X evaluatedfrom EM measurements using the constant surface potential assum(Eq. (18));(◦): X determined from DSPM by fitting salt retention versflux (at fixed pH). DSPM: Donnan steric partitioning pore model; Eelectrophoretic mobility.
C. Labbez et al. / Journal of Colloid and Interface Science 262 (2003) 200–211 209
ingxed
atedFor
9larmicltingtivethe
the
ofttlyores
ob-
d byof
edea-cial
of
e ariatelyfit-
nde-
izeson
be
nim-d
ated
ntial
ngonesrily
entalforbe
irst,llednot
iesom
lue
les 3
luesherthe
wasever,as a
em-hy-
12.
r-
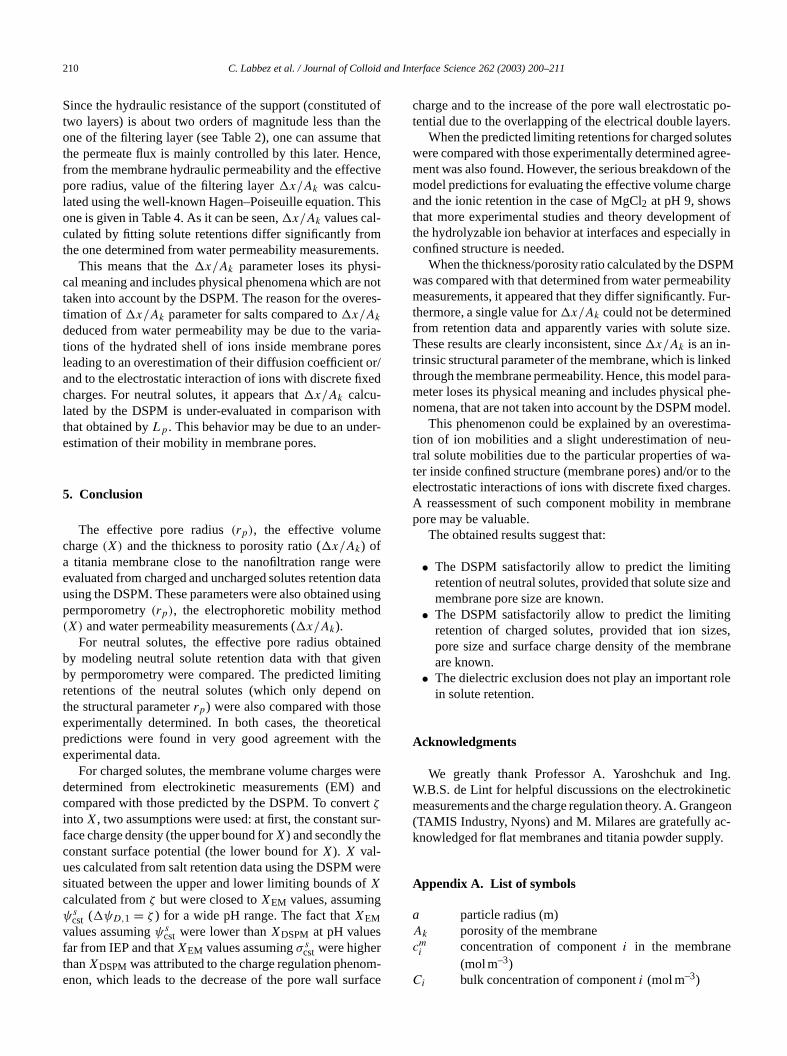
Fig. 11. Experimental (symbols) and predicted (dotted lines) limitretentions of salt solutions as a function of the pH of solution (at ficoncentration of 1 mol m–3).
radius should be expected. This hypothesis is corroborby variations of the permeate volume flux measured.the membrane tested with MgCl2 solution, low fluxes werefound at pH values upper than 7 with a minimum at pH(≈30% lower). Tsuru et al. [27] have reported a simiphenomenon filtering magnesium salts with a titania ceramembrane. Thus, for a fixed surface charge, the resureduction of the pore size could yield to a greater effecvolume charge in membrane pores (see Eq. (16)). Butreduction of the pore size leading to a flux decrease of∼30%at pH 9 should not give such a considerable gain ofeffective volume charge.
On the other hand, as mention before, the formation[Mg(OH)]+ and Mg(OH)2 into pores would be favored apH values lower than in the bulk and could significanincrease due to the confined structure of membrane pConsequently, at a pH of 9:
• A smaller negative membrane charge would betained for the positive retention of MgCl2 salt as thesurface membrane charge would be less screene[Mg(OH)]+ than by Mg2+ ions and because the size[Mg(OH)]+ is greater than that of Mg2+.
• A positive internal surface charge could be obtainwhile that of the external membrane surface (the msured one) is still negative due to a stronger interfaprecipitation of magnesium hydroxide and adsorption[Mg(OH)]+ into pores at basic pH.
Several calculations were performed in order to givmembrane volume charge that would be more appropfor MgCl2 at pH 9. It was found that, considering on[Mg(OH)]+ and Cl− species into membrane pores, theted membrane volume charge (X = −3.8 mol m–3) is closerto XEM (X = −3.1 mol m–3) and, then, was plotted iFigs. 10a–10d. This calculation does not pretend toscribe totally the experience as electrolyte mixture (Mg2+,[Mg(OH)]+, Cl−), solute size and reduction of the pore sshould be also considered, but seems to approach it reaably.
.
-
It is worthwhile to note that the same behavior canobserved for MgSO4 salt at high pH values.
Limiting retention prediction. In order to evaluate in aother way the DSPM, the experimentally determined liting salt retentions (Rlim) were compared with the predicteones, as shown in Fig. 11. The predictions were calculusing rp found by permporometry andX values evaluatedfrom EM measurements using the constant surface poteassumption (Eq. (18)).
As expected, the model predictions in terms of limitiretentions are less good at basic pH values than at acidicfor symmetrical electrolytes. Nevertheless, a satisfactoagreement is found between the predicted and experimlimiting salt retentions. Therefore, the negative retentionK2SO4 and MgCl2 and the retention order observed canexplained by the ionic diffusivity ratio (Dco-ion/Dcounterion)
and the electric exclusion effect [12] (see also Eq. (13)).From these results, we can draw two main points. F
ion retention with the membrane used is mainly controby charge/charge interactions. Dielectric exclusion doesplay any role in ion retentions. Second, the ionic diffusivitratios in membrane pores seem to be little different frthose of the bulk.
4.3. Determination of the effective thickness/porosity ratio
As stated earlier, it was not possible to find a single vaof the structural parameterx/Ak from the theoretical fit ofthe retention data of ions and neutral solutes (see Taband 4). Since no pH-dependence ofx/Ak parameter wasobserved for the four electrolytes, only the average vaof that parameter were given in Table 4. On the othand, thex/Ak parameter appears to depend onsolute. The apparent variationx/Ak with solute radiuswas already reported by other authors [7,8,28–30] andascribed to inhomogeneous membrane structure. Howthis hypothesis does not hold here since PEG 1500 hgreaterx/Ak value than PEGs 600.
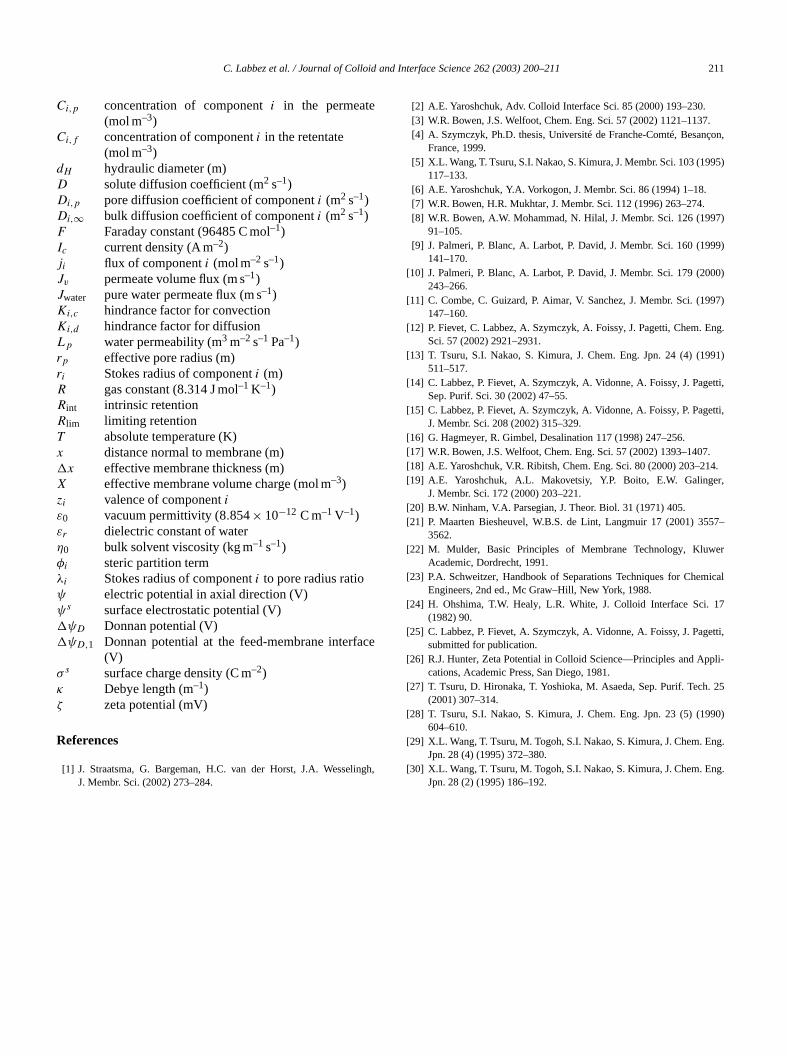
Pure water flux measurements versus applied transmbrane pressure were performed in order to determine thedraulic permeability of the membrane, as shown in Fig.
Fig. 12. Pure water permeate flux(Jwater) versus applied pressure diffeence (P ).
210 C. Labbez et al. / Journal of Colloid and Interface Science 262 (2003) 200–211
d ofthethace,tive
his
mnts.i-e nores-
ria-res
or/xed
ither-
eredat
usind
nedeningoneticalthe
werandrtsur-
erefg
m-face
po-ers.tesree-f therge
nt ofly in
PMilityFur-dize.
kedara-phe-del.
ima-u-a-thees.
rane
gand
ges,rane
ole
ng.ticgeonc-ly.
Since the hydraulic resistance of the support (constitutetwo layers) is about two orders of magnitude less thanone of the filtering layer (see Table 2), one can assumethe permeate flux is mainly controlled by this later. Henfrom the membrane hydraulic permeability and the effecpore radius, value of the filtering layerx/Ak was calcu-lated using the well-known Hagen–Poiseuille equation. Tone is given in Table 4. As it can be seen,x/Ak values cal-culated by fitting solute retentions differ significantly frothe one determined from water permeability measureme
This means that thex/Ak parameter loses its physcal meaning and includes physical phenomena which artaken into account by the DSPM. The reason for the ovetimation ofx/Ak parameter for salts compared tox/Ak
deduced from water permeability may be due to the vations of the hydrated shell of ions inside membrane poleading to an overestimation of their diffusion coefficientand to the electrostatic interaction of ions with discrete ficharges. For neutral solutes, it appears thatx/Ak calcu-lated by the DSPM is under-evaluated in comparison wthat obtained byLp . This behavior may be due to an undestimation of their mobility in membrane pores.
5. Conclusion
The effective pore radius(rp), the effective volumecharge(X) and the thickness to porosity ratio (x/Ak) ofa titania membrane close to the nanofiltration range wevaluated from charged and uncharged solutes retentionusing the DSPM. These parameters were also obtainedpermporometry(rp), the electrophoretic mobility metho(X) and water permeability measurements (x/Ak).
For neutral solutes, the effective pore radius obtaiby modeling neutral solute retention data with that givby permporometry were compared. The predicted limitretentions of the neutral solutes (which only dependthe structural parameterrp) were also compared with thosexperimentally determined. In both cases, the theorepredictions were found in very good agreement withexperimental data.
For charged solutes, the membrane volume chargesdetermined from electrokinetic measurements (EM)compared with those predicted by the DSPM. To conveζintoX, two assumptions were used: at first, the constantface charge density (the upper bound forX) and secondly theconstant surface potential (the lower bound forX). X val-ues calculated from salt retention data using the DSPM wsituated between the upper and lower limiting bounds oX
calculated fromζ but were closed toXEM values, assuminψs
cst (ψD,1 = ζ ) for a wide pH range. The fact thatXEM
values assumingψscst were lower thanXDSPM at pH values
far from IEP and thatXEM values assumingσ scst were higher
thanXDSPM was attributed to the charge regulation phenoenon, which leads to the decrease of the pore wall sur
t
t
ag
e
charge and to the increase of the pore wall electrostatictential due to the overlapping of the electrical double lay
When the predicted limiting retentions for charged soluwere compared with those experimentally determined agment was also found. However, the serious breakdown omodel predictions for evaluating the effective volume chaand the ionic retention in the case of MgCl2 at pH 9, showsthat more experimental studies and theory developmethe hydrolyzable ion behavior at interfaces and especialconfined structure is needed.
When the thickness/porosity ratio calculated by the DSwas compared with that determined from water permeabmeasurements, it appeared that they differ significantly.thermore, a single value forx/Ak could not be determinefrom retention data and apparently varies with solute sThese results are clearly inconsistent, sincex/Ak is an in-trinsic structural parameter of the membrane, which is linthrough the membrane permeability. Hence, this model pmeter loses its physical meaning and includes physicalnomena, that are not taken into account by the DSPM mo
This phenomenon could be explained by an overesttion of ion mobilities and a slight underestimation of netral solute mobilities due to the particular properties of wter inside confined structure (membrane pores) and/or toelectrostatic interactions of ions with discrete fixed chargA reassessment of such component mobility in membpore may be valuable.
The obtained results suggest that:
• The DSPM satisfactorily allow to predict the limitinretention of neutral solutes, provided that solute sizemembrane pore size are known.
• The DSPM satisfactorily allow to predict the limitinretention of charged solutes, provided that ion sizpore size and surface charge density of the membare known.
• The dielectric exclusion does not play an important rin solute retention.
Acknowledgments
We greatly thank Professor A. Yaroshchuk and IW.B.S. de Lint for helpful discussions on the electrokinemeasurements and the charge regulation theory. A. Gran(TAMIS Industry, Nyons) and M. Milares are gratefully aknowledged for flat membranes and titania powder supp
Appendix A. List of symbols
a particle radius (m)Ak porosity of the membranecmi concentration of componenti in the membrane
(mol m–3)Ci bulk concentration of componenti (mol m–3)
C. Labbez et al. / Journal of Colloid and Interface Science 262 (2003) 200–211 211
ace
ingh,
.çon,
95)
7)
99)
00)
97)
ng.
91)
etti,
etti,
.4.,
57–
er
ical
17
etti,
pli-
. 25
90)
ng.
ng.
Ci,p concentration of componenti in the permeate(mol m–3)
Ci,f concentration of componenti in the retentate(mol m–3)
dH hydraulic diameter (m)D solute diffusion coefficient (m2 s–1)Di,p pore diffusion coefficient of componenti (m2 s–1)Di,∞ bulk diffusion coefficient of componenti (m2 s–1)F Faraday constant (96485 C mol–1)Ic current density (A m–2)ji flux of componenti (mol m–2 s–1)Jv permeate volume flux (m s–1)Jwater pure water permeate flux (m s–1)Ki,c hindrance factor for convectionKi,d hindrance factor for diffusionLp water permeability (m3 m–2s–1 Pa–1)rp effective pore radius (m)ri Stokes radius of componenti (m)R gas constant (8.314 J mol–1K–1)Rint intrinsic retentionRlim limiting retentionT absolute temperature (K)x distance normal to membrane (m)x effective membrane thickness (m)X effective membrane volume charge (mol m–3)zi valence of componentiε0 vacuum permittivity (8.854× 10⁻¹² C m–1V–1)εr dielectric constant of waterη0 bulk solvent viscosity (kg m–1s–1)φi steric partition termλi Stokes radius of componenti to pore radius ratioψ electric potential in axial direction (V)ψs surface electrostatic potential (V)ψD Donnan potential (V)ψD,1 Donnan potential at the feed-membrane interf
(V)σ s surface charge density (C m–2)κ Debye length (m–1)ζ zeta potential (mV)
References
[1] J. Straatsma, G. Bargeman, H.C. van der Horst, J.A. WesselJ. Membr. Sci. (2002) 273–284.
[2] A.E. Yaroshchuk, Adv. Colloid Interface Sci. 85 (2000) 193–230.[3] W.R. Bowen, J.S. Welfoot, Chem. Eng. Sci. 57 (2002) 1121–1137[4] A. Szymczyk, Ph.D. thesis, Université de Franche-Comté, Besan
France, 1999.[5] X.L. Wang, T. Tsuru, S.I. Nakao, S. Kimura, J. Membr. Sci. 103 (19
117–133.[6] A.E. Yaroshchuk, Y.A. Vorkogon, J. Membr. Sci. 86 (1994) 1–18.[7] W.R. Bowen, H.R. Mukhtar, J. Membr. Sci. 112 (1996) 263–274.[8] W.R. Bowen, A.W. Mohammad, N. Hilal, J. Membr. Sci. 126 (199
91–105.[9] J. Palmeri, P. Blanc, A. Larbot, P. David, J. Membr. Sci. 160 (19
141–170.[10] J. Palmeri, P. Blanc, A. Larbot, P. David, J. Membr. Sci. 179 (20
243–266.[11] C. Combe, C. Guizard, P. Aimar, V. Sanchez, J. Membr. Sci. (19
147–160.[12] P. Fievet, C. Labbez, A. Szymczyk, A. Foissy, J. Pagetti, Chem. E
Sci. 57 (2002) 2921–2931.[13] T. Tsuru, S.I. Nakao, S. Kimura, J. Chem. Eng. Jpn. 24 (4) (19
511–517.[14] C. Labbez, P. Fievet, A. Szymczyk, A. Vidonne, A. Foissy, J. Pag
Sep. Purif. Sci. 30 (2002) 47–55.[15] C. Labbez, P. Fievet, A. Szymczyk, A. Vidonne, A. Foissy, P. Pag
J. Membr. Sci. 208 (2002) 315–329.[16] G. Hagmeyer, R. Gimbel, Desalination 117 (1998) 247–256.[17] W.R. Bowen, J.S. Welfoot, Chem. Eng. Sci. 57 (2002) 1393–1407[18] A.E. Yaroshchuk, V.R. Ribitsh, Chem. Eng. Sci. 80 (2000) 203–21[19] A.E. Yaroshchuk, A.L. Makovetsiy, Y.P. Boito, E.W. Galinger
J. Membr. Sci. 172 (2000) 203–221.[20] B.W. Ninham, V.A. Parsegian, J. Theor. Biol. 31 (1971) 405.[21] P. Maarten Biesheuvel, W.B.S. de Lint, Langmuir 17 (2001) 35
3562.[22] M. Mulder, Basic Principles of Membrane Technology, Kluw
Academic, Dordrecht, 1991.[23] P.A. Schweitzer, Handbook of Separations Techniques for Chem
Engineers, 2nd ed., Mc Graw–Hill, New York, 1988.[24] H. Ohshima, T.W. Healy, L.R. White, J. Colloid Interface Sci.
(1982) 90.[25] C. Labbez, P. Fievet, A. Szymczyk, A. Vidonne, A. Foissy, J. Pag
submitted for publication.[26] R.J. Hunter, Zeta Potential in Colloid Science—Principles and Ap
cations, Academic Press, San Diego, 1981.[27] T. Tsuru, D. Hironaka, T. Yoshioka, M. Asaeda, Sep. Purif. Tech
(2001) 307–314.[28] T. Tsuru, S.I. Nakao, S. Kimura, J. Chem. Eng. Jpn. 23 (5) (19
604–610.[29] X.L. Wang, T. Tsuru, M. Togoh, S.I. Nakao, S. Kimura, J. Chem. E
Jpn. 28 (4) (1995) 372–380.[30] X.L. Wang, T. Tsuru, M. Togoh, S.I. Nakao, S. Kimura, J. Chem. E
Jpn. 28 (2) (1995) 186–192.