Embed Size (px)
Citation preview
Veterinary Parasitology 104 (2002) 167–173
Genetic structure of Oestrus ovis populationsin sheep and goats
C. Grisez-Duranton a,∗, Ph. Dorchies a, J. Jourdane b, P. Durand c
a Laboratoire de Parasitologie UMR 959, Physiopathologie des Maladies Infectieuses et Parasitaires desRuminants, Ecole Nationale Vétérinaire, 23 Chemin des Capelles, 31076 Toulouse Cedex 03, France
b Laboratoire de Biologie Animale, Centre de Biologie et d’Ecologie Tropicale et Méditerranéenne, UMR CNRS5555 Université, 52 Avenue de Villeneuve, 66860 Perpignan Cedex, France
c CEPM, UMR CNRS-IRD 9926, Centre de Recherche IRD, 911 Avenue Agropolis,BP 5045, 34032 Montpellier Cedex 1, France
Received 24 November 2000; received in revised form 4 October 2001; accepted 9 October 2001
Abstract
A genetic analysis using RAPD markers was performed on 12 natural populations of Oestrus ovis(Linné, 1761). Three-hundred and six O. ovis larvae (first, second and third instars) were randomlyrecovered in nasal cavities of sheep and goats naturally infected in Algeria, Ethiopia, France,Mauritania, Rumania and Tunisia and were analysed by 56 RAPD fragments. The results showeda high diversity within all samples. A significant genetic divergence was showed by discriminantanalyses among the 12 populations sampled (p < 0.0001). Moreover, discriminant analyses showedsignificant differentiation (p < 0.0001) between O. ovis larva populations of sheep and goats andalso among samples collected in the same region. © 2002 Elsevier Science B.V. All rights reserved.
Keywords: Oestrus ovis; Arthropoda; RAPD; Sheep; Goat
1. Introduction
The nasal bot fly Oestrus ovis occurs from temperate to tropical areas and its larval stagesare pathogenic for sheep and goats (Zumpt, 1965).
Females are larviparous. The life cycle of the bot fly is as follows: the first instar larvae(L1) are deposited upon the nostrils of the host and immediately crawl up the nasal passages.The second instar (L2) stays in the sinus and develops further. The third stage (L3) aresneezed out by the host onto the ground where they pupate. Adult flies emerge in about 4weeks later. Females are fertilised and look for a sheep or goat host. Infection rates and
∗ Corresponding author. Tel.: +33-561-193-872; fax: +33-561-193-944.E-mail address: [email protected] (C. Grisez-Duranton).
0304-4017/02/$ – see front matter © 2002 Elsevier Science B.V. All rights reserved.PII: S0 3 04 -4017 (01 )00617 -3
168 C. Grisez-Duranton et al. / Veterinary Parasitology 104 (2002) 167–173
larval burdens are always higher in sheep than in goats after natural infestations (Jagannathet al., 1989; Horak and Butt, 1977; Dorchies et al., 2000; D’Souza et al., 1991; Pathak,1992) and after artificial infestations (Duranton et al., 1999). Nevertheless, huge differencesoccur between sheep and goats responses even in a similar larval burden range (Nguyenet al., 1999). Identification of the parasite species is important for the design of an efficientcontrol plan. The aim of this study was to investigate the part of genetic diversity of O.ovis populations among the two hosts, to explain these differences and also to estimate thedivergence among natural populations of larvae harvested in different localities.
2. Materials and methods
2.1. Collection of larvae
Heads of sheep and goats were collected in slaughterhouses. Sagittal sections of eachhead were done and larvae present in the nasal passage were recovered. They were kept in70% alcohol. Table 1 lists the localities sampled, host species, and the number of O. ovislarvae collected for each sample. A total of 223 larvae from sheep and 83 from goats wereused in the genetic analysis.
2.2. Template DNA isolation and RAPD reaction
Template DNA for each larva was extracted using the protocol of Barral et al. (1993). Foreach sample a volume of 25 �l containing approximately 20 ng DNA template, 2.5 �l buffer(10 mM Tris–HCl pH 9.0, 50 mM KCl, 0.1% Triton X-100), 3 mM MgCl2, 0.1 mM of eachdNTP, 0.2 �M random primer and 1.0 unit of Taq polymerase (Promega) was incubatedin a MJ-Research PTC100 thermal cycler. The RAPD program was initialised with 3 min50 s at 92 ◦C, followed by 40 cycles of 1 min at 92 ◦C, 2 min at 35 ◦C, 2 min at 72 ◦C,terminated with 5 min at 72 ◦C. Products were separated by electrophoresis through a 1%agarose gel in TBE buffer, observed under UV light after staining with ethidium bromide
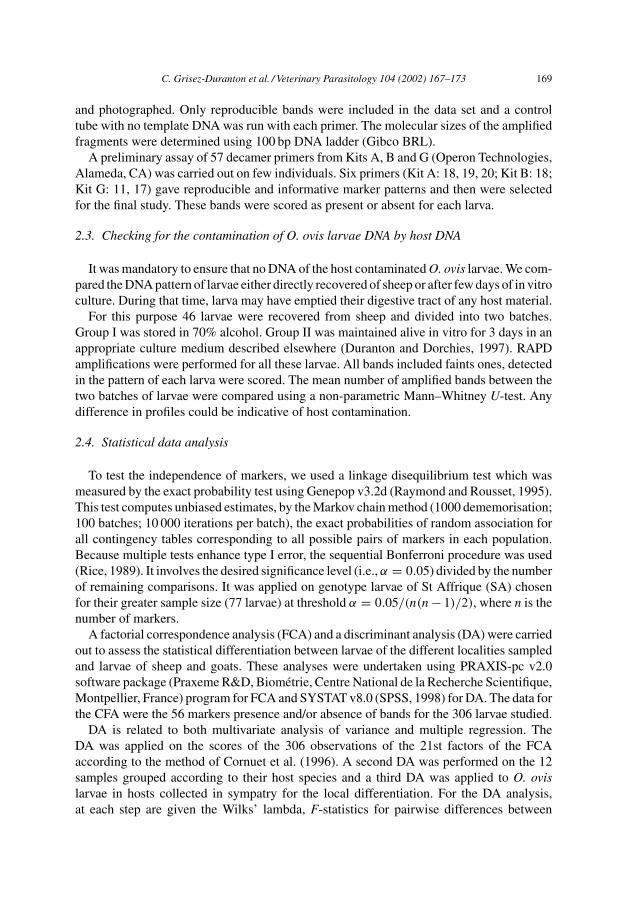
Table 1Larval instar stages of O. ovis sampled in European and African localities of two hosts species (sheep and goat)
Code Locality Country Host No. of larvae
SA St Affrique France Sheep 77GP Pezenas France Goat 13SP Pamiers France Sheep 29ST Timisoara Rumania Sheep 20SD Debrezeit Ethiopia Sheep 37GD Debrezeit Ethiopia Goat 14SC Constantine Algeria Sheep 11SS Sejnane Tunisia Sheep 17GS Sejnane Tunisia Goat 20SF Fahis Tunisia Sheep 7SN NKT Mauritania Sheep 25GN NKT Mauritania Goat 36
C. Grisez-Duranton et al. / Veterinary Parasitology 104 (2002) 167–173 169
and photographed. Only reproducible bands were included in the data set and a controltube with no template DNA was run with each primer. The molecular sizes of the amplifiedfragments were determined using 100 bp DNA ladder (Gibco BRL).
A preliminary assay of 57 decamer primers from Kits A, B and G (Operon Technologies,Alameda, CA) was carried out on few individuals. Six primers (Kit A: 18, 19, 20; Kit B: 18;Kit G: 11, 17) gave reproducible and informative marker patterns and then were selectedfor the final study. These bands were scored as present or absent for each larva.
2.3. Checking for the contamination of O. ovis larvae DNA by host DNA
It was mandatory to ensure that no DNA of the host contaminated O. ovis larvae. We com-pared the DNA pattern of larvae either directly recovered of sheep or after few days of in vitroculture. During that time, larva may have emptied their digestive tract of any host material.
For this purpose 46 larvae were recovered from sheep and divided into two batches.Group I was stored in 70% alcohol. Group II was maintained alive in vitro for 3 days in anappropriate culture medium described elsewhere (Duranton and Dorchies, 1997). RAPDamplifications were performed for all these larvae. All bands included faints ones, detectedin the pattern of each larva were scored. The mean number of amplified bands between thetwo batches of larvae were compared using a non-parametric Mann–Whitney U-test. Anydifference in profiles could be indicative of host contamination.
2.4. Statistical data analysis
To test the independence of markers, we used a linkage disequilibrium test which wasmeasured by the exact probability test using Genepop v3.2d (Raymond and Rousset, 1995).This test computes unbiased estimates, by the Markov chain method (1000 dememorisation;100 batches; 10 000 iterations per batch), the exact probabilities of random association forall contingency tables corresponding to all possible pairs of markers in each population.Because multiple tests enhance type I error, the sequential Bonferroni procedure was used(Rice, 1989). It involves the desired significance level (i.e., α = 0.05) divided by the numberof remaining comparisons. It was applied on genotype larvae of St Affrique (SA) chosenfor their greater sample size (77 larvae) at threshold α = 0.05/(n(n− 1)/2), where n is thenumber of markers.
A factorial correspondence analysis (FCA) and a discriminant analysis (DA) were carriedout to assess the statistical differentiation between larvae of the different localities sampledand larvae of sheep and goats. These analyses were undertaken using PRAXIS-pc v2.0software package (Praxeme R&D, Biométrie, Centre National de la Recherche Scientifique,Montpellier, France) program for FCA and SYSTAT v8.0 (SPSS, 1998) for DA. The data forthe CFA were the 56 markers presence and/or absence of bands for the 306 larvae studied.
DA is related to both multivariate analysis of variance and multiple regression. TheDA was applied on the scores of the 306 observations of the 21st factors of the FCAaccording to the method of Cornuet et al. (1996). A second DA was performed on the 12samples grouped according to their host species and a third DA was applied to O. ovislarvae in hosts collected in sympatry for the local differentiation. For the DA analysis,at each step are given the Wilks’ lambda, F-statistics for pairwise differences between
170 C. Grisez-Duranton et al. / Veterinary Parasitology 104 (2002) 167–173
group means, discriminant functions, classification and jackknife classification matriceswith percent correct classification (SYSTAT v8.0). Jackknifing is a numerical procedurethat consists in omitting, in turn, each unit (samples or markers) and then to recalculatefrom this diminished data set the different F-statistics.
3. Results
3.1. Polymorphic markers
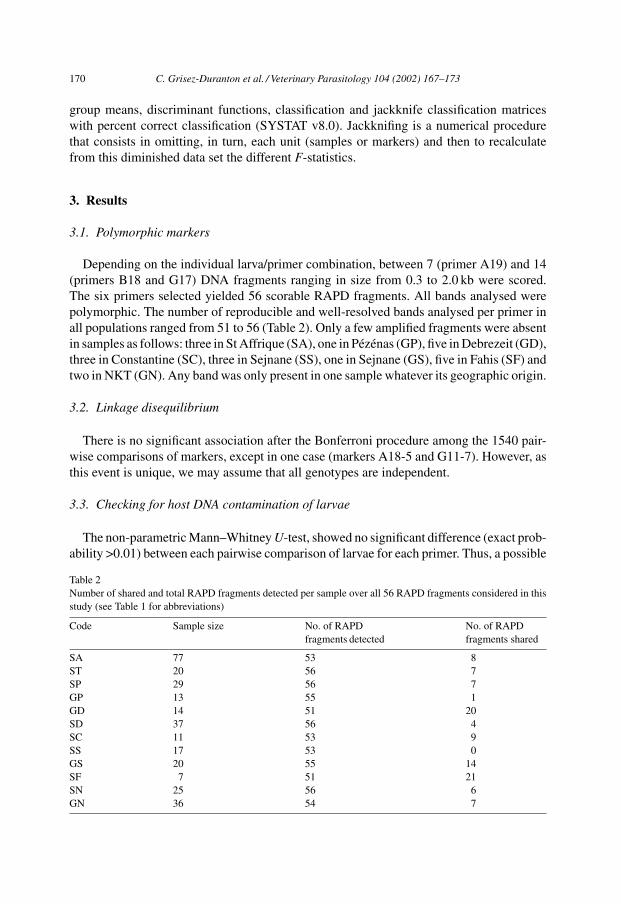
Depending on the individual larva/primer combination, between 7 (primer A19) and 14(primers B18 and G17) DNA fragments ranging in size from 0.3 to 2.0 kb were scored.The six primers selected yielded 56 scorable RAPD fragments. All bands analysed werepolymorphic. The number of reproducible and well-resolved bands analysed per primer inall populations ranged from 51 to 56 (Table 2). Only a few amplified fragments were absentin samples as follows: three in St Affrique (SA), one in Pézénas (GP), five in Debrezeit (GD),three in Constantine (SC), three in Sejnane (SS), one in Sejnane (GS), five in Fahis (SF) andtwo in NKT (GN). Any band was only present in one sample whatever its geographic origin.
3.2. Linkage disequilibrium
There is no significant association after the Bonferroni procedure among the 1540 pair-wise comparisons of markers, except in one case (markers A18-5 and G11-7). However, asthis event is unique, we may assume that all genotypes are independent.
3.3. Checking for host DNA contamination of larvae
The non-parametric Mann–Whitney U-test, showed no significant difference (exact prob-ability >0.01) between each pairwise comparison of larvae for each primer. Thus, a possible
Table 2Number of shared and total RAPD fragments detected per sample over all 56 RAPD fragments considered in thisstudy (see Table 1 for abbreviations)
Code Sample size No. of RAPDfragments detected
No. of RAPDfragments shared
SA 77 53 8ST 20 56 7SP 29 56 7GP 13 55 1GD 14 51 20SD 37 56 4SC 11 53 9SS 17 53 0GS 20 55 14SF 7 51 21SN 25 56 6GN 36 54 7
C. Grisez-Duranton et al. / Veterinary Parasitology 104 (2002) 167–173 171
contamination of DNA larva by the DNA of sheep was assumed to be negligible and it maybe supposed that it was also the case for larvae from goats.
3.4. Genetic divergence among larval samples
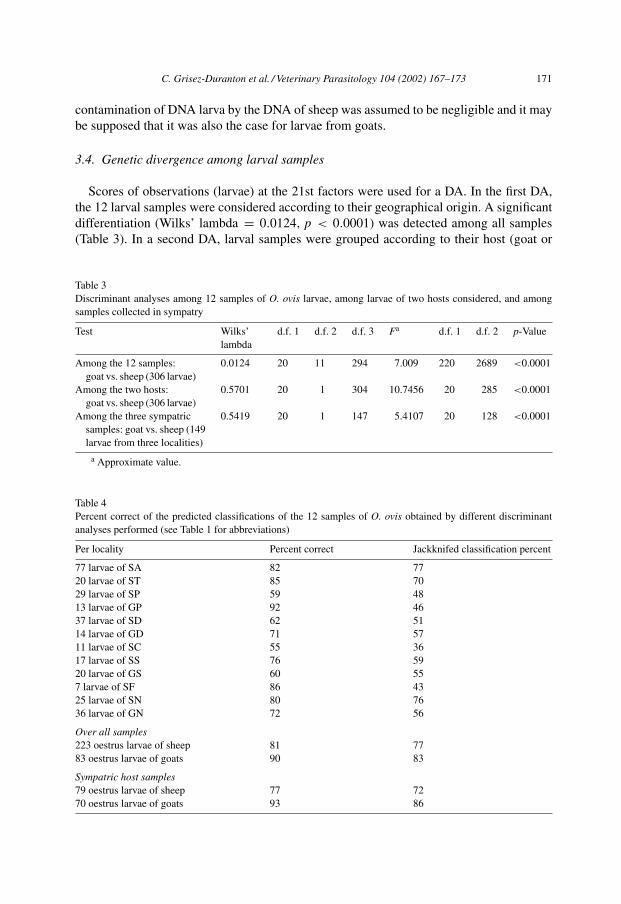
Scores of observations (larvae) at the 21st factors were used for a DA. In the first DA,the 12 larval samples were considered according to their geographical origin. A significantdifferentiation (Wilks’ lambda = 0.0124, p < 0.0001) was detected among all samples(Table 3). In a second DA, larval samples were grouped according to their host (goat or
Table 3Discriminant analyses among 12 samples of O. ovis larvae, among larvae of two hosts considered, and amongsamples collected in sympatry
Test Wilks’lambda
d.f. 1 d.f. 2 d.f. 3 Fa d.f. 1 d.f. 2 p-Value
Among the 12 samples:goat vs. sheep (306 larvae)
0.0124 20 11 294 7.009 220 2689 <0.0001
Among the two hosts:goat vs. sheep (306 larvae)
0.5701 20 1 304 10.7456 20 285 <0.0001
Among the three sympatricsamples: goat vs. sheep (149larvae from three localities)
0.5419 20 1 147 5.4107 20 128 <0.0001
a Approximate value.
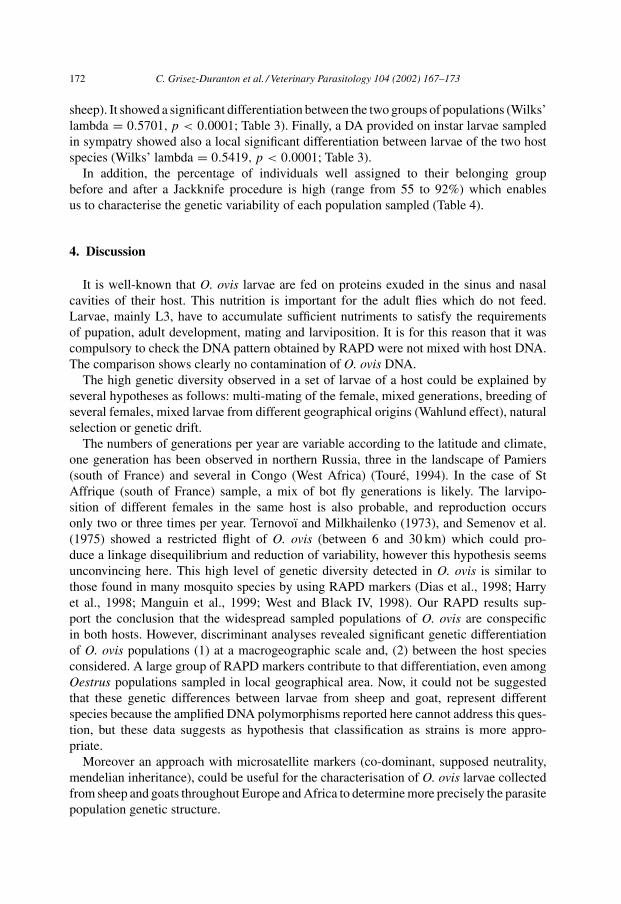
Table 4Percent correct of the predicted classifications of the 12 samples of O. ovis obtained by different discriminantanalyses performed (see Table 1 for abbreviations)
Per locality Percent correct Jackknifed classification percent
77 larvae of SA 82 7720 larvae of ST 85 7029 larvae of SP 59 4813 larvae of GP 92 4637 larvae of SD 62 5114 larvae of GD 71 5711 larvae of SC 55 3617 larvae of SS 76 5920 larvae of GS 60 557 larvae of SF 86 4325 larvae of SN 80 7636 larvae of GN 72 56
Over all samples223 oestrus larvae of sheep 81 7783 oestrus larvae of goats 90 83
Sympatric host samples79 oestrus larvae of sheep 77 7270 oestrus larvae of goats 93 86
172 C. Grisez-Duranton et al. / Veterinary Parasitology 104 (2002) 167–173
sheep). It showed a significant differentiation between the two groups of populations (Wilks’lambda = 0.5701, p < 0.0001; Table 3). Finally, a DA provided on instar larvae sampledin sympatry showed also a local significant differentiation between larvae of the two hostspecies (Wilks’ lambda = 0.5419, p < 0.0001; Table 3).
In addition, the percentage of individuals well assigned to their belonging groupbefore and after a Jackknife procedure is high (range from 55 to 92%) which enablesus to characterise the genetic variability of each population sampled (Table 4).
4. Discussion
It is well-known that O. ovis larvae are fed on proteins exuded in the sinus and nasalcavities of their host. This nutrition is important for the adult flies which do not feed.Larvae, mainly L3, have to accumulate sufficient nutriments to satisfy the requirementsof pupation, adult development, mating and larviposition. It is for this reason that it wascompulsory to check the DNA pattern obtained by RAPD were not mixed with host DNA.The comparison shows clearly no contamination of O. ovis DNA.
The high genetic diversity observed in a set of larvae of a host could be explained byseveral hypotheses as follows: multi-mating of the female, mixed generations, breeding ofseveral females, mixed larvae from different geographical origins (Wahlund effect), naturalselection or genetic drift.
The numbers of generations per year are variable according to the latitude and climate,one generation has been observed in northern Russia, three in the landscape of Pamiers(south of France) and several in Congo (West Africa) (Touré, 1994). In the case of StAffrique (south of France) sample, a mix of bot fly generations is likely. The larvipo-sition of different females in the same host is also probable, and reproduction occursonly two or three times per year. Ternovoı and Milkhailenko (1973), and Semenov et al.(1975) showed a restricted flight of O. ovis (between 6 and 30 km) which could pro-duce a linkage disequilibrium and reduction of variability, however this hypothesis seemsunconvincing here. This high level of genetic diversity detected in O. ovis is similar tothose found in many mosquito species by using RAPD markers (Dias et al., 1998; Harryet al., 1998; Manguin et al., 1999; West and Black IV, 1998). Our RAPD results sup-port the conclusion that the widespread sampled populations of O. ovis are conspecificin both hosts. However, discriminant analyses revealed significant genetic differentiationof O. ovis populations (1) at a macrogeographic scale and, (2) between the host speciesconsidered. A large group of RAPD markers contribute to that differentiation, even amongOestrus populations sampled in local geographical area. Now, it could not be suggestedthat these genetic differences between larvae from sheep and goat, represent differentspecies because the amplified DNA polymorphisms reported here cannot address this ques-tion, but these data suggests as hypothesis that classification as strains is more appro-priate.
Moreover an approach with microsatellite markers (co-dominant, supposed neutrality,mendelian inheritance), could be useful for the characterisation of O. ovis larvae collectedfrom sheep and goats throughout Europe and Africa to determine more precisely the parasitepopulation genetic structure.
C. Grisez-Duranton et al. / Veterinary Parasitology 104 (2002) 167–173 173
Acknowledgements
We wish to thank Phil Agnew and Trayvor Cooke for helpful suggestions and Englishcorrections.
References
Barral, V., This, P., Imbert-Establet, D., Combes, C., Delseny, M., 1993. Genetic variability and evolution ofthe Schistosoma genome analysed by using random amplified polymorphic DNA markers. Mol. Biochem.Parasitol. 59, 211–222.
Cornuet, J.-M., Aulagnier, S., Lek, S., Frank, P., Solignac, M., 1996. Classifying individuals among infra-specifictaxa using microsatellite data and neural networks. C.R. Acad. Sci. Paris Life Sci. 319, 1167–1177.
Dias, E.S., Fortes-Dias, C.L., Stiteler, J.M., Perkins, P.V., Lawyer, P.G., 1998. Random amplified polymorphicDNA (RAPD) analysis of Lutzomyia longipalpis laboratory populations. Rev. Inst. Med. Trop. S. Paulo 40,49–53.
Dorchies, Ph., Bergeaud, J.P., Tabouret, G., Duranton, C., Prevot, F., Jacquiet, Ph., 2000. Prevalence and larvalburden of Oestrus ovis (Linné, 1761) in sheep and goats in northern mediterranean region of France. Vet.Parasitol. 88, 269–273.
D’Souza, P., Jagannath, M.S., Rahman, S.A., 1991. Nasal bot infestation in sheep and goats. Liver. Ad. 16, 6–8.Duranton, C., Dorchies, Ph., 1997. In vitro culture of Oestrus ovis (Linné, 1761) first instar larvae: its application
to antiparasitic drug screening. Int. J. Parasitol. 27, 125–128.Duranton, C., Tabouret, G., Jacquiet, Ph., Bergeaud, J.P., Prévot, F., Dorchies, Ph., 1999. Comparative
susceptibilities of kids and lambs to Oestrus ovis larvae from caprine and ovine origine. Tierarztl. Prax. 27,5–6.
Harry, M., Robin, S., Lachaise, D., 1998. Use of polymorphic genetic markers (RAPDs) in evolutionary andapplied entomology. Ann. Soc. Entomol. Fr. 34, 9–32.
Horak, I.G., Butt, M.J., 1977. Parasites of domestic and wild animals in South Africa. I. Oestrus ovis in sheep.Onderstepoort J. Vet. Res. 44, 55–64.
Jagannath, M.S., Cozab, N., Rahman, S.A., Honnappa, T.G., 1989. Incidence of Oestrus ovis in sheep and goats.Indian J. Anim. Sci. 59, 1216–1219.
Manguin, S., Wilkerson, R.C., Conn, J.E., Rubio-Palis, Y., Danoff-Burg, J.A., Roberts, D.R., 1999. Populationstructure of the primary malaria vector in South America, Anopheles darlingi, using isozyme, random amplifiedpolymorphic DNA, internal transcribed spacer 2, and morphologic markers. Am. J. Trop. Med. Hyg. 60,364–376.
Nguyen, V.K., Jacquiet, Ph., Bergeaud, J.P., Duranton, C., Prévot, F., Dorchies, Ph., 1999. Réactions cellulairesdes muqueuses nasales et sinusales des moutons et des chèvres à l’infection naturelle par Oestrus ovis Linné1767 (Diptera: Oestridés). Parasite 6, 141–149.
Pathak, K.M.L., 1992. Incidence of Oestrus ovis in sheep and goats in Rajasthan state of India. Indian J. Anim.Sci. 62, 50.
Raymond, M., Rousset, F., 1995. Genepop (version 1.2): population genetics software for exact test andecumenicism. J. Heredity 86, 248–249.
Rice, W.R., 1989. Analysing tables of statistical tests. Evolution 43, 223–225.Semenov, P.V., Gomoyunova, N.P., Tarasenko, N.N., 1975. The flight radius of Oestrus ovis. Veterinariya–Moscow
8, 58–59.Ternovoı, V.I., Milkhailenko, V.K., 1973. On the flight range of the sheep nostril fly, Oestrus ovis L. Parasitologiya
7, 123–127.Touré, S.M., 1994. Les myases d’importance économique. Rev. Sci. Tech. Off. Int. Epizooties 13, 1053–1073.West, D.F., Black IV, W.C., 1998. Breeding structure of three snow pool Aedes mosquito species in northern
Colorado. Heredity 81, 371–380.Zumpt, F., 1965. Myiasis in Man and Animals in the Old World. Butterworths, London, 257 pp.