Embed Size (px)
Citation preview
*Corresponding author. Tel.: #33 4 7748 5030; fax: #334 7748 5039; e-mail: [email protected].
Journal of Magnetism and Magnetic Materials 186 (1998) 168—174
Influence of particle size distribution on the initial susceptibilityof magnetic fluids in the Brown relaxation range
B. Payet*, D. Vincent, L. Delaunay, G. NoyelLaboratoire de Recherche sur les Capteurs a% Colloı(des et l+Instrumentation (EA 1873), Universite& Jean Monnet,
23 rue du Docteur Paul Michelon, 42023 Saint-Etienne Cedex 2, France
Received 14 November 1997; received in revised form 5 February 1998
Abstract
We present experimental results on magnetic liquids characterised by a size distribution of particles. The initialcomplex susceptibility has been studied in the Brown relaxation range using a polarimetric method. The position and theshape of the relaxation peak allow to determine apparent values of hydrodynamic mean diameter and its standarddeviation. Theoretical calculations were made from the Debye model including the size distribution of particles and theexperimental study shows its influence and the necessity to take it into account for a better results exploitation. In theseconditions, the Debye model used gives excellent results in accordance with the experimental points. ( 1998 ElsevierScience B.V. All rights reserved.
PACS: 75.50.M; 42.80
Keywords: Magnetic fluids; Particle size distribution; Brown relaxation
1. Introduction
Magnetic fluids are colloidal suspensions offine magnetic particles (mono domain particles3—30 nm) in a carrier liquid. Two relaxationmechanisms can appear when we apply a magneticfield:
f Neel relaxation, due to spins or magnetic mo-ment rotations inside particles;
f Brown relaxation due to the particles rotation inthe carrier liquid.
For Neel relaxation, the relaxation time can beexpressed [1], if p(1, by
qN"q
0e~p, (1)
where p"K»./k¹, K being the effective anis-
otropy constant, ».
the magnetic volume [2] ofparticles and k¹ the thermal energy.
The Brown relaxation time is given by [3]
qB"
3g»k¹
, (2)
0304-8853/98/$19.00 ( 1998 Elsevier Science B.V. All rights reserved.PII: S 0 3 0 4 - 8 8 5 3 ( 9 8 ) 0 0 0 8 2 - 1
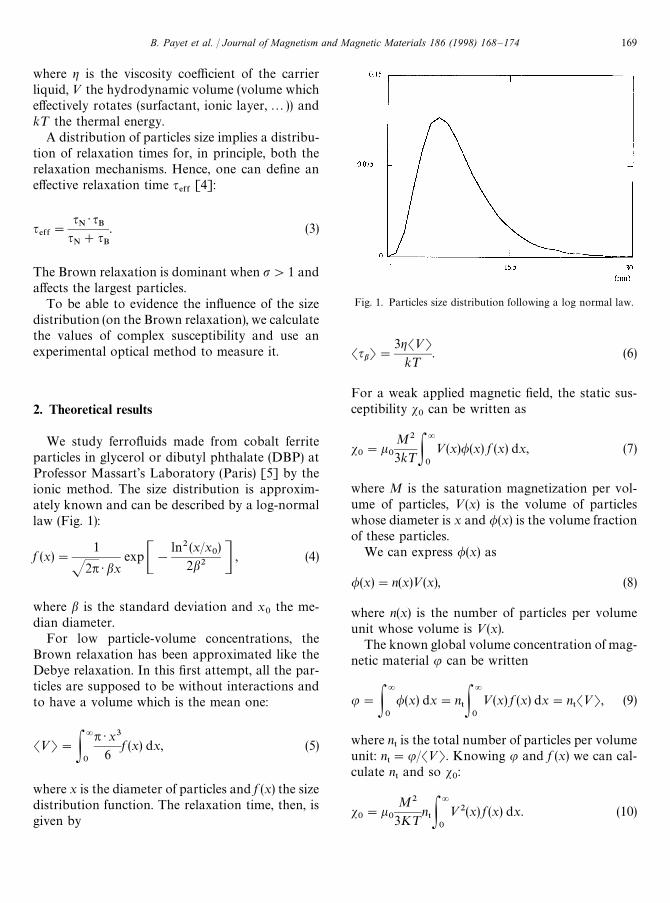
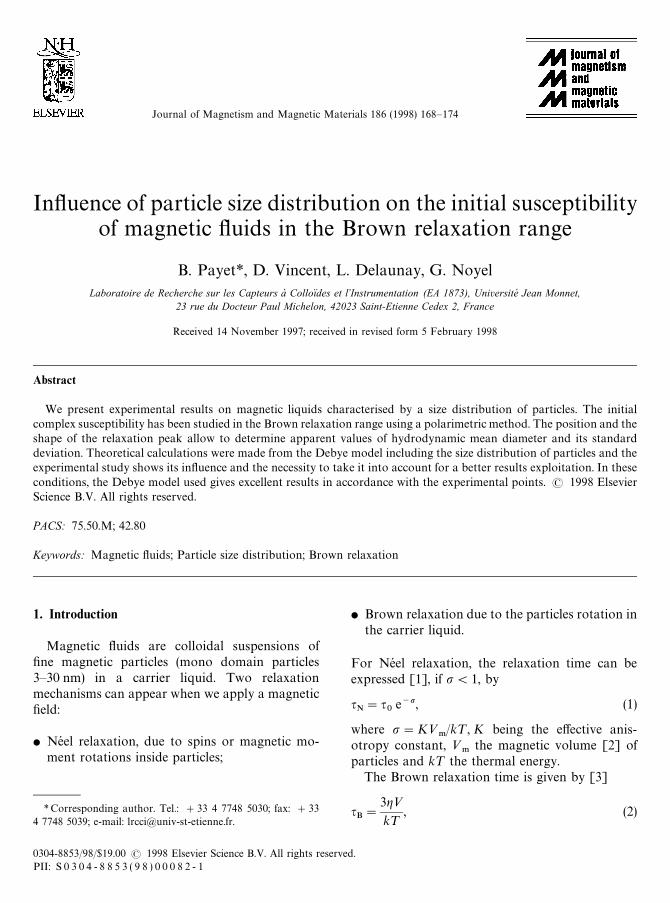
Fig. 1. Particles size distribution following a log normal law.
where g is the viscosity coefficient of the carrierliquid, » the hydrodynamic volume (volume whicheffectively rotates (surfactant, ionic layer,2)) andk¹ the thermal energy.
A distribution of particles size implies a distribu-tion of relaxation times for, in principle, both therelaxation mechanisms. Hence, one can define aneffective relaxation time q
%&&[4]:
q%&&"
qN) q
BqN#q
B
. (3)
The Brown relaxation is dominant when p'1 andaffects the largest particles.
To be able to evidence the influence of the sizedistribution (on the Brown relaxation), we calculatethe values of complex susceptibility and use anexperimental optical method to measure it.
2. Theoretical results
We study ferrofluids made from cobalt ferriteparticles in glycerol or dibutyl phthalate (DBP) atProfessor Massart’s Laboratory (Paris) [5] by theionic method. The size distribution is approxim-ately known and can be described by a log-normallaw (Fig. 1):
f (x)"1
J2p ) bxexpC!
ln2 (x/x0)
2b2 D , (4)
where b is the standard deviation and x0
the me-dian diameter.
For low particle-volume concentrations, theBrown relaxation has been approximated like theDebye relaxation. In this first attempt, all the par-ticles are supposed to be without interactions andto have a volume which is the mean one:
S»T"P=
0
p ) x3
6f (x) dx, (5)
where x is the diameter of particles and f (x) the sizedistribution function. The relaxation time, then, isgiven by
SqbT"3gS»T
k¹. (6)
For a weak applied magnetic field, the static sus-ceptibility s
0can be written as
s0"k
0
M2
3k¹P=
0
»(x)/(x) f (x) dx, (7)
where M is the saturation magnetization per vol-ume of particles, »(x) is the volume of particleswhose diameter is x and /(x) is the volume fractionof these particles.
We can express /(x) as
/(x)"n(x)»(x), (8)
where n(x) is the number of particles per volumeunit whose volume is »(x).
The known global volume concentration of mag-netic material u can be written
u"P=
0
/(x) dx"n5P
=
0
»(x) f (x) dx"n5S»T, (9)
where n5is the total number of particles per volume
unit: n5"u/S»T. Knowing u and f (x) we can cal-
culate n5and so s
0:
s0"k
0
M2
3K¹
n5P
=
0
»2(x) f (x) dx. (10)
B. Payet et al. / Journal of Magnetism and Magnetic Materials 186 (1998) 168—174 169
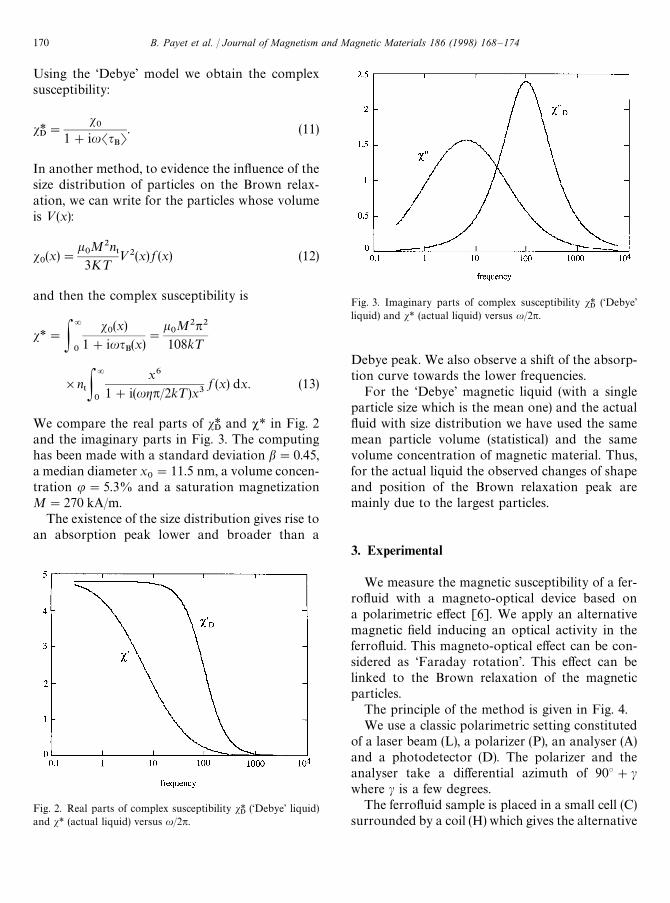
Fig. 2. Real parts of complex susceptibility s*D
(‘Debye’ liquid)and s* (actual liquid) versus u/2p.
Fig. 3. Imaginary parts of complex susceptibility s*D
(‘Debye’liquid) and s* (actual liquid) versus u/2p.
Using the ‘Debye’ model we obtain the complexsusceptibility:
s*D"
s0
1#iuSqBT. (11)
In another method, to evidence the influence of thesize distribution of particles on the Brown relax-ation, we can write for the particles whose volumeis »(x):
s0(x)"
k0M2n
53K¹
»2(x) f (x) (12)
and then the complex susceptibility is
s*"P=
0
s0(x)
1#iuqB(x)
"
k0M2p2
108k¹
]n5P
=
0
x6
1#i(ugp/2k¹)x3f (x) dx. (13)
We compare the real parts of s*D
and v* in Fig. 2and the imaginary parts in Fig. 3. The computinghas been made with a standard deviation b"0.45,a median diameter x
0"11.5 nm, a volume concen-
tration u"5.3% and a saturation magnetizationM"270 kA/m.
The existence of the size distribution gives rise toan absorption peak lower and broader than a
Debye peak. We also observe a shift of the absorp-tion curve towards the lower frequencies.
For the ‘Debye’ magnetic liquid (with a singleparticle size which is the mean one) and the actualfluid with size distribution we have used the samemean particle volume (statistical) and the samevolume concentration of magnetic material. Thus,for the actual liquid the observed changes of shapeand position of the Brown relaxation peak aremainly due to the largest particles.
3. Experimental
We measure the magnetic susceptibility of a fer-rofluid with a magneto-optical device based ona polarimetric effect [6]. We apply an alternativemagnetic field inducing an optical activity in theferrofluid. This magneto-optical effect can be con-sidered as ‘Faraday rotation’. This effect can belinked to the Brown relaxation of the magneticparticles.
The principle of the method is given in Fig. 4.We use a classic polarimetric setting constituted
of a laser beam (L), a polarizer (P), an analyser (A)and a photodetector (D). The polarizer and theanalyser take a differential azimuth of 90°#cwhere c is a few degrees.
The ferrofluid sample is placed in a small cell (C)surrounded by a coil (H) which gives the alternative
170 B. Payet et al. / Journal of Magnetism and Magnetic Materials 186 (1998) 168—174
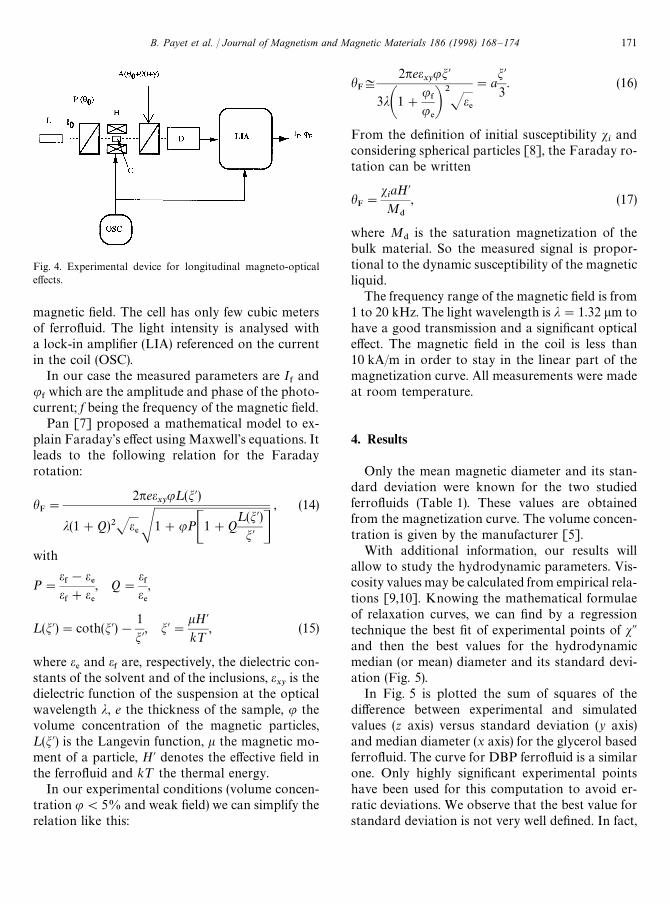
Fig. 4. Experimental device for longitudinal magneto-opticaleffects.
magnetic field. The cell has only few cubic metersof ferrofluid. The light intensity is analysed witha lock-in amplifier (LIA) referenced on the currentin the coil (OSC).
In our case the measured parameters are I&and
u&which are the amplitude and phase of the photo-
current; f being the frequency of the magnetic field.Pan [7] proposed a mathematical model to ex-
plain Faraday’s effect using Maxwell’s equations. Itleads to the following relation for the Faradayrotation:
hF"
2peexy
u¸(m@)
j(1#Q)2Je%S1#uPC1#Q
¸(m@)m@ D
, (14)
with
P"
e&!e
%e&#e
%
, Q"
e&
e%
,
¸(m@)"coth(m@)!1
m@, m@"
kH@k¹
, (15)
where e%and e
&are, respectively, the dielectric con-
stants of the solvent and of the inclusions, exy
is thedielectric function of the suspension at the opticalwavelength j, e the thickness of the sample, u thevolume concentration of the magnetic particles,¸(m@) is the Langevin function, k the magnetic mo-ment of a particle, H@ denotes the effective field inthe ferrofluid and k¹ the thermal energy.
In our experimental conditions (volume concen-tration u(5% and weak field) we can simplify therelation like this:
hF+
2peexy
um@
3jA1#u
&u%B
2Je
%
"am@3. (16)
From the definition of initial susceptibility siand
considering spherical particles [8], the Faraday ro-tation can be written
hF"
siaH@M
$
, (17)
where M$
is the saturation magnetization of thebulk material. So the measured signal is propor-tional to the dynamic susceptibility of the magneticliquid.
The frequency range of the magnetic field is from1 to 20 kHz. The light wavelength is j"1.32 lm tohave a good transmission and a significant opticaleffect. The magnetic field in the coil is less than10 kA/m in order to stay in the linear part of themagnetization curve. All measurements were madeat room temperature.
4. Results
Only the mean magnetic diameter and its stan-dard deviation were known for the two studiedferrofluids (Table 1). These values are obtainedfrom the magnetization curve. The volume concen-tration is given by the manufacturer [5].
With additional information, our results willallow to study the hydrodynamic parameters. Vis-cosity values may be calculated from empirical rela-tions [9,10]. Knowing the mathematical formulaeof relaxation curves, we can find by a regressiontechnique the best fit of experimental points of sAand then the best values for the hydrodynamicmedian (or mean) diameter and its standard devi-ation (Fig. 5).
In Fig. 5 is plotted the sum of squares of thedifference between experimental and simulatedvalues (z axis) versus standard deviation (y axis)and median diameter (x axis) for the glycerol basedferrofluid. The curve for DBP ferrofluid is a similarone. Only highly significant experimental pointshave been used for this computation to avoid er-ratic deviations. We observe that the best value forstandard deviation is not very well defined. In fact,
B. Payet et al. / Journal of Magnetism and Magnetic Materials 186 (1998) 168—174 171
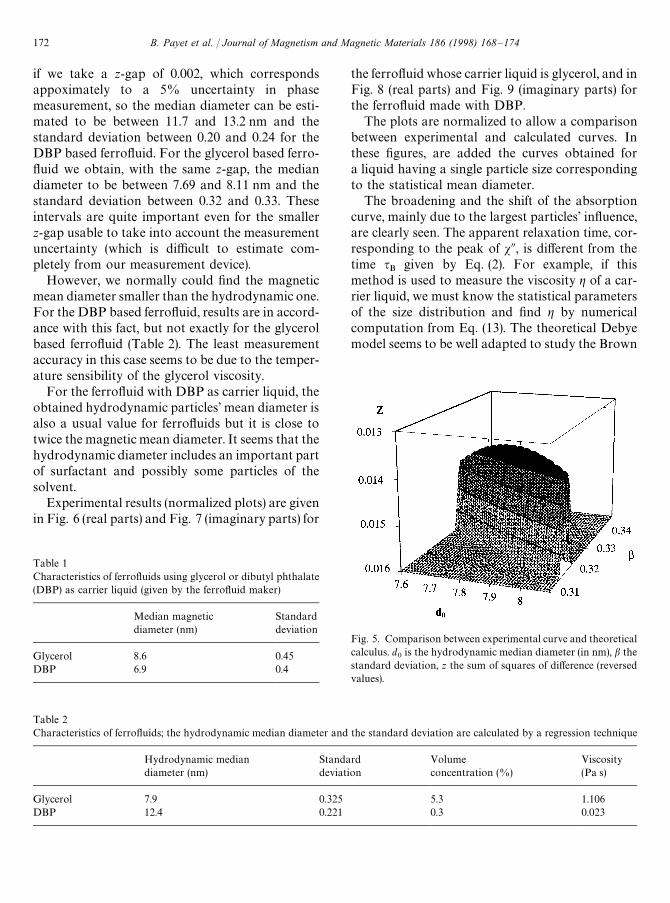
Table 2Characteristics of ferrofluids; the hydrodynamic median diameter and the standard deviation are calculated by a regression technique
Hydrodynamic mediandiameter (nm)
Standarddeviation
Volumeconcentration (%)
Viscosity(Pa s)
Glycerol 7.9 0.325 5.3 1.106DBP 12.4 0.221 0.3 0.023
Table 1Characteristics of ferrofluids using glycerol or dibutyl phthalate(DBP) as carrier liquid (given by the ferrofluid maker)
Median magneticdiameter (nm)
Standarddeviation
Glycerol 8.6 0.45DBP 6.9 0.4
Fig. 5. Comparison between experimental curve and theoreticalcalculus. d
0is the hydrodynamic median diameter (in nm), b the
standard deviation, z the sum of squares of difference (reversedvalues).
if we take a z-gap of 0.002, which correspondsappoximately to a 5% uncertainty in phasemeasurement, so the median diameter can be esti-mated to be between 11.7 and 13.2 nm and thestandard deviation between 0.20 and 0.24 for theDBP based ferrofluid. For the glycerol based ferro-fluid we obtain, with the same z-gap, the mediandiameter to be between 7.69 and 8.11 nm and thestandard deviation between 0.32 and 0.33. Theseintervals are quite important even for the smallerz-gap usable to take into account the measurementuncertainty (which is difficult to estimate com-pletely from our measurement device).
However, we normally could find the magneticmean diameter smaller than the hydrodynamic one.For the DBP based ferrofluid, results are in accord-ance with this fact, but not exactly for the glycerolbased ferrofluid (Table 2). The least measurementaccuracy in this case seems to be due to the temper-ature sensibility of the glycerol viscosity.
For the ferrofluid with DBP as carrier liquid, theobtained hydrodynamic particles’ mean diameter isalso a usual value for ferrofluids but it is close totwice the magnetic mean diameter. It seems that thehydrodynamic diameter includes an important partof surfactant and possibly some particles of thesolvent.
Experimental results (normalized plots) are givenin Fig. 6 (real parts) and Fig. 7 (imaginary parts) for
the ferrofluid whose carrier liquid is glycerol, and inFig. 8 (real parts) and Fig. 9 (imaginary parts) forthe ferrofluid made with DBP.
The plots are normalized to allow a comparisonbetween experimental and calculated curves. Inthese figures, are added the curves obtained fora liquid having a single particle size correspondingto the statistical mean diameter.
The broadening and the shift of the absorptioncurve, mainly due to the largest particles’ influence,are clearly seen. The apparent relaxation time, cor-responding to the peak of sA, is different from thetime q
Bgiven by Eq. (2). For example, if this
method is used to measure the viscosity g of a car-rier liquid, we must know the statistical parametersof the size distribution and find g by numericalcomputation from Eq. (13). The theoretical Debyemodel seems to be well adapted to study the Brown
172 B. Payet et al. / Journal of Magnetism and Magnetic Materials 186 (1998) 168—174
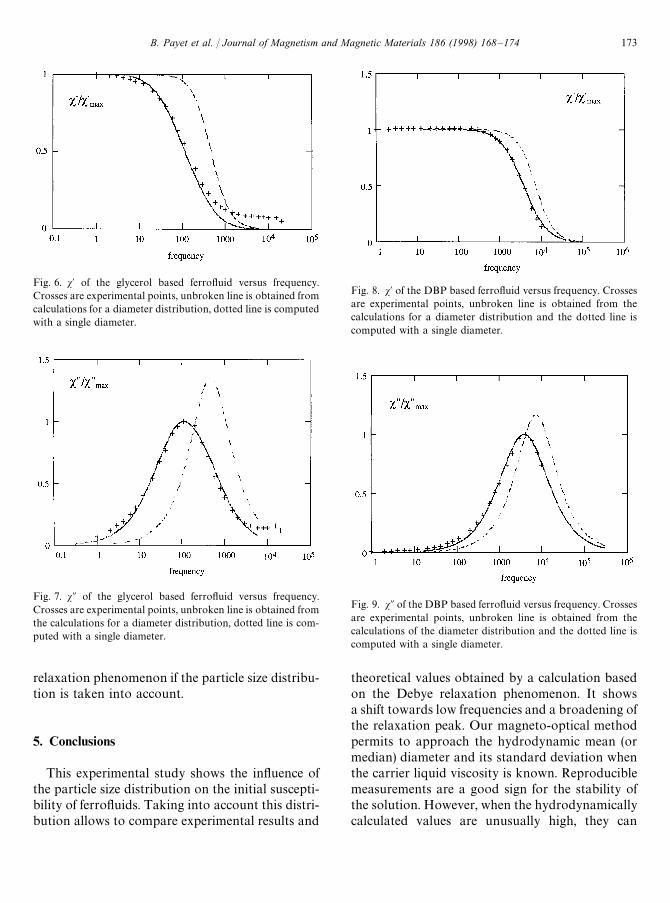
Fig. 6. s@ of the glycerol based ferrofluid versus frequency.Crosses are experimental points, unbroken line is obtained fromcalculations for a diameter distribution, dotted line is computedwith a single diameter.
Fig. 7. sA of the glycerol based ferrofluid versus frequency.Crosses are experimental points, unbroken line is obtained fromthe calculations for a diameter distribution, dotted line is com-puted with a single diameter.
Fig. 8. s@ of the DBP based ferrofluid versus frequency. Crossesare experimental points, unbroken line is obtained from thecalculations for a diameter distribution and the dotted line iscomputed with a single diameter.
Fig. 9. sA of the DBP based ferrofluid versus frequency. Crossesare experimental points, unbroken line is obtained from thecalculations of the diameter distribution and the dotted line iscomputed with a single diameter.
relaxation phenomenon if the particle size distribu-tion is taken into account.
5. Conclusions
This experimental study shows the influence ofthe particle size distribution on the initial suscepti-bility of ferrofluids. Taking into account this distri-bution allows to compare experimental results and
theoretical values obtained by a calculation basedon the Debye relaxation phenomenon. It showsa shift towards low frequencies and a broadening ofthe relaxation peak. Our magneto-optical methodpermits to approach the hydrodynamic mean (ormedian) diameter and its standard deviation whenthe carrier liquid viscosity is known. Reproduciblemeasurements are a good sign for the stability ofthe solution. However, when the hydrodynamicallycalculated values are unusually high, they can
B. Payet et al. / Journal of Magnetism and Magnetic Materials 186 (1998) 168—174 173
denote the presence of aggregates which are toosmall to cause a scattering of light.
On the other hand, if we have the knowledge ofthe hydrodynamic statistical parameters for a givenmagnetic liquid, we can obtain an estimation of theactual carrier liquid viscosity (at low volume con-centration) only by taking into account this particlesize distribution.
Lastly, this study is able to explain the observeddeviation in magnetic susceptibility between ex-perimental results and values calculated from thetheoretical Debye model.
Acknowledgements
We wish to acknowledge the ‘Region Rhone-Alpes’ for a thesis studentship (B.P.).
References
[1] W.F. Brown, Phys. Rev. 130 (5) (1963) 1677.[2] Y.L. Raikher, M.I. Shliomis, Adv. Chem. Phys. 87 (1994)
595.[3] M.A. Martsenyuk, Yu. Raikher. M.I. Shliomis, Sov. Phys.
JEPT 38 (2) (1974).[4] P.C. Fannin, S.W. Charles, J. Phys. D 22 (1989) 187.[5] R. Massart, IEEE Trans. Magn. 17 (1981) 1247.[6] L. Delaunay, S. Neveu, G. Noyel, J. Monin, J. Magn.
Magn. Mater. 149 (1995) L239.[7] Y.T. Pan, C.W. Du, X.D. Liu, Z.G. Li, R. Birngruber, J.
Appl. Phys. 73 (10) (1993) 6139.[8] B. Payet, A. Siblini, M.F. Blanc-Mignon, G. Noyel, IEEE
Trans. Magn., submitted.[9] G. Noyel, These d’etat, Universite Saint-Etience, 1987.
[10] J. Dufour, These d’etat, Universite Claude-Bernard LyonI, 1996.
174 B. Payet et al. / Journal of Magnetism and Magnetic Materials 186 (1998) 168—174


![Differential susceptibility to insecticides by ... · Differential susceptibility to insecticides by Leptinotarsa decemlineata [Coleoptera: Chrysomelîdae] populations from western](https://img.pdfslide.fr/doc/110x75/5f2b0df3d23fa0242b352a1a/differential-susceptibility-to-insecticides-by-differential-susceptibility-to.jpg)