Embed Size (px)
Citation preview
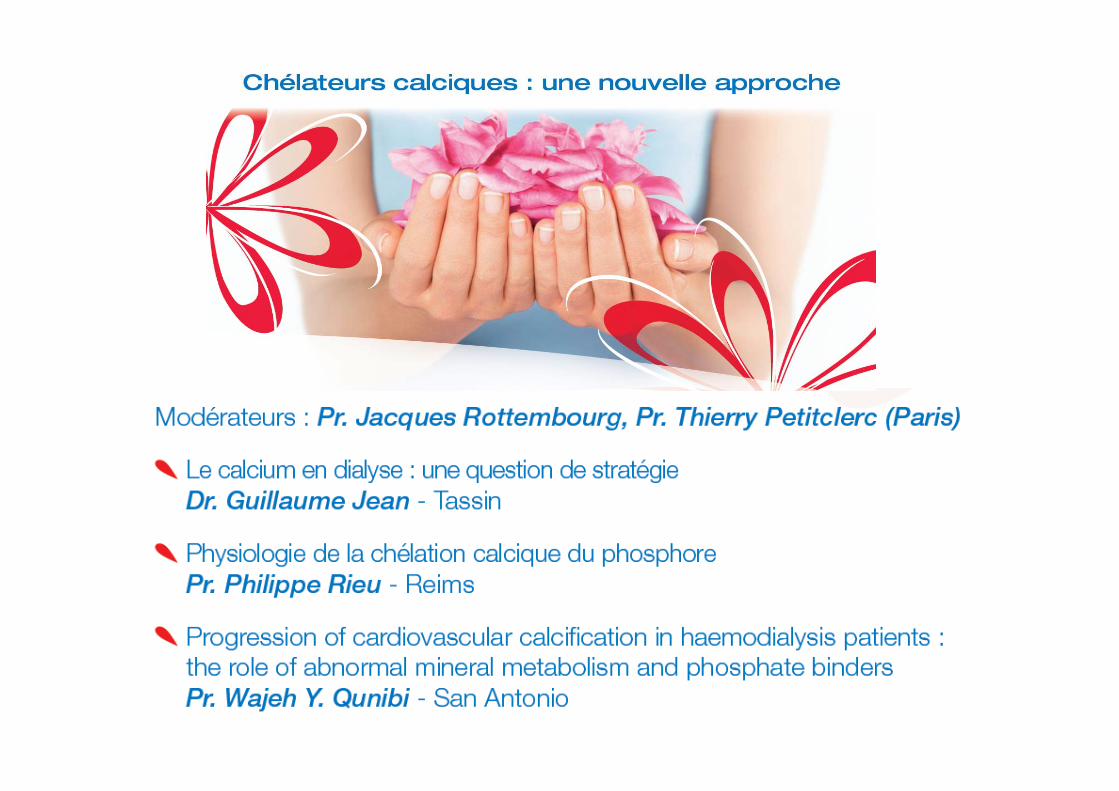
Le calcium et le dialysLe calcium et le dialyséé: une : une question de stratquestion de stratéégiegie……
Guillaume JEANCentre de Rein Artificiel de TassinSymposium Fresenius Medical CareSéminaire d’Uro-Néphrologie de la PitiéParis 21 Janvier 2009
…… et det d’’expexpéérience.rience.
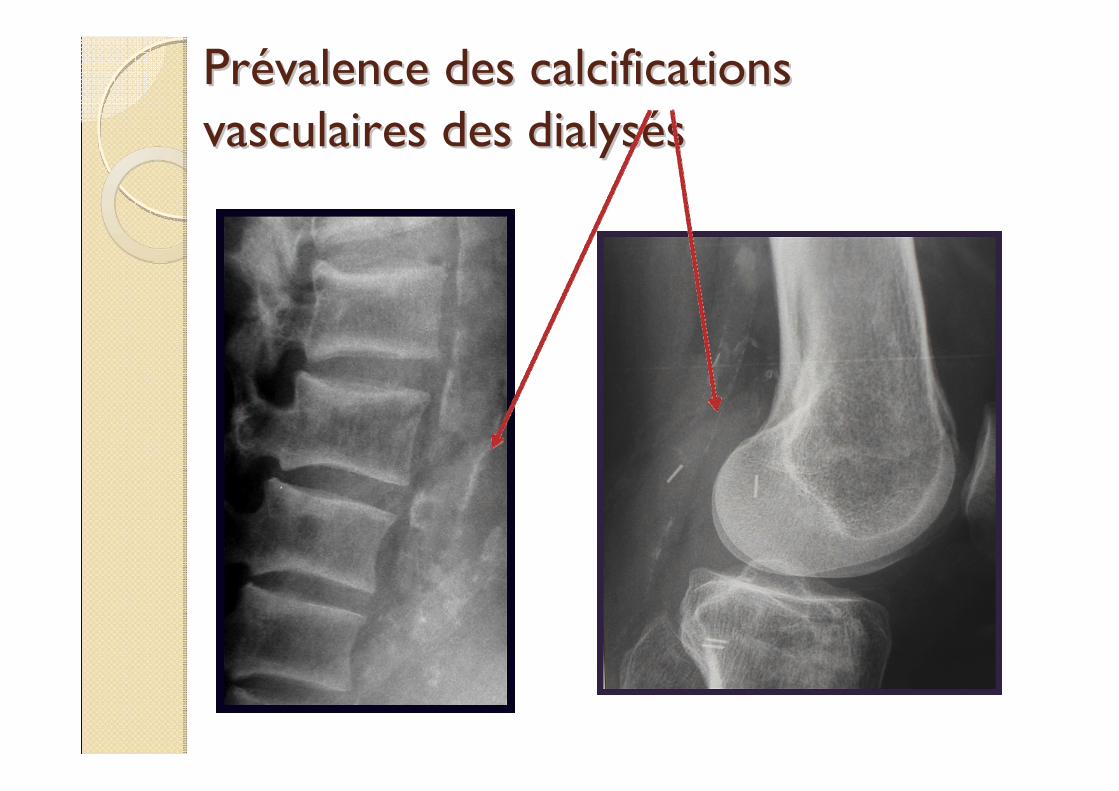
PrPréévalence des calcifications valence des calcifications vasculaires des dialysvasculaires des dialysééss
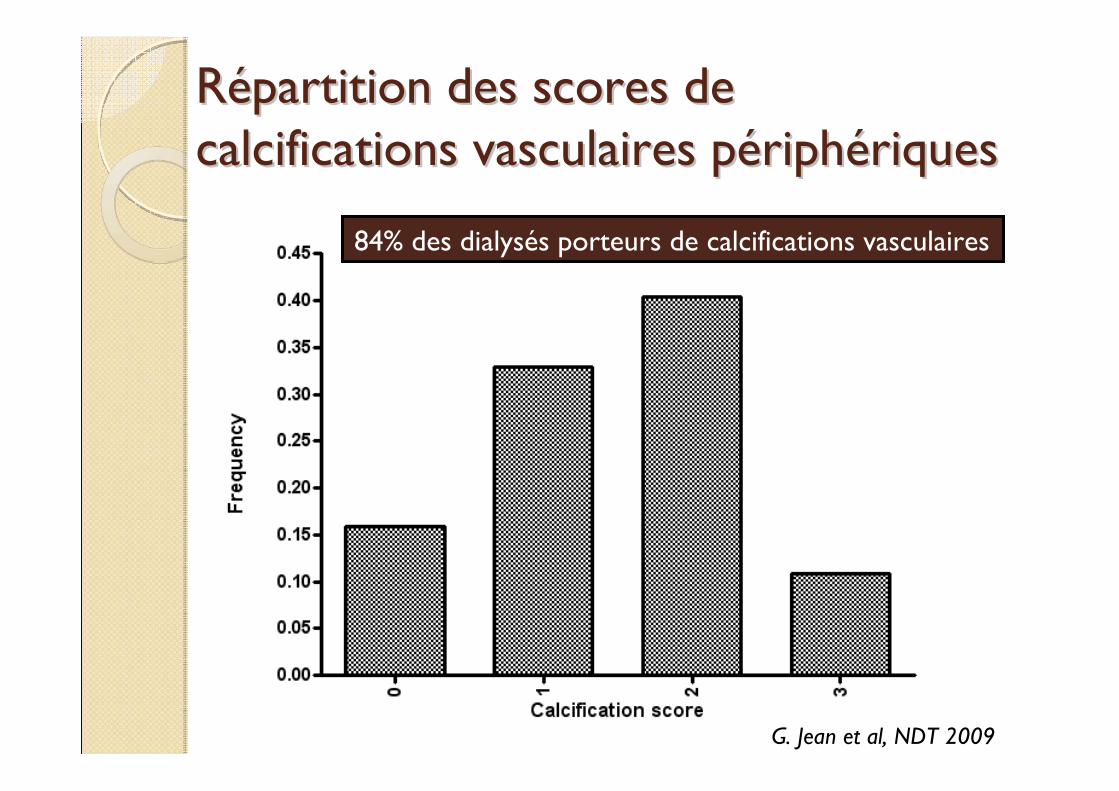
RRéépartition des scores de partition des scores de calcifications vasculaires pcalcifications vasculaires péériphriphéériquesriques
G. Jean et al, NDT 2009
84% des dialysés porteurs de calcifications vasculaires
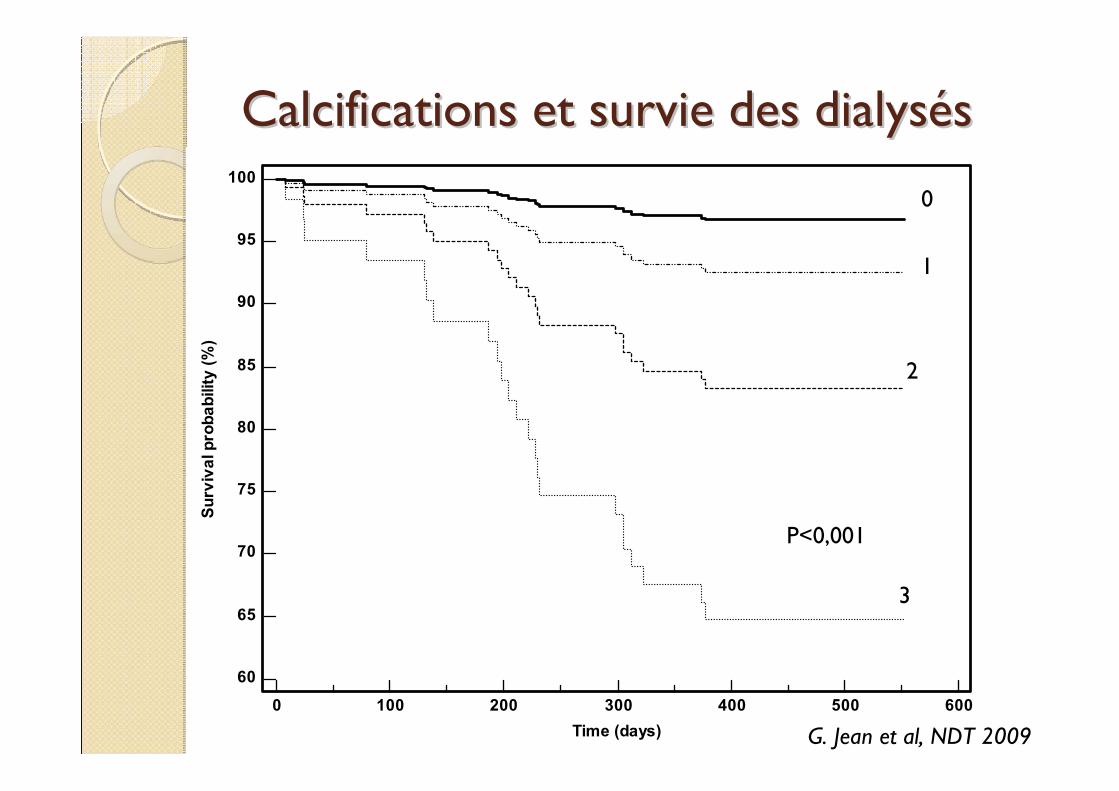
Calcifications et survie des dialysCalcifications et survie des dialysééss
0 100 200 300 400 500 600
100
95
90
85
80
75
70
65
60
Time (days)
Surv
ival
pro
babi
lity
(%)
G. Jean et al, NDT 2009
0
1
2
3
P<0,001
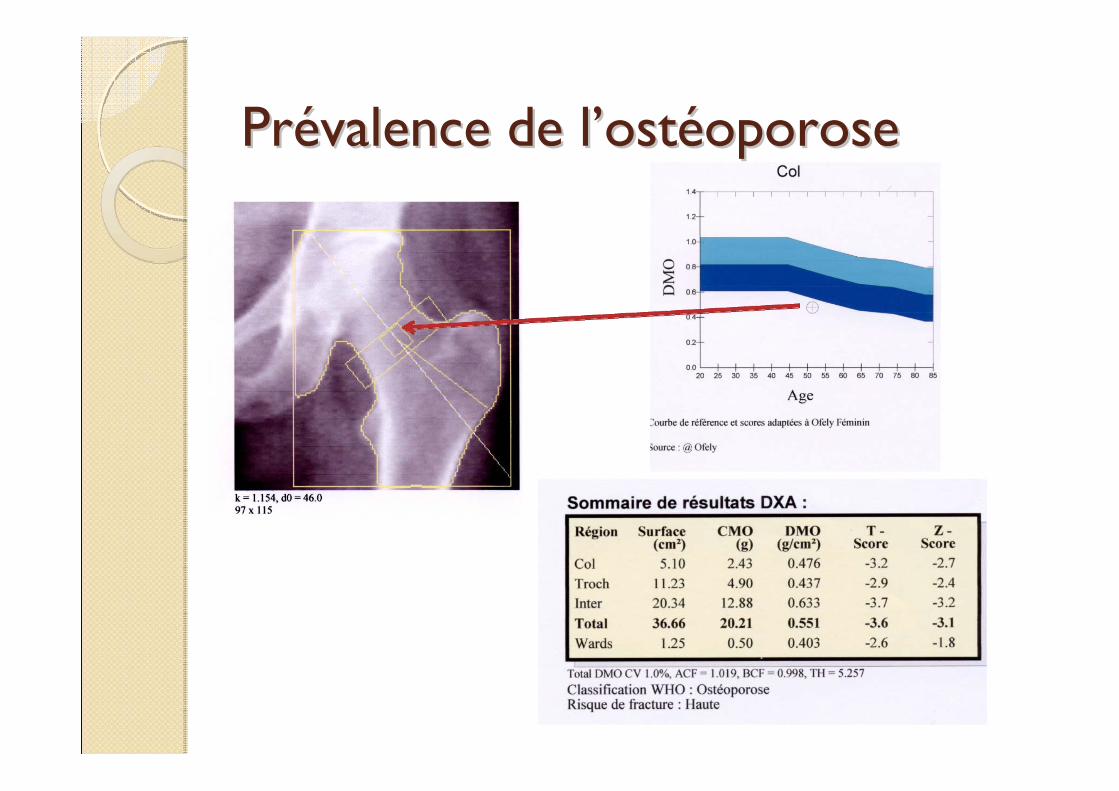
PrPréévalence de lvalence de l’’ostostééoporoseoporose
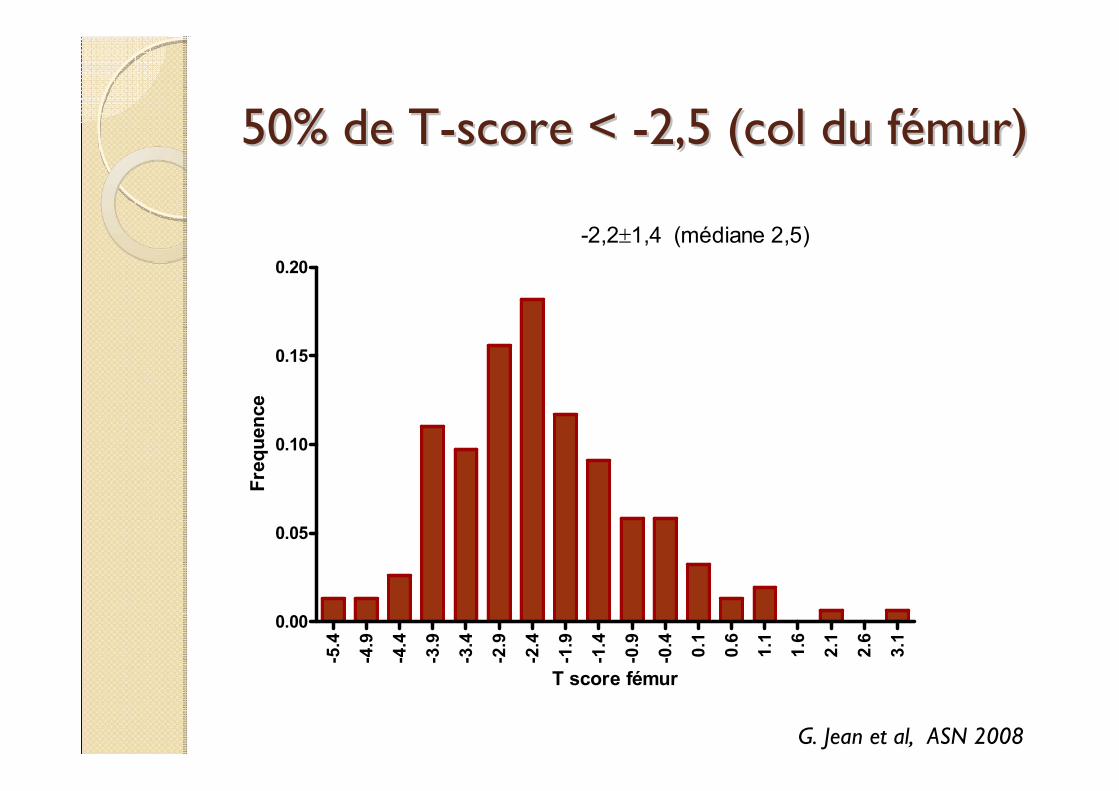
50% de T50% de T--score < score < --2,5 (col du f2,5 (col du féémur)mur)
-5.4
-4.9
-4.4
-3.9
-3.4
-2.9
-2.4
-1.9
-1.4
-0.9
-0.4 0.1
0.6
1.1
1.6
2.1
2.6
3.1
0.00
0.05
0.10
0.15
0.20
-2,2±1,4 (médiane 2,5)
T score fémur
Freq
uenc
e
G. Jean et al, ASN 2008
poignet Zfemur T
0 20 40 60 80 100
100
80
60
40
20
0
100-Specificity
Sens
itivi
ty
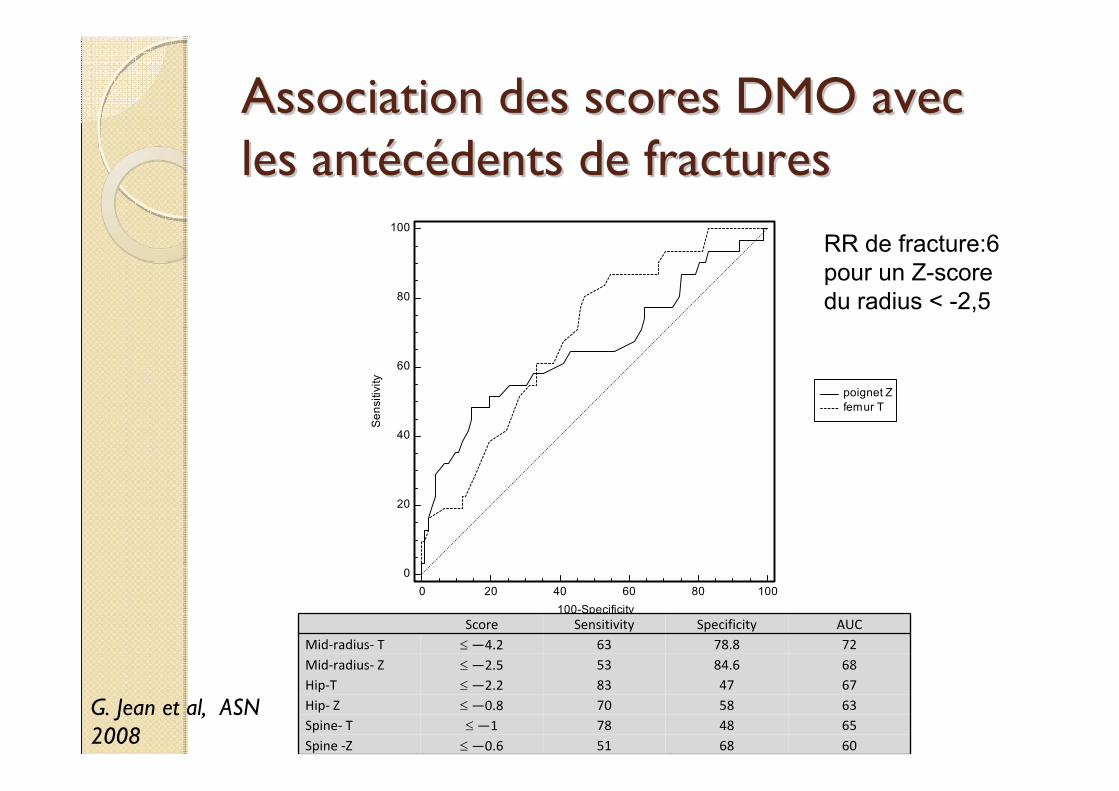
Association des scores DMO avec Association des scores DMO avec les antles antééccéédents de fracturesdents de fractures
Score Sensitivity Specificity AUCMid‐radius‐ T ≤—4.2 63 78.8 72Mid‐radius‐ Z ≤—2.5 53 84.6 68Hip‐T ≤—2.2 83 47 67Hip‐ Z ≤—0.8 70 58 63Spine‐ T ≤—1 78 48 65Spine ‐Z ≤—0.6 51 68 60
G. Jean et al, ASN 2008
RR de fracture:6 pour un Z-score du radius < -2,5
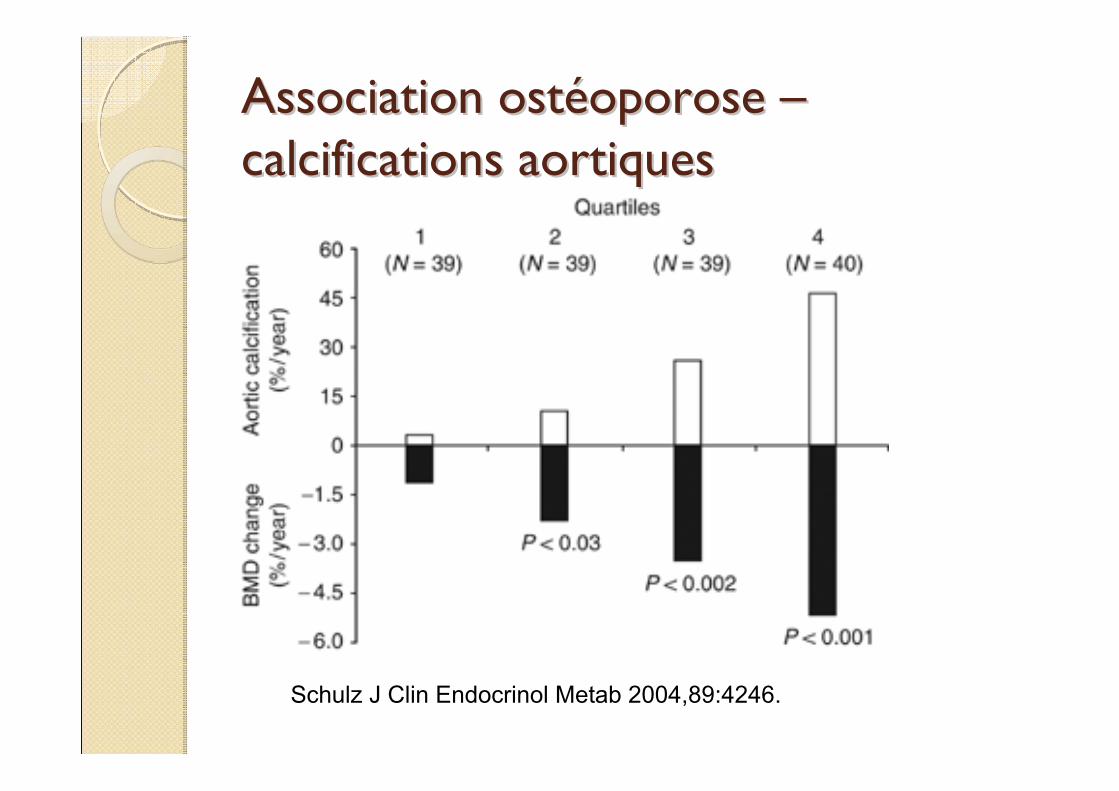
Association ostAssociation ostééoporose oporose ––calcifications aortiquescalcifications aortiques
Schulz J Clin Endocrinol Metab 2004,89:4246.
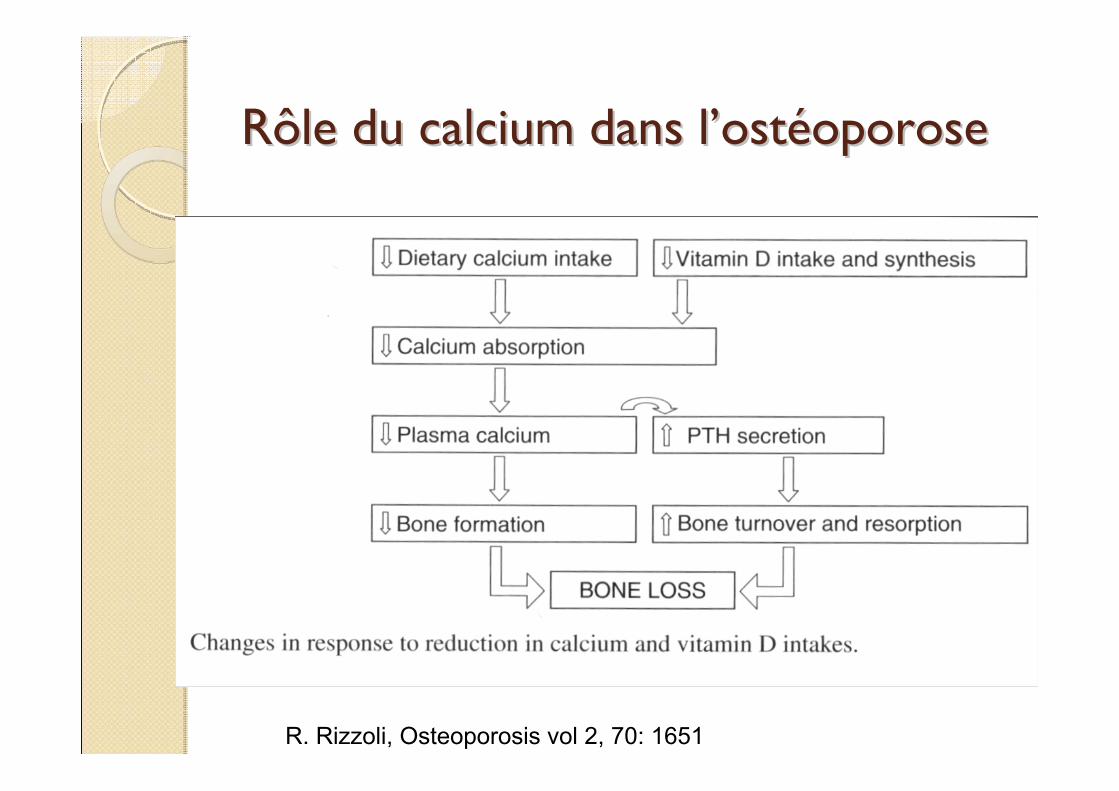
Rôle du calcium dans lRôle du calcium dans l’’ostostééoporoseoporose
R. Rizzoli, Osteoporosis vol 2, 70: 1651
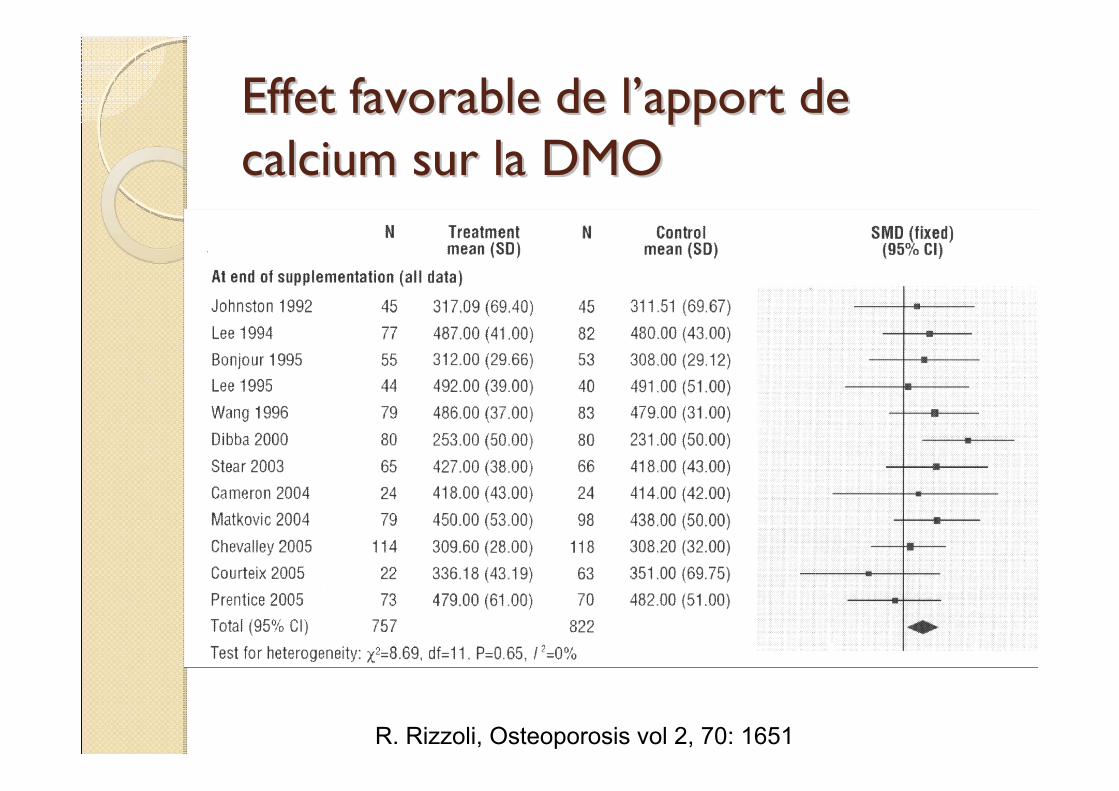
Effet favorable de lEffet favorable de l’’apport de apport de calcium sur la DMOcalcium sur la DMO
R. Rizzoli, Osteoporosis vol 2, 70: 1651
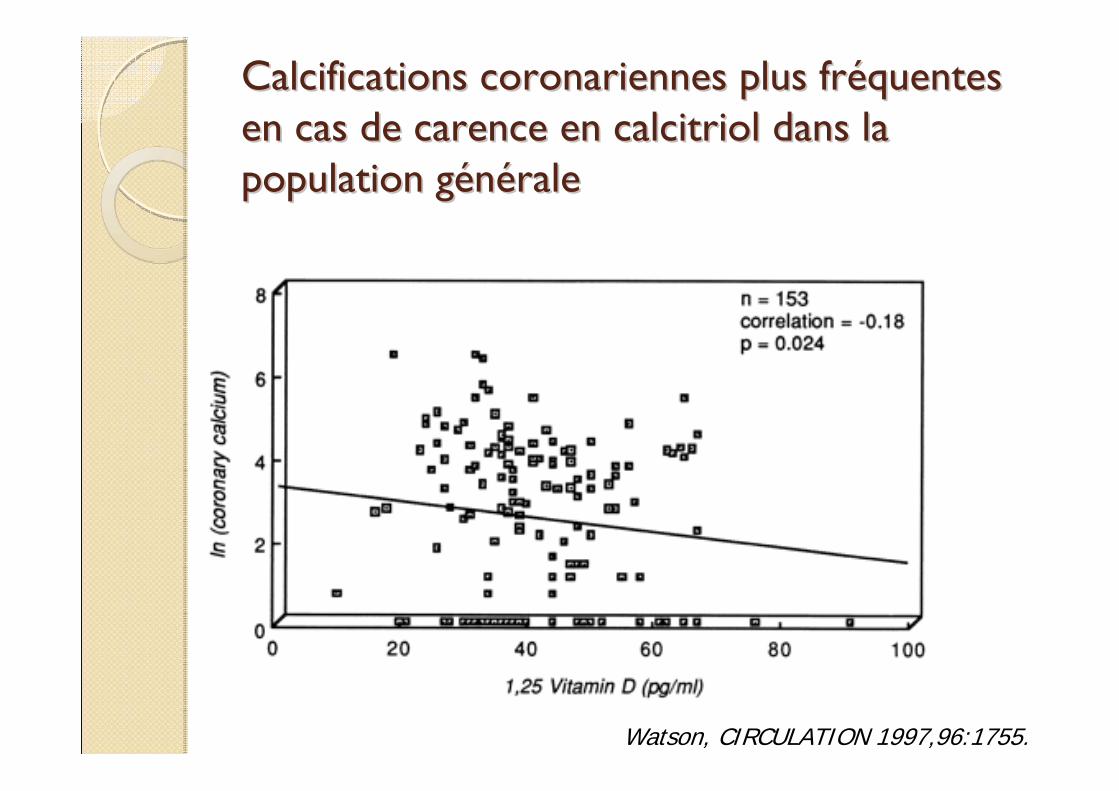
Calcifications coronariennes plus frCalcifications coronariennes plus frééquentes quentes en cas de carence en calcitriol dans la en cas de carence en calcitriol dans la population gpopulation géénnééralerale
Watson, CIRCULATION 1997,96:1755.
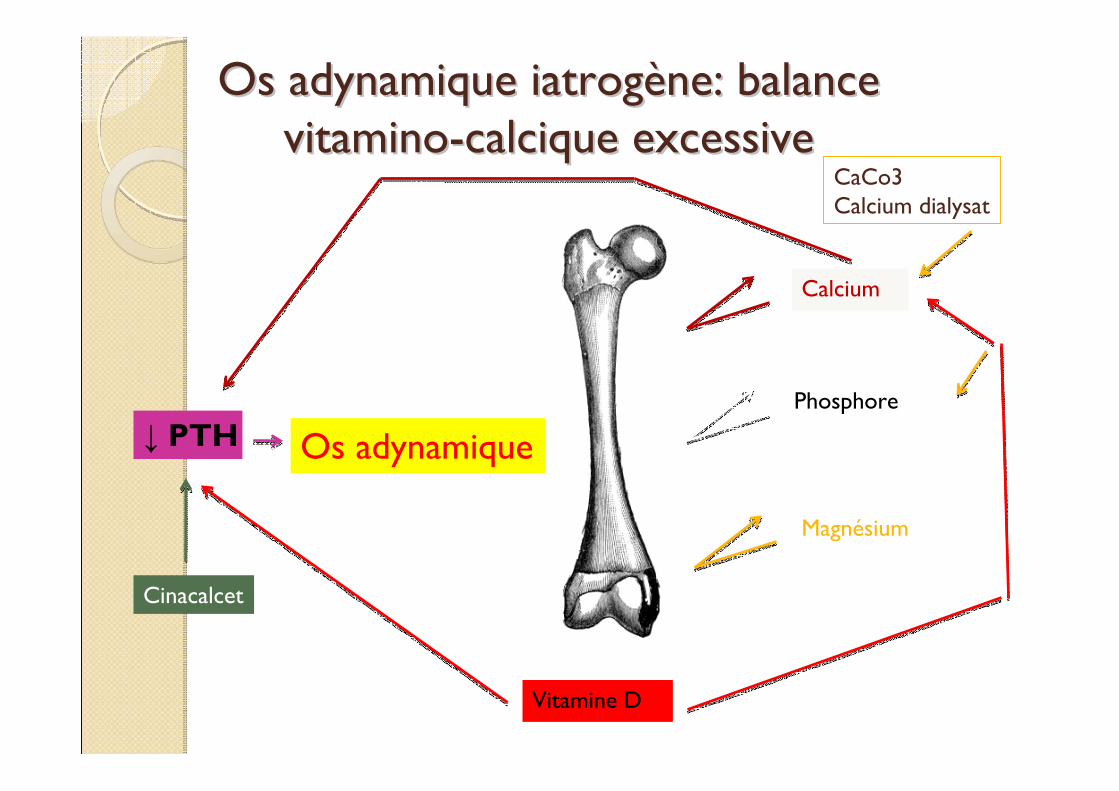
Os adynamique iatrogOs adynamique iatrogèène: balance ne: balance vitaminovitamino--calcique excessivecalcique excessive
Calcium
Phosphore
Magnésium
Os adynamique↓ PTH
Vitamine D
CaCo3Calcium dialysat
Cinacalcet
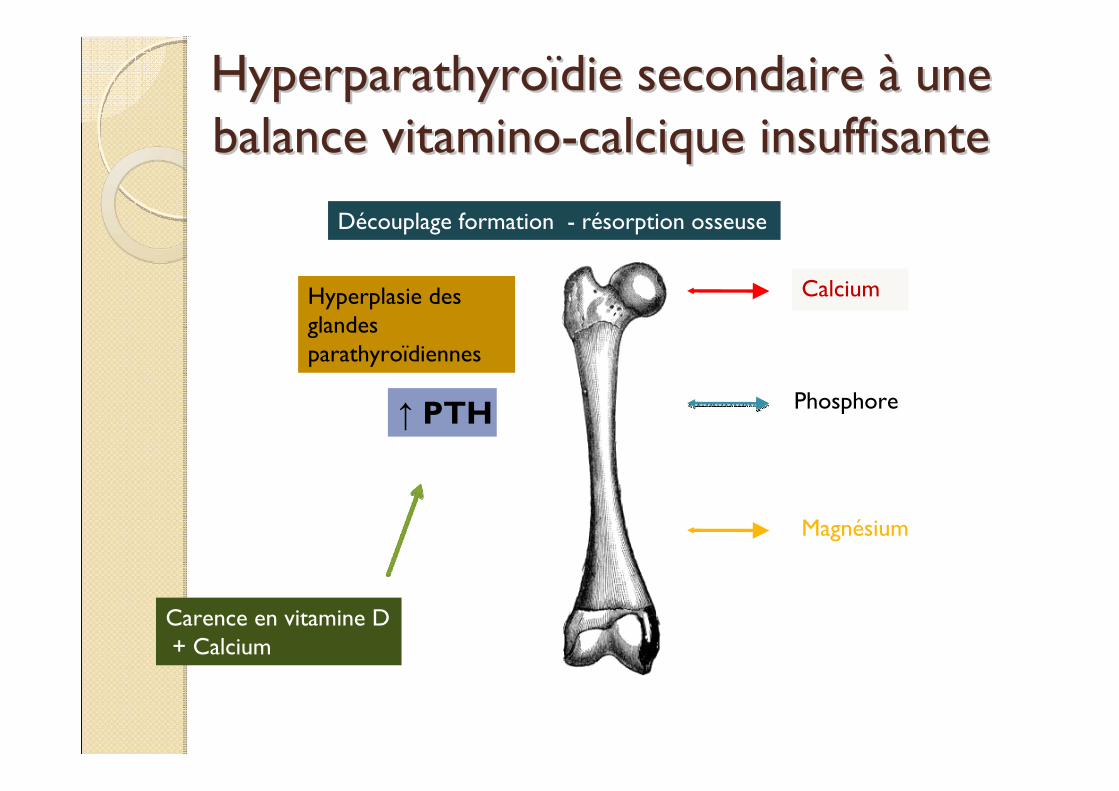
HyperparathyroHyperparathyroïïdie secondaire die secondaire àà une une balance vitaminobalance vitamino--calcique insuffisantecalcique insuffisante
Hyperplasie des glandes parathyroïdiennes
↑ PTH
Découplage formation - résorption osseuse
Calcium
Phosphore
Magnésium
Carence en vitamine D+ Calcium
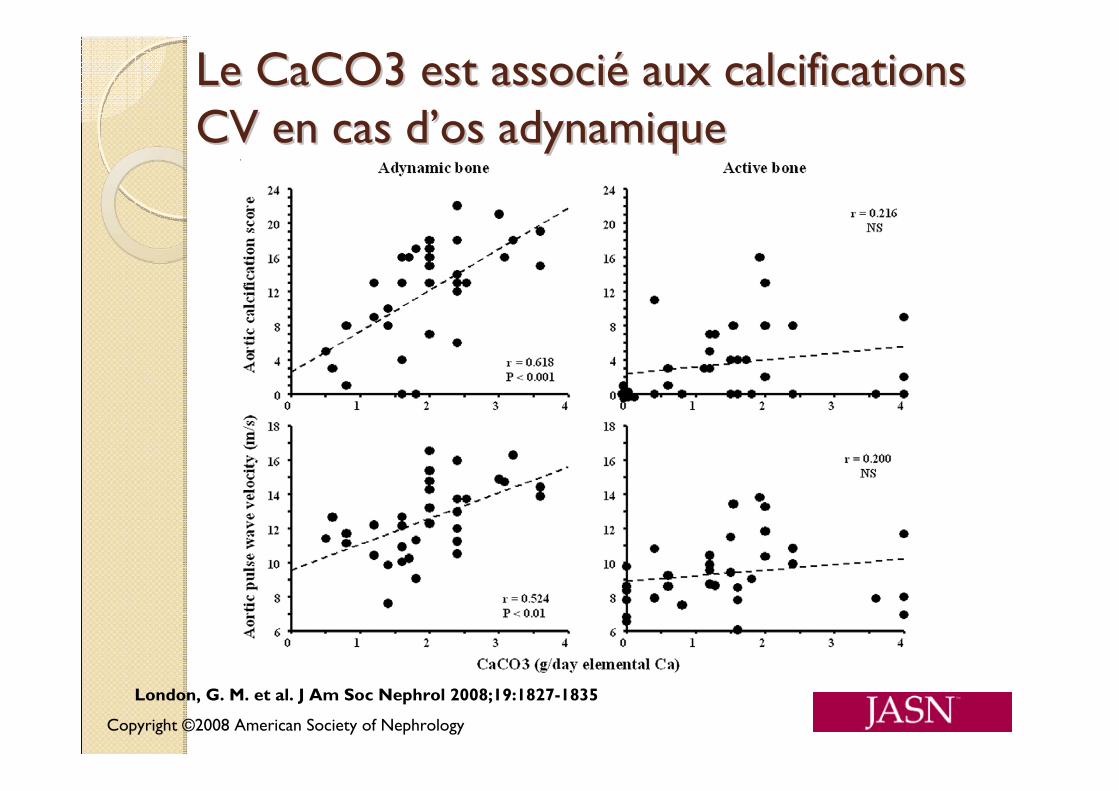
Copyright ©2008 American Society of Nephrology
London, G. M. et al. J Am Soc Nephrol 2008;19:1827-1835
Le CaCO3 est associLe CaCO3 est associéé aux calcifications aux calcifications CV en cas dCV en cas d’’os adynamiqueos adynamique
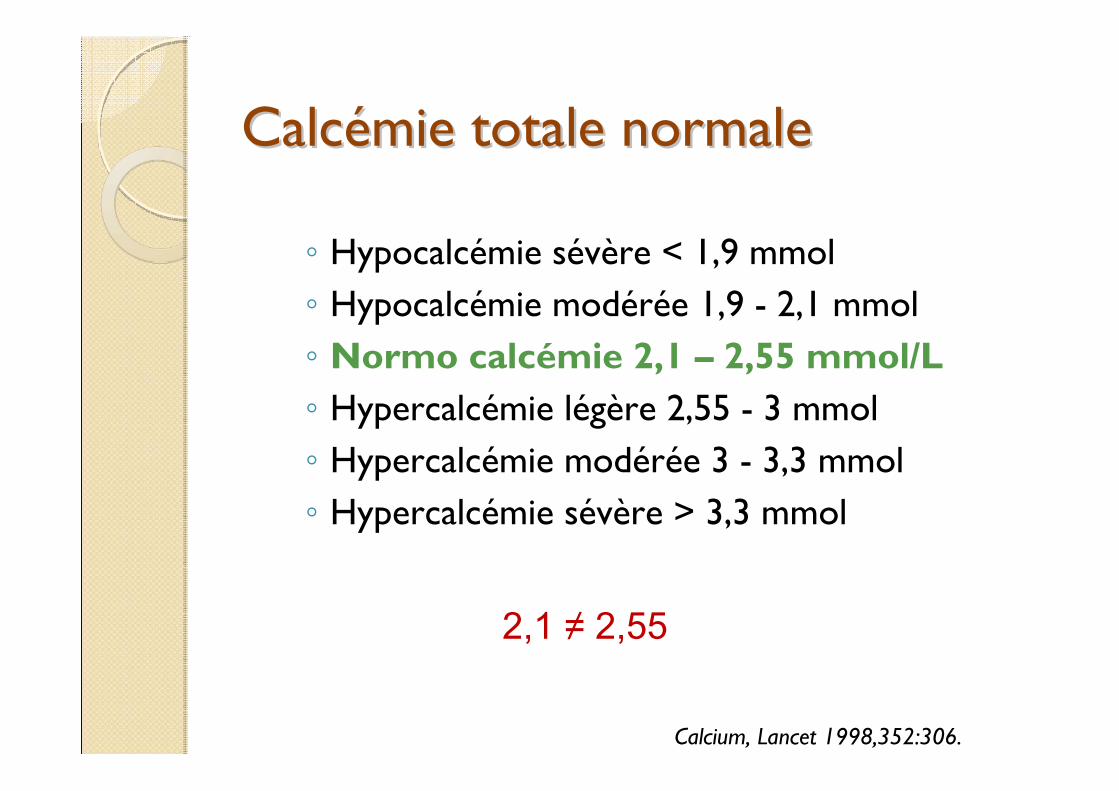
CalcCalcéémie totale normale mie totale normale
◦ Hypocalcémie sévère < 1,9 mmol◦ Hypocalcémie modérée 1,9 - 2,1 mmol◦ Normo calcémie 2,1 – 2,55 mmol/L◦ Hypercalcémie légère 2,55 - 3 mmol◦ Hypercalcémie modérée 3 - 3,3 mmol◦ Hypercalcémie sévère > 3,3 mmol
Calcium, Lancet 1998,352:306.
2,1 ≠ 2,55
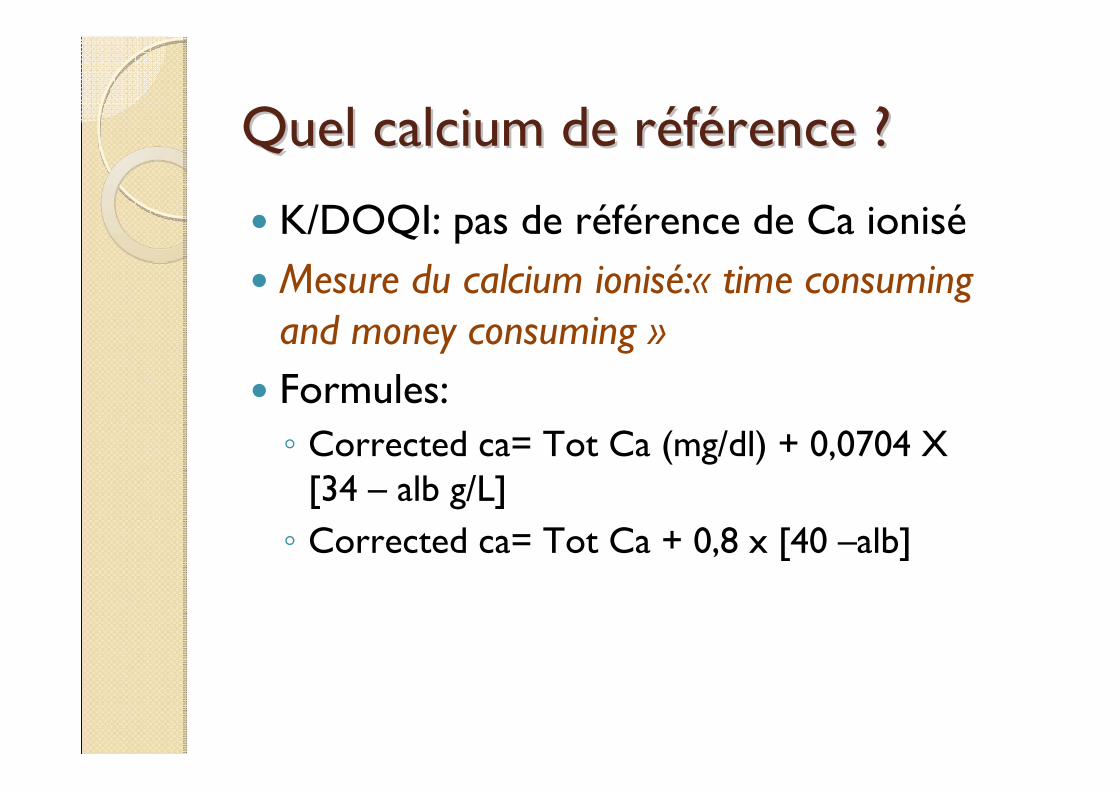
Quel calcium de rQuel calcium de rééfféérence ?rence ?
K/DOQI: pas de référence de Ca ioniséMesure du calcium ionisé:« time consuming and money consuming »Formules: ◦ Corrected ca= Tot Ca (mg/dl) + 0,0704 X
[34 – alb g/L]◦ Corrected ca= Tot Ca + 0,8 x [40 –alb]
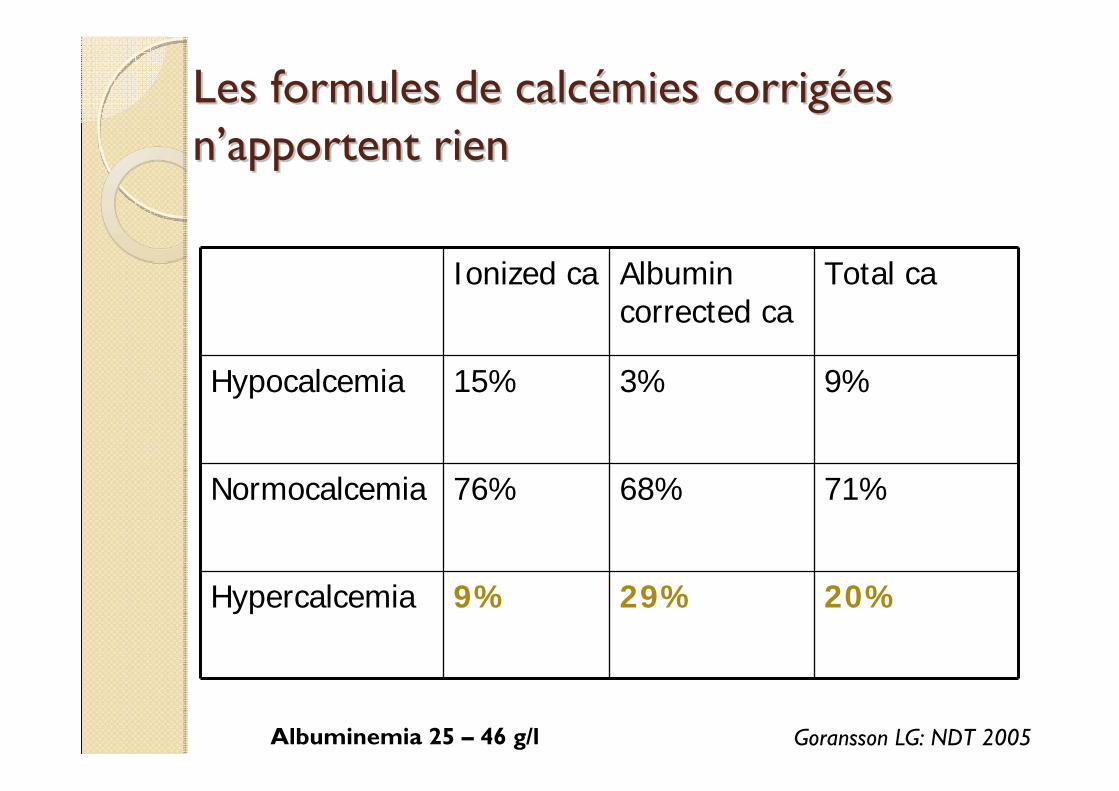
Les formules de calcLes formules de calcéémies corrigmies corrigéées es nn’’apportent rienapportent rien
Ionized ca Albumin corrected ca
Total ca
Hypocalcemia 15% 3% 9%
Normocalcemia 76% 68% 71%
Hypercalcemia 9% 29% 20%
Albuminemia 25 – 46 g/l Goransson LG: NDT 2005
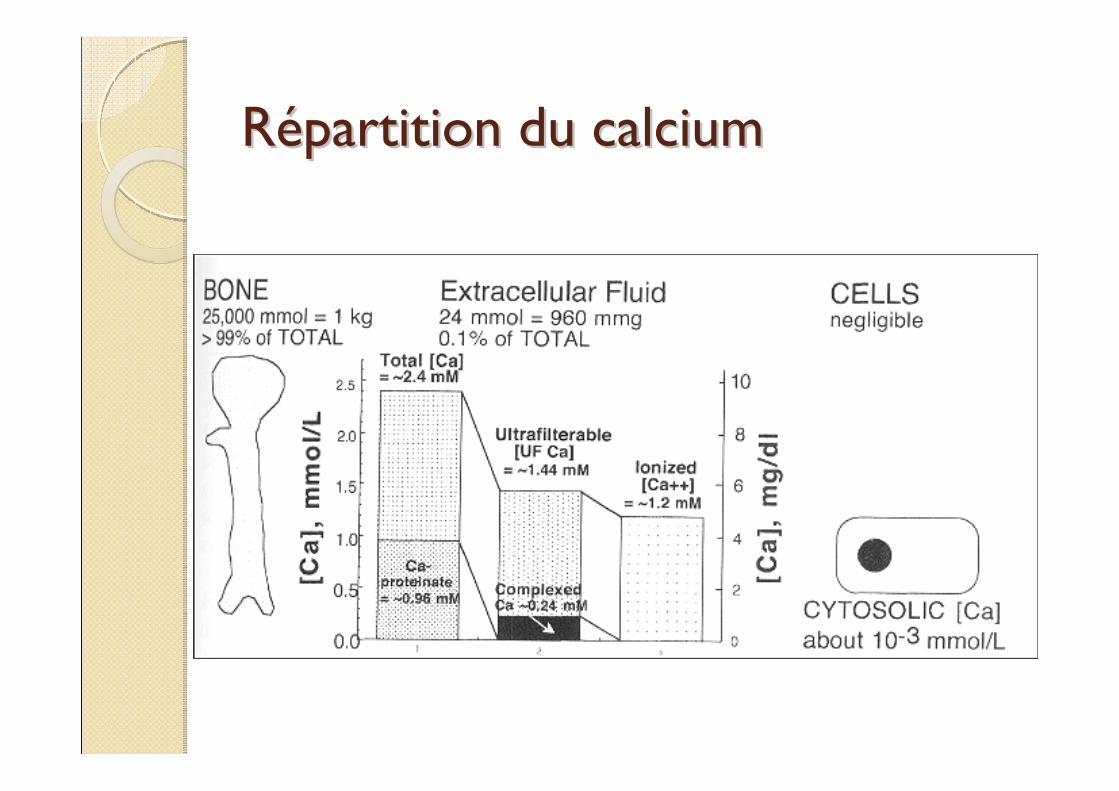
RRéépartition du calciumpartition du calcium
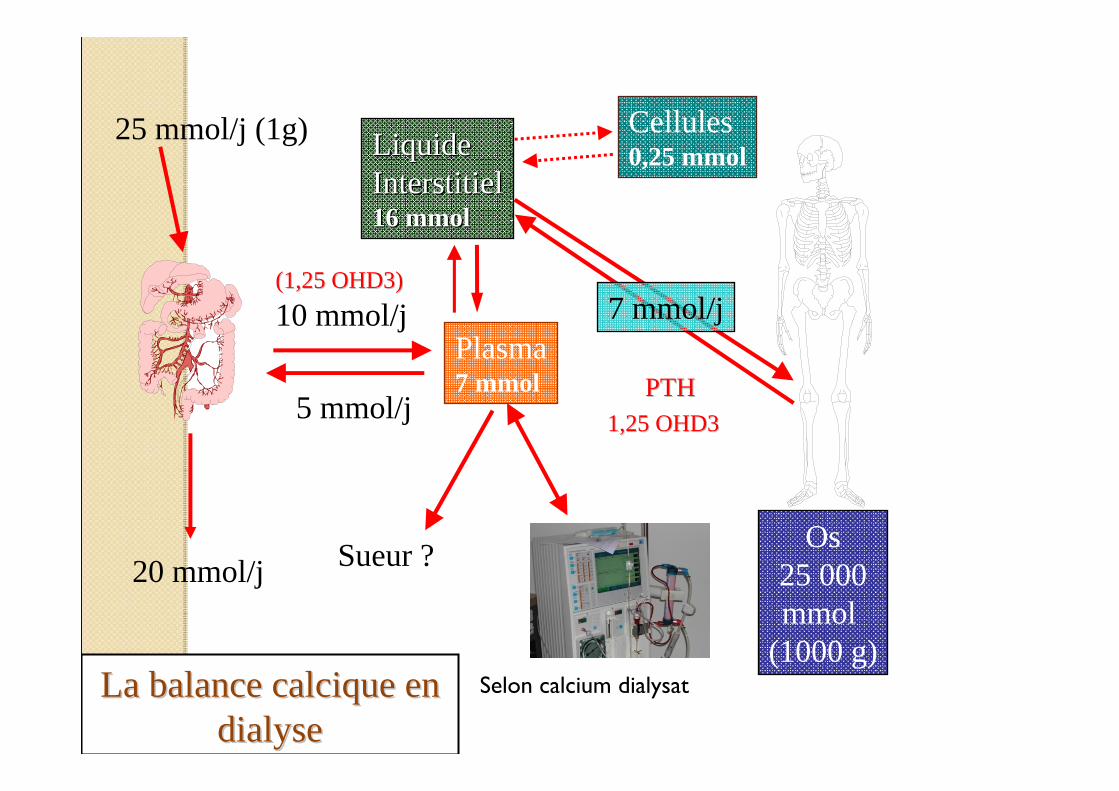
LiquideLiquideInterstitielInterstitiel16 mmol16 mmol
Plasma7 mmol
Cellules0,25 mmol
Os25 000mmol
(1000 g)
25 mmol/j (1g)
20 mmol/j
7 mmol/j10 mmol/j
5 mmol/j
La balance calcique en La balance calcique en dialysedialyse
(1,25 OHD3)(1,25 OHD3)
PTHPTH1,25 OHD31,25 OHD3
Sueur ?
Selon calcium dialysat
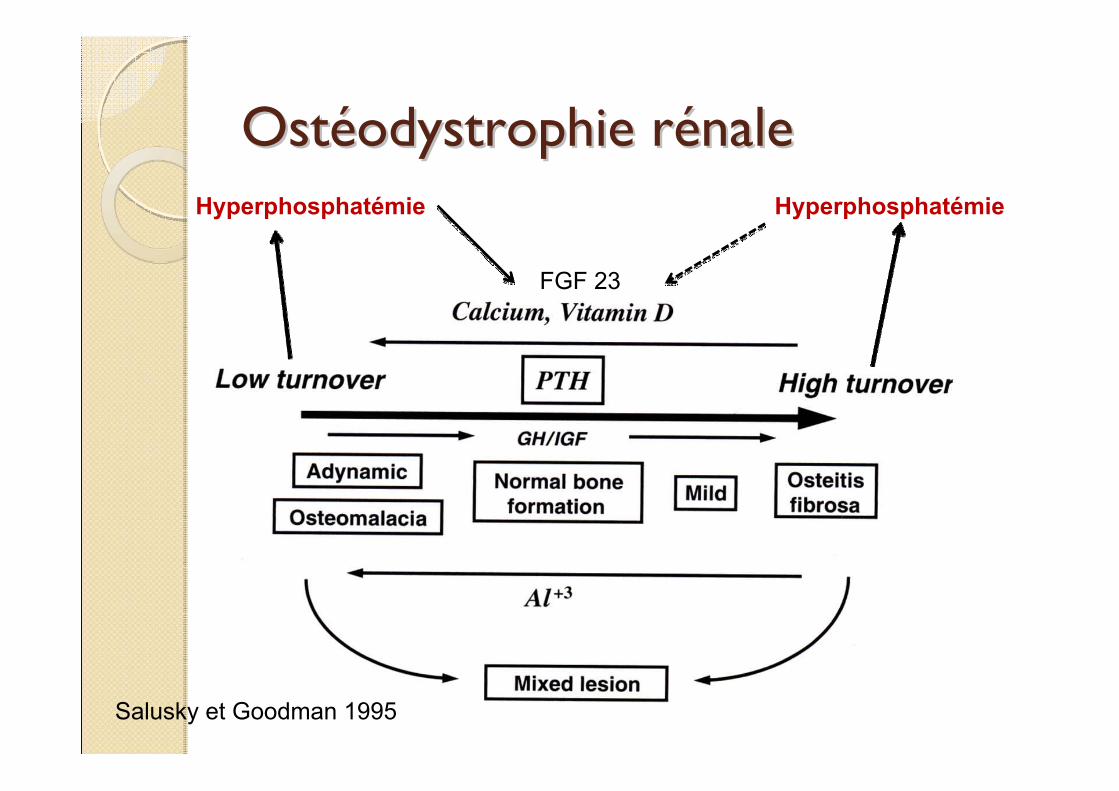
OstOstééodystrophie rodystrophie réénalenale
Salusky et Goodman 1995
Hyperphosphatémie
FGF 23
Hyperphosphatémie
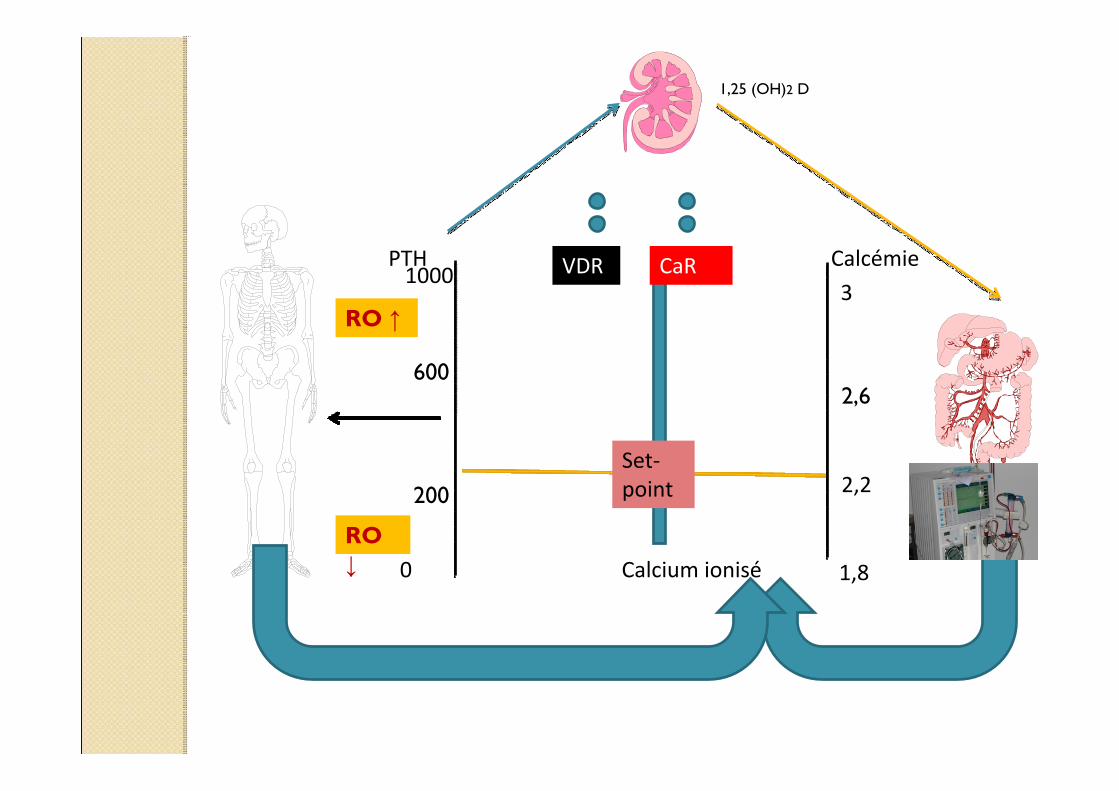
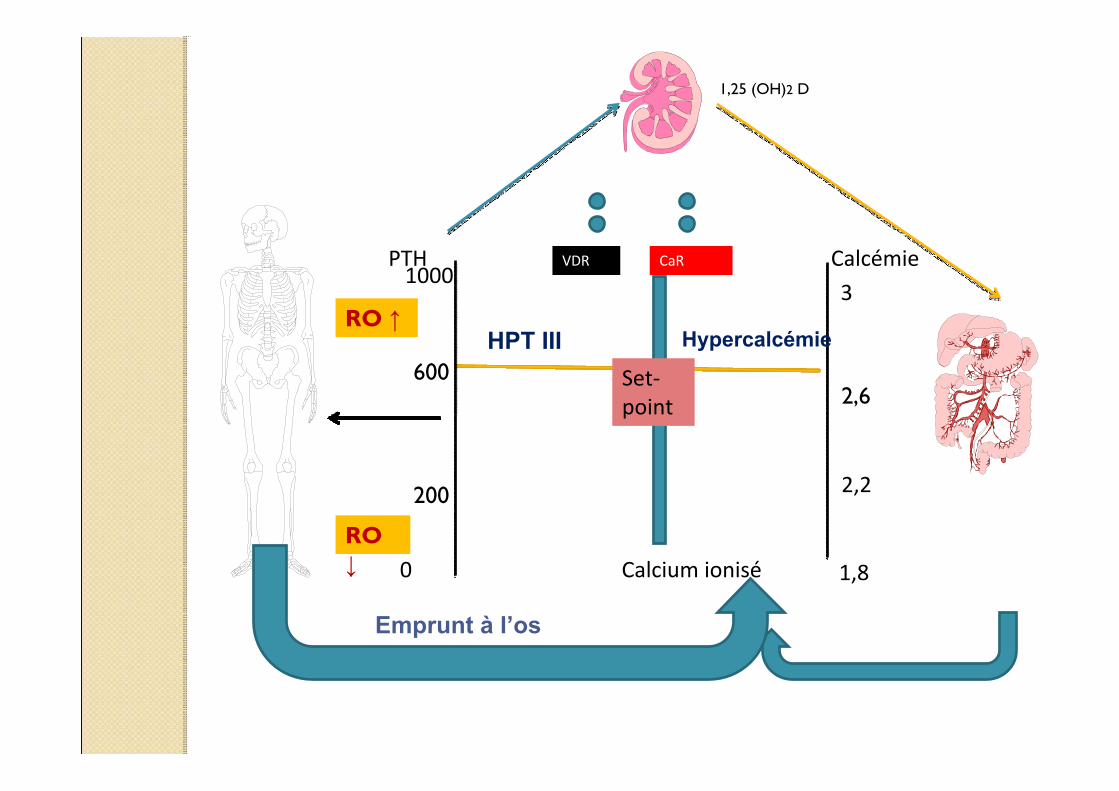
Calcémie
Calcium ionisé 1,8
Set‐point
CaRVDR
2,2
3
2,6
0
PTH1000
200
600
RO ↑
RO ↓
1,25 (OH)2 D
Calcémie
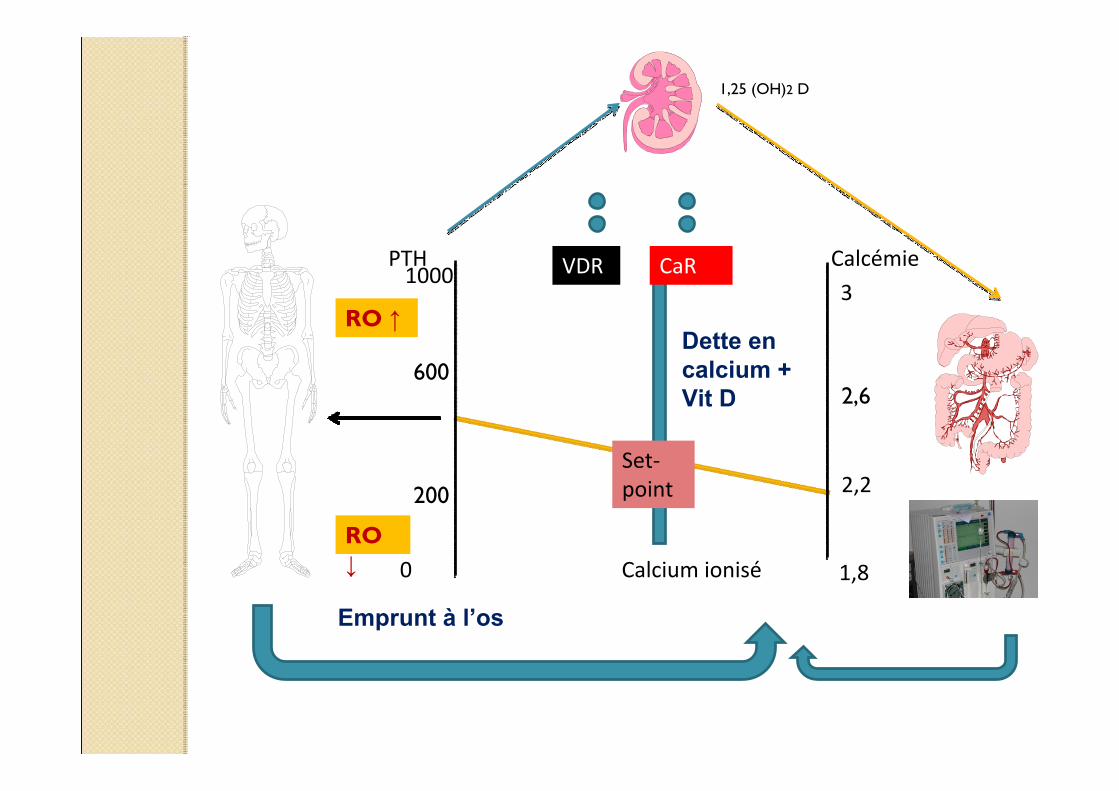
Calcium ionisé 1,8
Set‐point
CaRVDR
2,2
3
2,6
0
PTH1000
200
600
RO ↑
RO ↓
1,25 (OH)2 D
Dette en calcium + Vit D
Emprunt à l’os
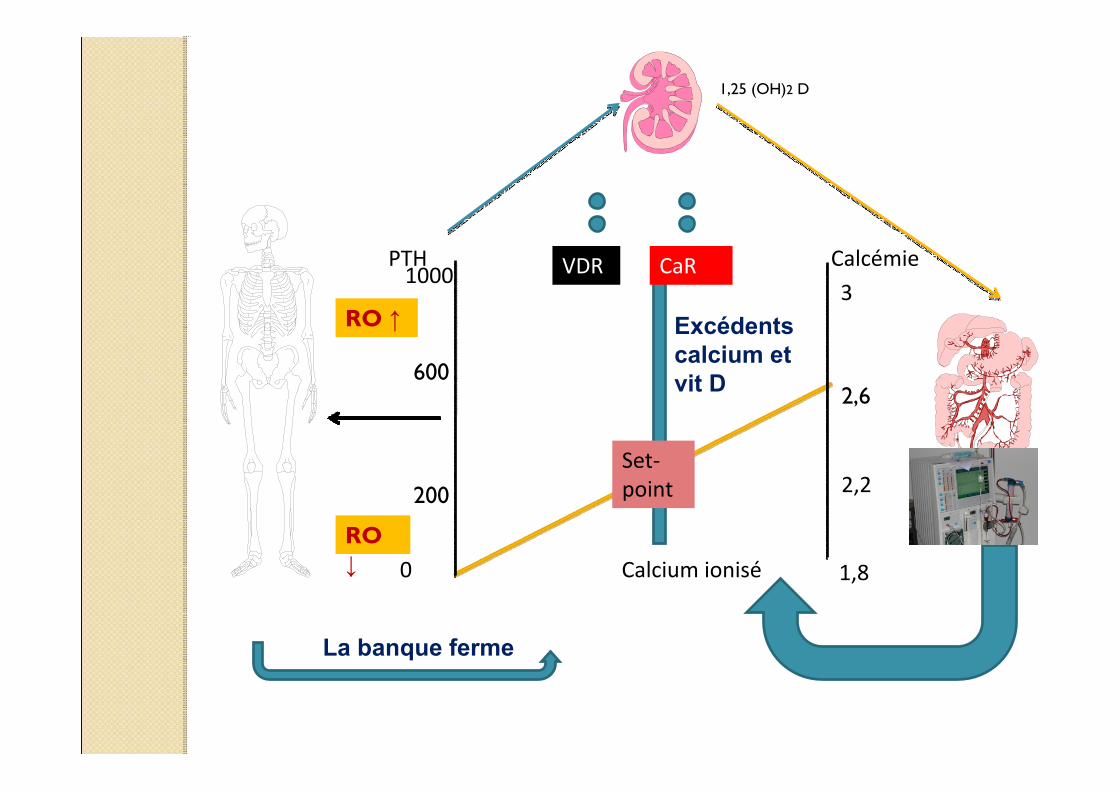
Calcémie
Calcium ionisé 1,8
Set‐point
CaRVDR
2,2
3
2,6
0
PTH1000
200
600
RO ↑
RO ↓
1,25 (OH)2 D
Excédents calcium et vit D
La banque ferme
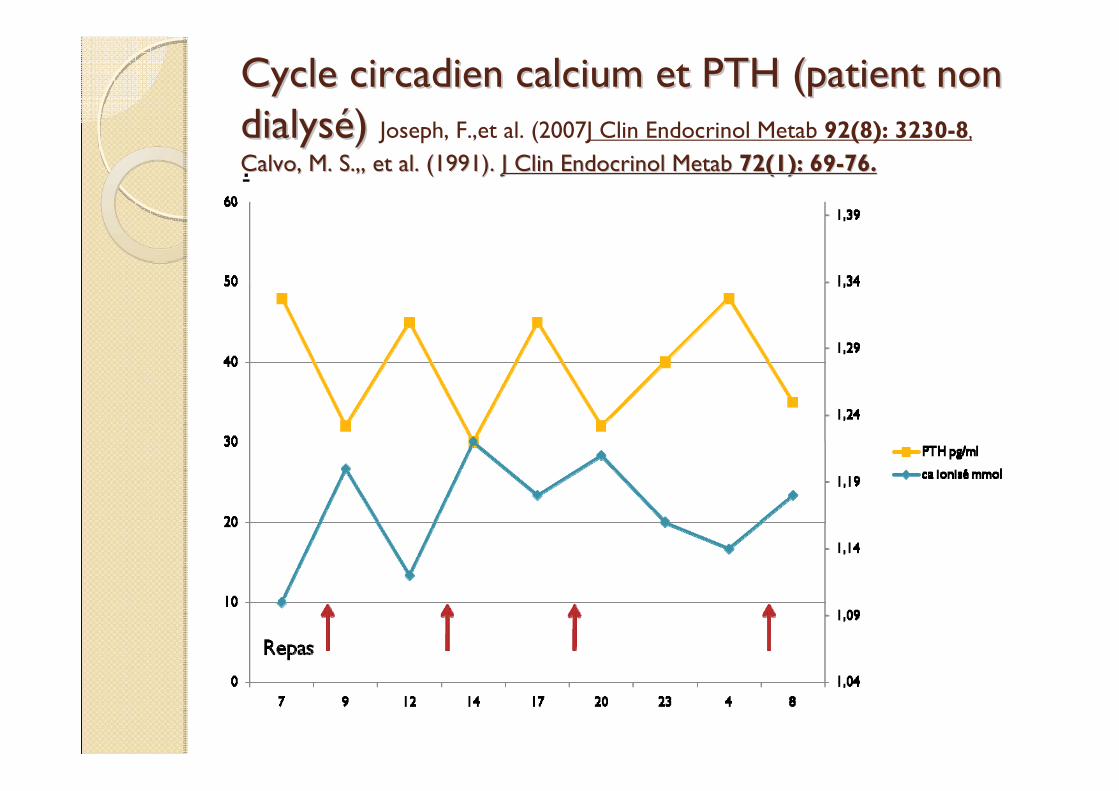
Cycle circadien calcium et PTH (patient non Cycle circadien calcium et PTH (patient non dialysdialyséé) ) Joseph, F.,et al. (2007J Clin Endocrinol Metab 92(8): 3230-8,
Calvo, M. S.,, et al. (1991). Calvo, M. S.,, et al. (1991). J Clin Endocrinol Metab J Clin Endocrinol Metab 72(1): 6972(1): 69--76.76..
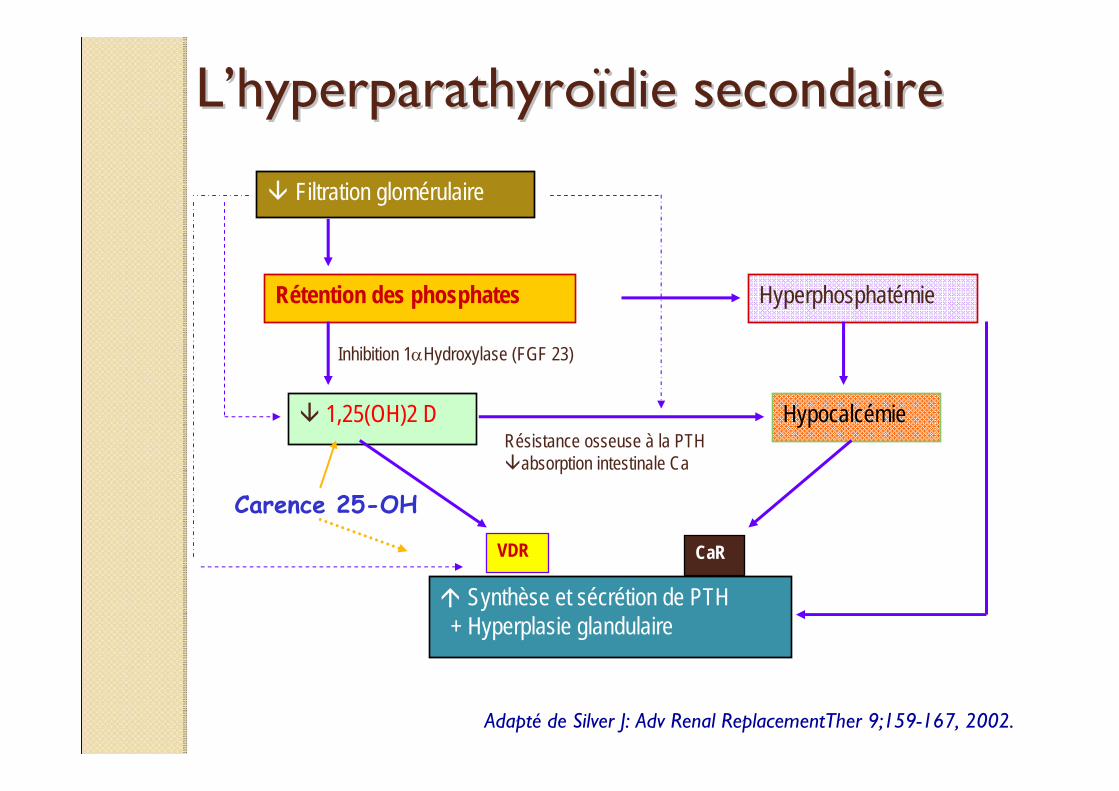
LL’’hyperparathyrohyperparathyroïïdie secondairedie secondaire
Filtration glomérulaire
Rétention des phosphates Hyperphosphatémie
1,25(OH)2 D Hypocalcémie
Synthèse et sécrétion de PTH+ Hyperplasie glandulaire
VDR CaR
Inhibition 1αHydroxylase (FGF 23)
Résistance osseuse à la PTHabsorption intestinale Ca
Carence 25-OH
Adapté de Silver J: Adv Renal ReplacementTher 9;159-167, 2002.
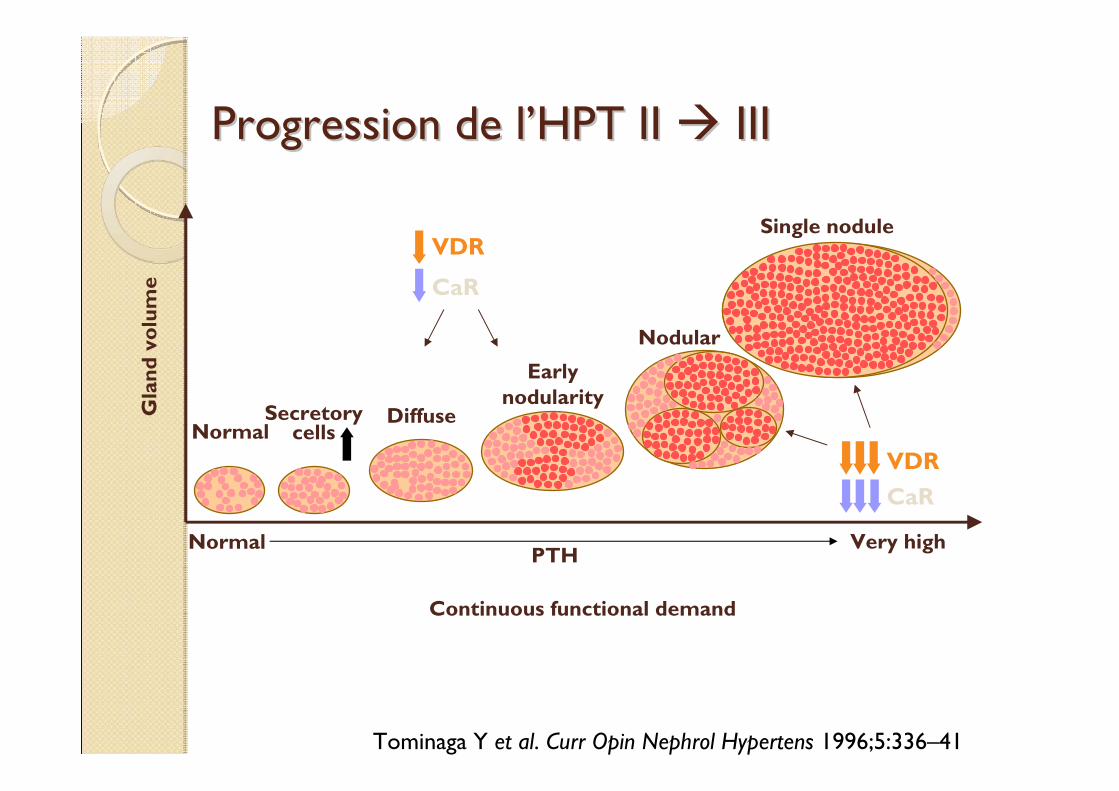
Progression de lProgression de l’’HPT II HPT II IIIIII
NormalDiffuse
Earlynodularity
Nodular
Single nodule
Continuous functional demand
Gla
nd v
olum
e
Secretorycells
Tominaga Y et al. Curr Opin Nephrol Hypertens 1996;5:336–41
VDR
CaR
Normal Very highPTH
VDRCaR
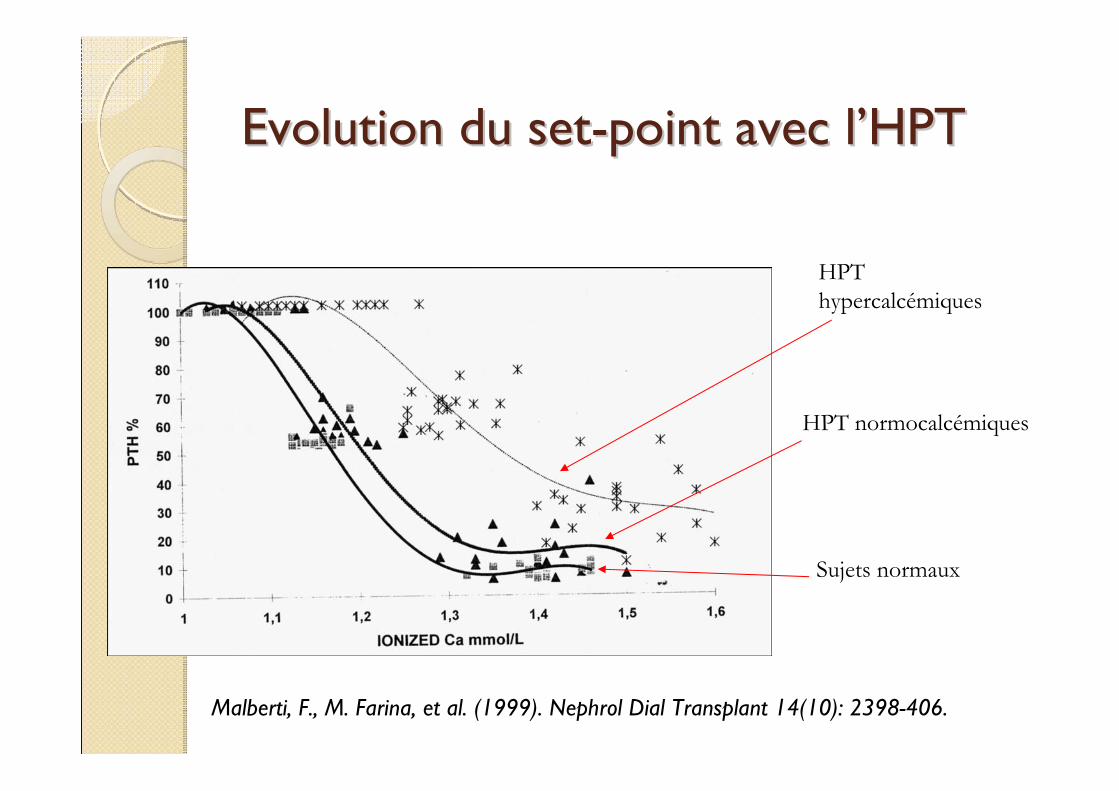
Evolution du setEvolution du set--point avec lpoint avec l’’HPTHPT
HPT hypercalcémiques
HPT normocalcémiques
Sujets normaux
Malberti, F., M. Farina, et al. (1999). Nephrol Dial Transplant 14(10): 2398-406.
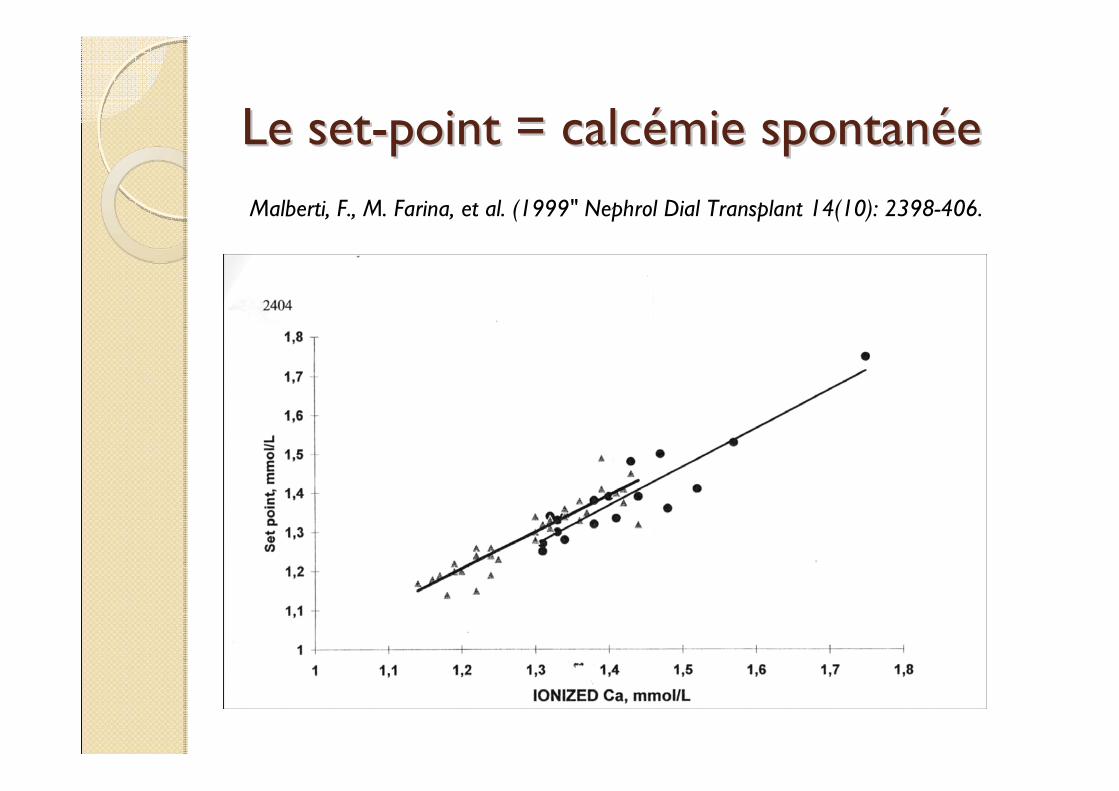
Le setLe set--point = calcpoint = calcéémie spontanmie spontanééeeMalberti, F., M. Farina, et al. (1999" Nephrol Dial Transplant 14(10): 2398-406.
Calcémie
Calcium ionisé 1,8
Set‐point
CaRVDR
2,2
3
2,6
0
PTH1000
200
600
RO ↑
RO ↓
1,25 (OH)2 D
HypercalcémieHPT III
Emprunt à l’os
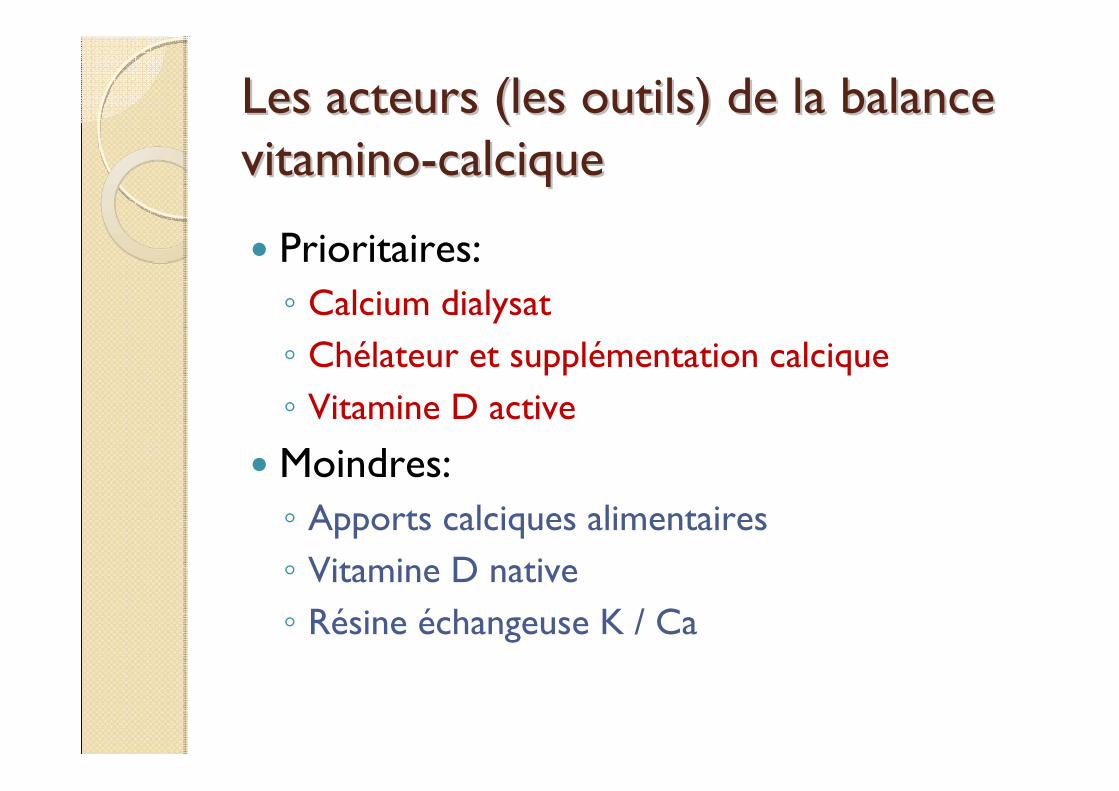
Les acteurs (les outils) de la balance Les acteurs (les outils) de la balance vitaminovitamino--calciquecalcique
Prioritaires:◦ Calcium dialysat◦ Chélateur et supplémentation calcique◦ Vitamine D active
Moindres:◦ Apports calciques alimentaires◦ Vitamine D native◦ Résine échangeuse K / Ca
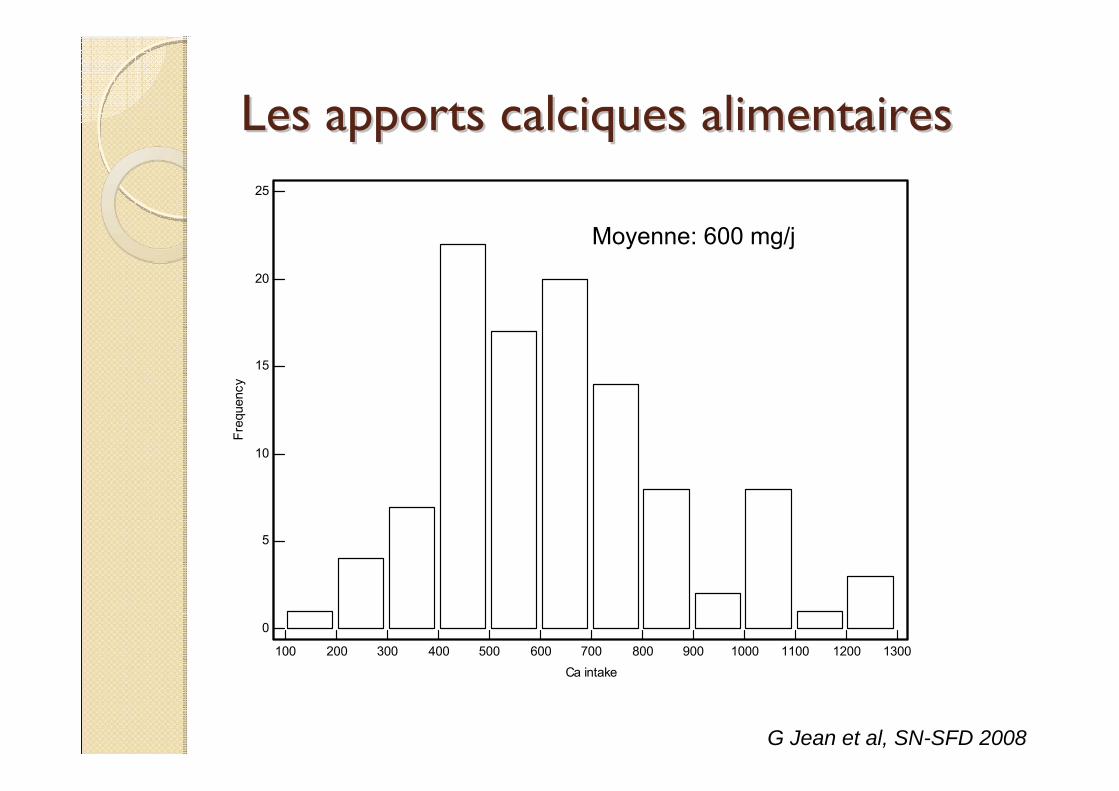
Les apports calciques alimentairesLes apports calciques alimentaires
100 200 300 400 500 600 700 800 900 1000 1100 1200 1300
25
20
15
10
5
0
Ca intake
Freq
uenc
y
G Jean et al, SN-SFD 2008
Moyenne: 600 mg/j
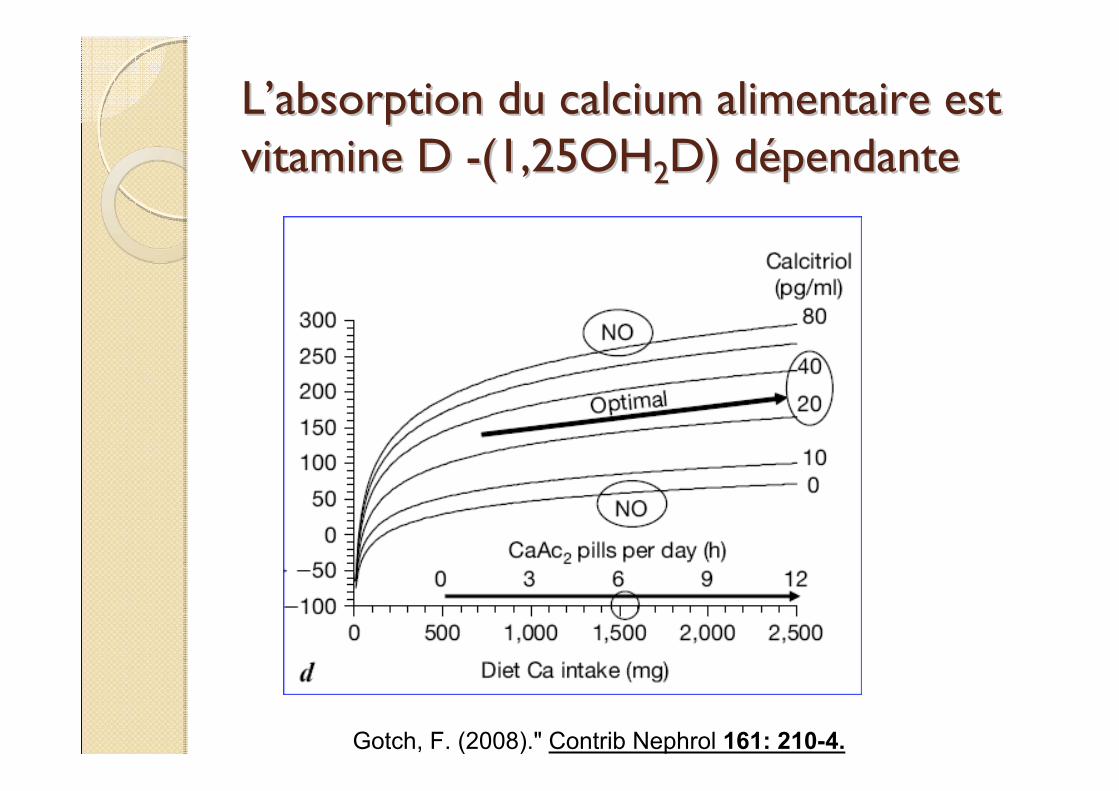
LL’’absorption du calcium alimentaire est absorption du calcium alimentaire est vitamine D vitamine D --(1,25OH(1,25OH22D) dD) déépendantependante
Gotch, F. (2008)." Contrib Nephrol 161: 210-4.
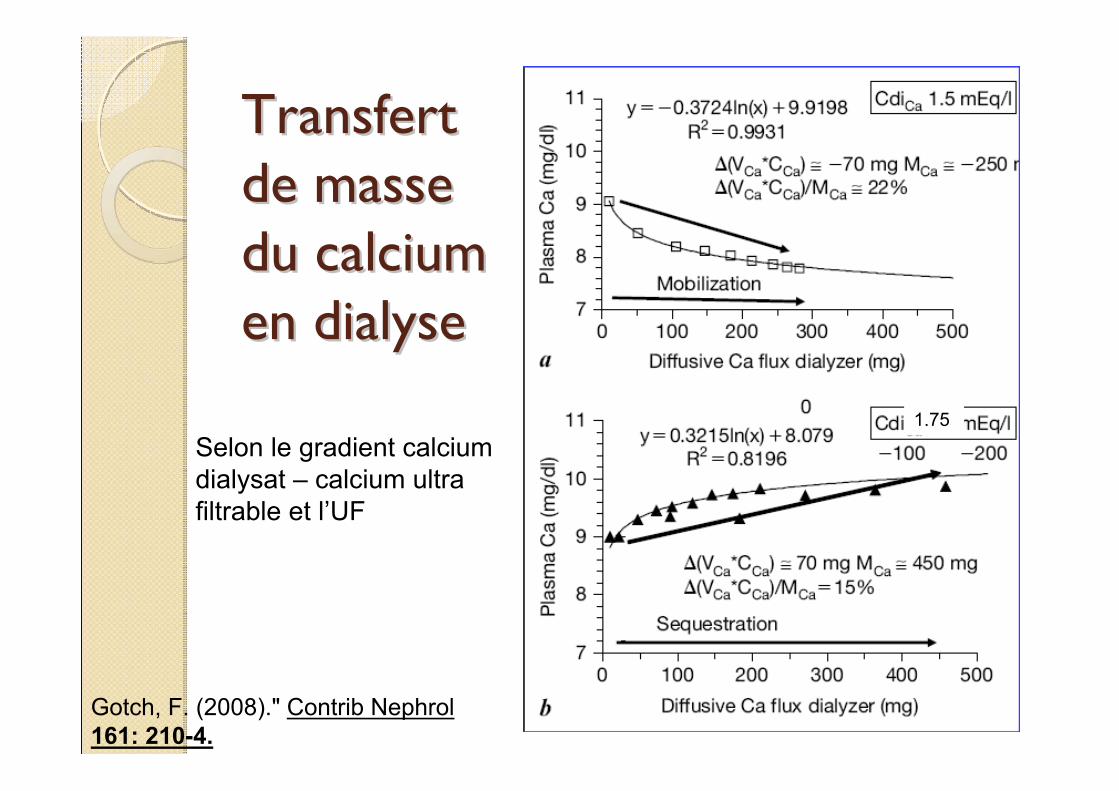
Transfert Transfert de masse de masse du calcium du calcium en dialyse en dialyse
Gotch, F. (2008)." Contrib Nephrol 161: 210-4.
Selon le gradient calcium dialysat – calcium ultra filtrable et l’UF
1.75
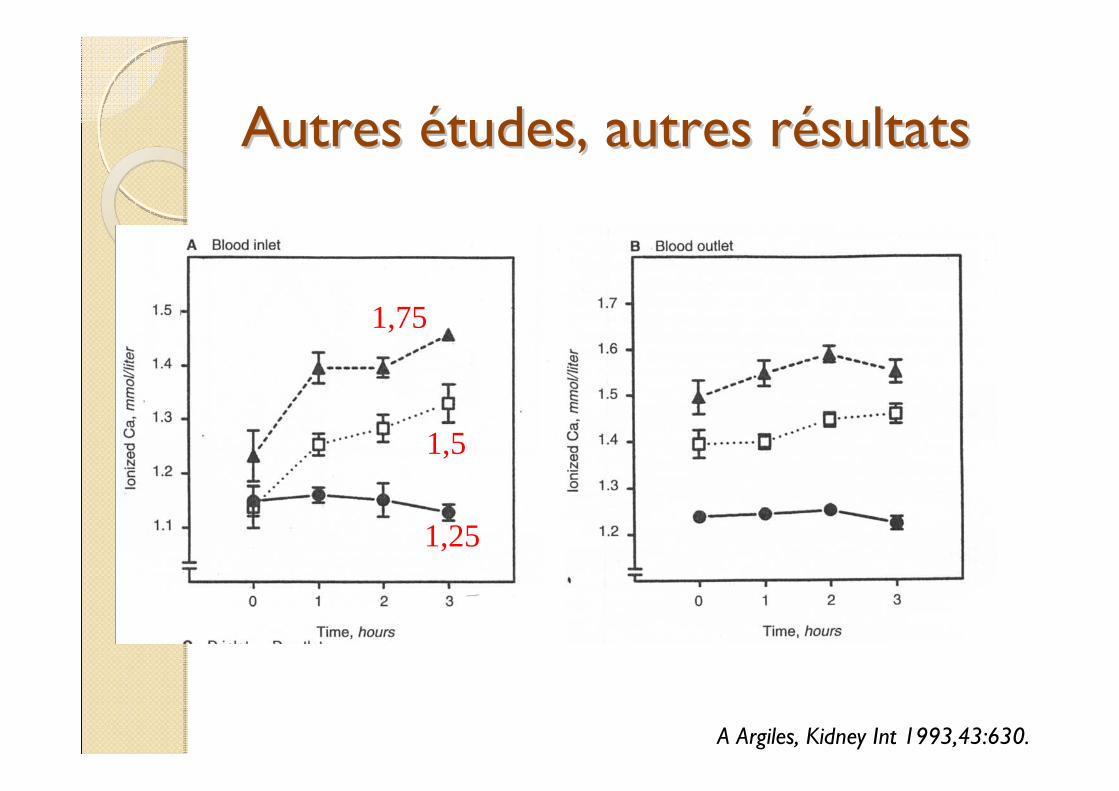
Autres Autres éétudes, autres rtudes, autres réésultatssultats
1,75
1,5
1,25
A Argiles, Kidney Int 1993,43:630.
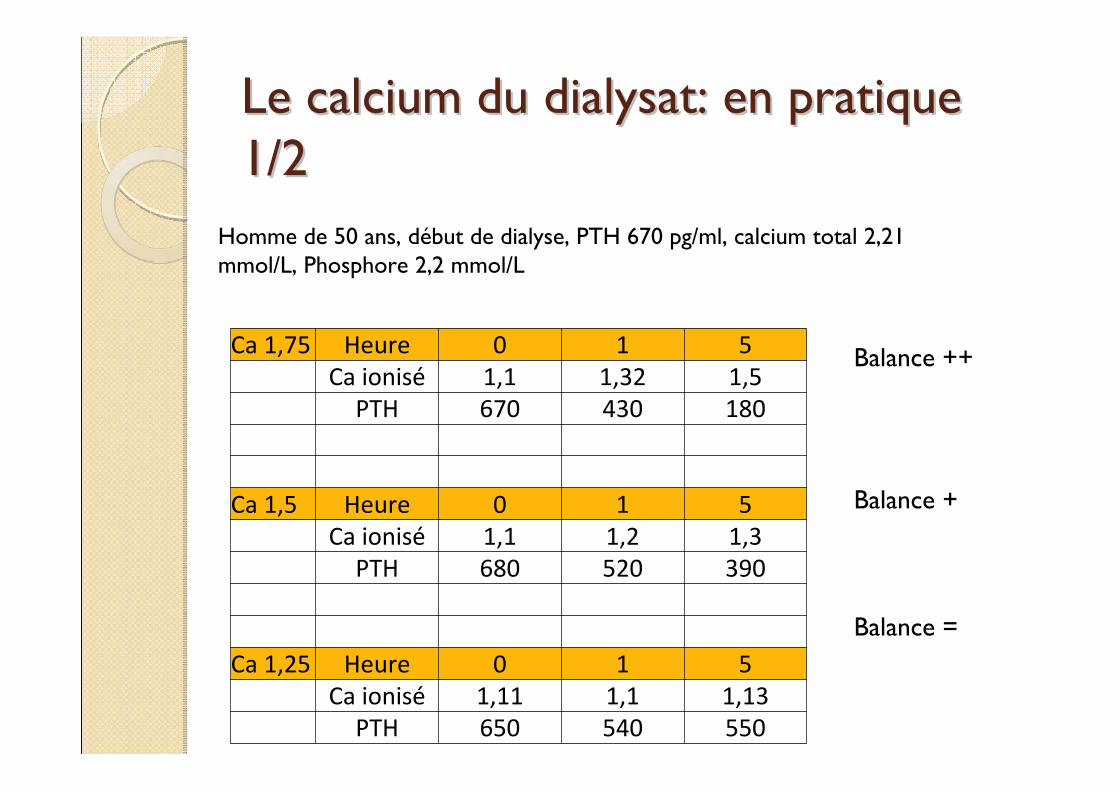
Le calcium du dialysat: en pratique Le calcium du dialysat: en pratique 1/21/2
Homme de 50 ans, début de dialyse, PTH 670 pg/ml, calcium total 2,21 mmol/L, Phosphore 2,2 mmol/L
Ca 1,75 Heure 0 1 5Ca ionisé 1,1 1,32 1,5PTH 670 430 180
Ca 1,5 Heure 0 1 5Ca ionisé 1,1 1,2 1,3PTH 680 520 390
Ca 1,25 Heure 0 1 5Ca ionisé 1,11 1,1 1,13PTH 650 540 550
Balance ++
Balance +
Balance =
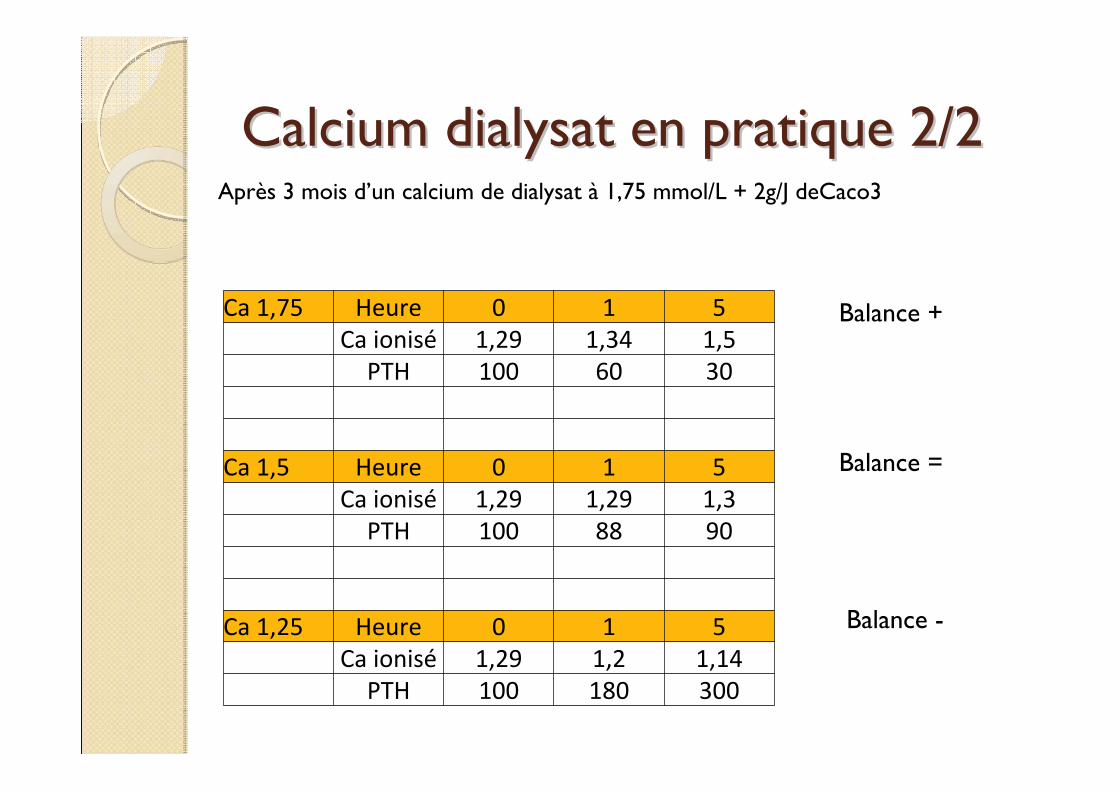
Calcium dialysat en pratique 2/2Calcium dialysat en pratique 2/2Après 3 mois d’un calcium de dialysat à 1,75 mmol/L + 2g/J deCaco3
Ca 1,75 Heure 0 1 5Ca ionisé 1,29 1,34 1,5PTH 100 60 30
Ca 1,5 Heure 0 1 5Ca ionisé 1,29 1,29 1,3PTH 100 88 90
Ca 1,25 Heure 0 1 5Ca ionisé 1,29 1,2 1,14PTH 100 180 300
Balance -
Balance =
Balance +
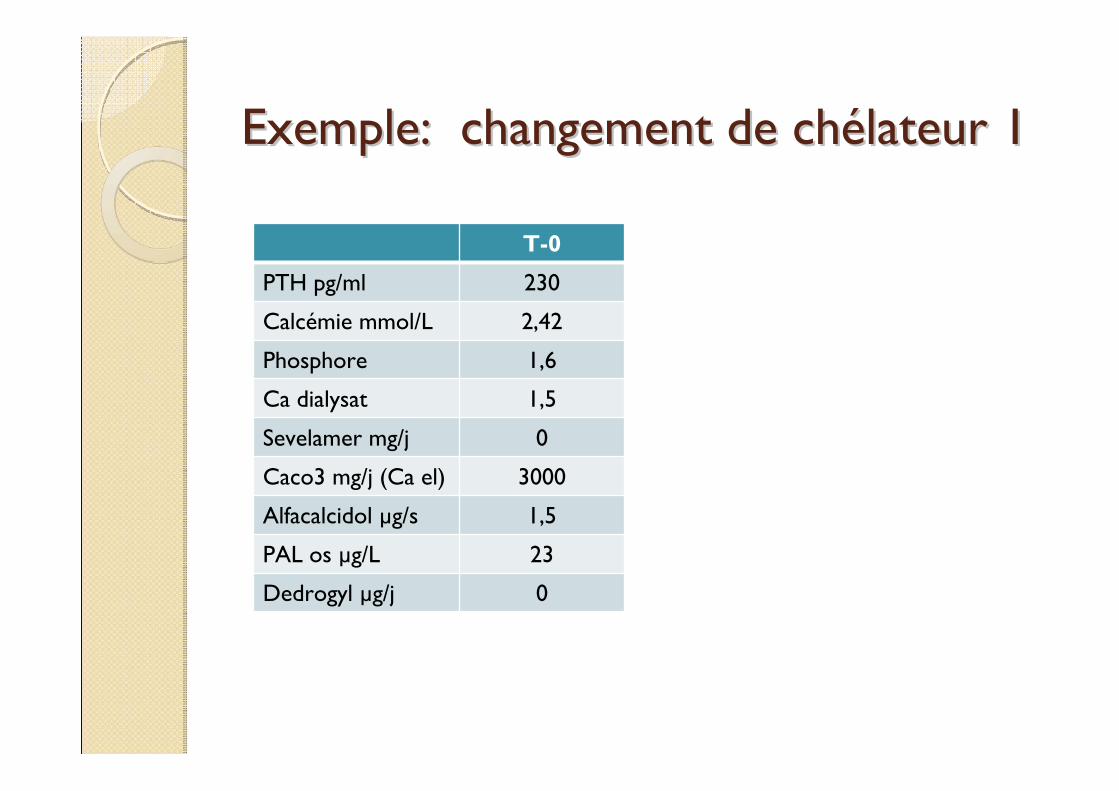
Exemple: changement de chExemple: changement de chéélateur 1lateur 1
T-0
PTH pg/ml 230
Calcémie mmol/L 2,42
Phosphore 1,6
Ca dialysat 1,5
Sevelamer mg/j 0
Caco3 mg/j (Ca el) 3000
Alfacalcidol µg/s 1,5
PAL os µg/L 23
Dedrogyl µg/j 0
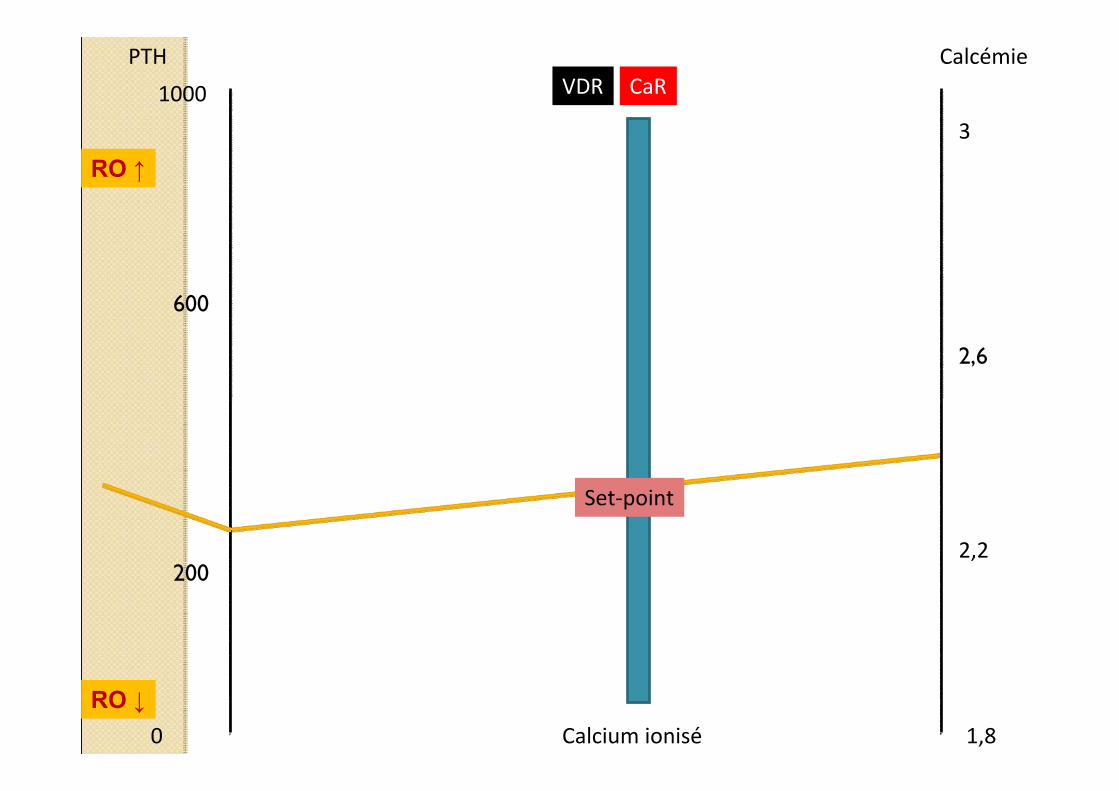
Calcémie
Calcium ionisé 1,8
Set‐point
CaRVDR
2,2
3
2,6
0
PTH
1000
200
600
RO ↑
RO ↓
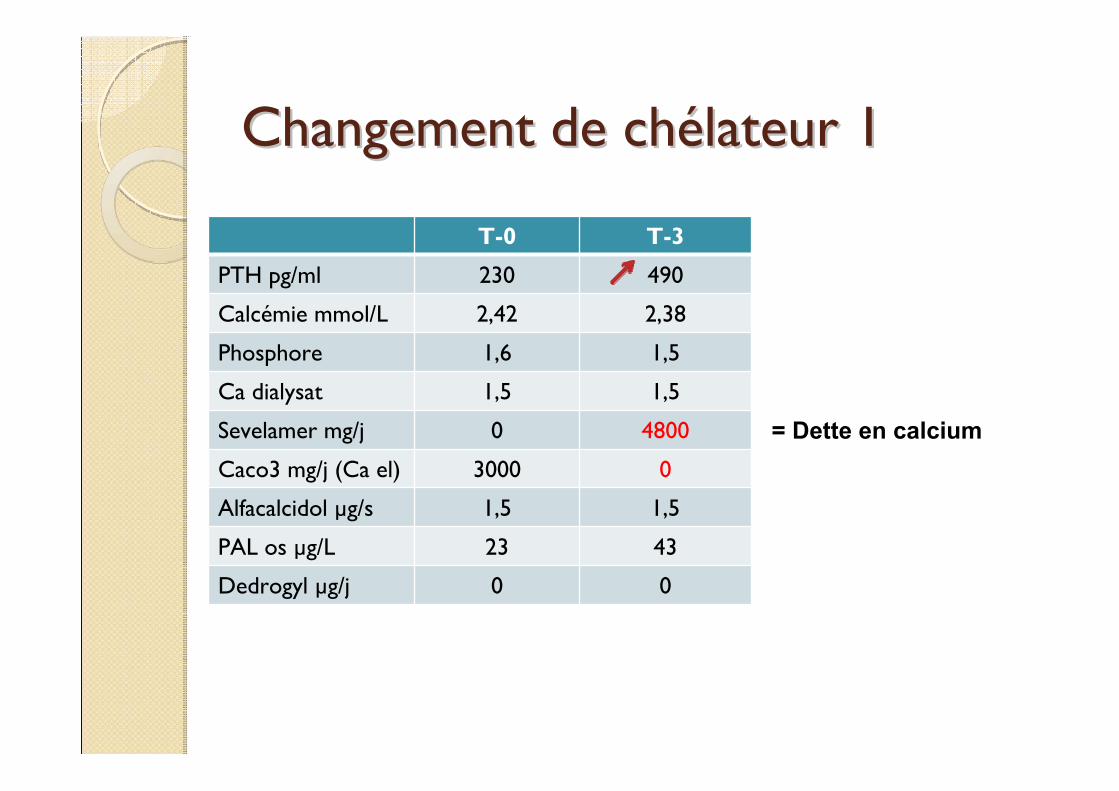
Changement de chChangement de chéélateur 1lateur 1
T-0 T-3
PTH pg/ml 230 490
Calcémie mmol/L 2,42 2,38
Phosphore 1,6 1,5
Ca dialysat 1,5 1,5
Sevelamer mg/j 0 4800
Caco3 mg/j (Ca el) 3000 0
Alfacalcidol µg/s 1,5 1,5
PAL os µg/L 23 43
Dedrogyl µg/j 0 0
= Dette en calcium
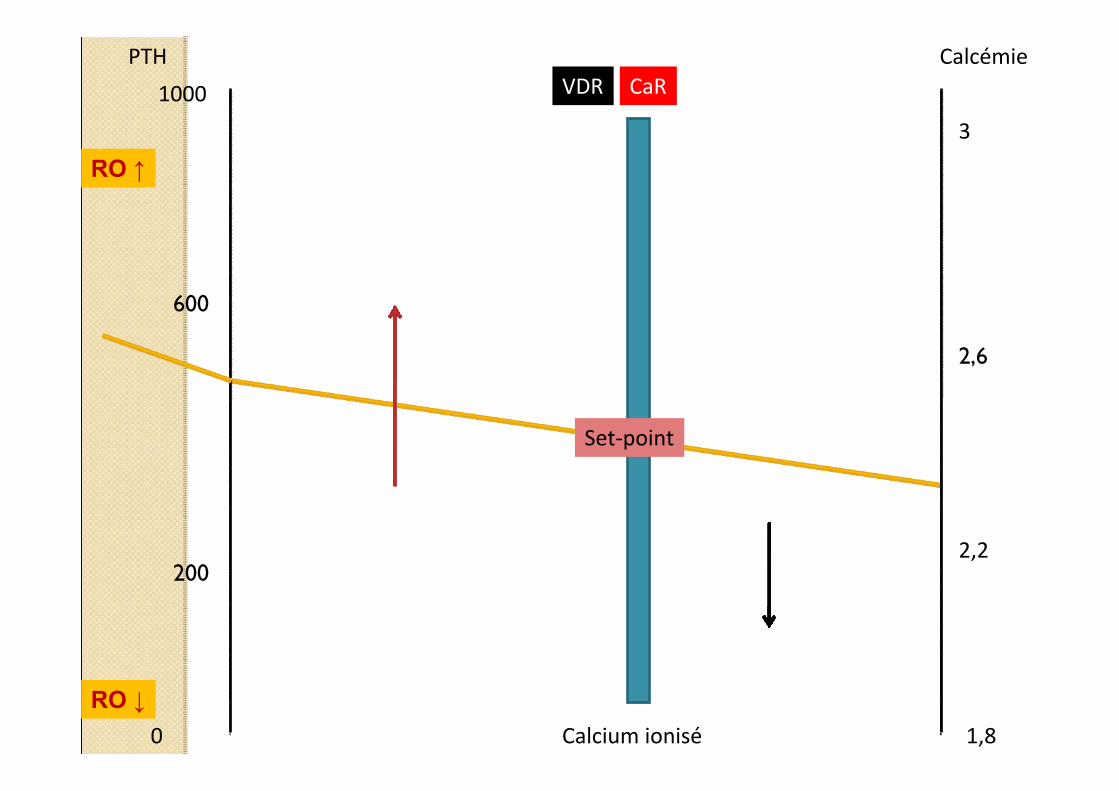
Calcémie
Calcium ionisé 1,8
Set‐point
CaRVDR
2,2
3
2,6
0
PTH
1000
200
600
RO ↑
RO ↓
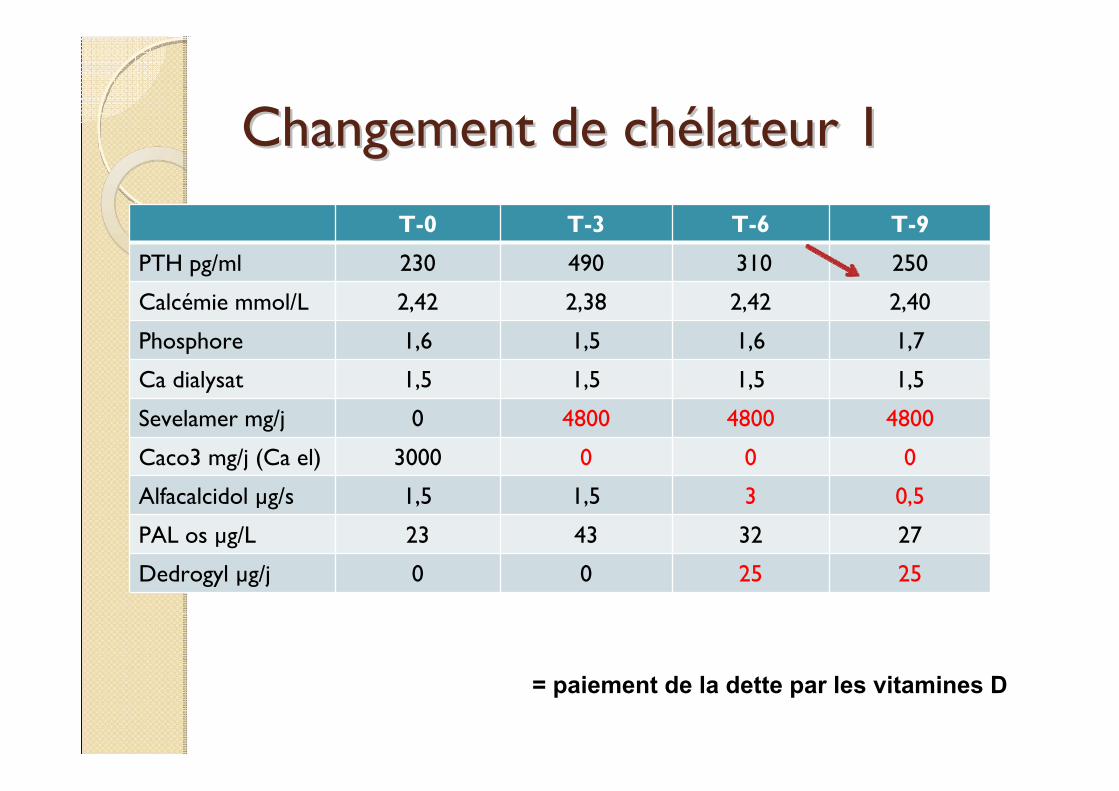
Changement de chChangement de chéélateur 1lateur 1
T-0 T-3 T-6 T-9
PTH pg/ml 230 490 310 250
Calcémie mmol/L 2,42 2,38 2,42 2,40
Phosphore 1,6 1,5 1,6 1,7
Ca dialysat 1,5 1,5 1,5 1,5
Sevelamer mg/j 0 4800 4800 4800
Caco3 mg/j (Ca el) 3000 0 0 0
Alfacalcidol µg/s 1,5 1,5 3 0,5
PAL os µg/L 23 43 32 27
Dedrogyl µg/j 0 0 25 25
= paiement de la dette par les vitamines D
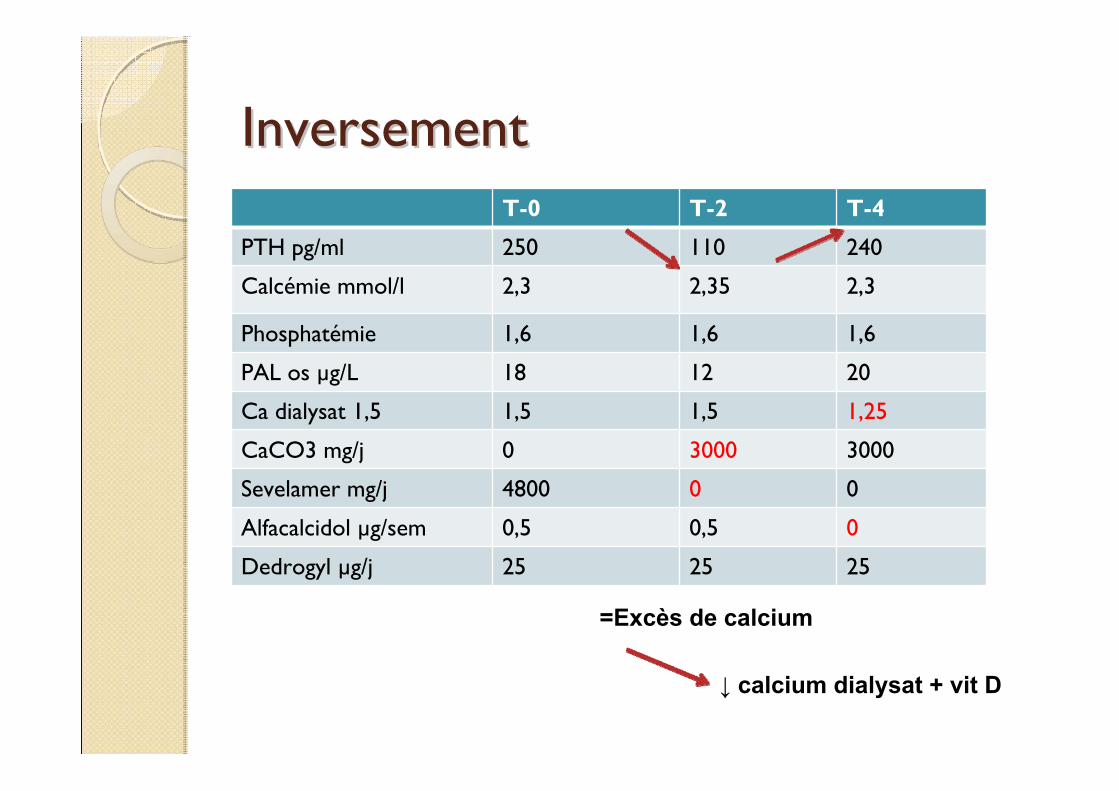
InversementInversementT-0 T-2 T-4
PTH pg/ml 250 110 240
Calcémie mmol/l 2,3 2,35 2,3
Phosphatémie 1,6 1,6 1,6
PAL os µg/L 18 12 20
Ca dialysat 1,5 1,5 1,5 1,25
CaCO3 mg/j 0 3000 3000
Sevelamer mg/j 4800 0 0
Alfacalcidol µg/sem 0,5 0,5 0
Dedrogyl µg/j 25 25 25
↓ calcium dialysat + vit D
=Excès de calcium
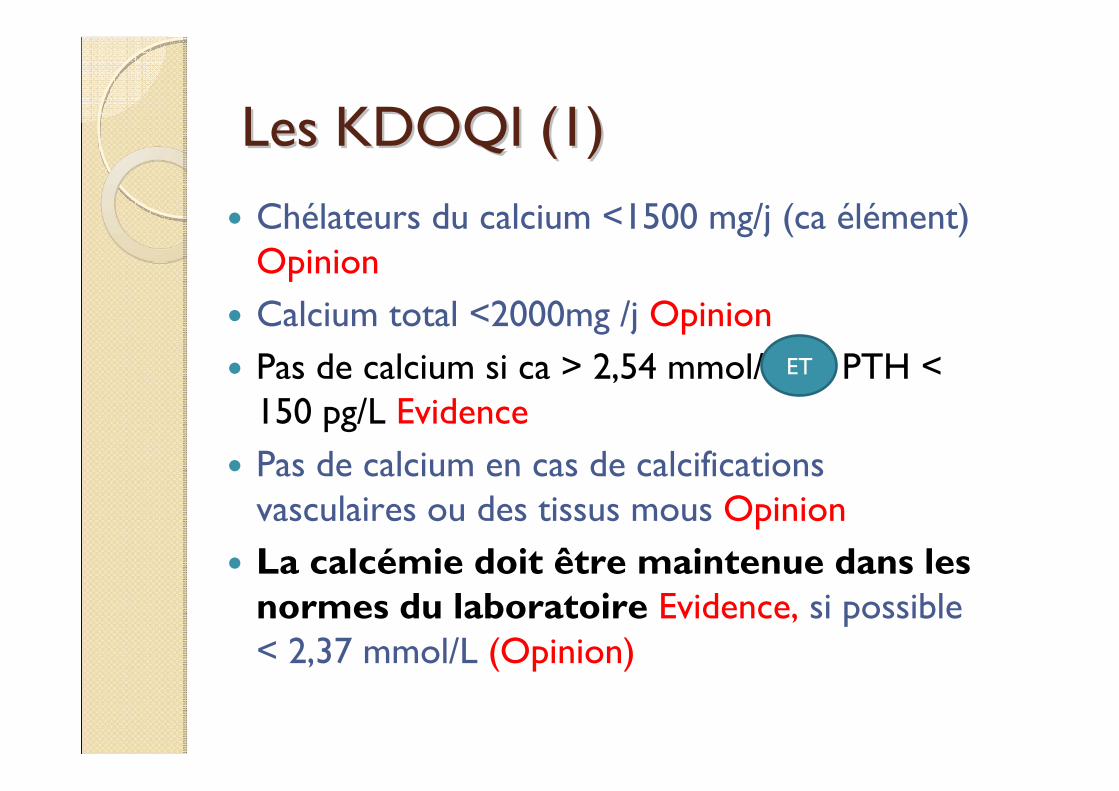
Les KDOQI (1)Les KDOQI (1)Chélateurs du calcium <1500 mg/j (ca élément) OpinionCalcium total <2000mg /j OpinionPas de calcium si ca > 2,54 mmol/L ou PTH < 150 pg/L EvidencePas de calcium en cas de calcifications vasculaires ou des tissus mous OpinionLa calcémie doit être maintenue dans les normes du laboratoire Evidence, si possible < 2,37 mmol/L (Opinion)
ET
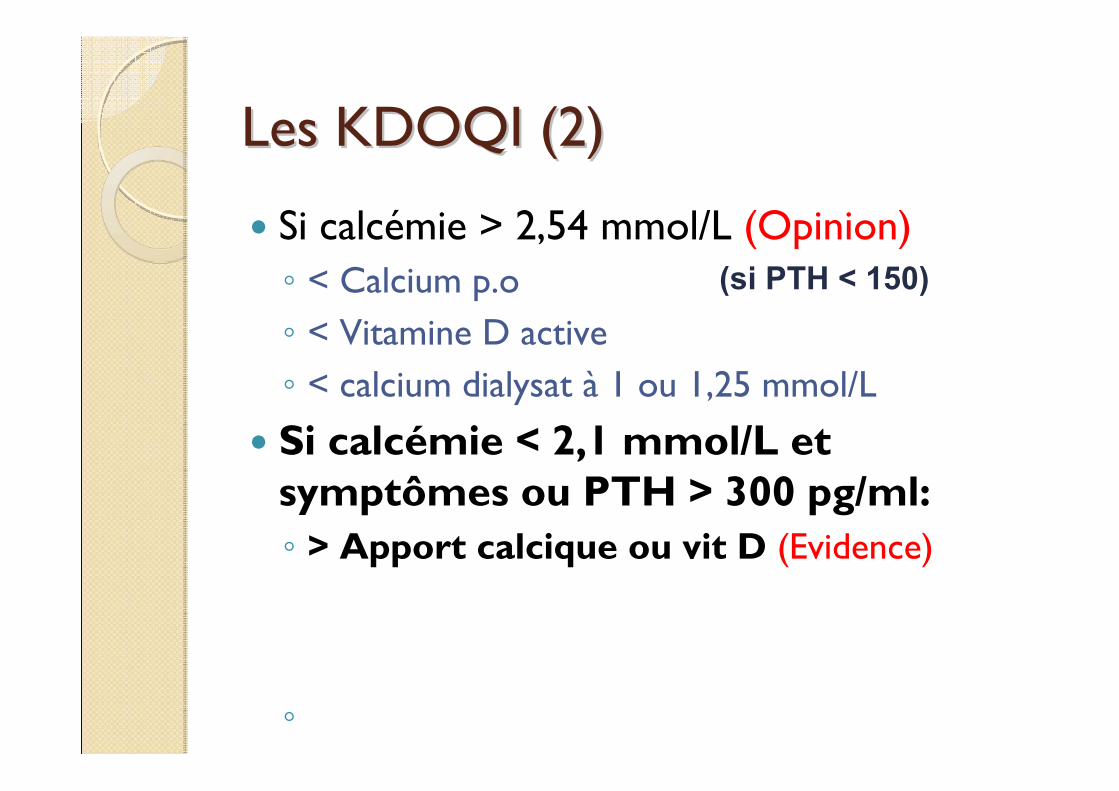
Les KDOQI (2)Les KDOQI (2)
Si calcémie > 2,54 mmol/L (Opinion)◦ < Calcium p.o◦ < Vitamine D active◦ < calcium dialysat à 1 ou 1,25 mmol/L
Si calcémie < 2,1 mmol/L et symptômes ou PTH > 300 pg/ml:◦ > Apport calcique ou vit D (Evidence)
◦
(si PTH < 150)
KDOQI (3)KDOQI (3)
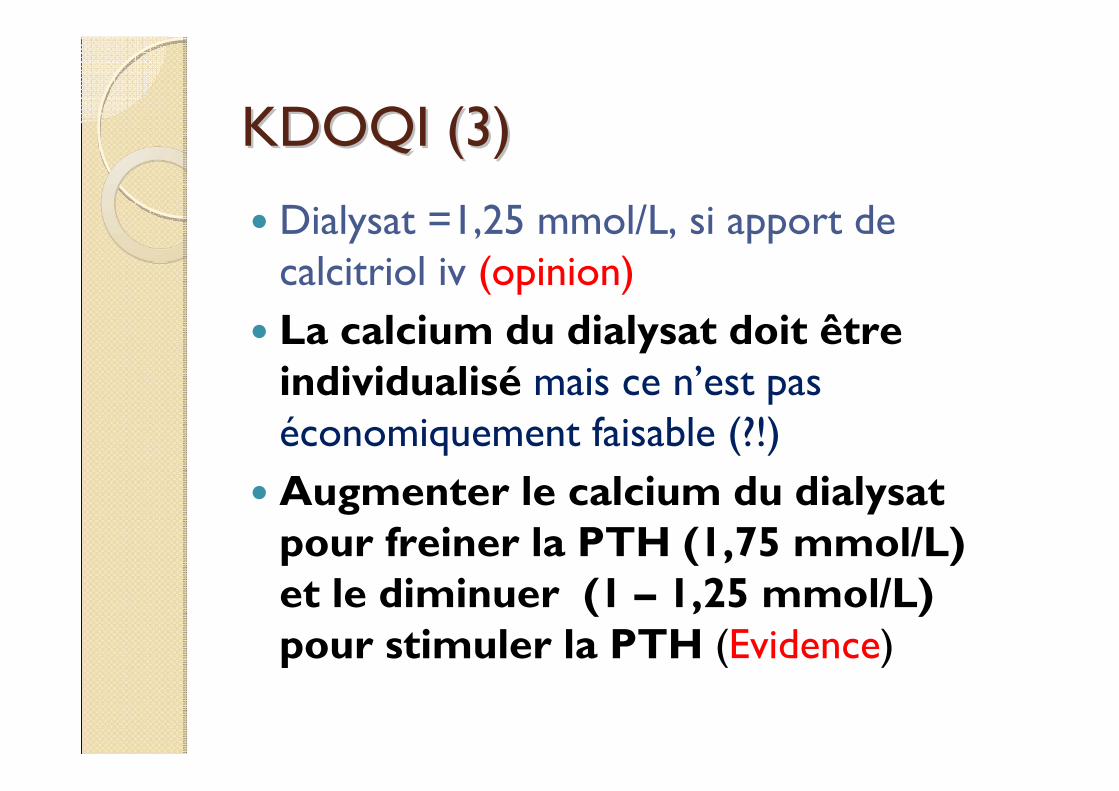
Dialysat =1,25 mmol/L, si apport de calcitriol iv (opinion)La calcium du dialysat doit être individualisé mais ce n’est pas économiquement faisable (?!)Augmenter le calcium du dialysat pour freiner la PTH (1,75 mmol/L) et le diminuer (1 – 1,25 mmol/L) pour stimuler la PTH (Evidence)
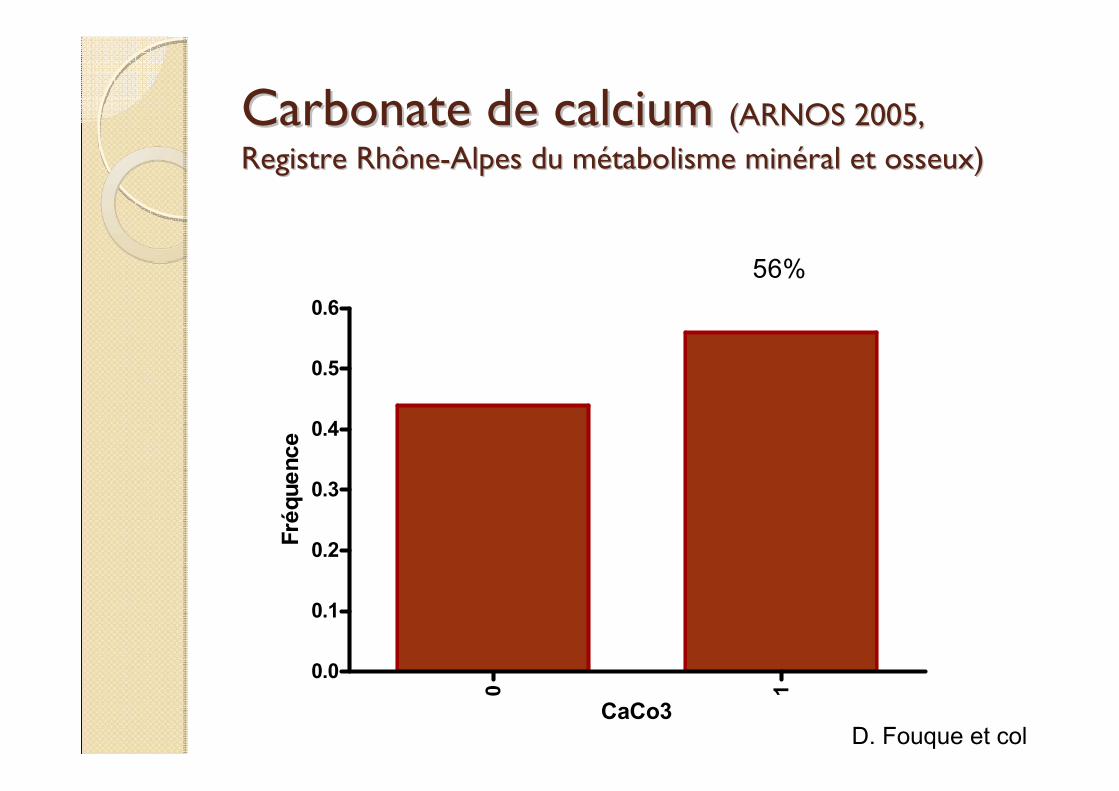
Carbonate de calcium Carbonate de calcium (ARNOS 2005, (ARNOS 2005, Registre RhôneRegistre Rhône--Alpes du mAlpes du méétabolisme mintabolisme minééral et osseux)ral et osseux)
0 1
0.0
0.1
0.2
0.3
0.4
0.5
0.6
56%
CaCo3
Fréq
uenc
e
D. Fouque et col
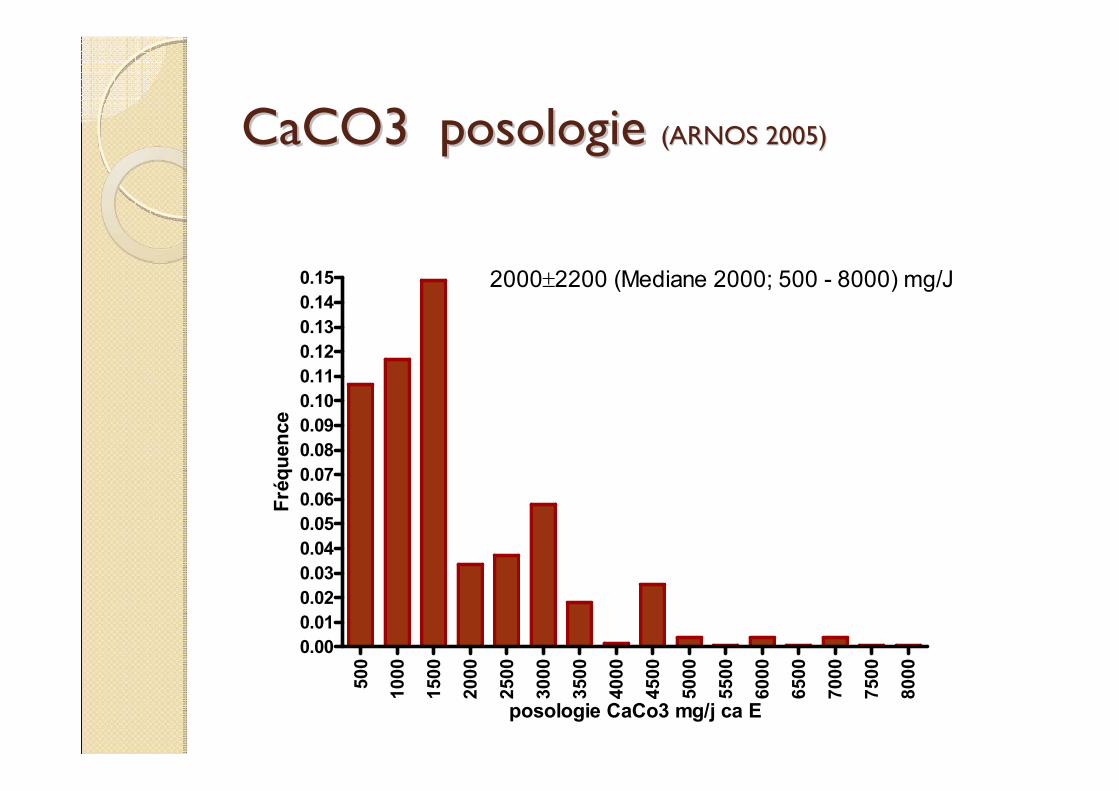
CaCO3 posologie CaCO3 posologie (ARNOS 2005)(ARNOS 2005)
500
1000
1500
2000
2500
3000
3500
4000
4500
5000
5500
6000
6500
7000
7500
8000
0.000.010.020.030.040.050.060.070.080.090.100.110.120.130.140.15 2000±2200 (Mediane 2000; 500 - 8000) mg/J
posologie CaCo3 mg/j ca E
Fréq
uenc
e
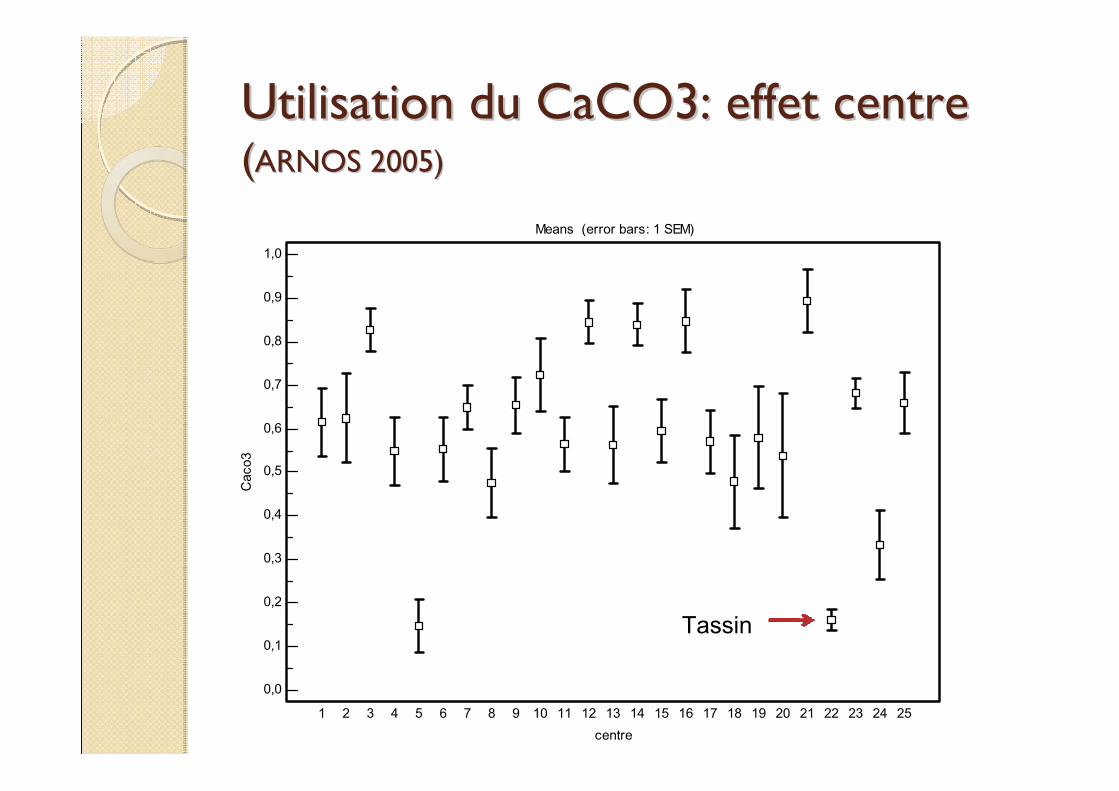
Utilisation du CaCO3: effet centreUtilisation du CaCO3: effet centre((ARNOS 2005)ARNOS 2005)
Means (error bars: 1 SEM)
1,0
0,9
0,8
0,7
0,6
0,5
0,4
0,3
0,2
0,1
0,0
centre
Cac
o3
1 2 3 4 5 6 7 8 9 10 11 12 13 14 15 16 17 18 19 20 21 22 23 24 25
Tassin
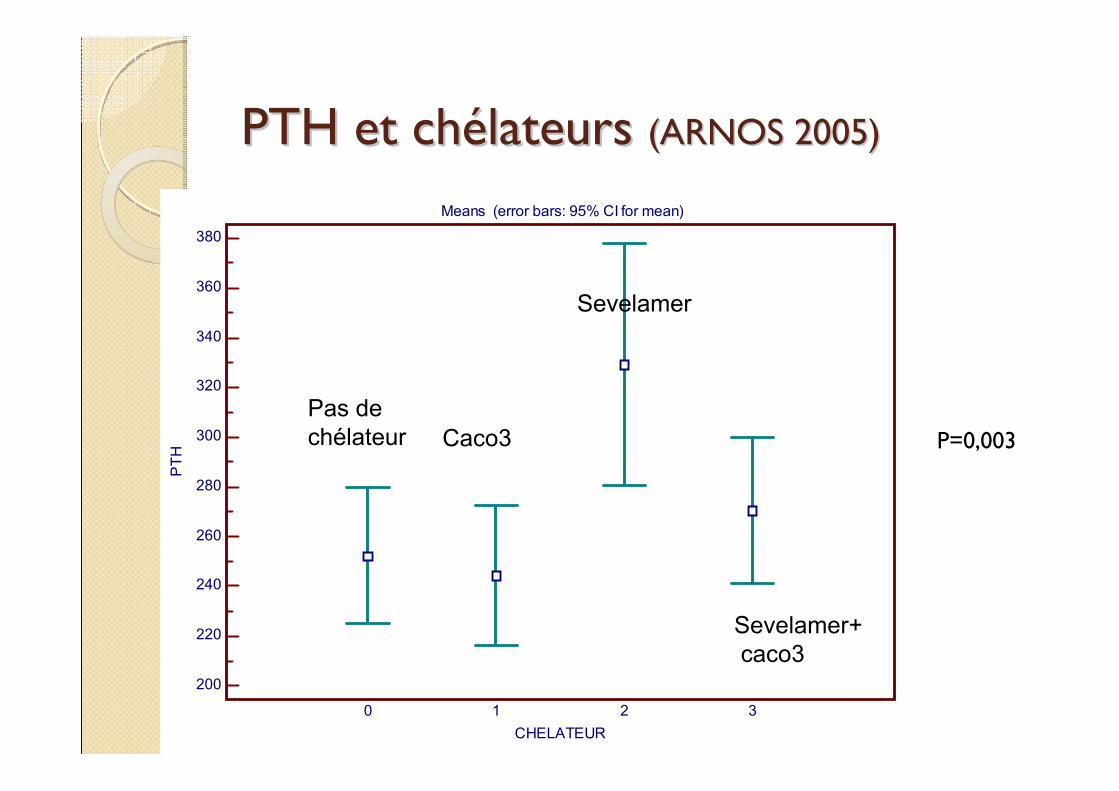
PTH et chPTH et chéélateurs lateurs (ARNOS 2005)(ARNOS 2005)
Means (error bars: 95% CI for mean)
380
360
340
320
300
280
260
240
220
200
CHELATEUR
PTH
0 1 2 3
P=0,003Pas de chélateur Caco3
Sevelamer
Sevelamer+caco3
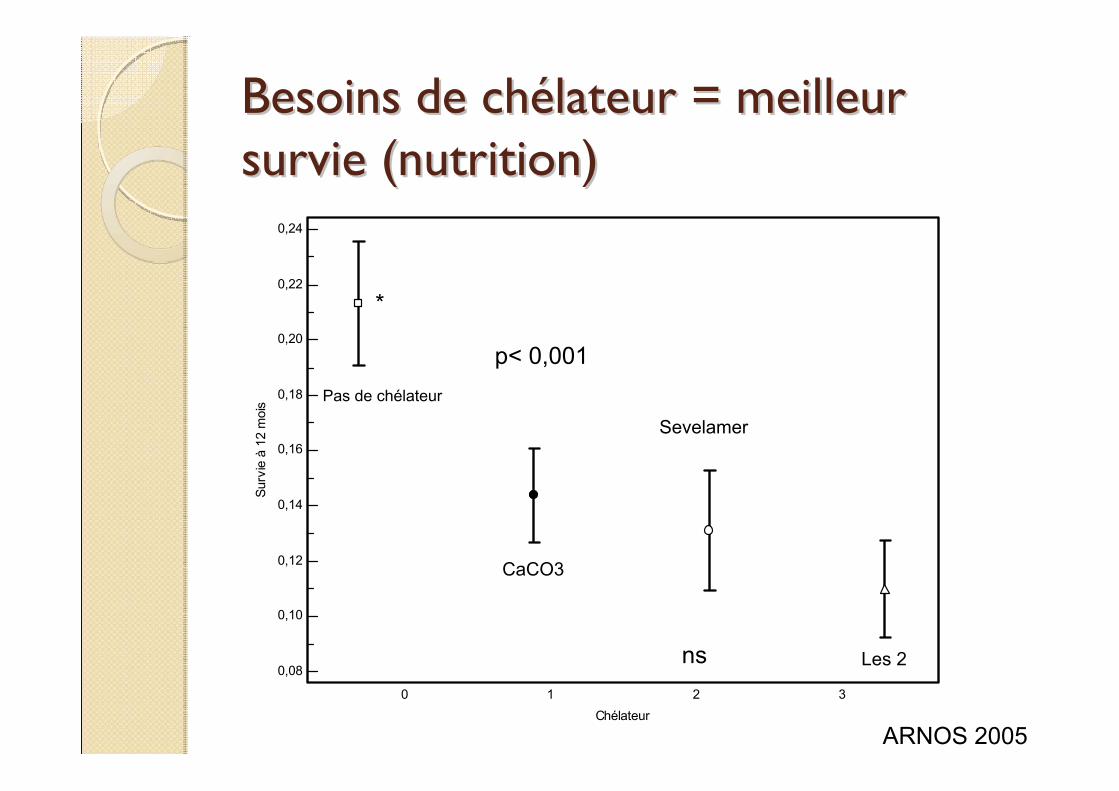
Besoins de chBesoins de chéélateur = meilleur lateur = meilleur survie (nutrition) survie (nutrition)
0,24
0,22
0,20
0,18
0,16
0,14
0,12
0,10
0,08
Chélateur
Surv
ie à
12
moi
s
0 1 2 3
Pas de chélateur
CaCO3
Sevelamer
Les 2
p< 0,001
ARNOS 2005
*
ns
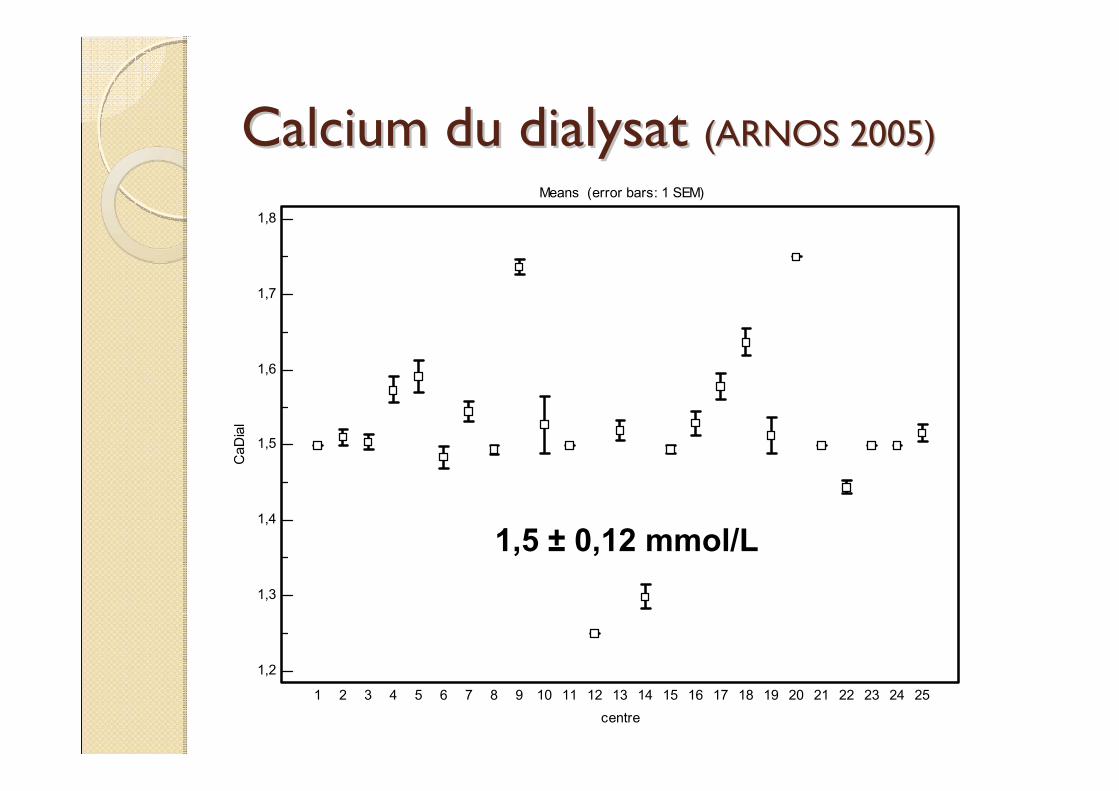
Calcium du dialysat Calcium du dialysat (ARNOS 2005)(ARNOS 2005) Means (error bars: 1 SEM)
1,8
1,7
1,6
1,5
1,4
1,3
1,2
centre
CaD
ial
1 2 3 4 5 6 7 8 9 10 11 12 13 14 15 16 17 18 19 20 21 22 23 24 25
1,5 ± 0,12 mmol/L
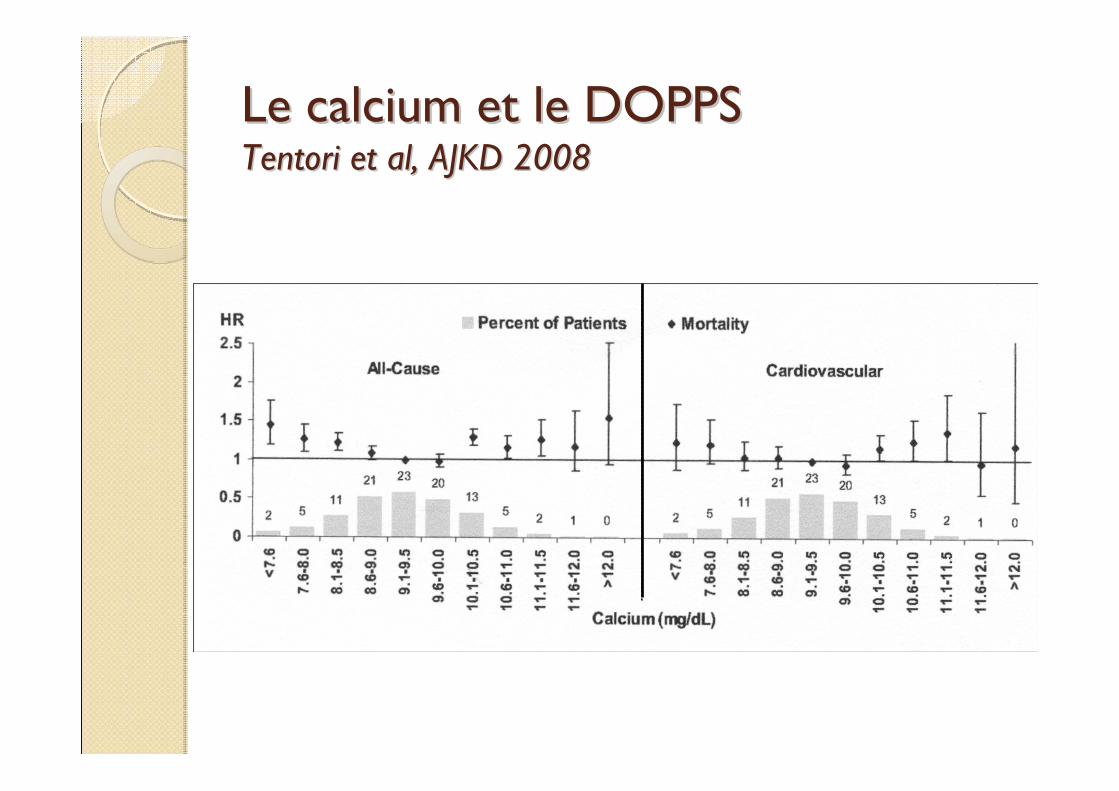
Le calcium et le DOPPS Le calcium et le DOPPS Tentori et al, AJKD 2008Tentori et al, AJKD 2008
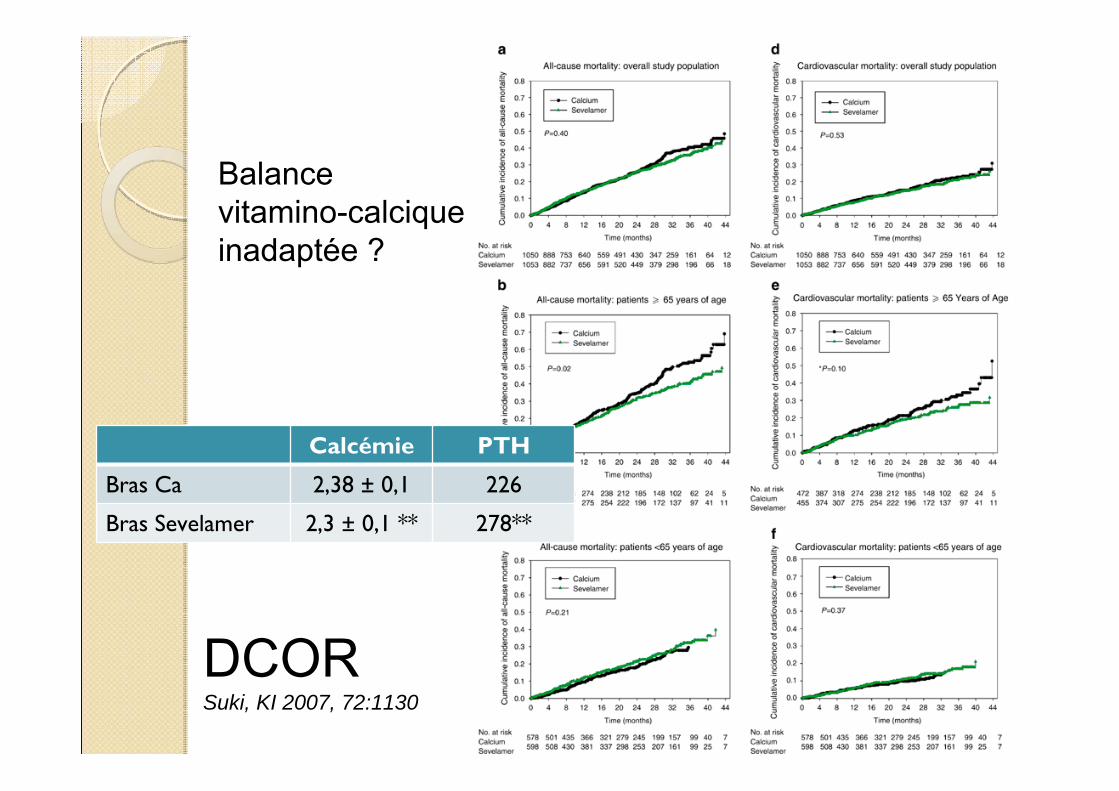
DCORSuki, KI 2007, 72:1130
Balance vitamino-calcique inadaptée ?
Calcémie PTH
Bras Ca 2,38 ± 0,1 226
Bras Sevelamer 2,3 ± 0,1 ** 278**
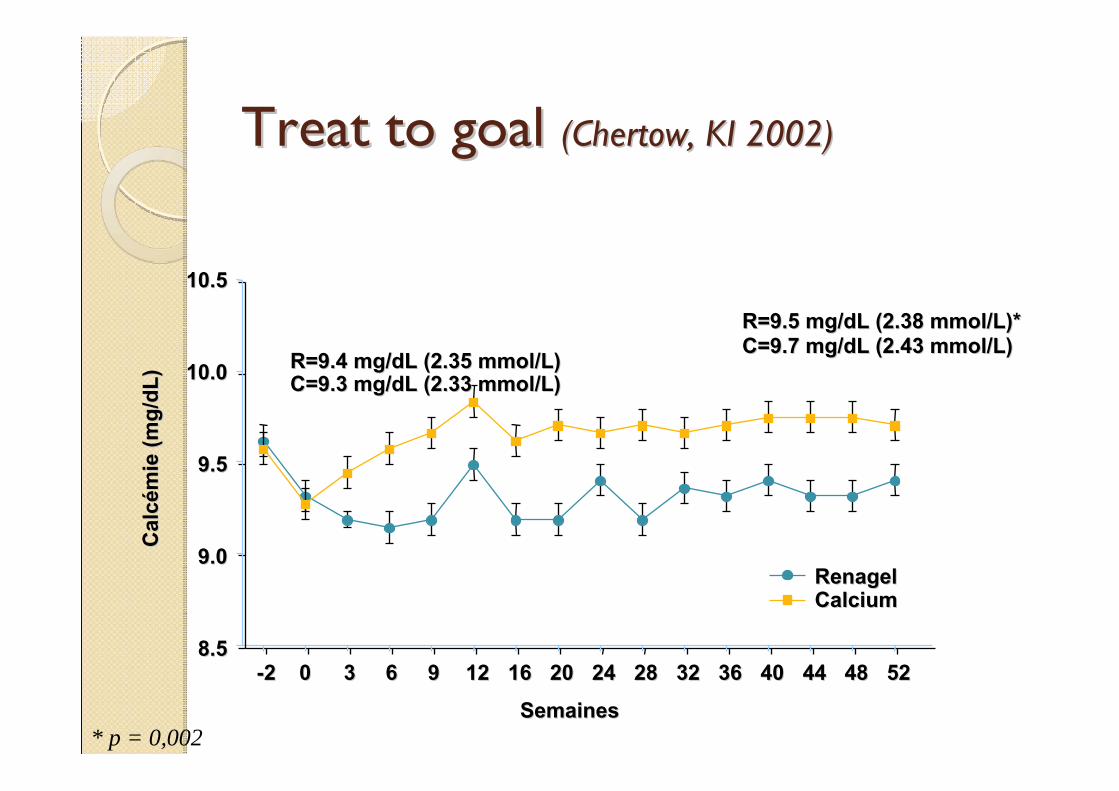
Treat to goal Treat to goal (Chertow, KI 2002)(Chertow, KI 2002)
SemainesSemaines--22 0 0 33 66 99 1212 1616 2020 2424 2828 3232 3636 4040 4444 4848 5252
Cal
cC
alc éé
mie
(mg/
dL)
mie
(mg/
dL)
10.510.5
10.010.0
9.59.5
9.09.0
8.58.5
R=9.5 mg/dL (2.38 mmol/L)*R=9.5 mg/dL (2.38 mmol/L)*C=9.7 mg/dL (2.43 mmol/L)C=9.7 mg/dL (2.43 mmol/L)
R=9.4 mg/dL (2.35 mmol/L)R=9.4 mg/dL (2.35 mmol/L)C=9.3 mg/dL (2.33 mmol/L)C=9.3 mg/dL (2.33 mmol/L)
Renagel Renagel Calcium Calcium
* p = 0,002
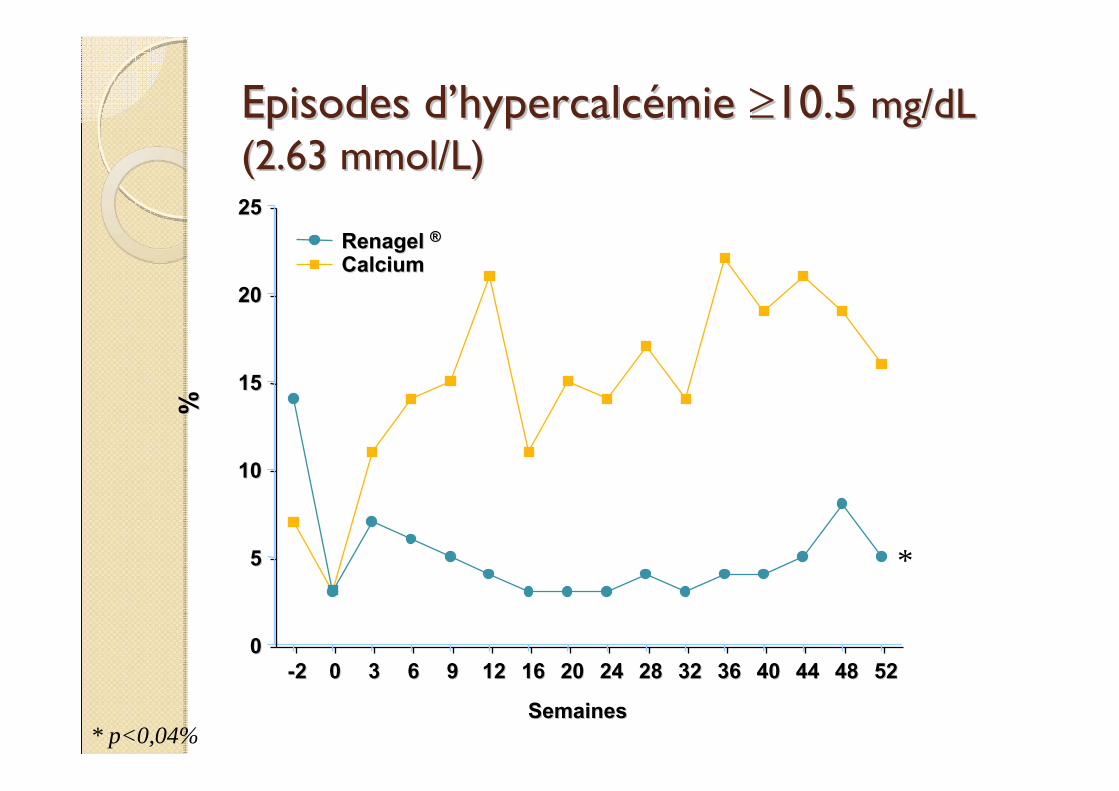
Episodes dEpisodes d’’hypercalchypercalcéémie mie ≥≥10.5 10.5 mg/dL mg/dL (2.63 mmol/L)(2.63 mmol/L)
%%
SemainesSemaines
--22 00 33 66 99 1212 1616 2020 2424 2828 3232 3636 4040 4444 4848 525200
55
1010
1515
2020
2525Renagel Renagel ®®Calcium Calcium
*
* p<0,04%
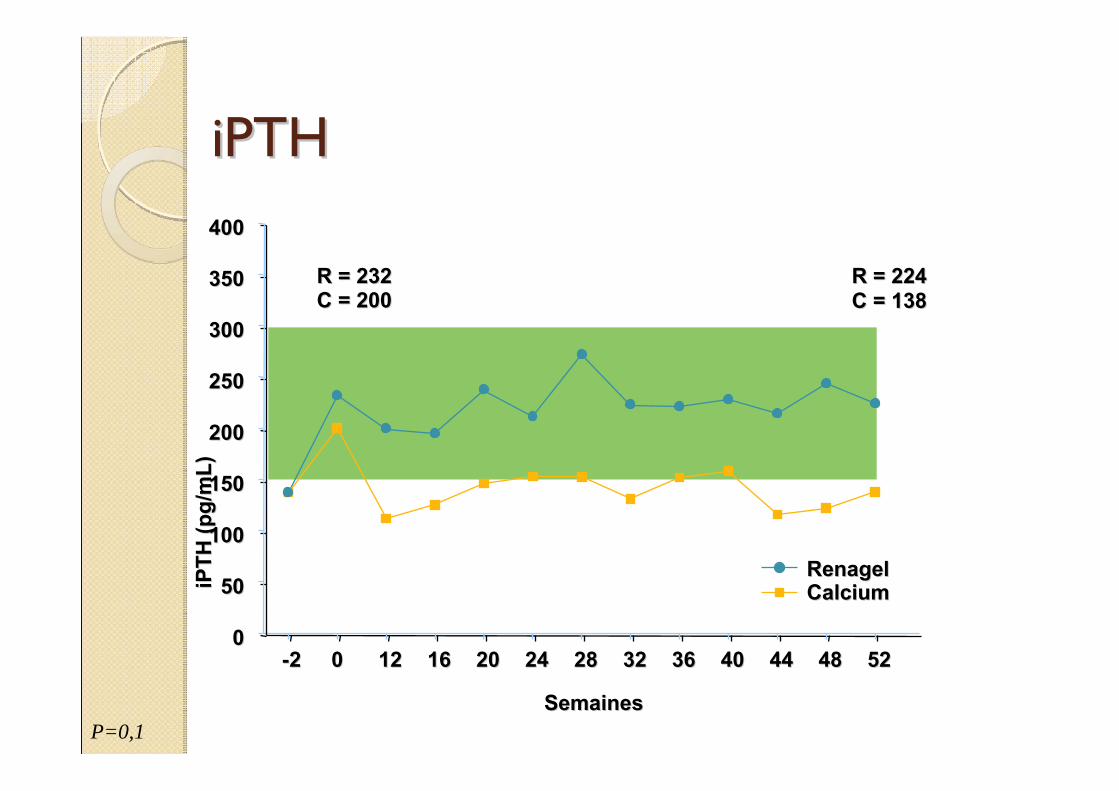
iPTHiPTH
SemainesSemaines
--22 0 0 1212 1616 2020 2424 2828 3232 3636 4040 4444 4848 5252
iPTH
(pg/
mL)
iPTH
(pg/
mL)
00
5050
100100
150150
200200
250250
300300
350350
400400
R = 232R = 232C = 200C = 200
R = 224R = 224C = 138C = 138
Renagel Renagel Calcium Calcium
P=0,1
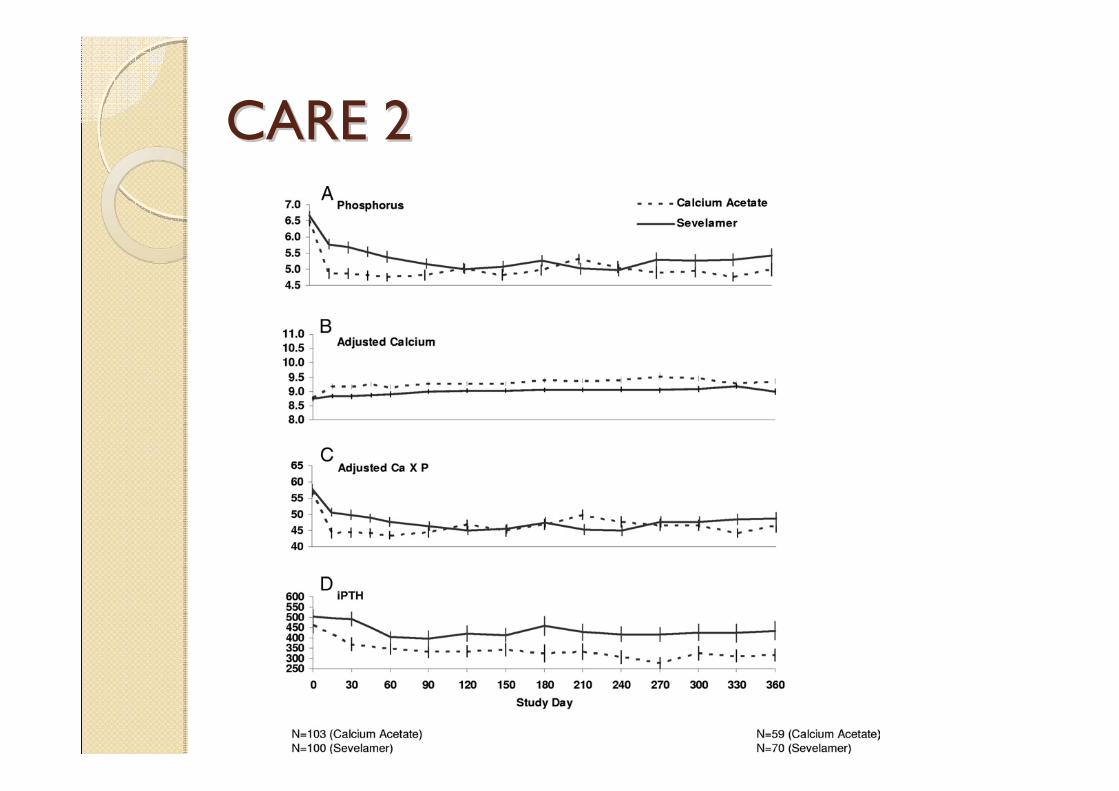
CARE 2 CARE 2
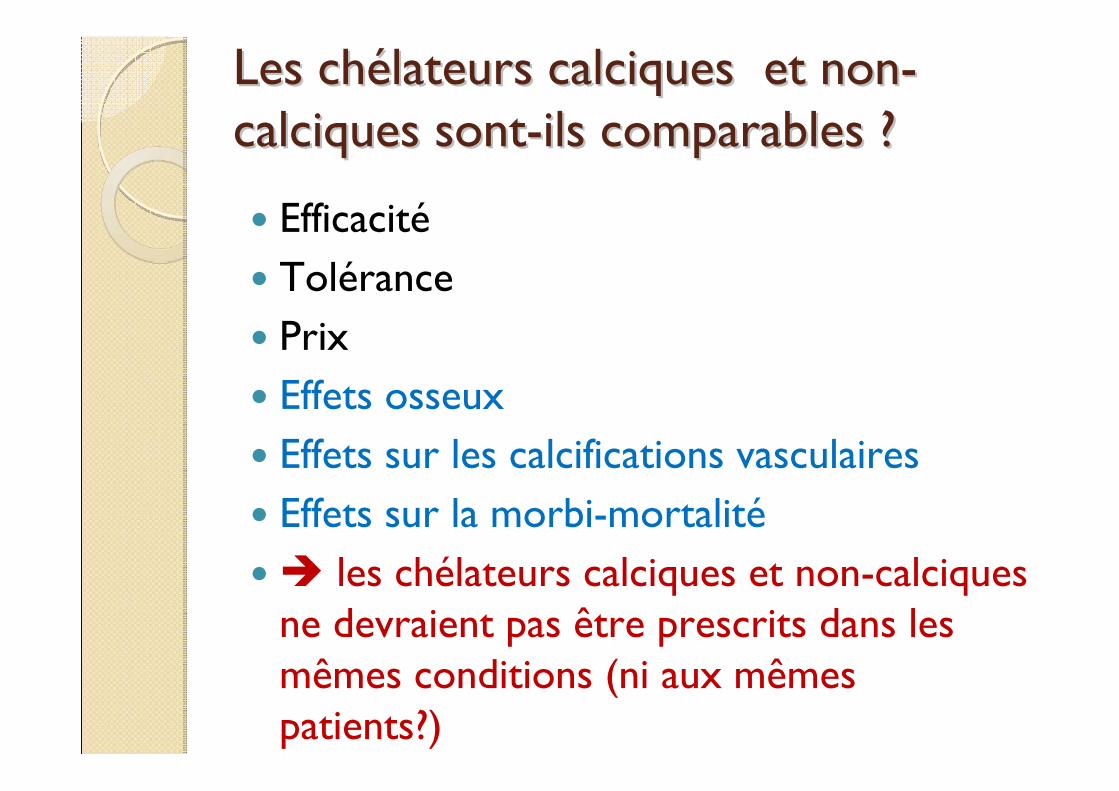
Les chLes chéélateurs calciques et nonlateurs calciques et non--calciques sontcalciques sont--ils comparables ?ils comparables ?
EfficacitéTolérancePrixEffets osseuxEffets sur les calcifications vasculairesEffets sur la morbi-mortalité
les chélateurs calciques et non-calciques ne devraient pas être prescrits dans les mêmes conditions (ni aux mêmes patients?)
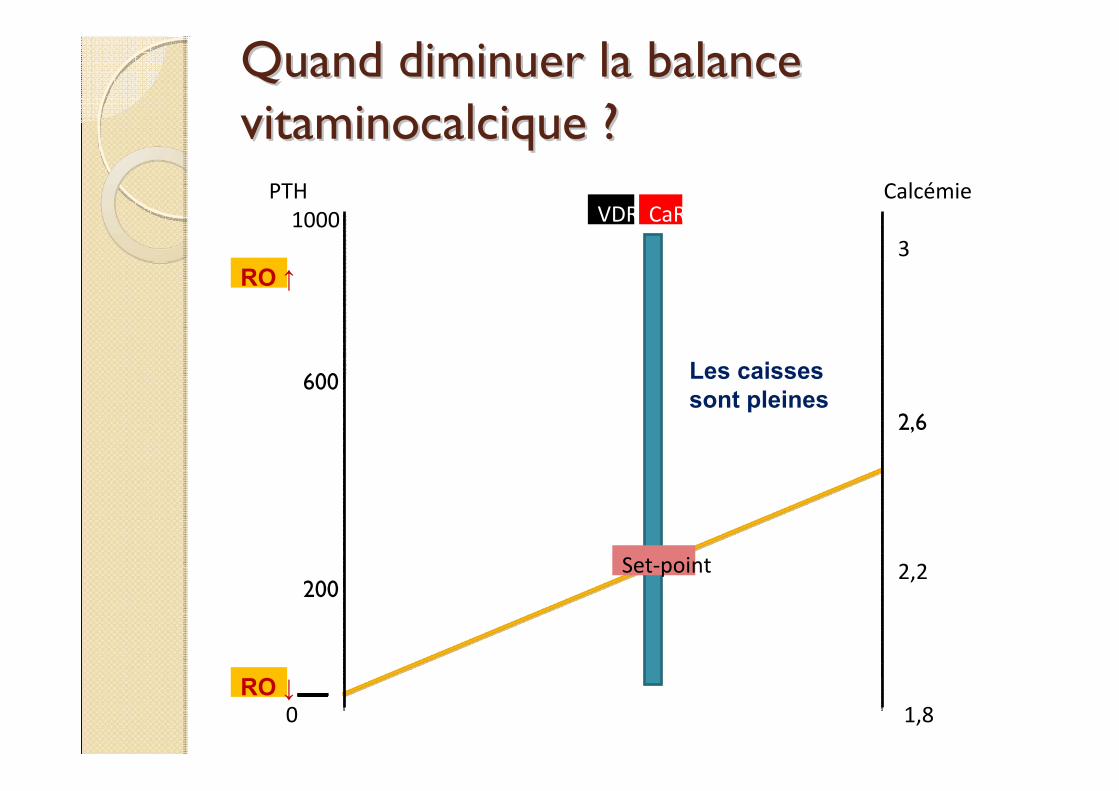
Quand diminuer la balance Quand diminuer la balance vitaminocalcique ?vitaminocalcique ?
Calcémie
1,8
Set‐point
CaRVDR
2,2
3
2,6
0
PTH1000
200
600
RO ↑
RO ↓
Les caisses sont pleines
Calcémie
1,8
Set‐point
CaRVDR
2,2
3
2,6
0
PTH1000
200
600
RO ↑
RO ↓
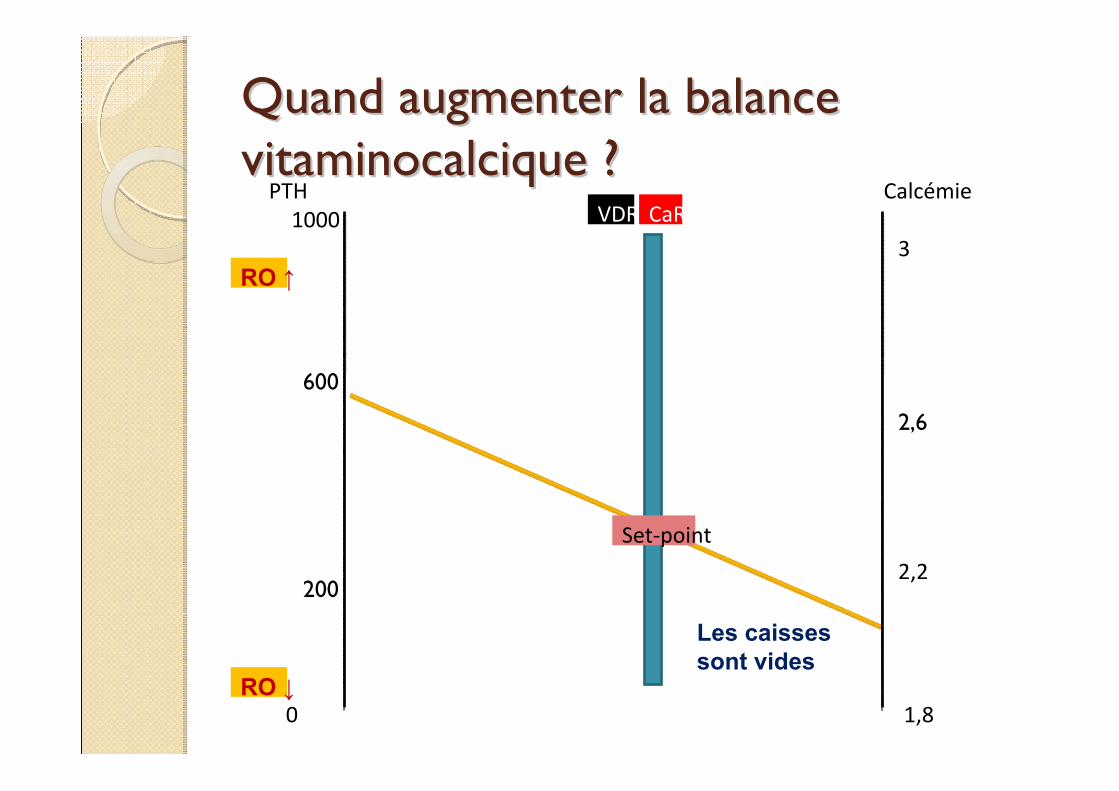
Quand augmenter la balance Quand augmenter la balance vitaminocalcique ?vitaminocalcique ?
Les caisses sont vides
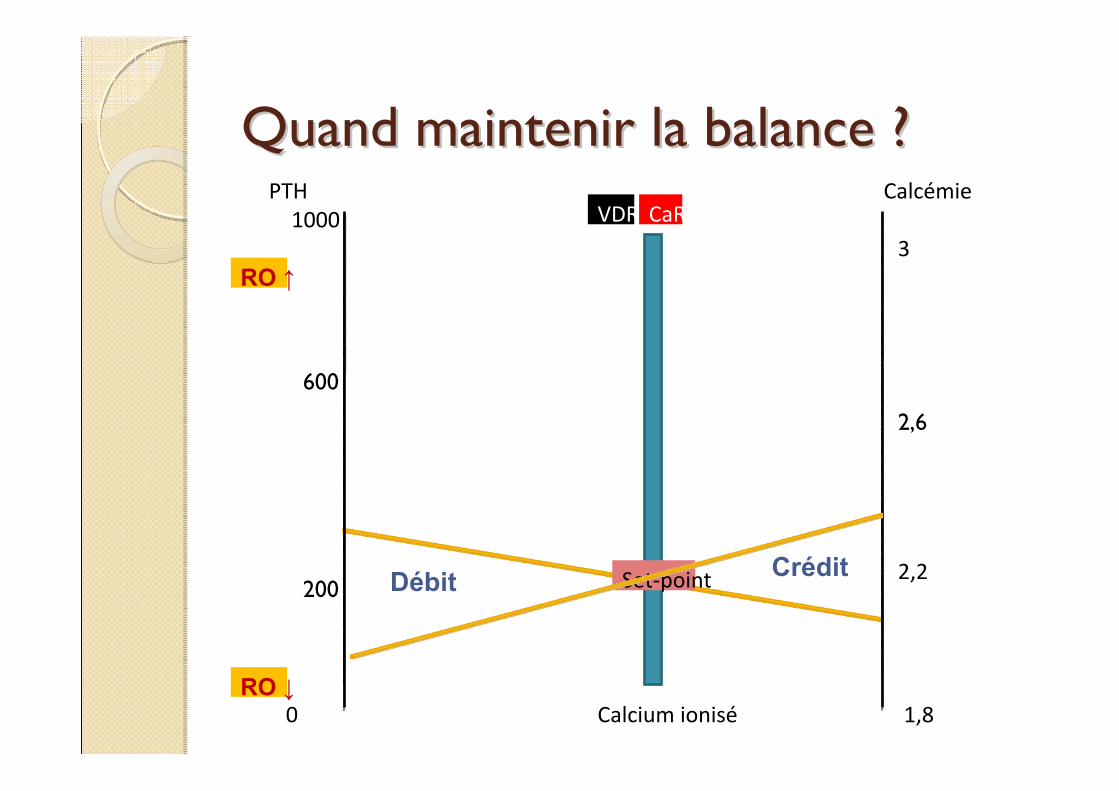
Calcémie
Calcium ionisé 1,8
Set‐point
CaRVDR
2,2
3
2,6
0
PTH1000
200
600
RO ↑
RO ↓
Quand maintenir la balance ?Quand maintenir la balance ?
CréditDébit
Calcémie
1,8
Set‐point
CaRVDR
2,2
3
2,6
0
PTH1000
200
600
RO ↑
RO ↓
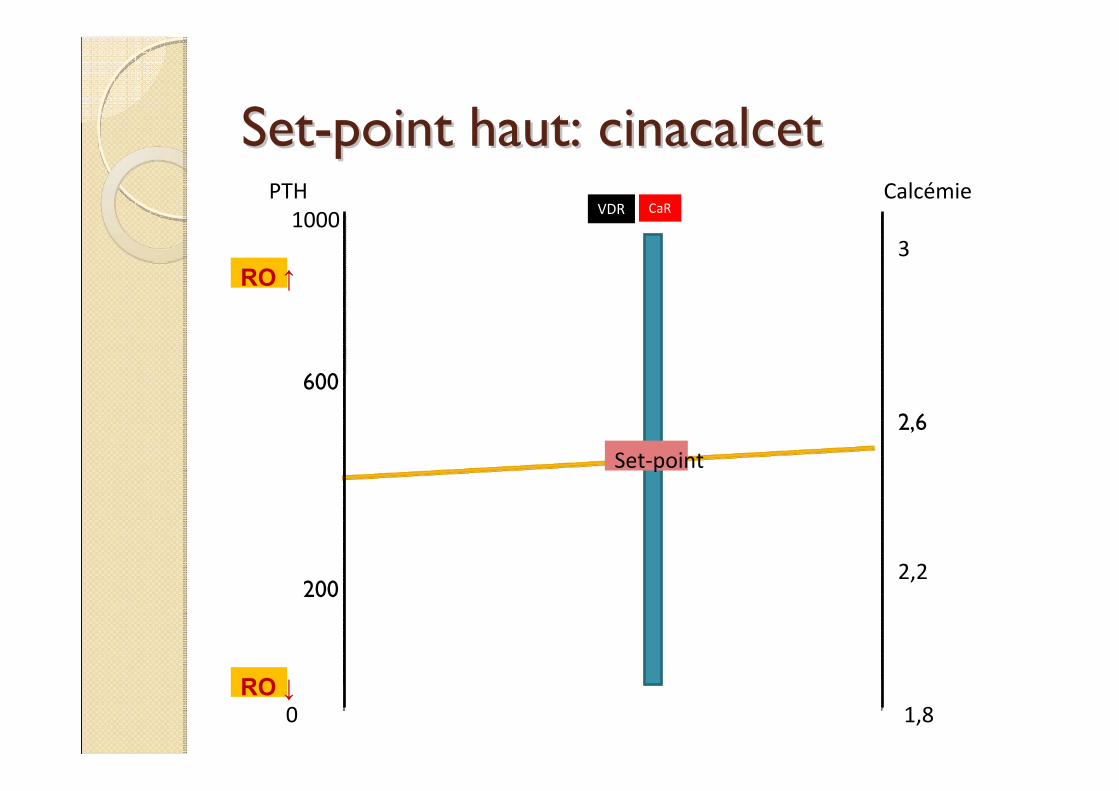
SetSet--point haut: cinacalcetpoint haut: cinacalcet
Calcémie
Calcium ionisé 1,8
Set‐point
2,2
3
2,6
0
PTH1000
200
600
RO ↑
RO ↓
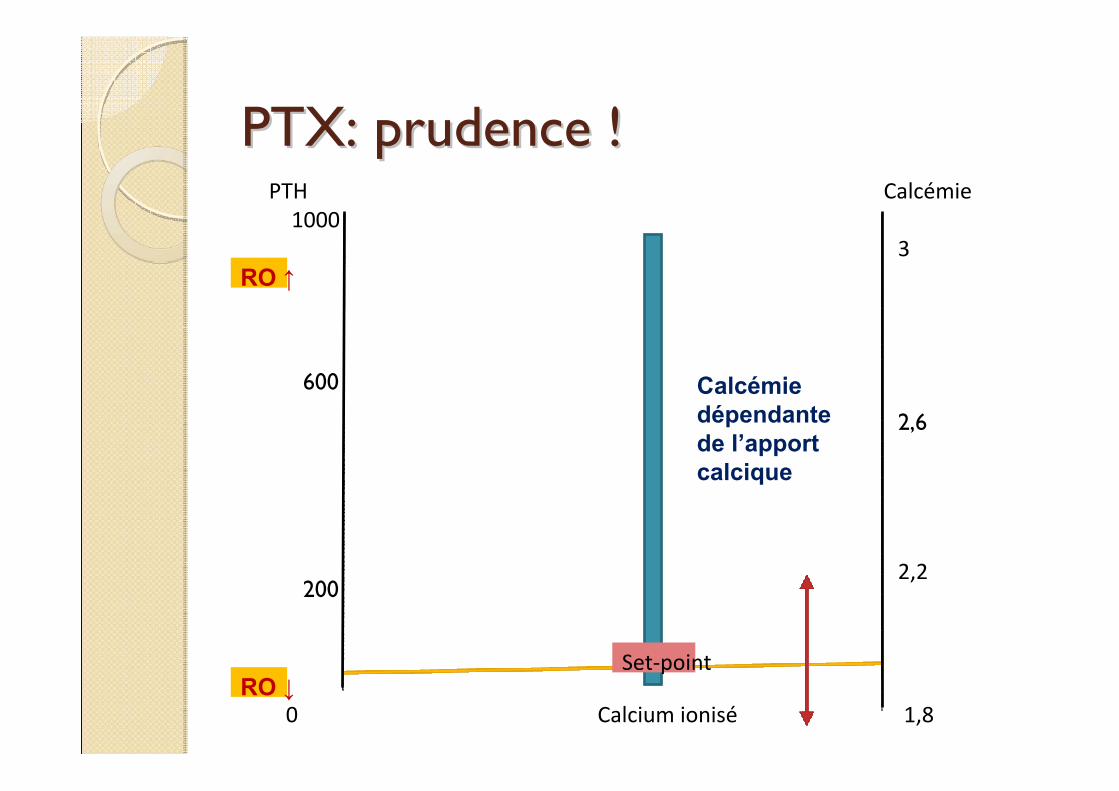
PTX: prudence !PTX: prudence !
Calcémie dépendante de l’apport calcique
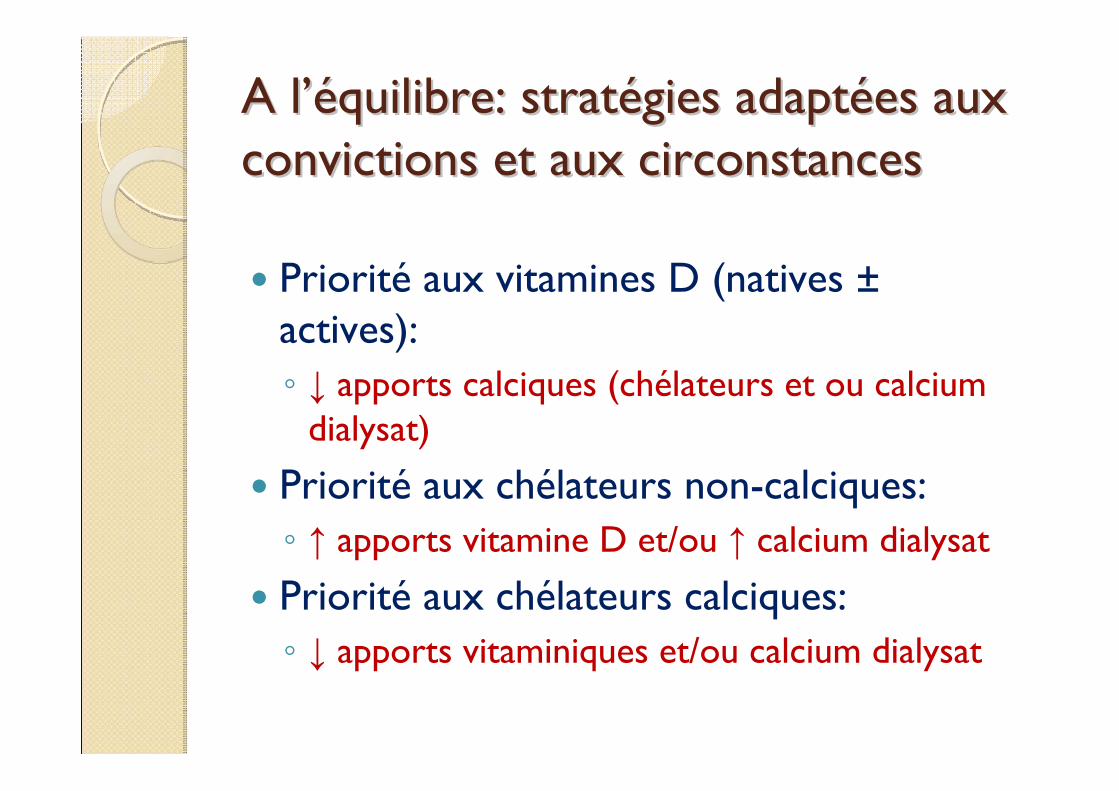
A lA l’é’équilibre: stratquilibre: stratéégies adaptgies adaptéées aux es aux convictions et aux circonstancesconvictions et aux circonstances
Priorité aux vitamines D (natives ±actives):◦ ↓ apports calciques (chélateurs et ou calcium
dialysat)
Priorité aux chélateurs non-calciques:◦ ↑ apports vitamine D et/ou ↑ calcium dialysat
Priorité aux chélateurs calciques:◦ ↓ apports vitaminiques et/ou calcium dialysat
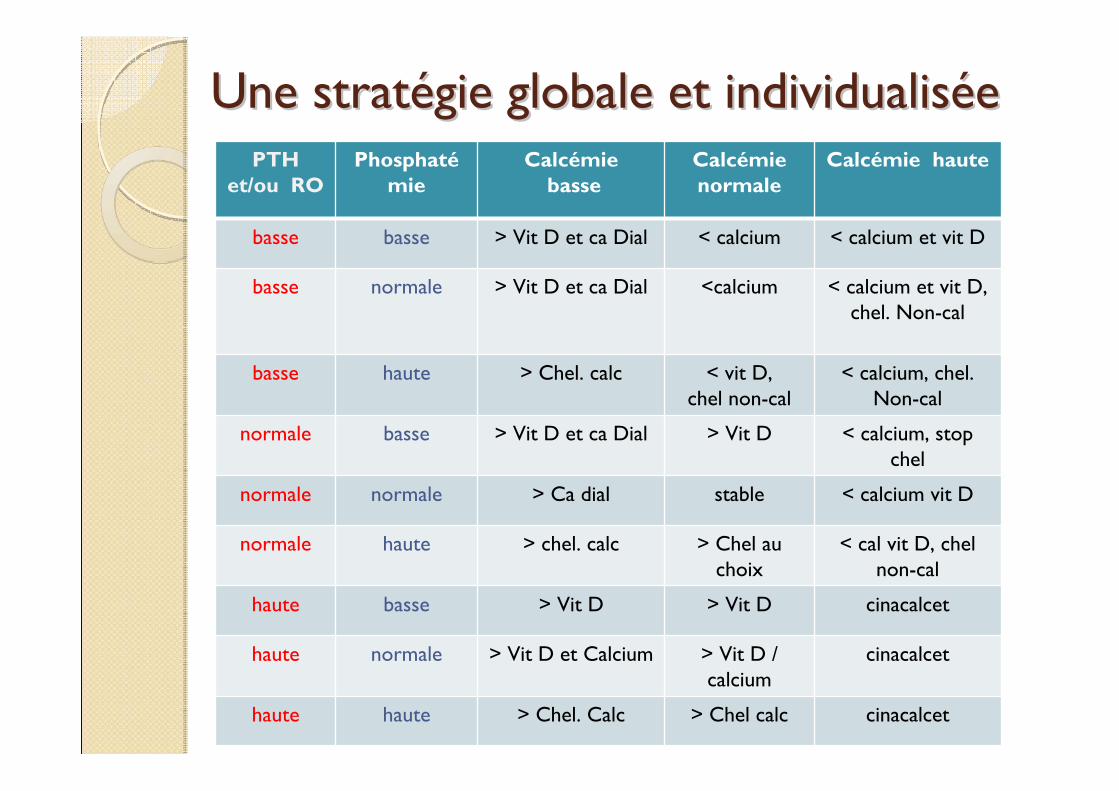
Une stratUne stratéégie globale et individualisgie globale et individualisééeePTH
et/ou ROPhosphaté
mieCalcémie
basseCalcémienormale
Calcémie haute
basse basse > Vit D et ca Dial < calcium < calcium et vit D
basse normale > Vit D et ca Dial <calcium < calcium et vit D, chel. Non-cal
basse haute > Chel. calc < vit D, chel non-cal
< calcium, chel. Non-cal
normale basse > Vit D et ca Dial > Vit D < calcium, stop chel
normale normale > Ca dial stable < calcium vit D
normale haute > chel. calc > Chel au choix
< cal vit D, chel non-cal
haute basse > Vit D > Vit D cinacalcet
haute normale > Vit D et Calcium > Vit D / calcium
cinacalcet
haute haute > Chel. Calc > Chel calc cinacalcet
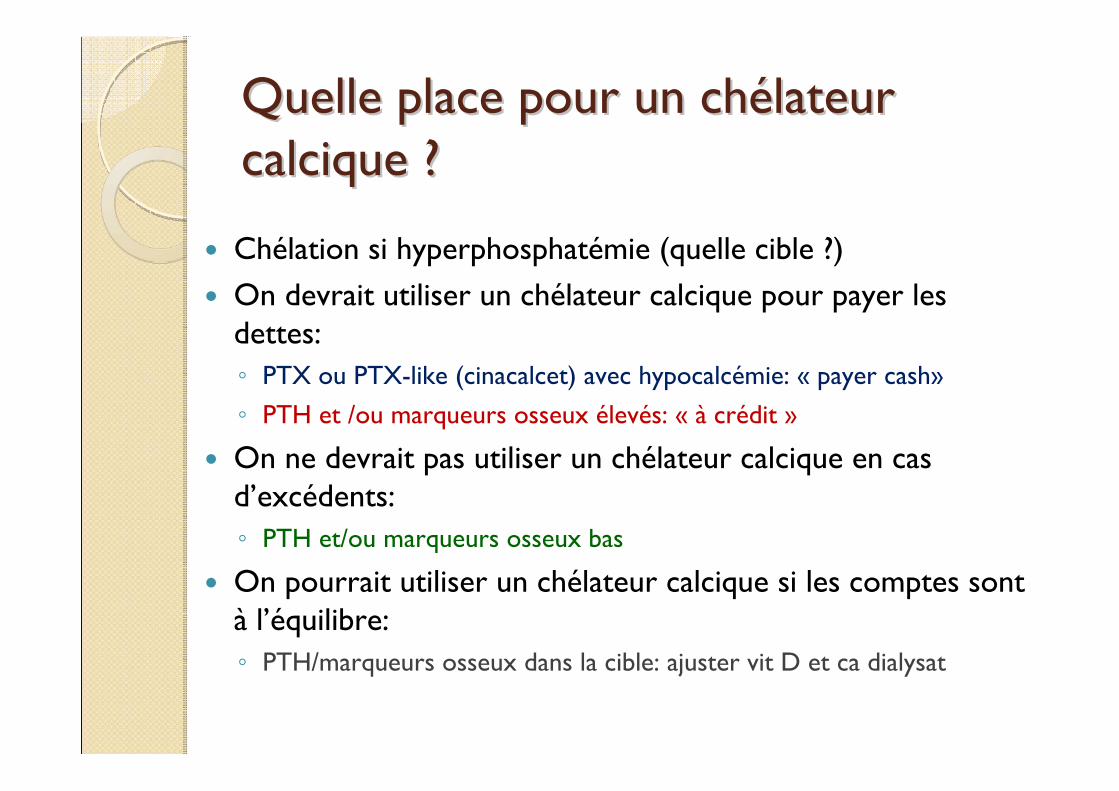
Quelle place pour un chQuelle place pour un chéélateur lateur calcique ?calcique ?
Chélation si hyperphosphatémie (quelle cible ?)On devrait utiliser un chélateur calcique pour payer les dettes:◦ PTX ou PTX-like (cinacalcet) avec hypocalcémie: « payer cash»◦ PTH et /ou marqueurs osseux élevés: « à crédit »
On ne devrait pas utiliser un chélateur calcique en cas d’excédents: ◦ PTH et/ou marqueurs osseux bas
On pourrait utiliser un chélateur calcique si les comptes sont à l’équilibre:◦ PTH/marqueurs osseux dans la cible: ajuster vit D et ca dialysat
ConclusionConclusion
Le métabolisme minéral et osseux est probablement associé à la morbi-mortalité des dialysés.L’optimisation des pratiques doit viser à la normalisation des paramètres intermédiaires (PTH, PAL, calcémie, phosphatémie/mois)
effet bénéfique sur la morbi-mortalité ?◦ Fractures◦ Calcifications vasculaires◦ Mortalité cardio-vasculaire
Conclusion 2Conclusion 2La balance vitamino-calcique apparente doit être mesurée et individualisée (dettes ou excédents)Cette gestion demande du temps, de l’attention, une (des) stratégieL’arsenal thérapeutique actuel et à venir doit nous permettre de définir des stratégies adaptées:◦ (calcium dialysat, chélateurs calciques et non
calciques, vitamines D, calcimimétiques…stratégie de dialyse, bisphosphonates…)
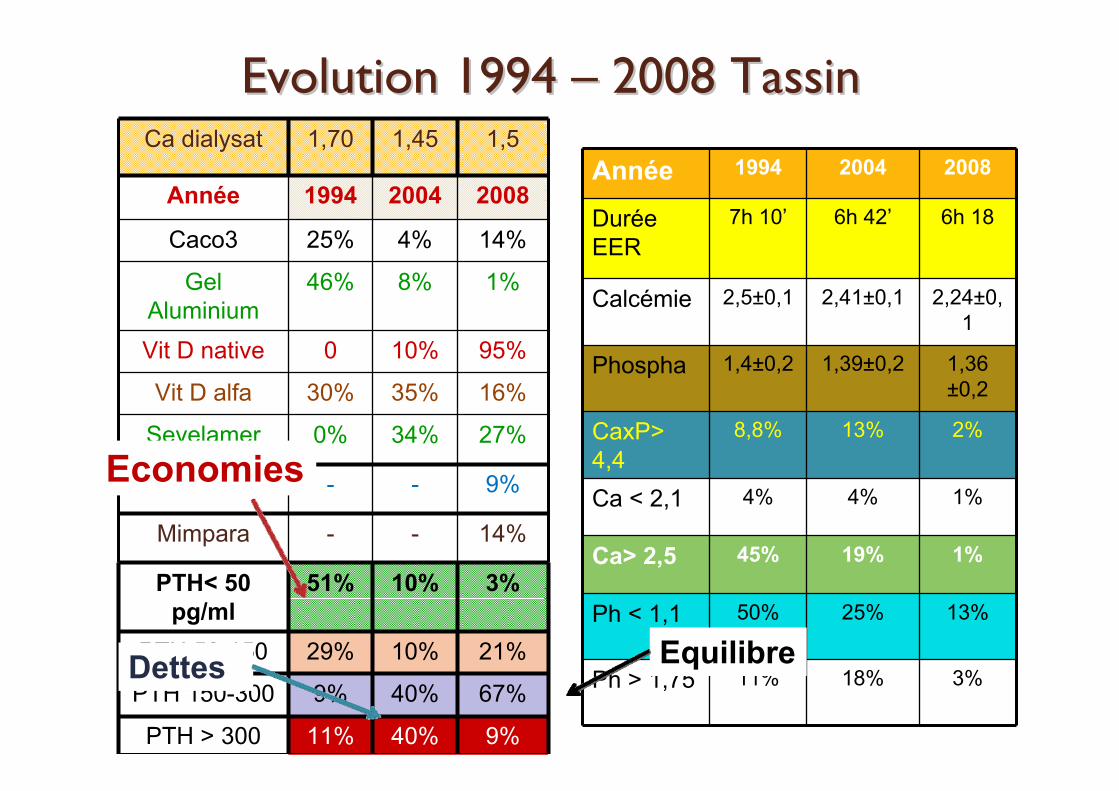
Evolution 1994 Evolution 1994 –– 2008 Tassin2008 TassinCa dialysat 1,70 1,45 1,5
Année 1994 2004 2008
Caco3 25% 4% 14%
Gel Aluminium
46% 8% 1%
Vit D native 0 10% 95%
Vit D alfa 30% 35% 16%
Sevelamer 0% 34% 27%
FosRenol - - 9%
Mimpara - - 14%
PTH< 50 pg/ml
51% 10% 3%
PTH 50-150 29% 10% 21%
PTH 150-300 9% 40% 67%
PTH > 300 11% 40% 9%
Année 1994 2004 2008
Durée EER
7h 10’ 6h 42’ 6h 18
Calcémie 2,5±0,1 2,41±0,1 2,24±0,1
Phospha 1,4±0,2 1,39±0,2 1,36 ±0,2
CaxP> 4,4
8,8% 13% 2%
Ca < 2,1 4% 4% 1%
Ca> 2,5 45% 19% 1%
Ph < 1,1 50% 25% 13%
Ph > 1,75 11% 18% 3%
Economies
Dettes Equilibre
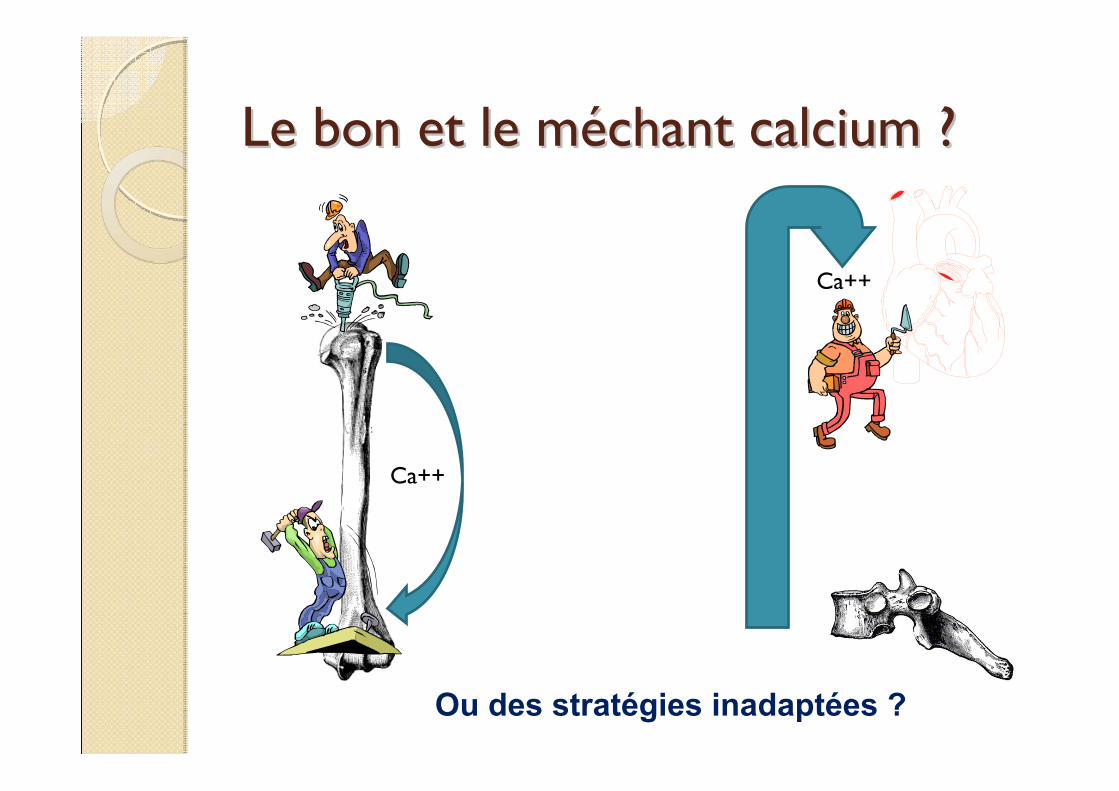
Le bon et le mLe bon et le mééchant calcium ?chant calcium ?
Ca++
Ca++
Ou des stratégies inadaptées ?
Quelques rQuelques rééfféérencesrences
Physiologie de la chélation calcique des phosphates
Philippe RieuService de Néphrologie-Transplantation
CNRS UMR 6198
CHU Reims
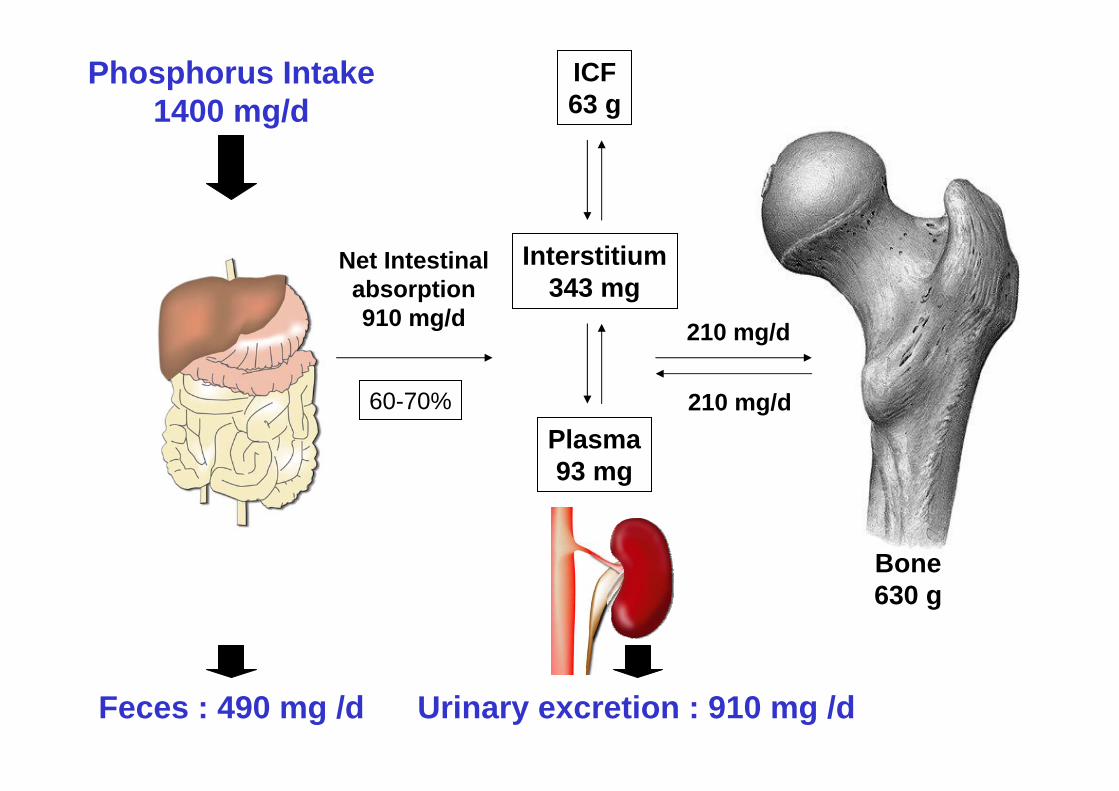
Phosphorus Intake1400 mg/d
Net Intestinalabsorption910 mg/d
Bone630 g
Plasma93 mg
Interstitium343 mg
210 mg/d
210 mg/d
ICF63 g
Feces : 490 mg /d Urinary excretion : 910 mg /d
60-70%
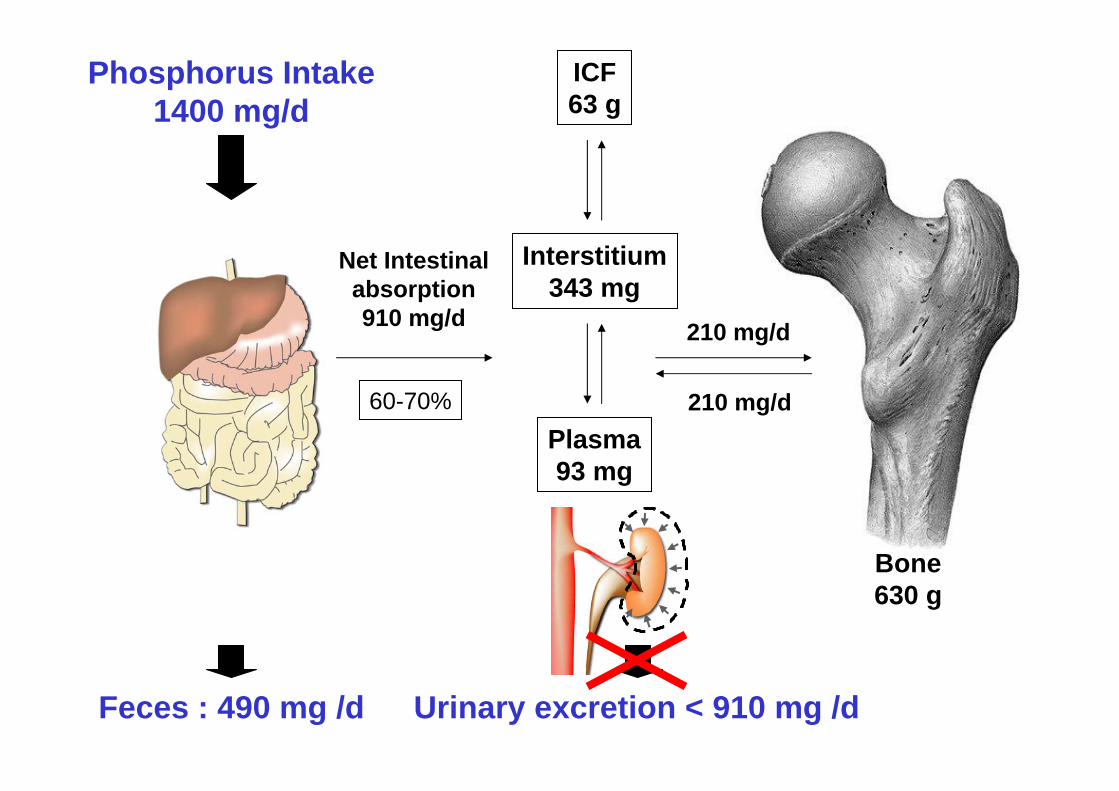
Phosphorus Intake1400 mg/d
Feces : 490 mg /d Urinary excretion < 910 mg /d
Net Intestinalabsorption910 mg/d
Bone630 g
Plasma93 mg
Interstitium343 mg
210 mg/d
210 mg/d
ICF63 g
60-70%
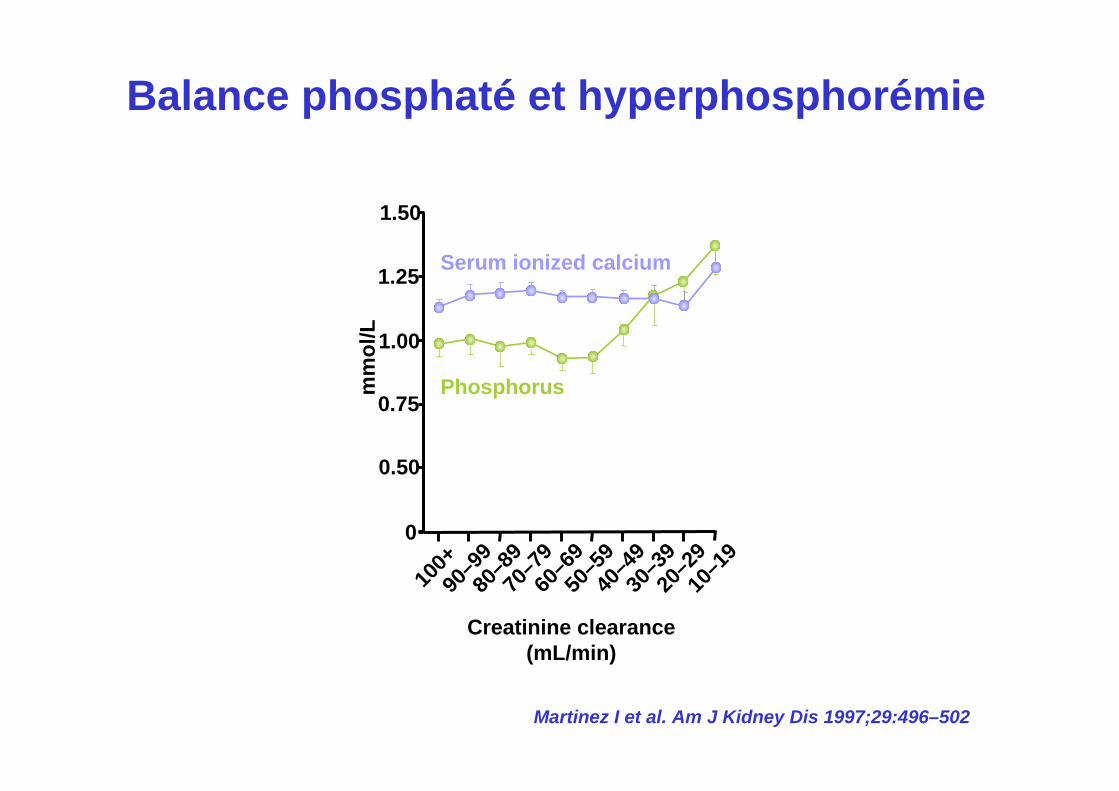
Balance phosphaté et hyperphosphorémie
Martinez I et al. Am J Kidney Dis 1997;29:496–502
0
100+
90–9
980
–89
70–7
960
–69
50–5
940
–49
30–3
920
–29
10–1
9m
mol
/L
Creatinine clearance (mL/min)
0.75
1.00
1.25
1.50
Serum ionized calcium
Phosphorus
0.50
1. Absorption intestinale des phosphates
2. Chélation calcique des phosphates
3. Absorption intestinale du calcium
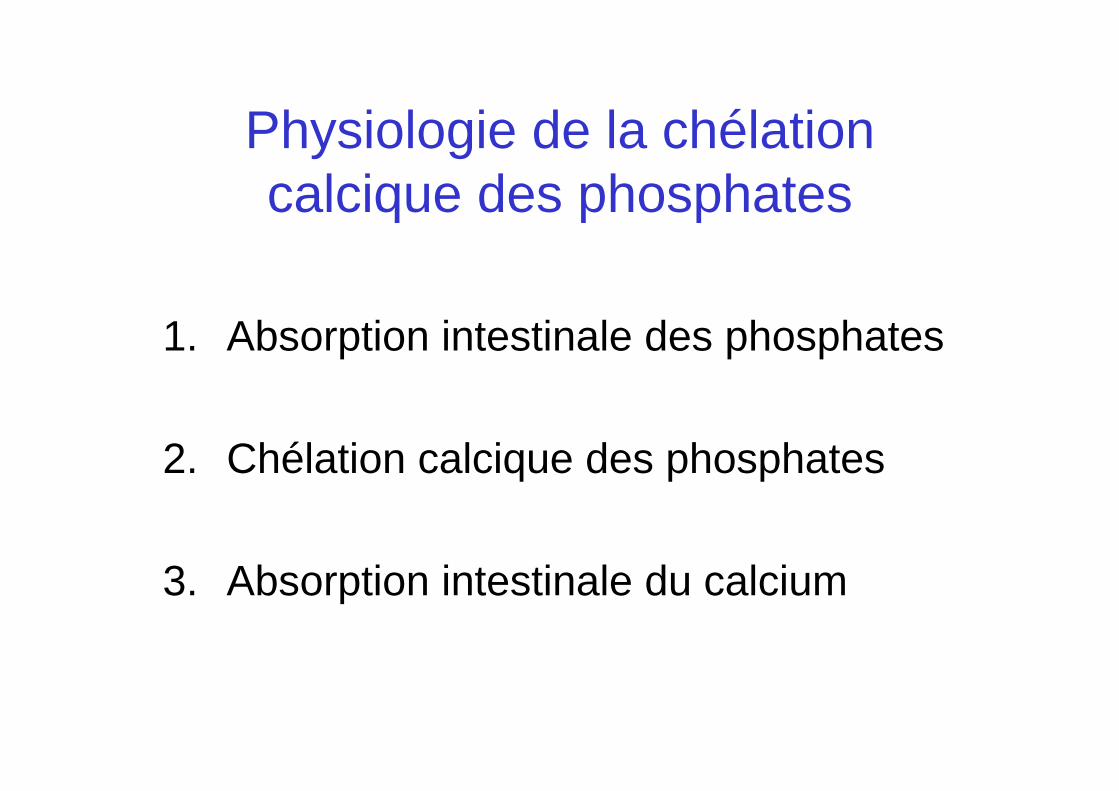
Physiologie de la chélation calcique des phosphates
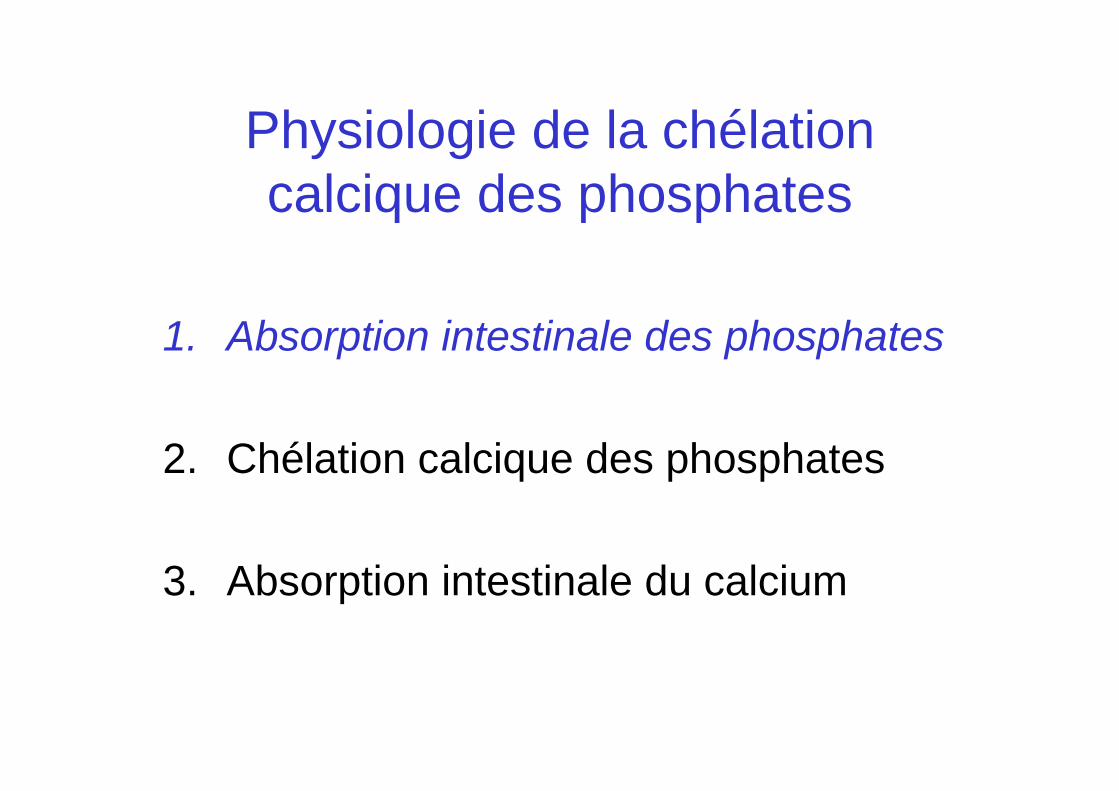
1. Absorption intestinale des phosphates
2. Chélation calcique des phosphates
3. Absorption intestinale du calcium
Physiologie de la chélation calcique des phosphates
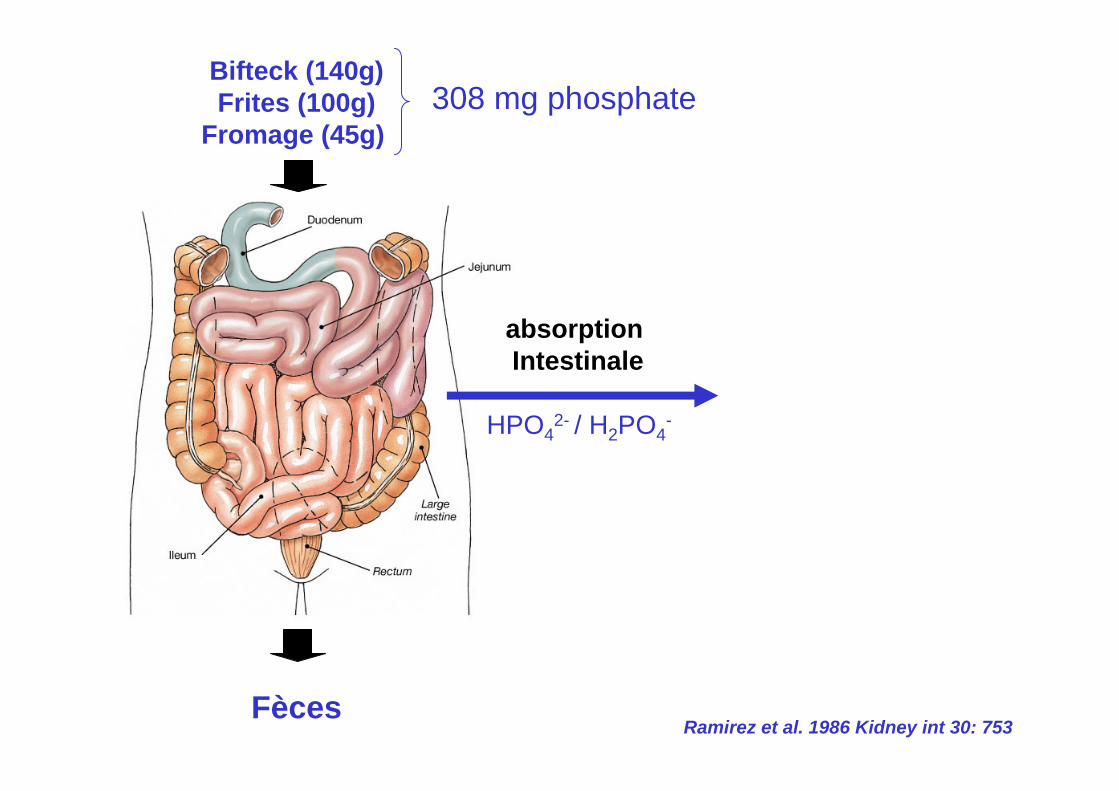
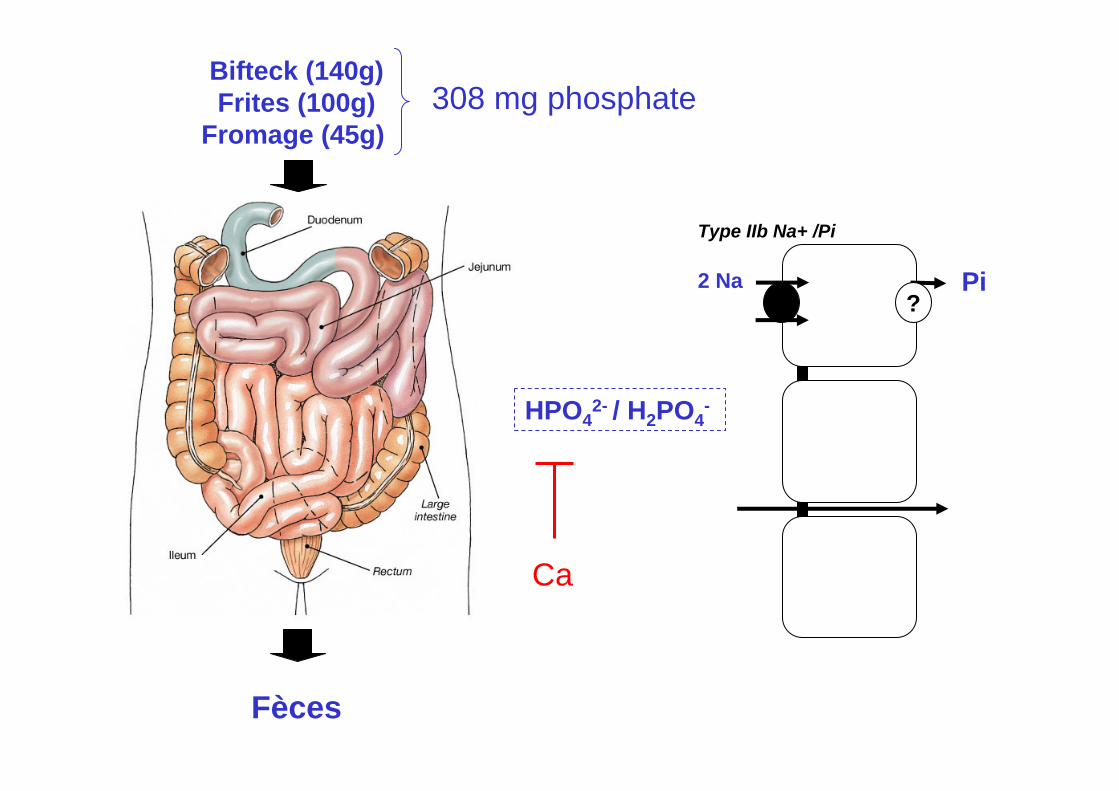
HPO42- / H2PO4
-
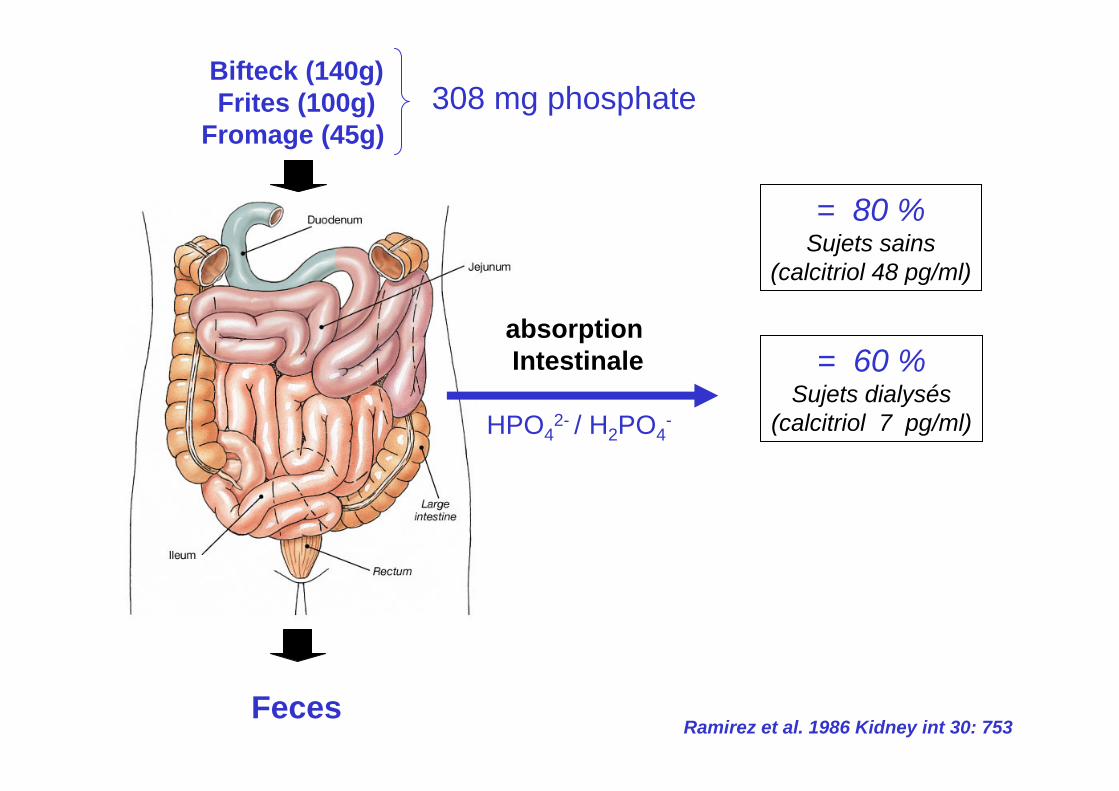
absorption Intestinale
Bifteck (140g)Frites (100g)
Fromage (45g)
Fèces
308 mg phosphate
Ramirez et al. 1986 Kidney int 30: 753
Bifteck (140g)Frites (100g)
Fromage (45g)
Fèces
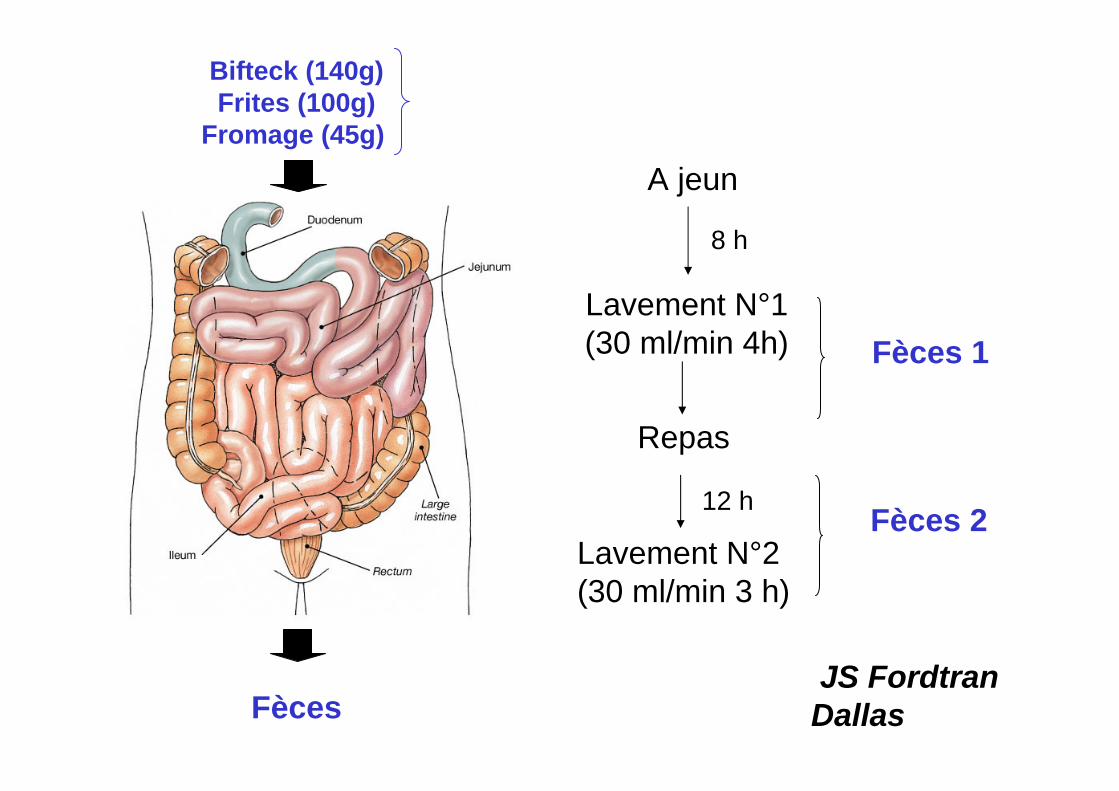
A jeun
Lavement N°1(30 ml/min 4h)
Repas
Lavement N°2(30 ml/min 3 h)
8 h
12 h
Fèces 1
Fèces 2
JS FordtranDallas
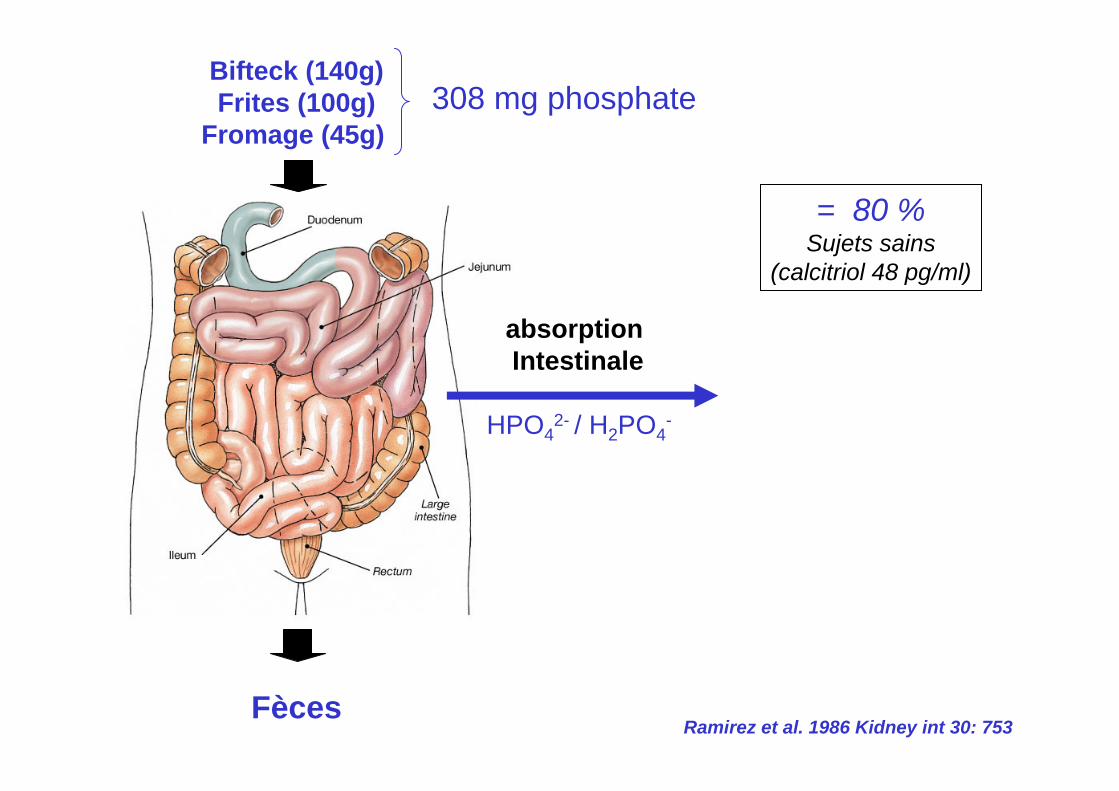
HPO42- / H2PO4
-
absorption Intestinale
Bifteck (140g)Frites (100g)
Fromage (45g)
Fèces
= 80 %Sujets sains
(calcitriol 48 pg/ml)
308 mg phosphate
Ramirez et al. 1986 Kidney int 30: 753
HPO42- / H2PO4
-
absorption Intestinale
Bifteck (140g)Frites (100g)
Fromage (45g)
Feces
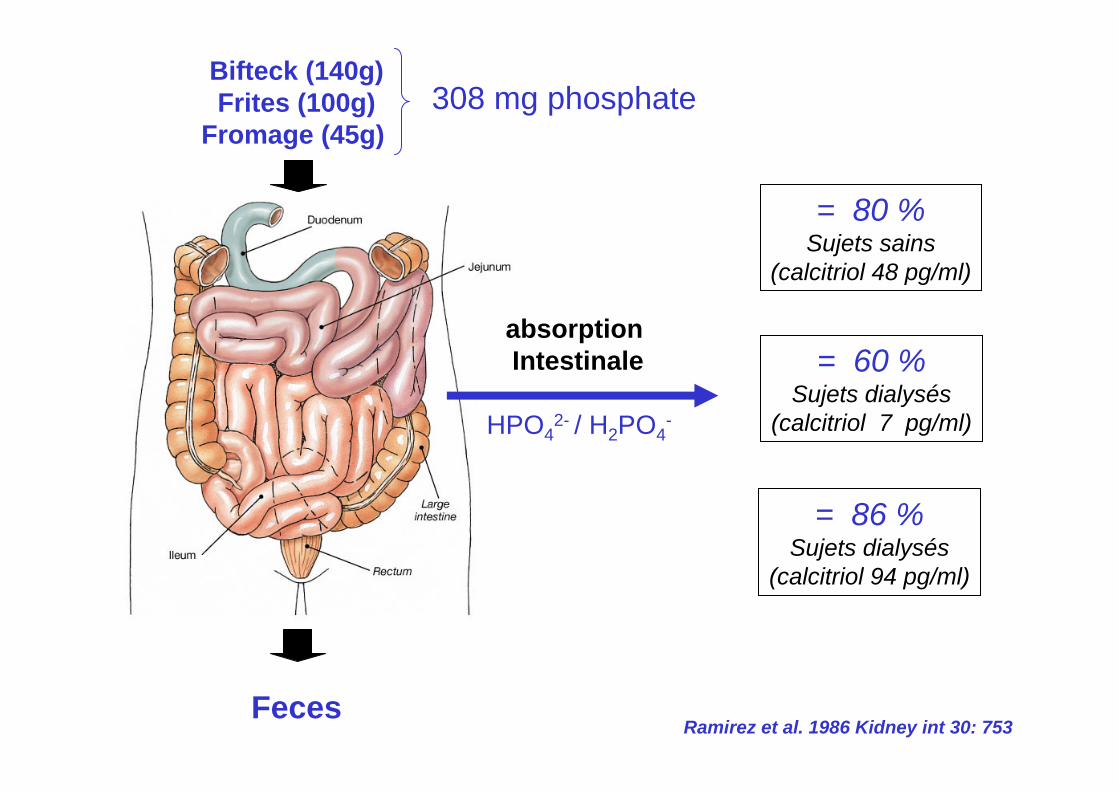
= 80 %Sujets sains
(calcitriol 48 pg/ml)
308 mg phosphate
= 60 %Sujets dialysés
(calcitriol 7 pg/ml)
Ramirez et al. 1986 Kidney int 30: 753
HPO42- / H2PO4
-
absorption Intestinale
Bifteck (140g)Frites (100g)
Fromage (45g)
Feces
= 80 %Sujets sains
(calcitriol 48 pg/ml)
308 mg phosphate
= 60 %Sujets dialysés
(calcitriol 7 pg/ml)
= 86 %Sujets dialysés
(calcitriol 94 pg/ml)
Ramirez et al. 1986 Kidney int 30: 753
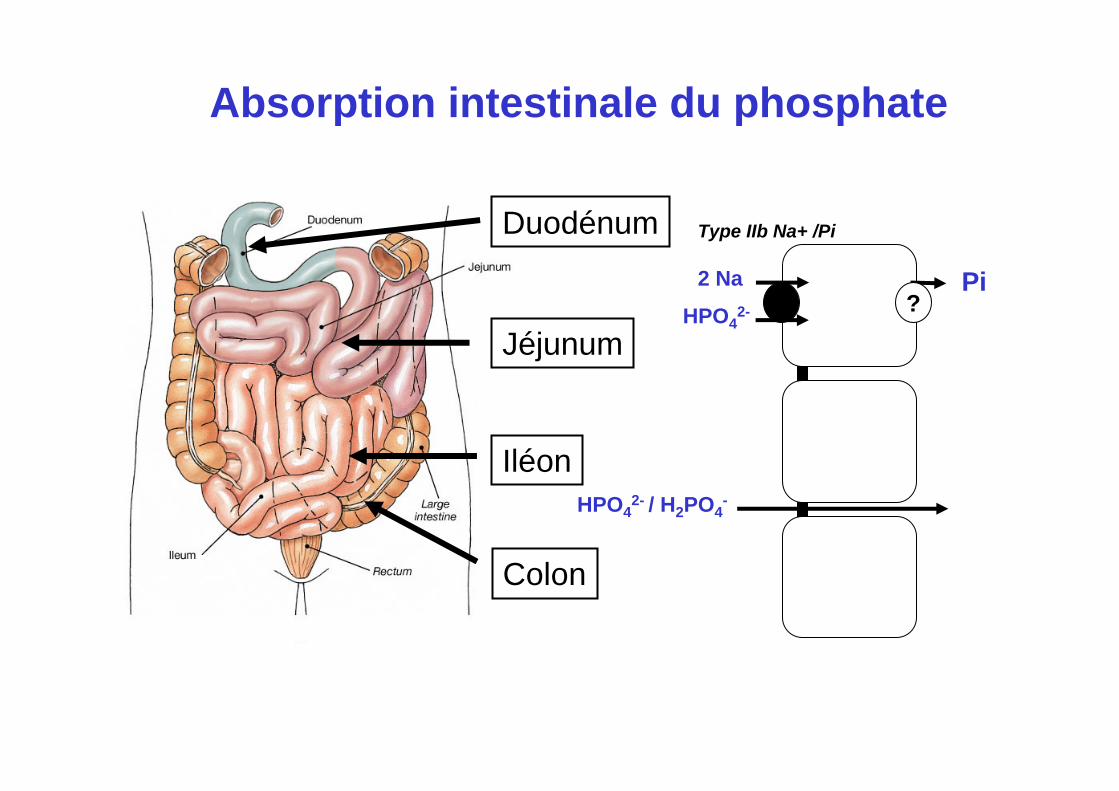
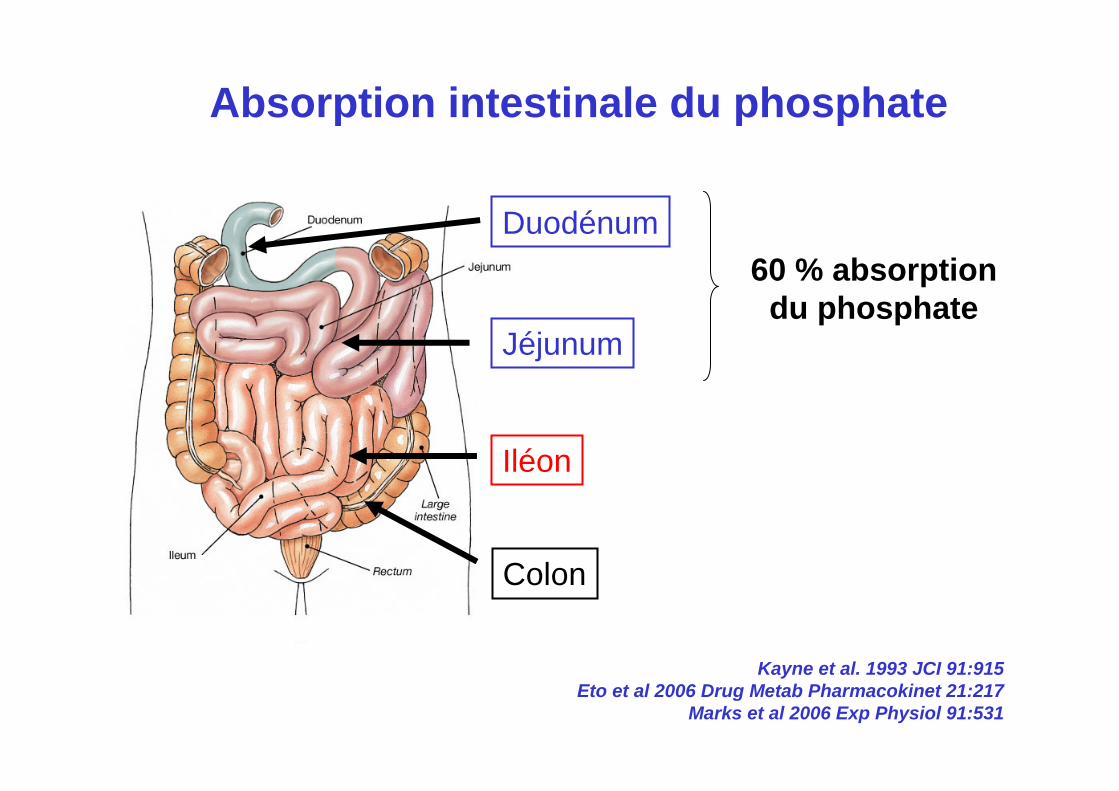
Duodénum
Jéjunum
Iléon
Colon
2 Na?
Pi
Type IIb Na+ /Pi
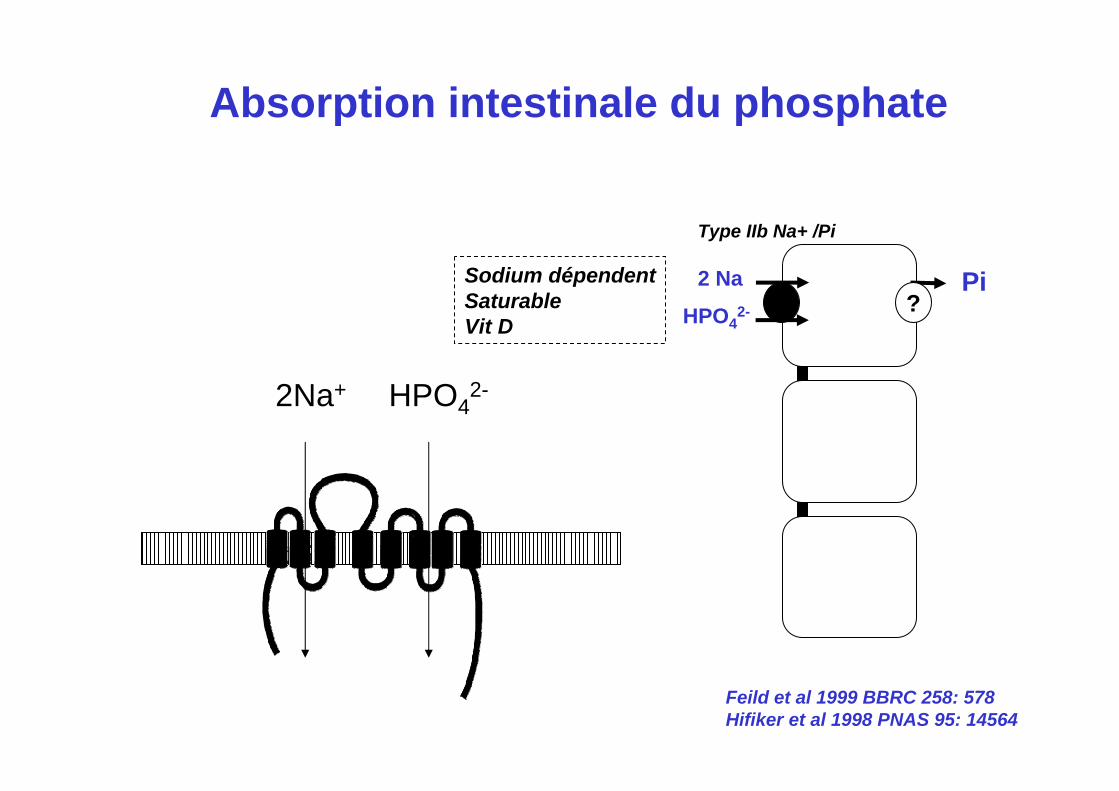
Absorption intestinale du phosphate
HPO42- / H2PO4
-
HPO42-
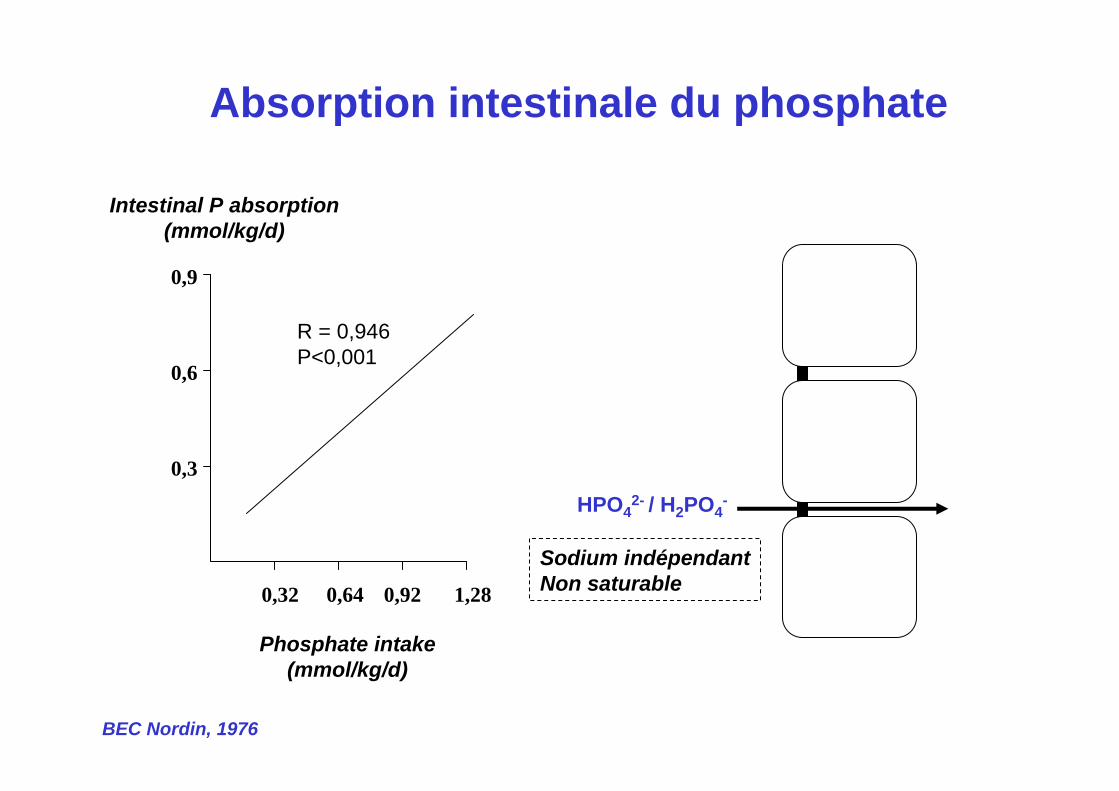
Absorption intestinale du phosphate
HPO42- / H2PO4
-
0,32 0,64 0,92 1,28
0,3
0,6
0,9
Phosphate intake(mmol/kg/d)
Intestinal P absorption(mmol/kg/d)
R = 0,946P<0,001
BEC Nordin, 1976
Sodium indépendantNon saturable
?Pi
Type IIb Na+ /Pi
Absorption intestinale du phosphate
2Na+ HPO42-
Sodium dépendentSaturableVit D
2 Na
HPO42-
Feild et al 1999 BBRC 258: 578Hifiker et al 1998 PNAS 95: 14564
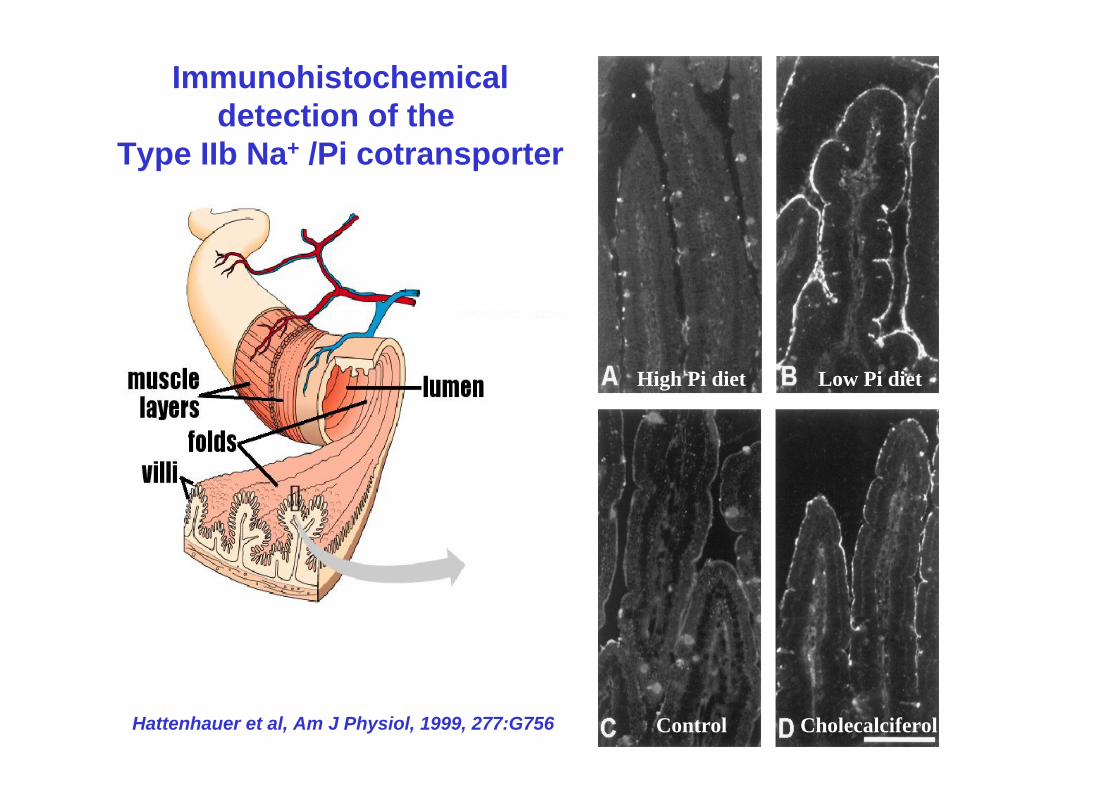
Immunohistochemicaldetection of the
Type IIb Na+ /Pi cotransporter
Low Pi dietHigh Pi diet
CholecalciferolControlHattenhauer et al, Am J Physiol, 1999, 277:G756

Duodénum
Jéjunum
Iléon
Colon
?Pi
Type IIb Na+ /Pi
Absorption intestinale du phosphate
HPO42- / H2PO4
-
2 Na
HPO42-
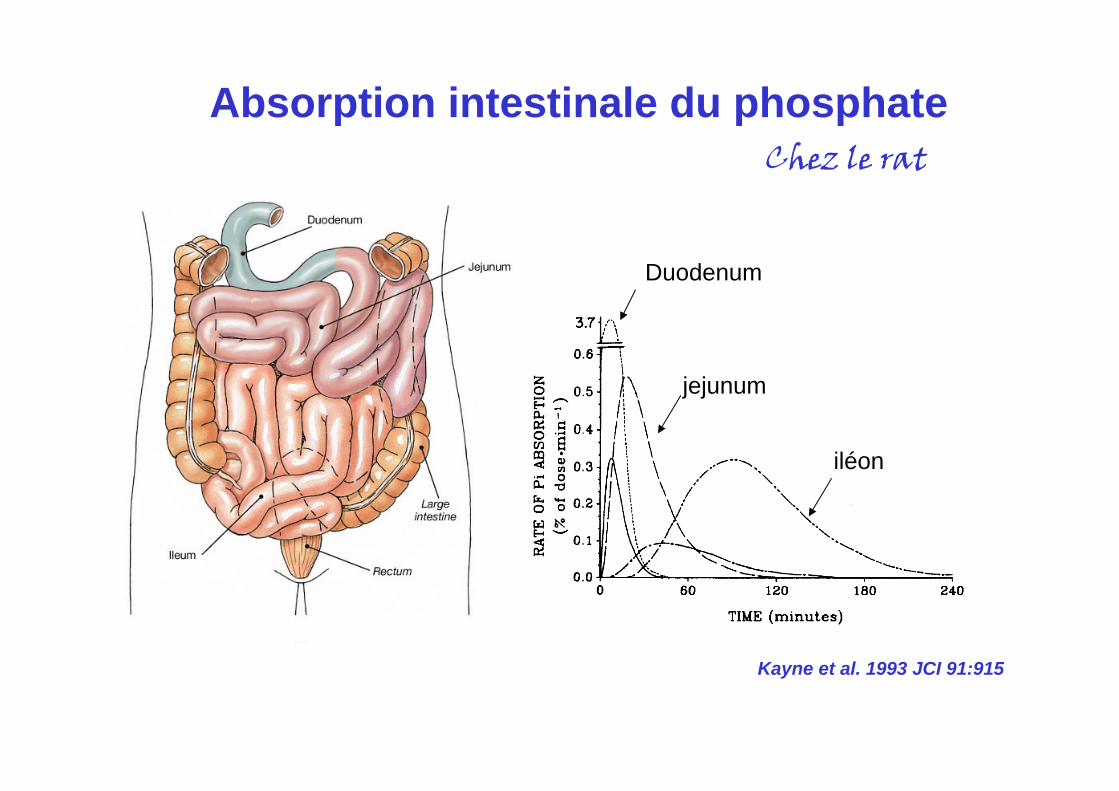
Absorption intestinale du phosphate
Kayne et al. 1993 JCI 91:915
Duodenum
jejunum
iléon
Chez le rat
Duodénum
Jéjunum
Iléon
Colon
30%
30%
30%
?
HPO42- / H2PO4
-
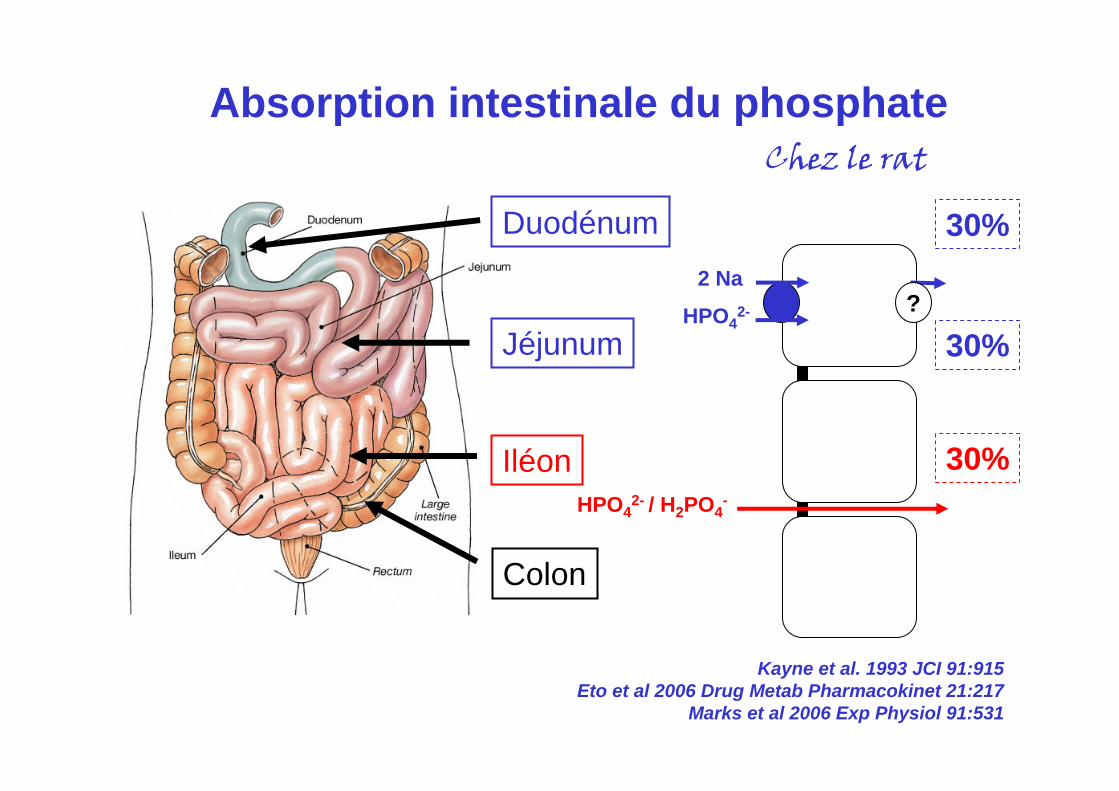
Absorption intestinale du phosphateChez le rat
Kayne et al. 1993 JCI 91:915Eto et al 2006 Drug Metab Pharmacokinet 21:217
Marks et al 2006 Exp Physiol 91:531
2 Na
HPO42-
Duodénum
Jéjunum
Iléon
Colon
Absorption intestinale du phosphate
Kayne et al. 1993 JCI 91:915Eto et al 2006 Drug Metab Pharmacokinet 21:217
Marks et al 2006 Exp Physiol 91:531
60 % absorptiondu phosphate
1. Absorption intestinale des phosphates
2. Chélation calcique des phosphates
3. Absorption intestinale du calcium
Physiologie de la chélation calcique des phosphates
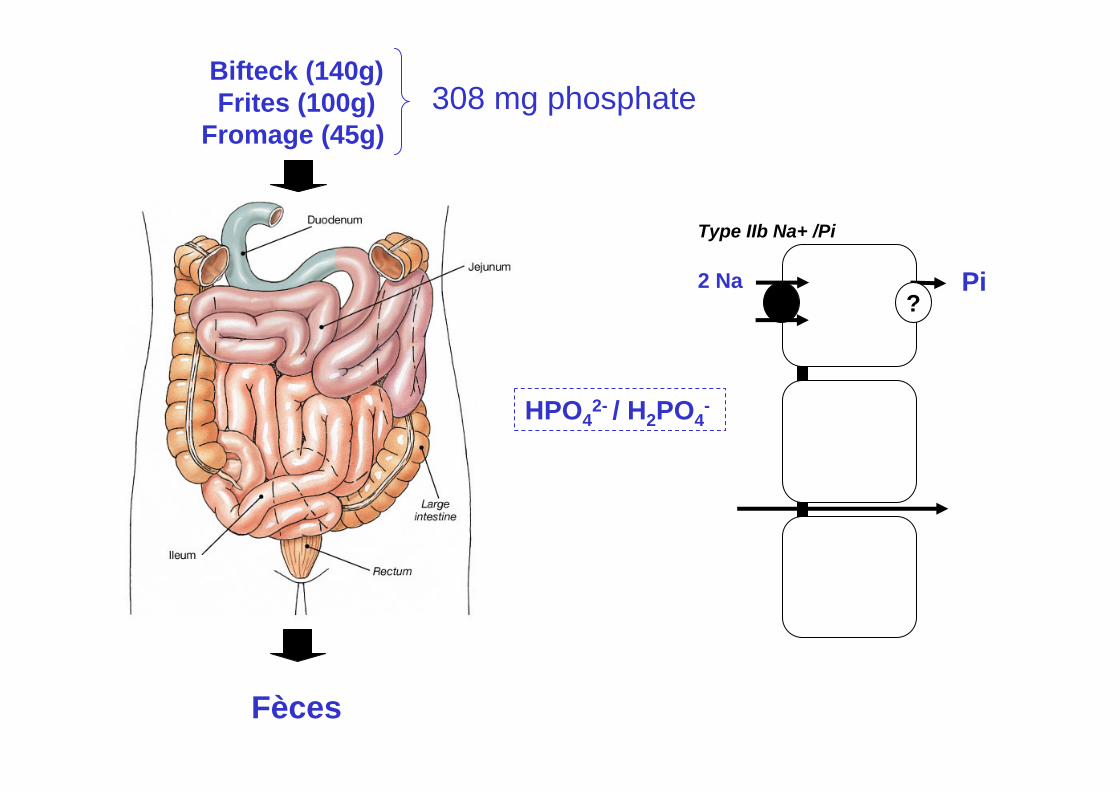
Bifteck (140g)Frites (100g)
Fromage (45g)
Fèces
308 mg phosphate
2 Na?
Pi
Type IIb Na+ /Pi
HPO42- / H2PO4
-
Bifteck (140g)Frites (100g)
Fromage (45g)
Fèces
308 mg phosphate
2 Na?
Pi
Type IIb Na+ /Pi
HPO42- / H2PO4
-
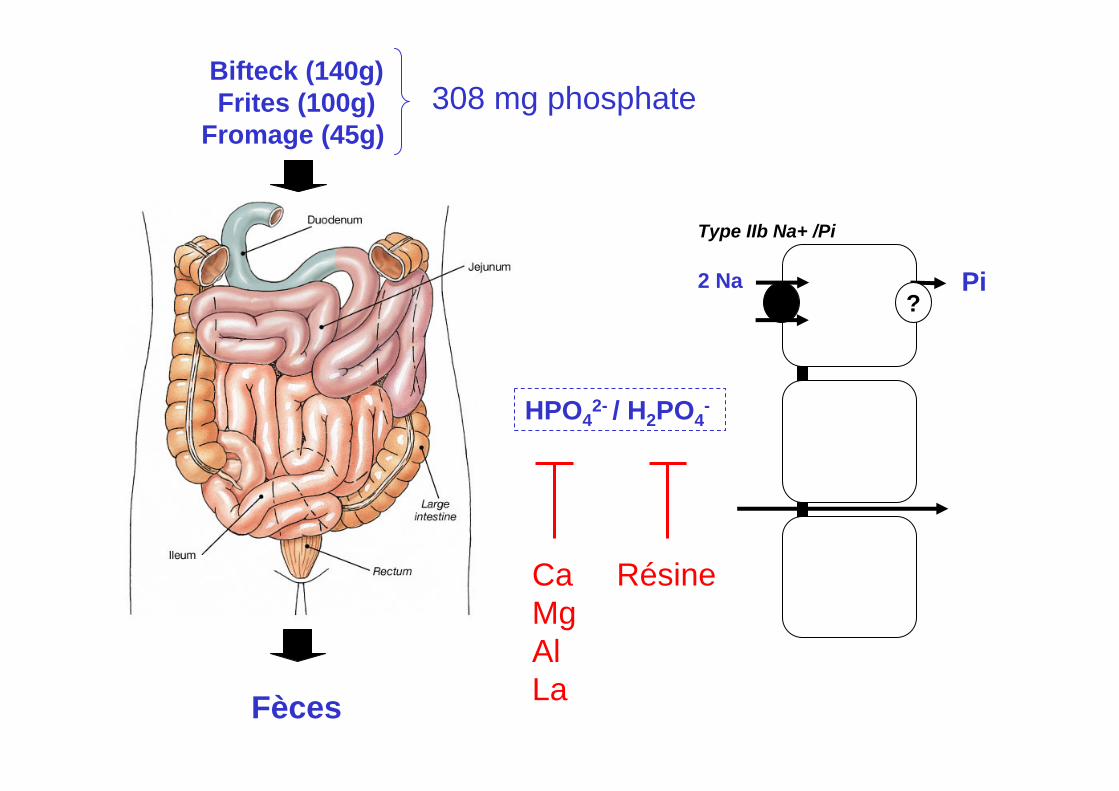
CaMgAlLa
Résine
Bifteck (140g)Frites (100g)
Fromage (45g)
Fèces
308 mg phosphate
2 Na?
Pi
Type IIb Na+ /Pi
HPO42- / H2PO4
-
Ca
2 Na?
Pi
Type IIb Na+ /Pi
HPO42- / H2PO4
-
Ca2 3 4 5 6 7 8
pH
100
80
60
40
20
Produit PxCaen %
pH = 5,5
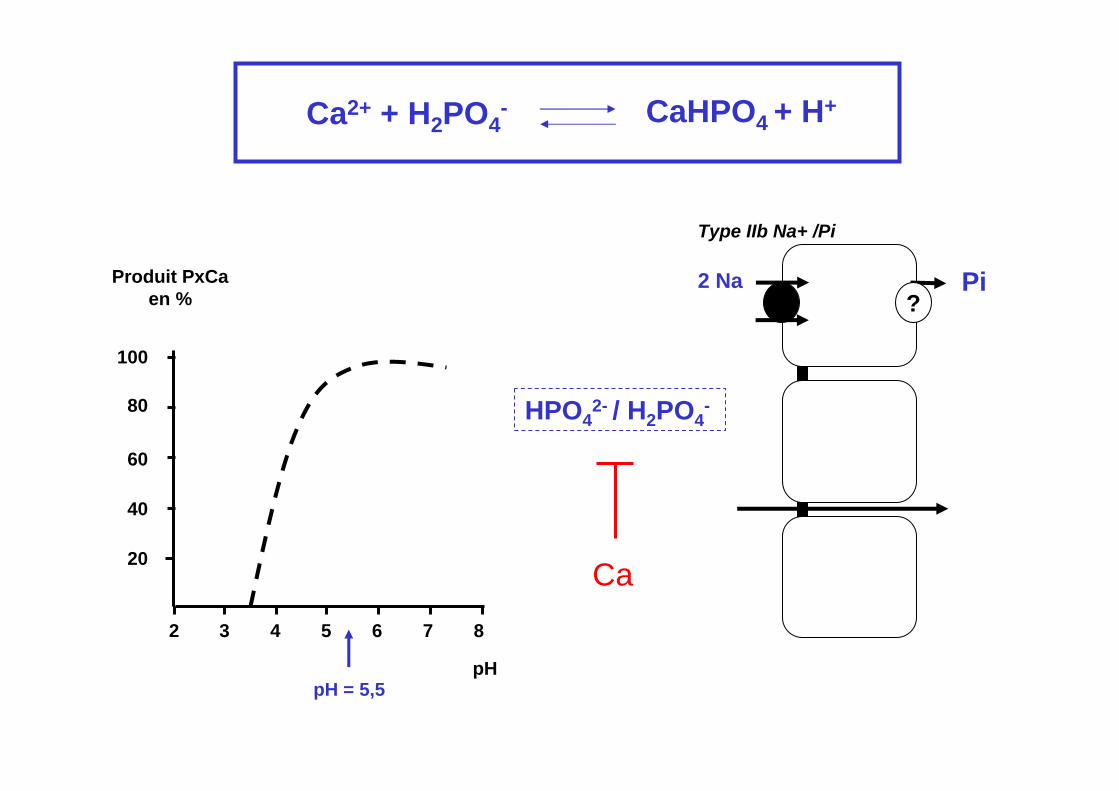
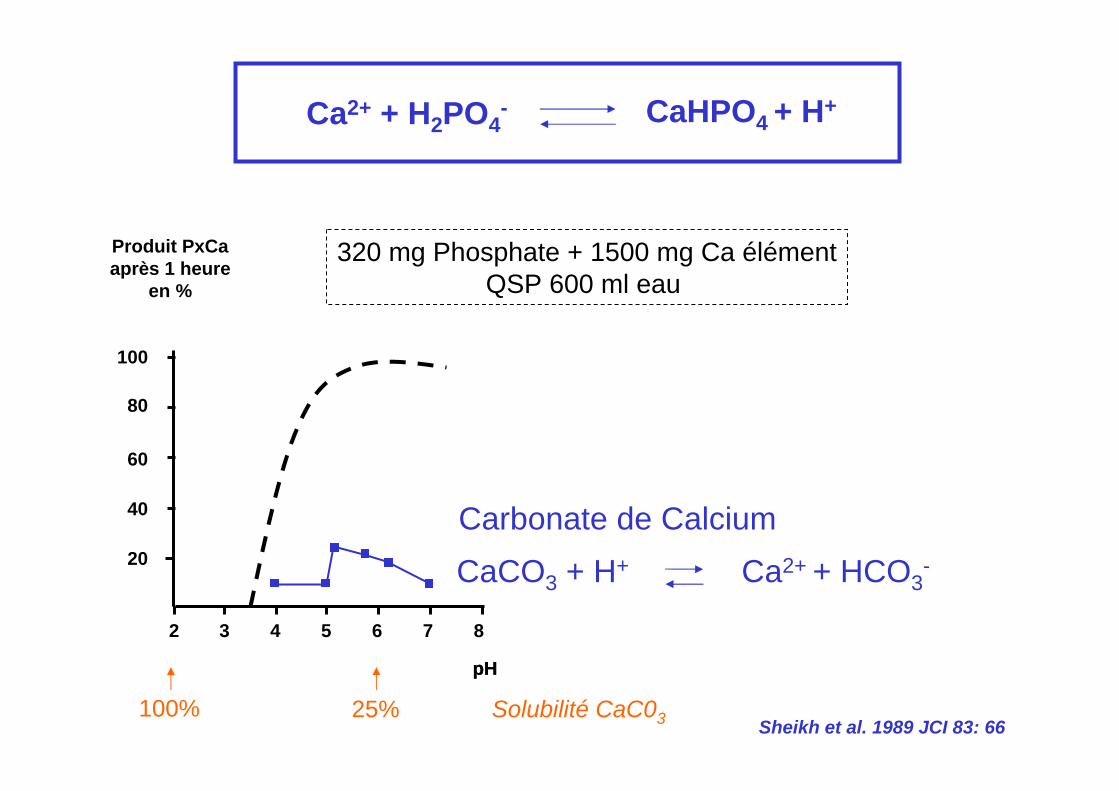
Ca2+ + H2PO4- CaHPO4 + H+
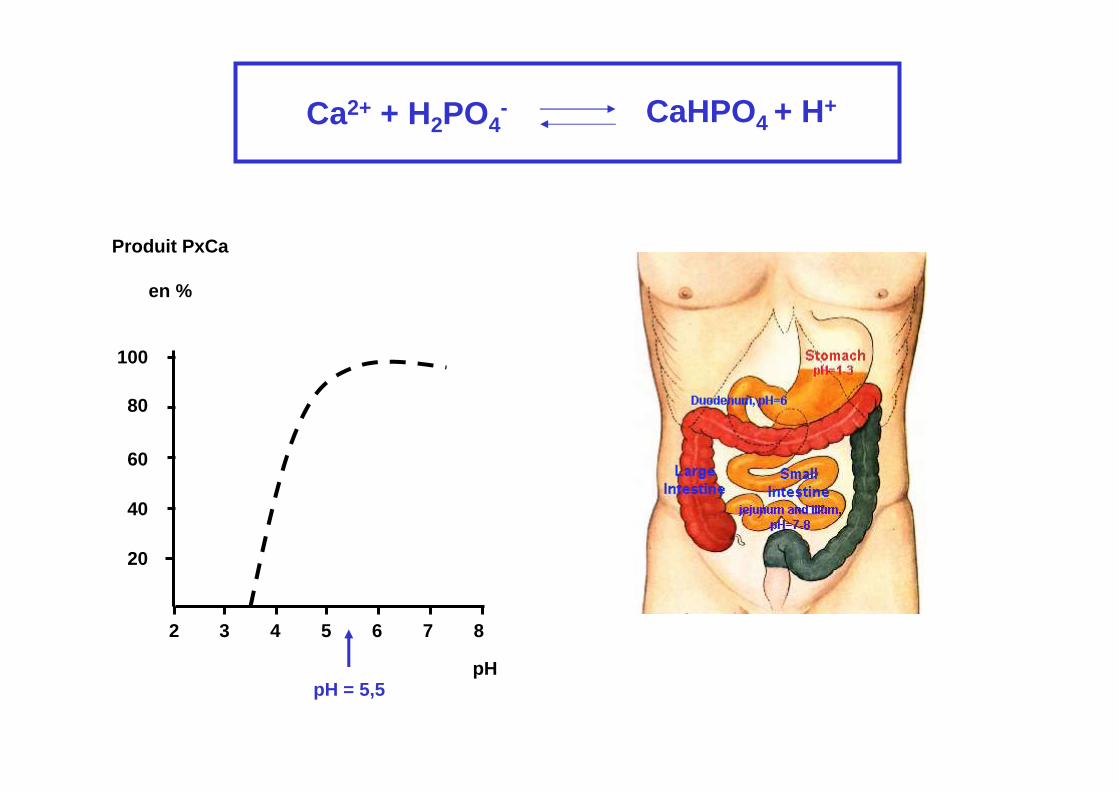
2 3 4 5 6 7 8
pH
100
80
60
40
20
pH = 5,5
Ca2+ + H2PO4- CaHPO4 + H+
Produit PxCa
en %
2 3 4 5 6 7 8
100
80
60
40
20
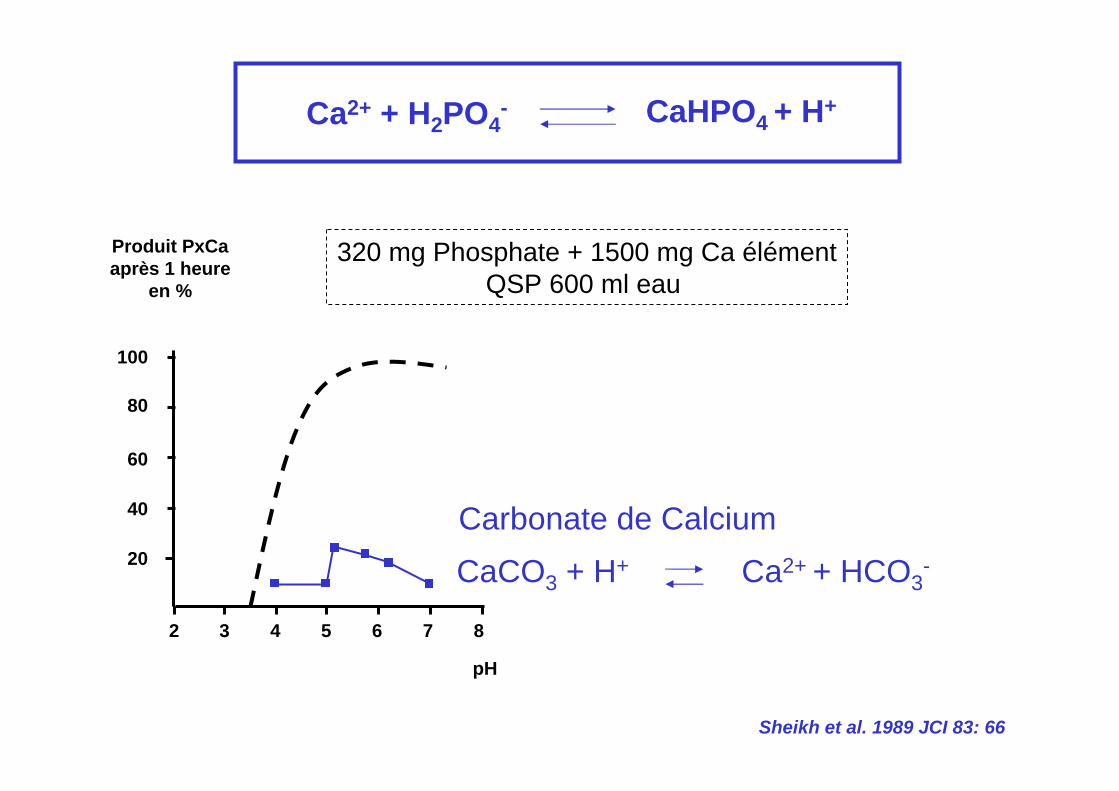
Ca2+ + H2PO4- CaHPO4 + H+
320 mg Phosphate + 1500 mg Ca élémentQSP 600 ml eau
Sheikh et al. 1989 JCI 83: 66
Produit PxCaaprès 1 heure
en %
Carbonate de CalciumCaCO3 + H+ Ca2+ + HCO3
-
pH
2 3 4 5 6 7 8
100
80
60
40
20
Ca2+ + H2PO4- CaHPO4 + H+
320 mg Phosphate + 1500 mg Ca élémentQSP 600 ml eau
Sheikh et al. 1989 JCI 83: 66
Produit PxCaaprès 1 heure
en %
Carbonate de CalciumCaCO3 + H+ Ca2+ + HCO3
-
pHpH
100% 25% Solubilité CaC03
2 3 4 5 6 7 8
100
80
60
40
20
Produit PxCaaprès 1 heure
en %
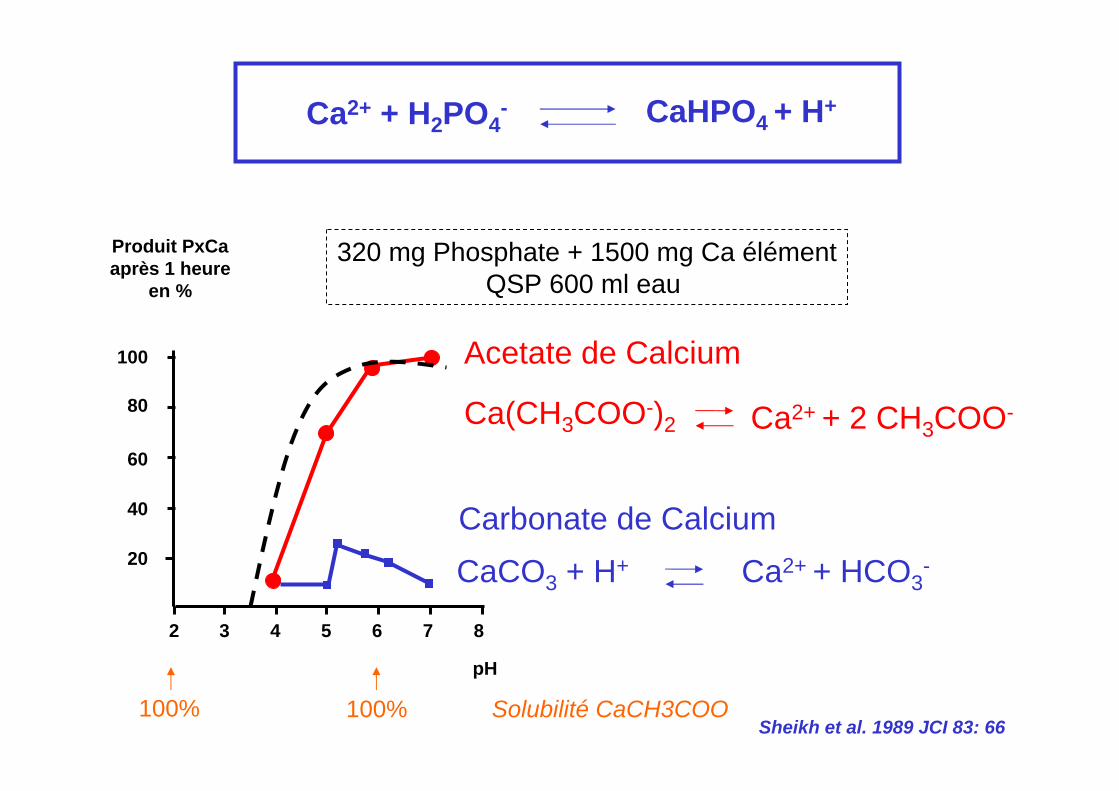
Ca2+ + H2PO4- CaHPO4 + H+
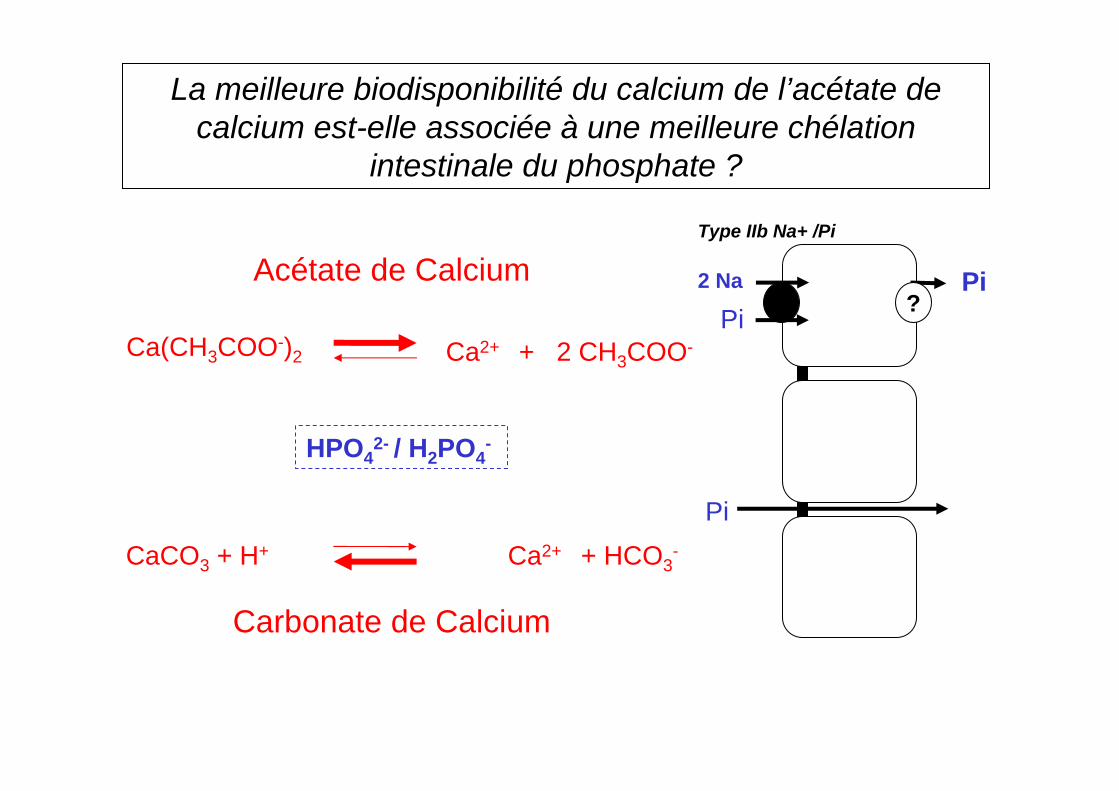
Acetate de Calcium
Carbonate de Calcium
Ca(CH3COO-)2 Ca2+ + 2 CH3COO-
CaCO3 + H+ Ca2+ + HCO3-
320 mg Phosphate + 1500 mg Ca élémentQSP 600 ml eau
Sheikh et al. 1989 JCI 83: 66
pH
100% 100% Solubilité CaCH3COO
Ca2+ + H2PO4- CaHPO4 + H+
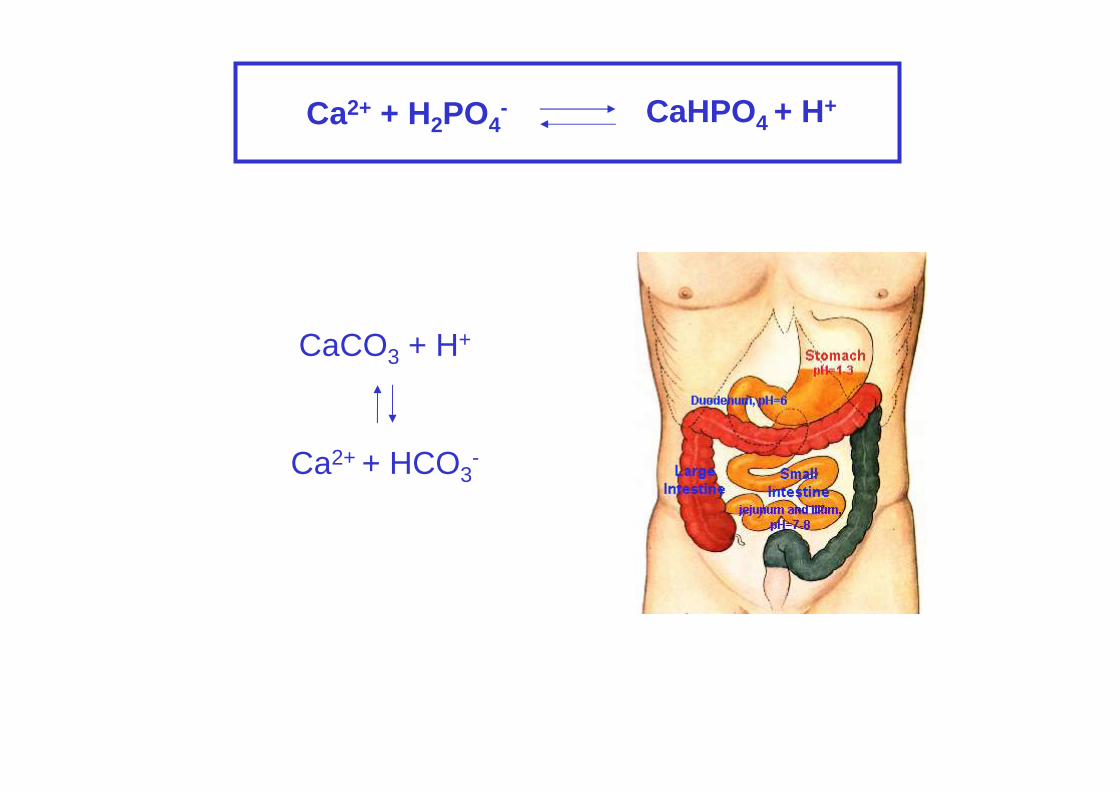
CaCO3 + H+
Ca2+ + HCO3-
Ca2+ + H2PO4- CaHPO4 + H+
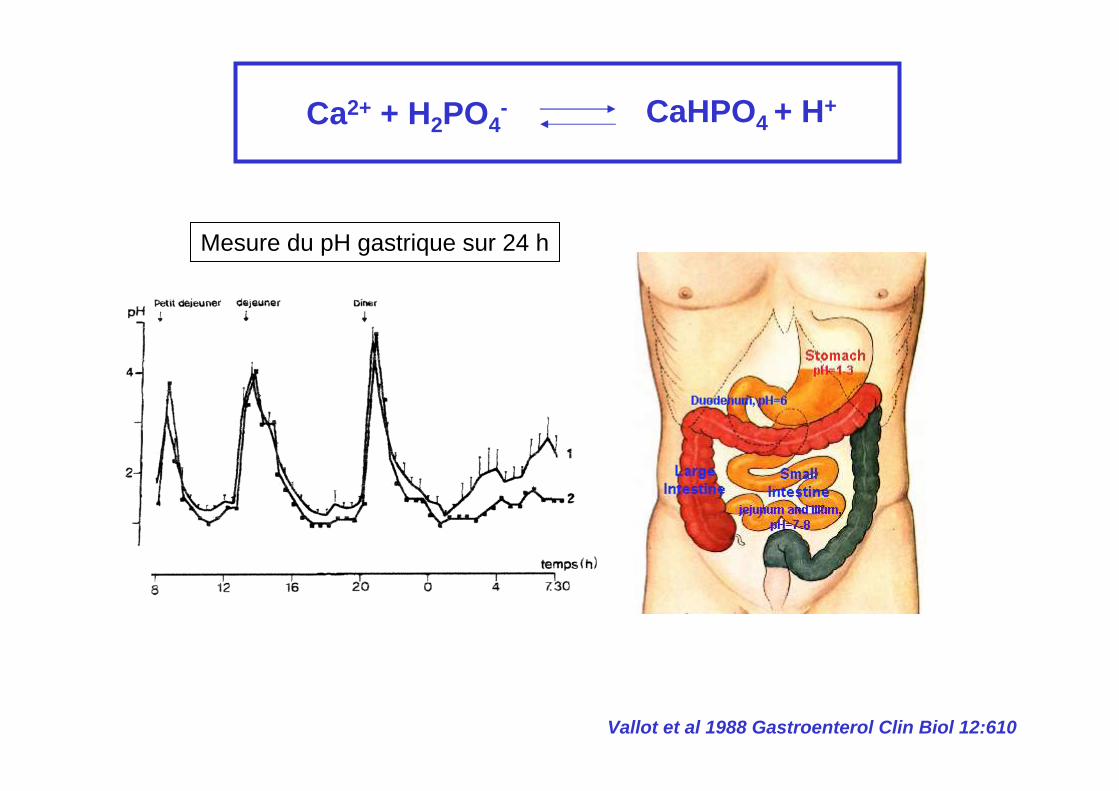
Mesure du pH gastrique sur 24 h
Vallot et al 1988 Gastroenterol Clin Biol 12:610
2 Na?
Pi
Type IIb Na+ /Pi
HPO42- / H2PO4
-
Acétate de Calcium
Carbonate de Calcium
Ca(CH3COO-)2 Ca2+ + 2 CH3COO-
CaCO3 + H+ Ca2+ + HCO3-
La meilleure biodisponibilité du calcium de l’acétate de calcium est-elle associée à une meilleure chélation
intestinale du phosphate ?
Pi
Pi
HPO42- / H2PO4
-
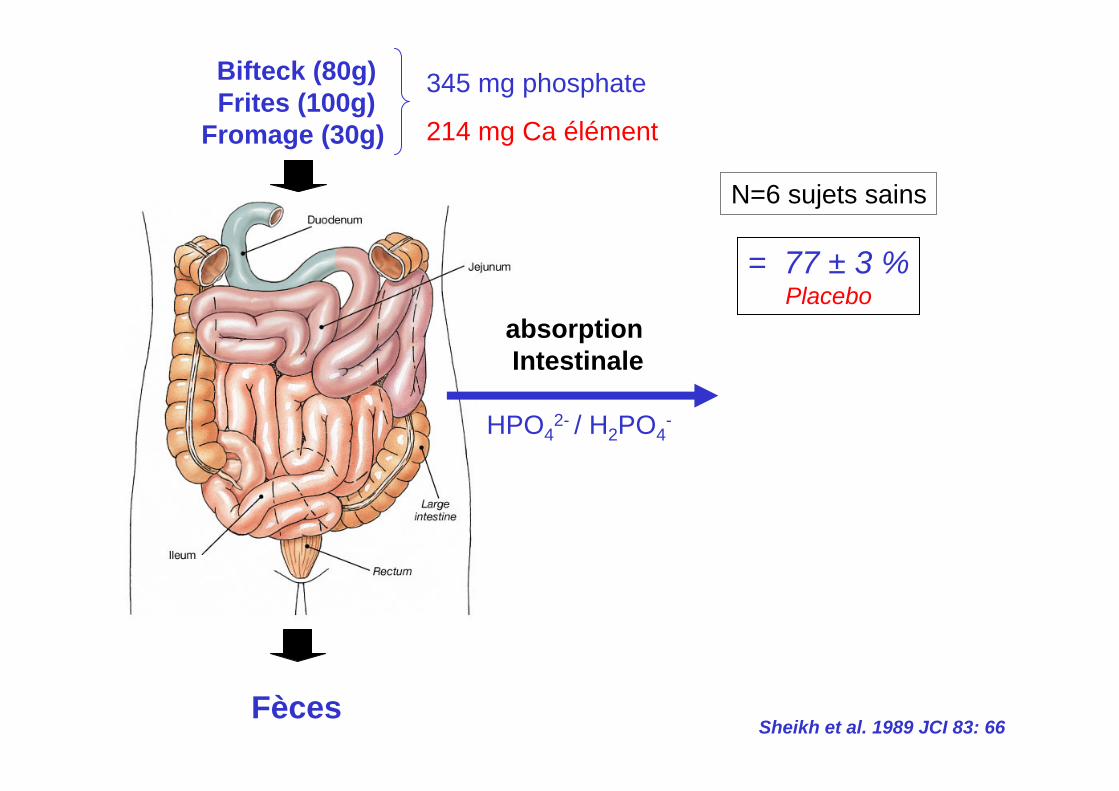
absorption Intestinale
Bifteck (80g)Frites (100g)
Fromage (30g)
Fèces
= 77 ± 3 %Placebo
Sheikh et al. 1989 JCI 83: 66
N=6 sujets sains
345 mg phosphate
214 mg Ca élément
HPO42- / H2PO4
-
absorption Intestinale
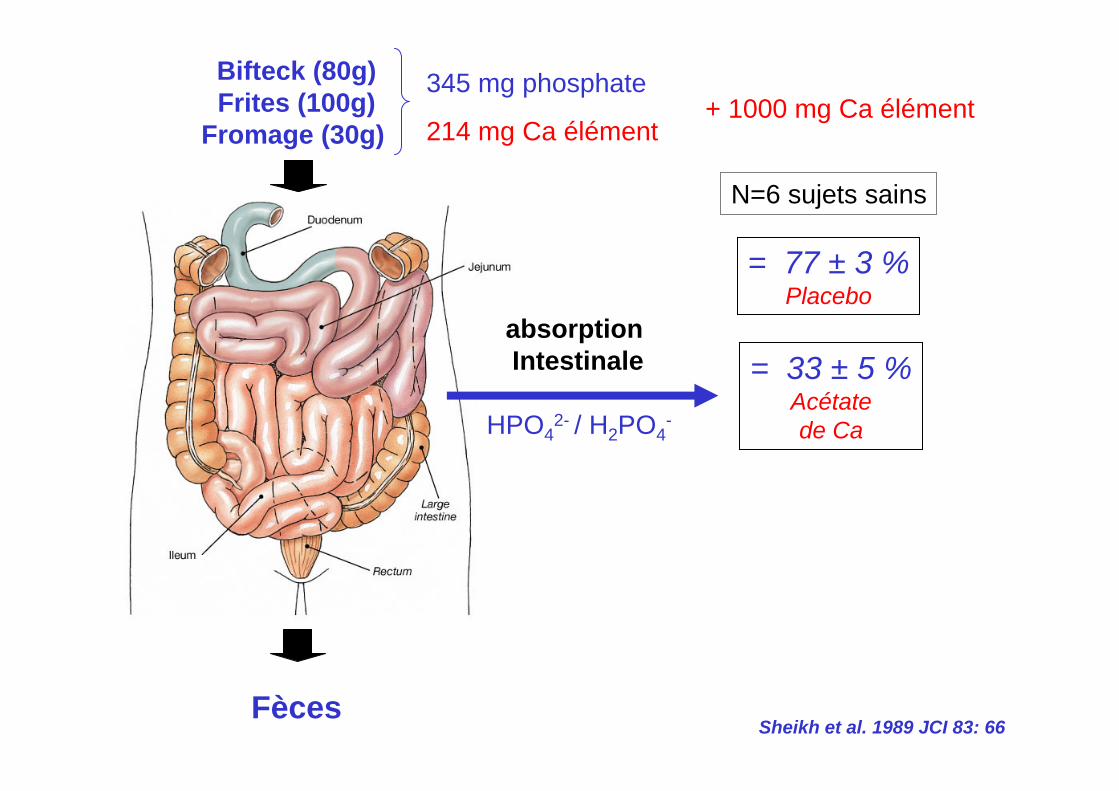
Bifteck (80g)Frites (100g)
Fromage (30g)
Fèces
= 77 ± 3 %Placebo
= 33 ± 5 %Acétatede Ca
Sheikh et al. 1989 JCI 83: 66
N=6 sujets sains
345 mg phosphate+ 1000 mg Ca élément
214 mg Ca élément
HPO42- / H2PO4
-
absorption Intestinale
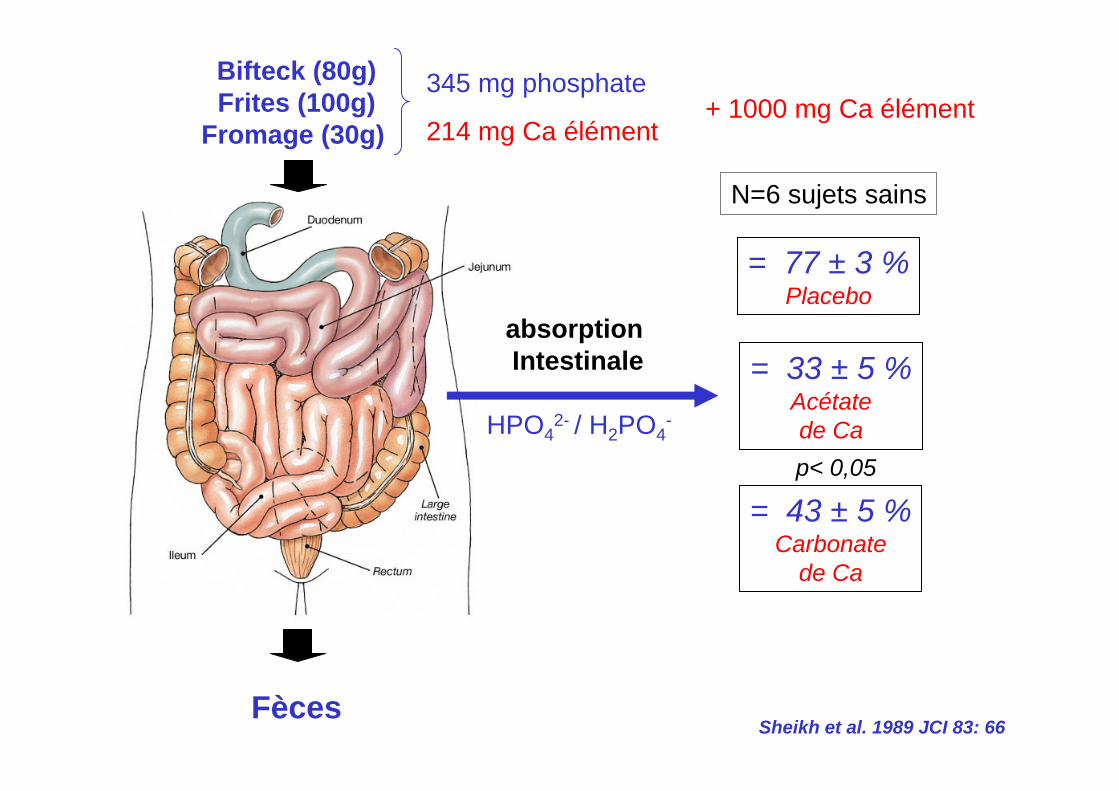
Bifteck (80g)Frites (100g)
Fromage (30g)
Fèces
= 77 ± 3 %Placebo
= 33 ± 5 %Acétatede Ca
= 43 ± 5 %Carbonate
de Ca
p< 0,05
Sheikh et al. 1989 JCI 83: 66
N=6 sujets sains
345 mg phosphate+ 1000 mg Ca élément
214 mg Ca élément
HPO42- / H2PO4
-
absorption Intestinale
Bifteck (80g)Frites (100g)
Fromage (30g)
Fèces
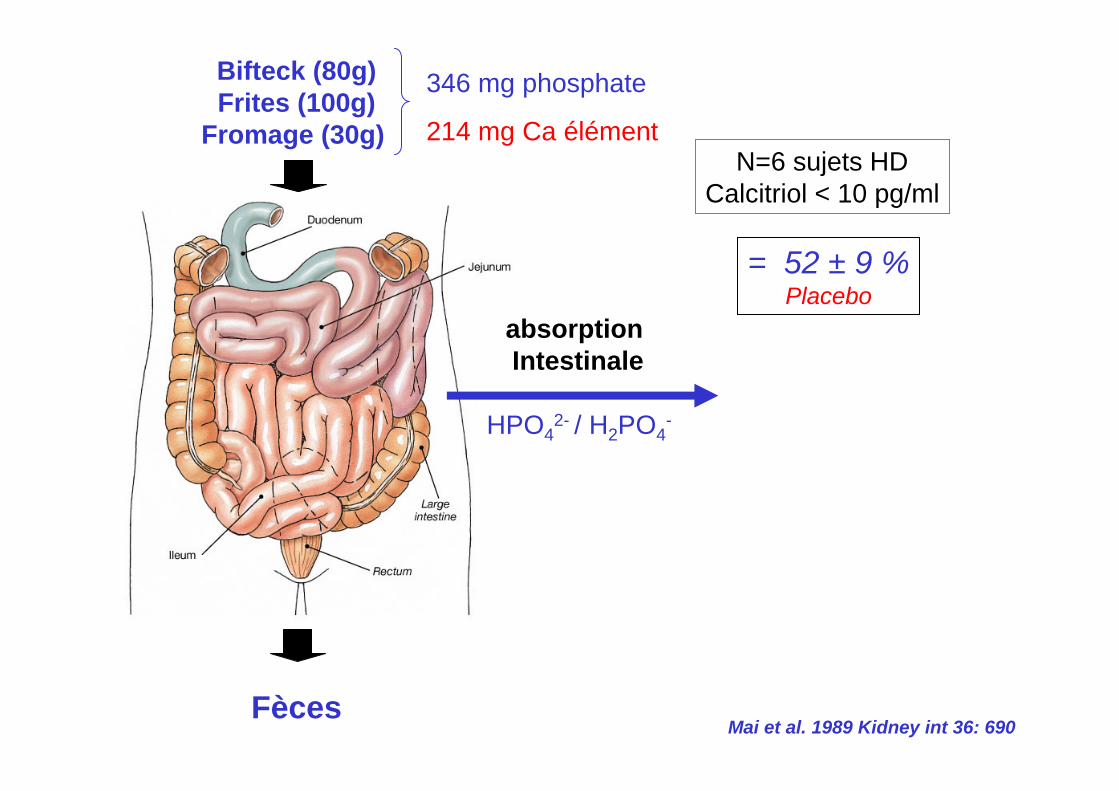
= 52 ± 9 %Placebo
Mai et al. 1989 Kidney int 36: 690
N=6 sujets HDCalcitriol < 10 pg/ml
346 mg phosphate
214 mg Ca élément
HPO42- / H2PO4
-
absorption Intestinale
Bifteck (80g)Frites (100g)
Fromage (30g)
Fèces
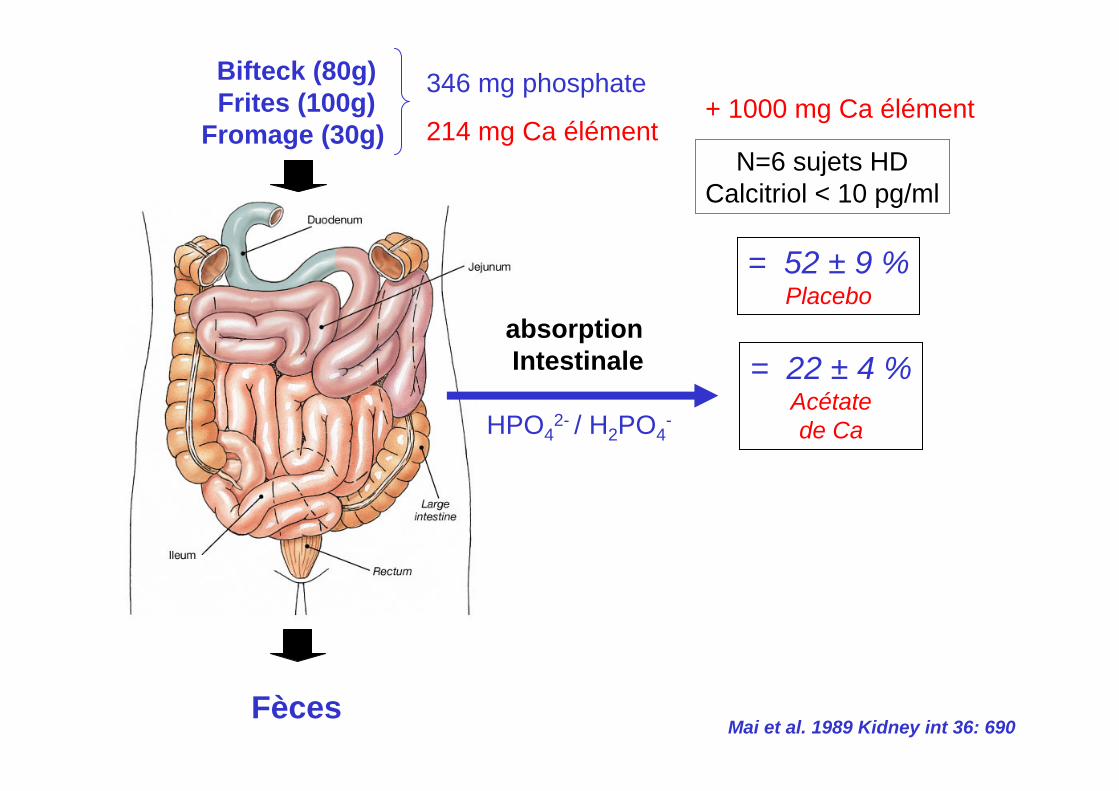
= 52 ± 9 %Placebo
= 22 ± 4 %Acétatede Ca
Mai et al. 1989 Kidney int 36: 690
N=6 sujets HDCalcitriol < 10 pg/ml
346 mg phosphate+ 1000 mg Ca élément
214 mg Ca élément
HPO42- / H2PO4
-
absorption Intestinale
Bifteck (80g)Frites (100g)
Fromage (30g)
Fèces
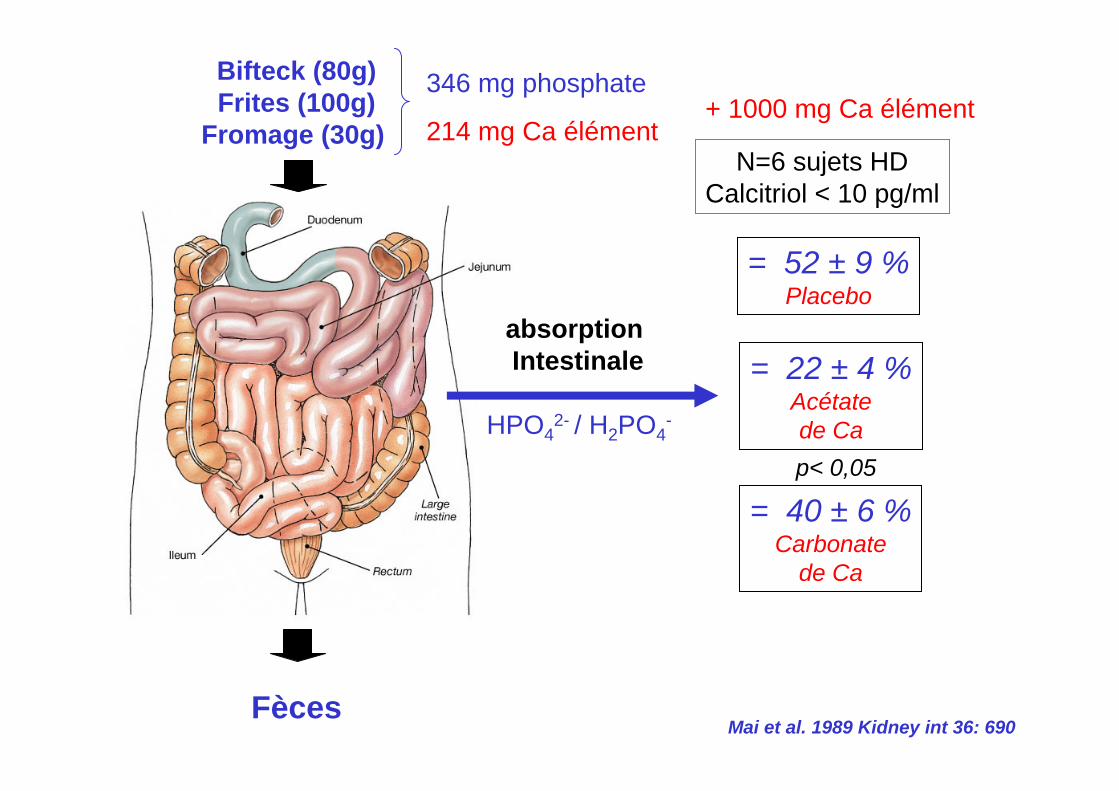
= 52 ± 9 %Placebo
= 22 ± 4 %Acétatede Ca
= 40 ± 6 %Carbonate
de Ca
p< 0,05
Mai et al. 1989 Kidney int 36: 690
N=6 sujets HDCalcitriol < 10 pg/ml
346 mg phosphate+ 1000 mg Ca élément
214 mg Ca élément

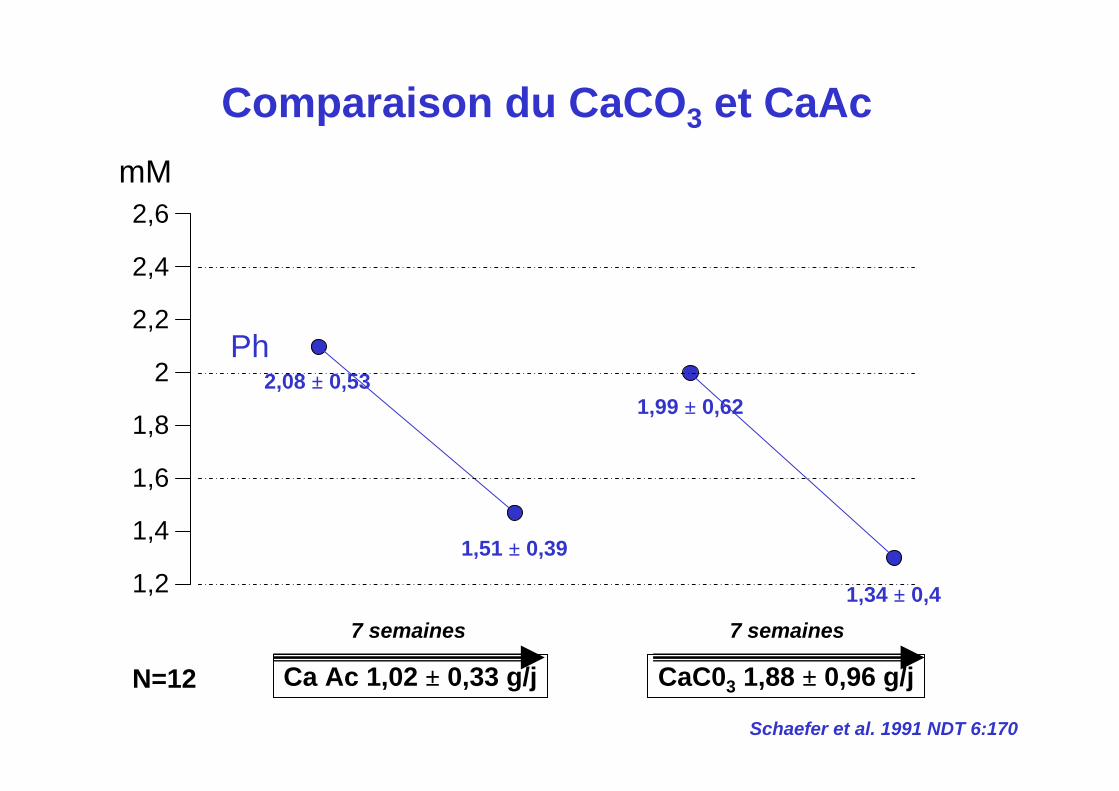
Ph2,08 ± 0,53
1,51 ± 0,39
1,99 ± 0,62
1,34 ± 0,41,2
1,4
1,6
1,8
2
2,2
2,4
2,6
Ca Ac 1,02 ± 0,33 g/j CaC03 1,88 ± 0,96 g/j
7 semaines 7 semaines
N=12
mM
Schaefer et al. 1991 NDT 6:170
Comparaison du CaCO3 et CaAc
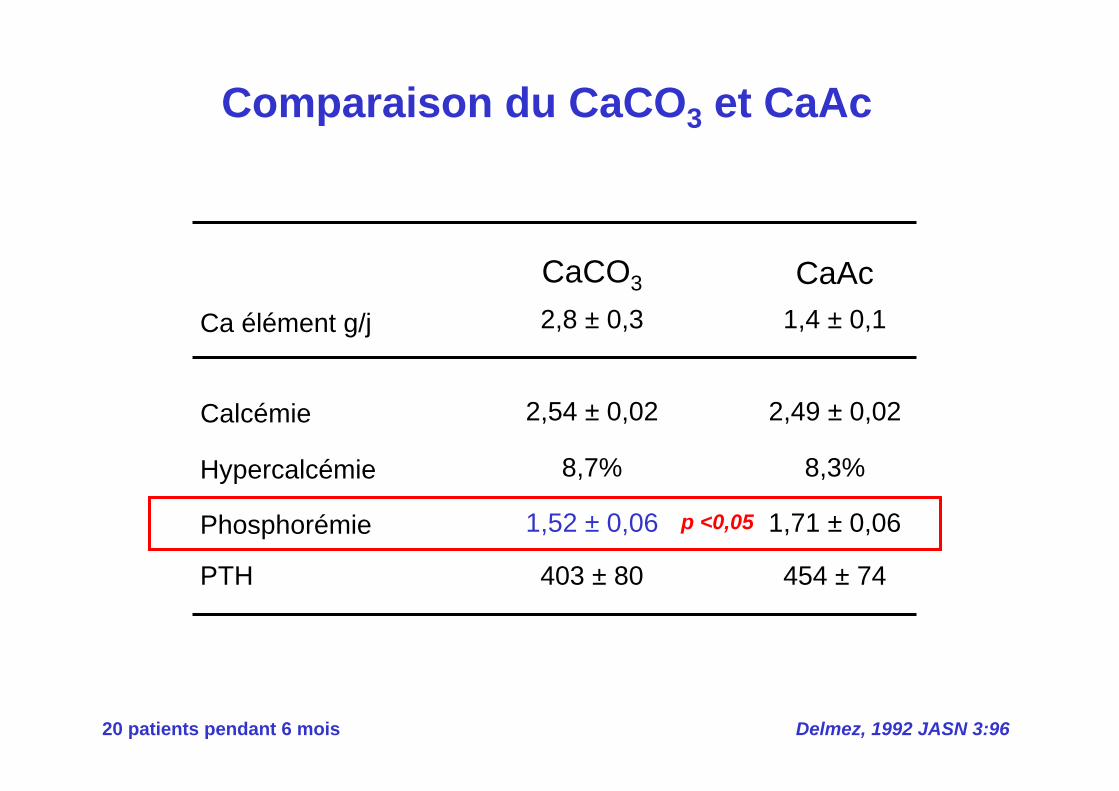
Comparaison du CaCO3 et CaAc
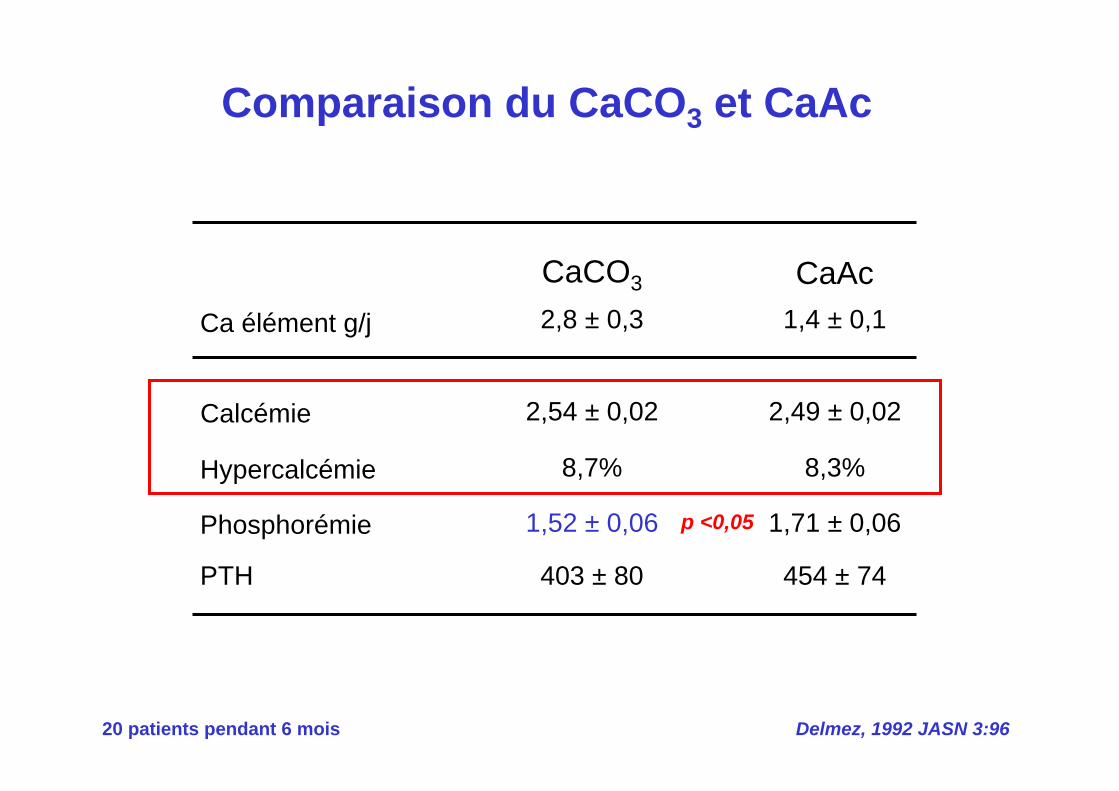
Delmez, 1992 JASN 3:9620 patients pendant 6 mois
Hypercalcémie
Phosphorémie
PTH
Ca élément g/j
8,7%
1,52 ± 0,06
403 ± 80
2,8 ± 0,3
8,3%
1,71 ± 0,06
454 ± 74
1,4 ± 0,1
Calcémie 2,54 ± 0,02 2,49 ± 0,02
CaCO3 CaAc
p <0,05
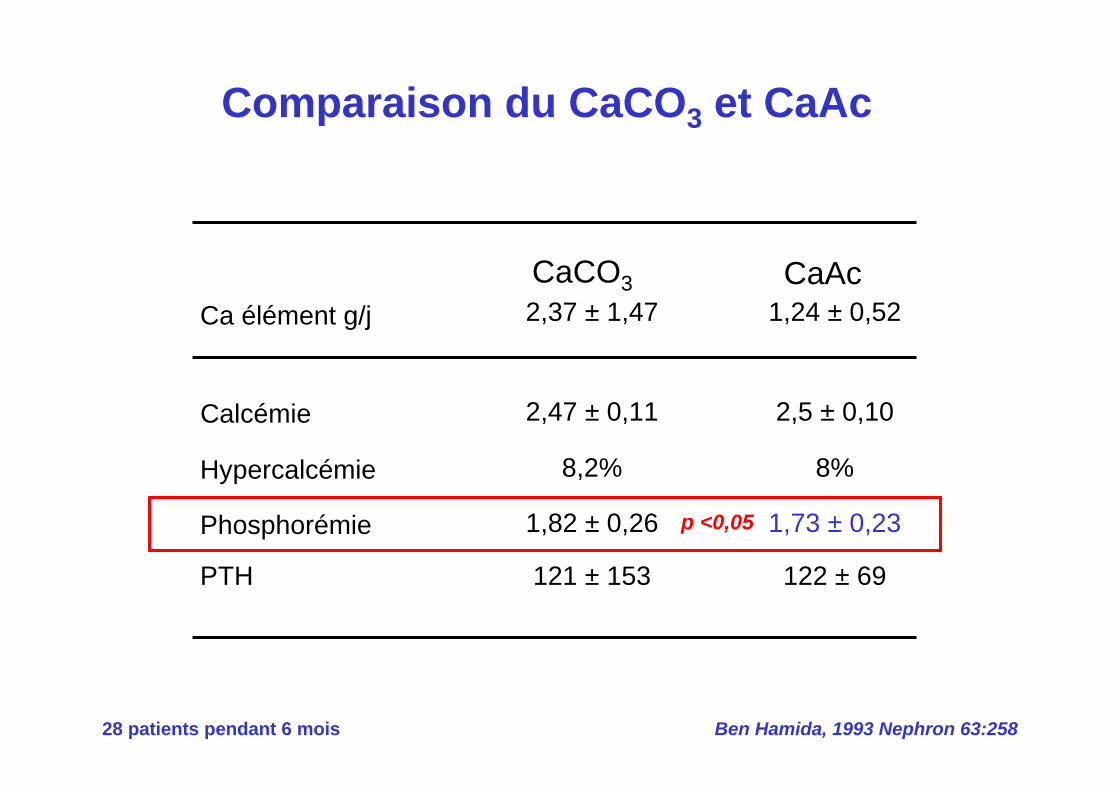
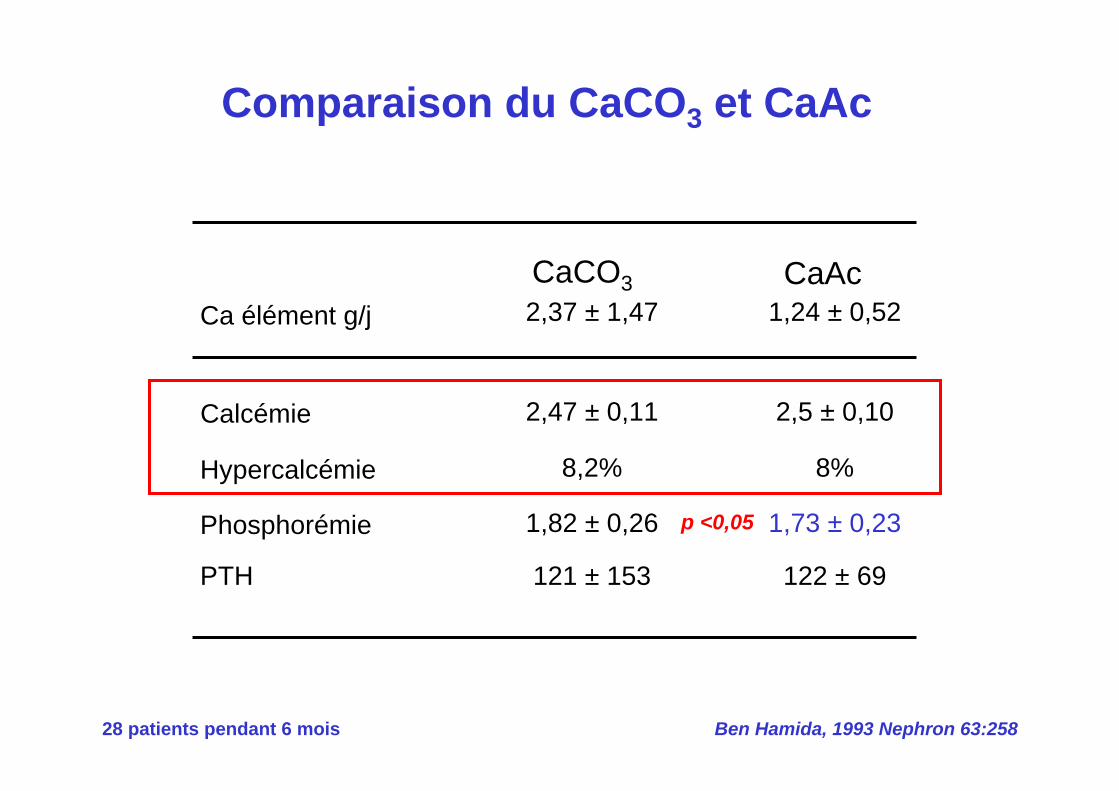
Ben Hamida, 1993 Nephron 63:258
Comparaison du CaCO3 et CaAc
28 patients pendant 6 mois
Hypercalcémie
Phosphorémie
PTH
Ca élément g/j
8,2%
1,82 ± 0,26
121 ± 153
2,37 ± 1,47
8%
1,73 ± 0,23
122 ± 69
1,24 ± 0,52
Calcémie 2,47 ± 0,11 2,5 ± 0,10
CaCO3 CaAc
p <0,05
2 Na?
Pi
Type IIb Na+ /Pi
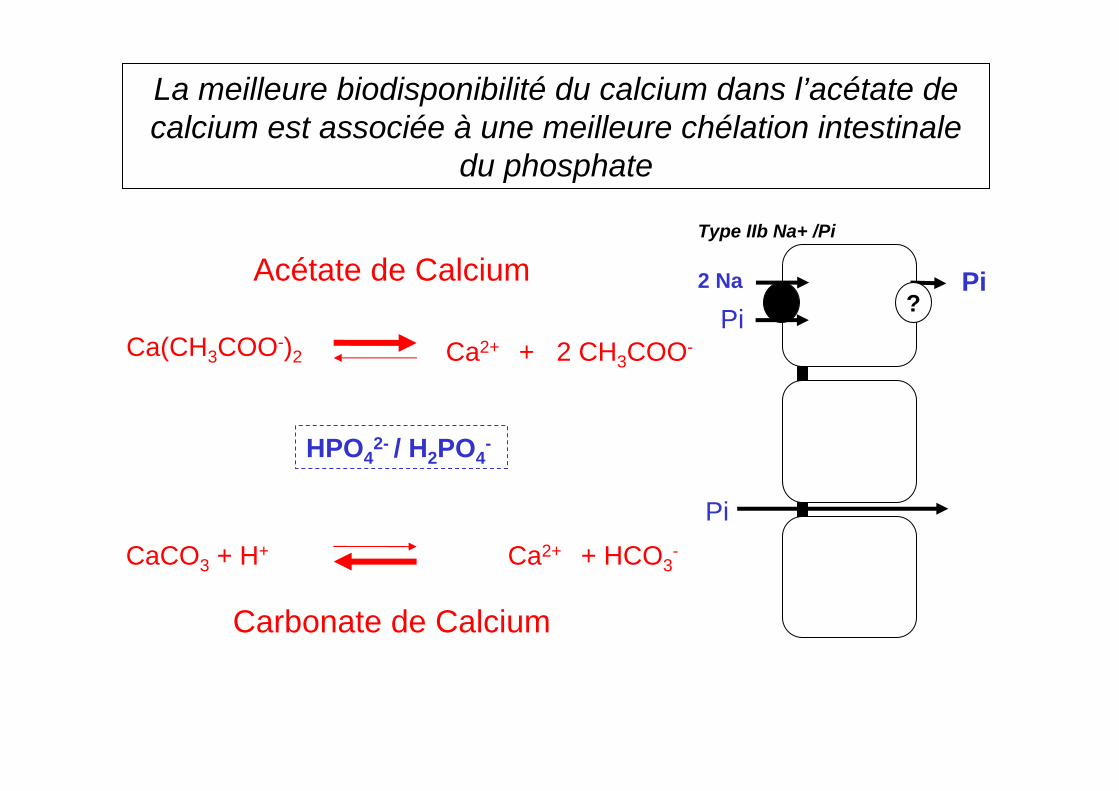
La meilleure biodisponibilité du calcium dans l’acétate de calcium est associée à une meilleure chélation intestinale
du phosphate
Pi
Pi
HPO42- / H2PO4
-
Acétate de Calcium
Carbonate de Calcium
Ca(CH3COO-)2 Ca2+ + 2 CH3COO-
CaCO3 + H+ Ca2+ + HCO3-
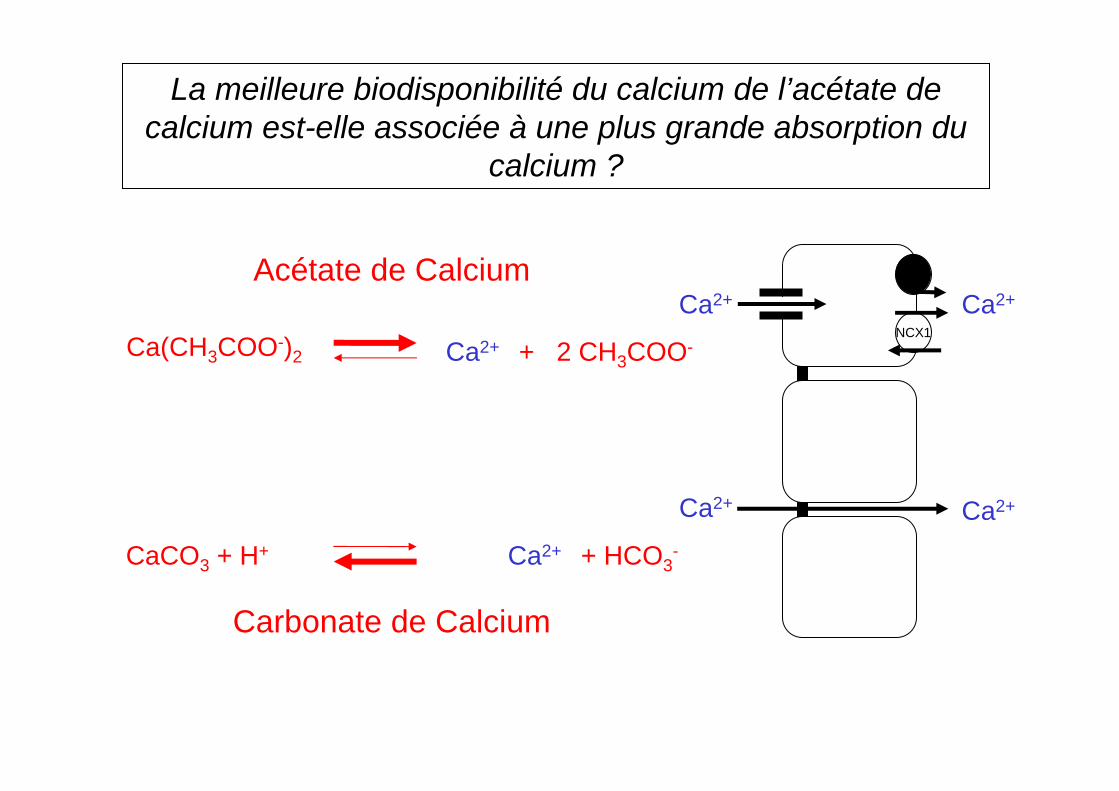
La meilleure biodisponibilité du calcium de l’acétate de calcium est-elle associée à une plus grande absorption du
calcium ?
Ca2+
NCX1
Ca2+
Ca2+ Ca2+
Acétate de Calcium
Carbonate de Calcium
Ca(CH3COO-)2 Ca2+ + 2 CH3COO-
CaCO3 + H+ Ca2+ + HCO3-
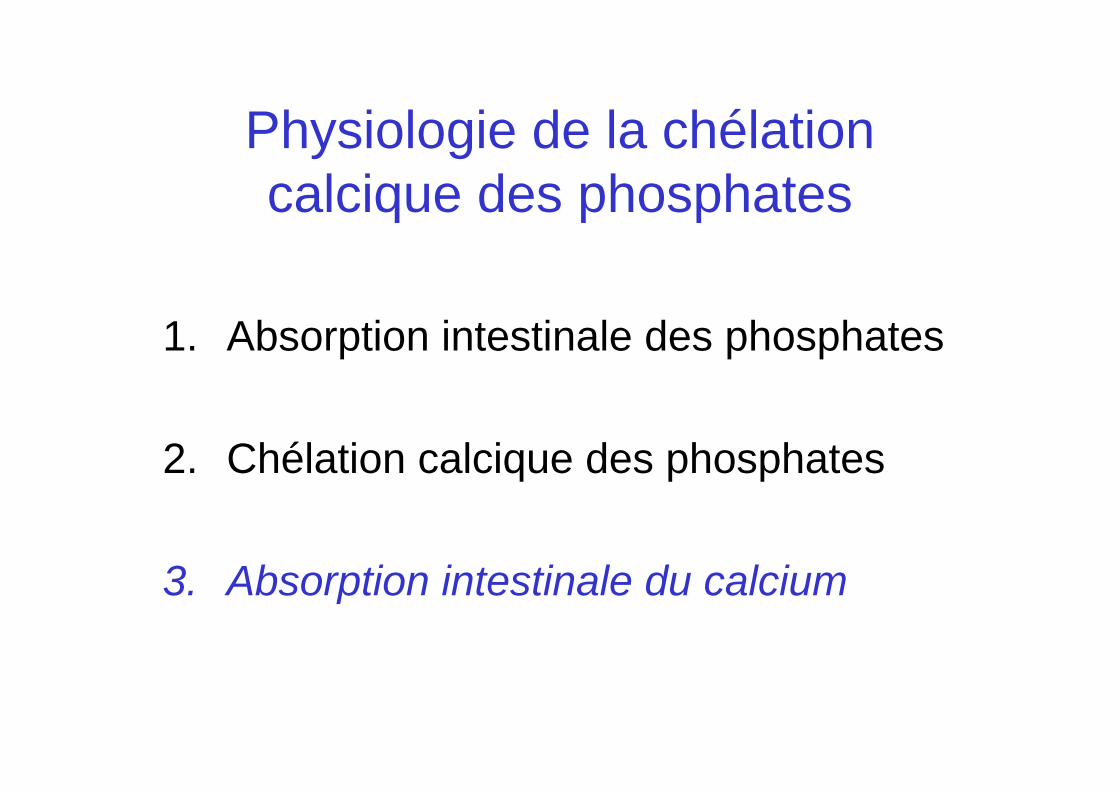
1. Absorption intestinale des phosphates
2. Chélation calcique des phosphates
3. Absorption intestinale du calcium
Physiologie de la chélation calcique des phosphates
Duodénum
Jéjunum
Iléon
Colon
CaATPasePMCA1b
Ca2+
NCX1
Ca2+
TRPV5
Ca2+ Ca2+
Calbindin
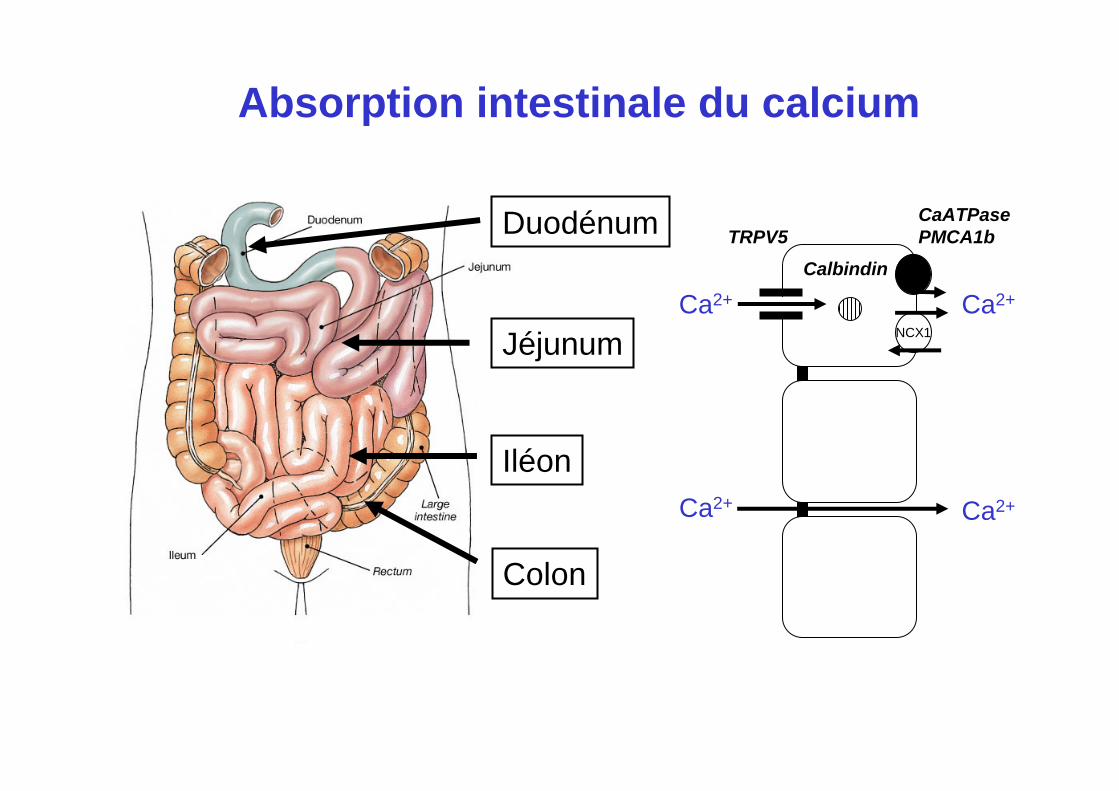
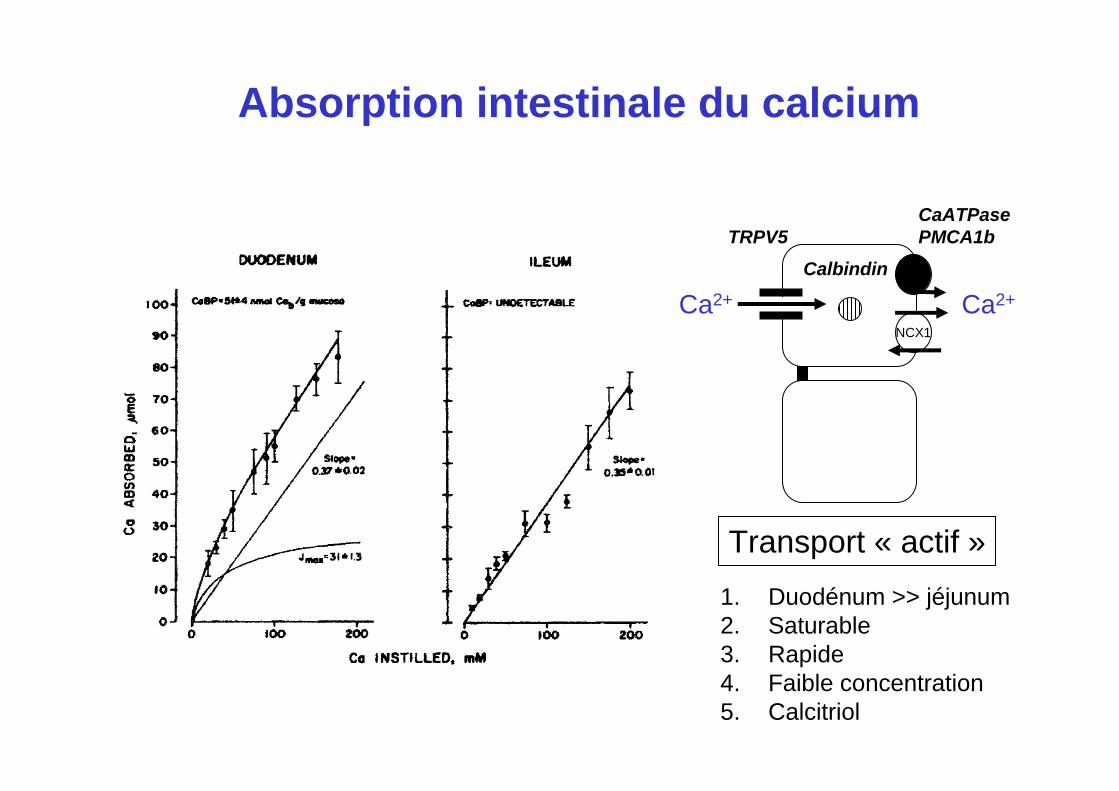
Absorption intestinale du calcium
Duodénum
Jéjunum
Iléon
Colon
Ca2+ Ca2+
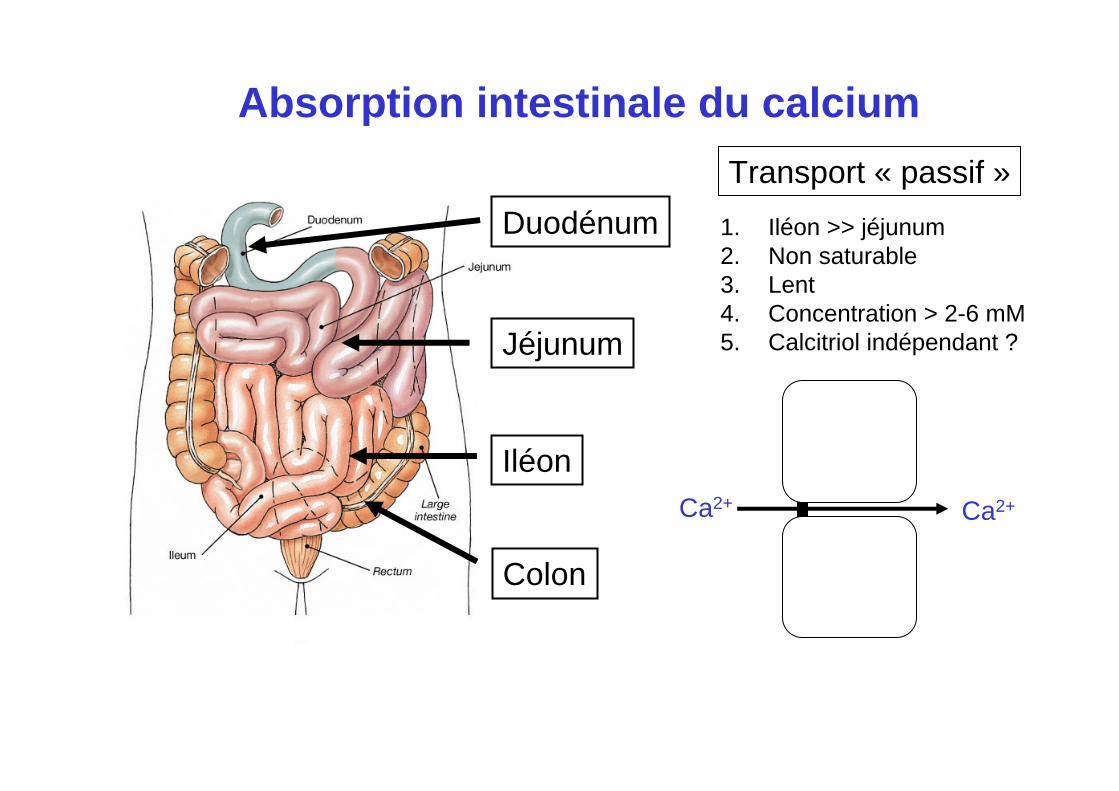
Absorption intestinale du calcium
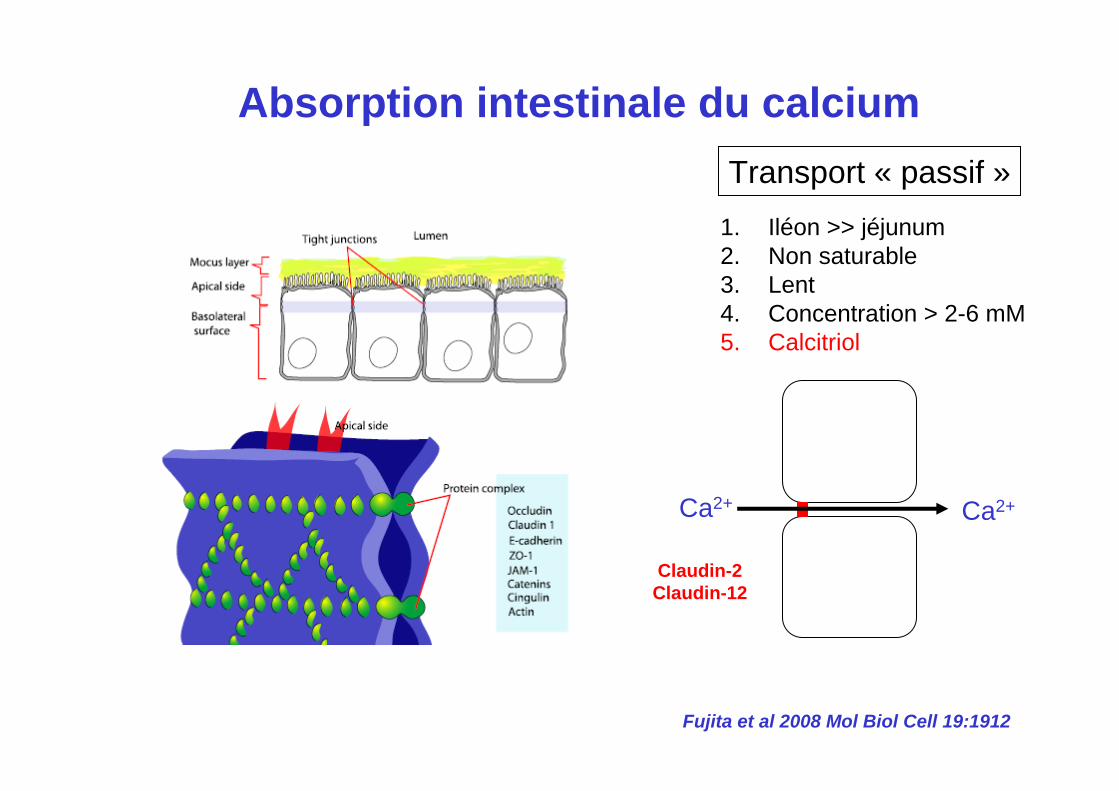
1. Iléon >> jéjunum2. Non saturable3. Lent4. Concentration > 2-6 mM5. Calcitriol indépendant ?
Transport « passif »
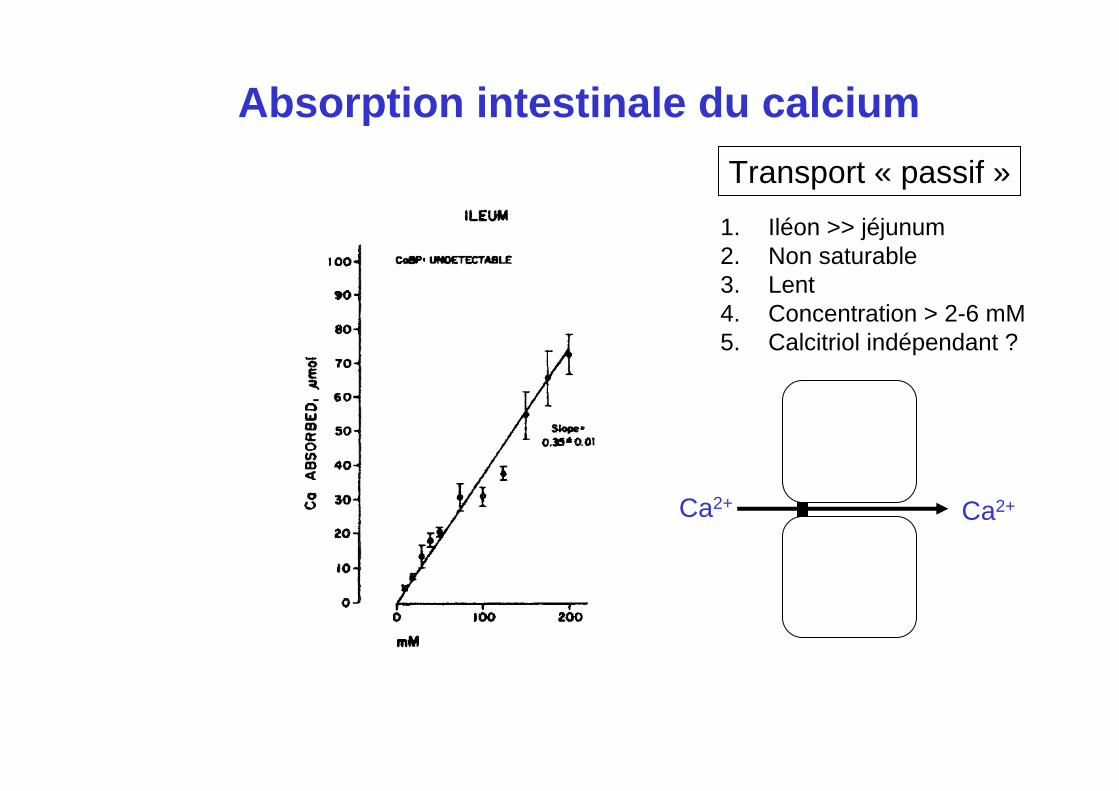
Ca2+ Ca2+
Absorption intestinale du calcium
1. Iléon >> jéjunum2. Non saturable3. Lent4. Concentration > 2-6 mM5. Calcitriol indépendant ?
Transport « passif »
Duodénum
Jéjunum
Iléon
Colon
CaATPasePMCA1b
Ca2+
NCX1
Ca2+
TRPV5Calbindin
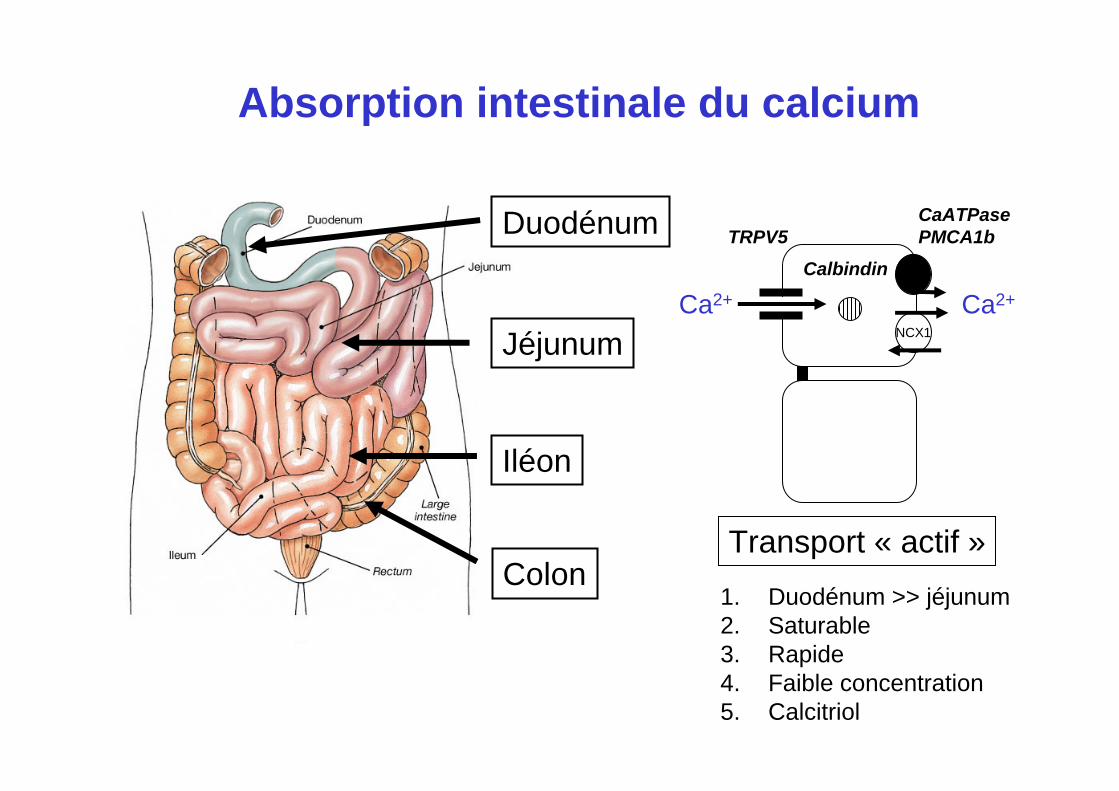
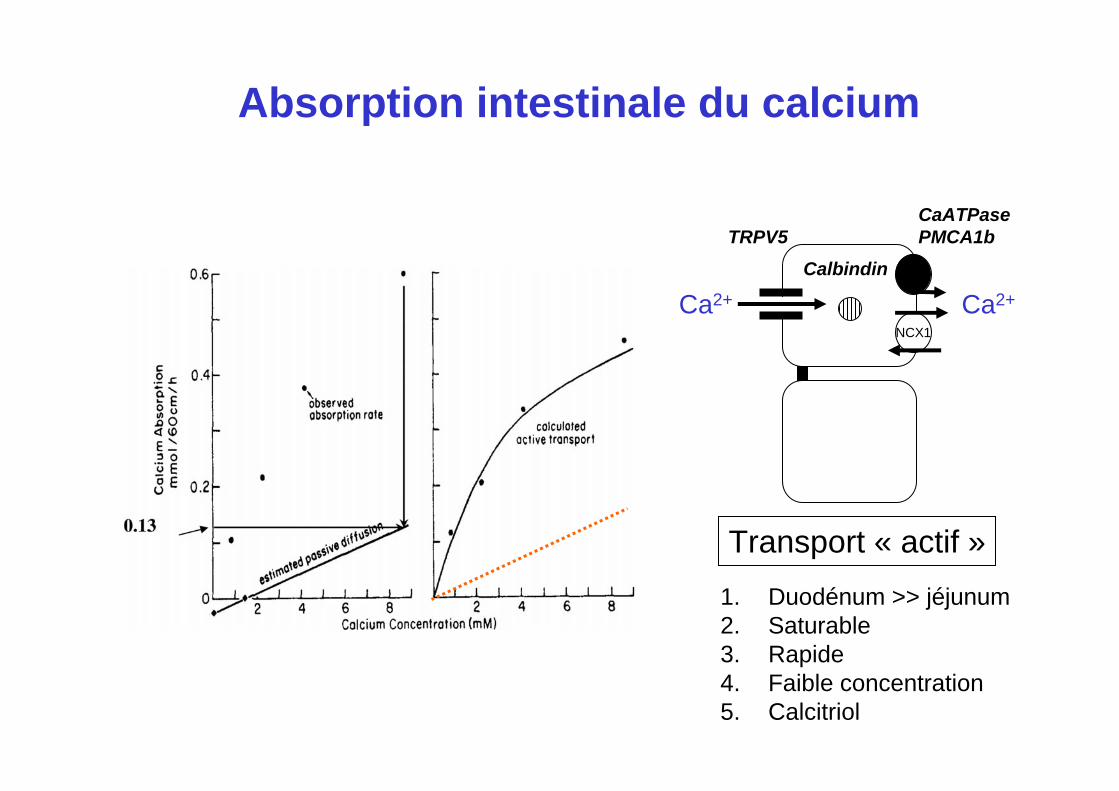
Absorption intestinale du calcium
1. Duodénum >> jéjunum2. Saturable3. Rapide4. Faible concentration5. Calcitriol
Transport « actif »
CaATPasePMCA1b
Ca2+
NCX1
Ca2+
TRPV5Calbindin
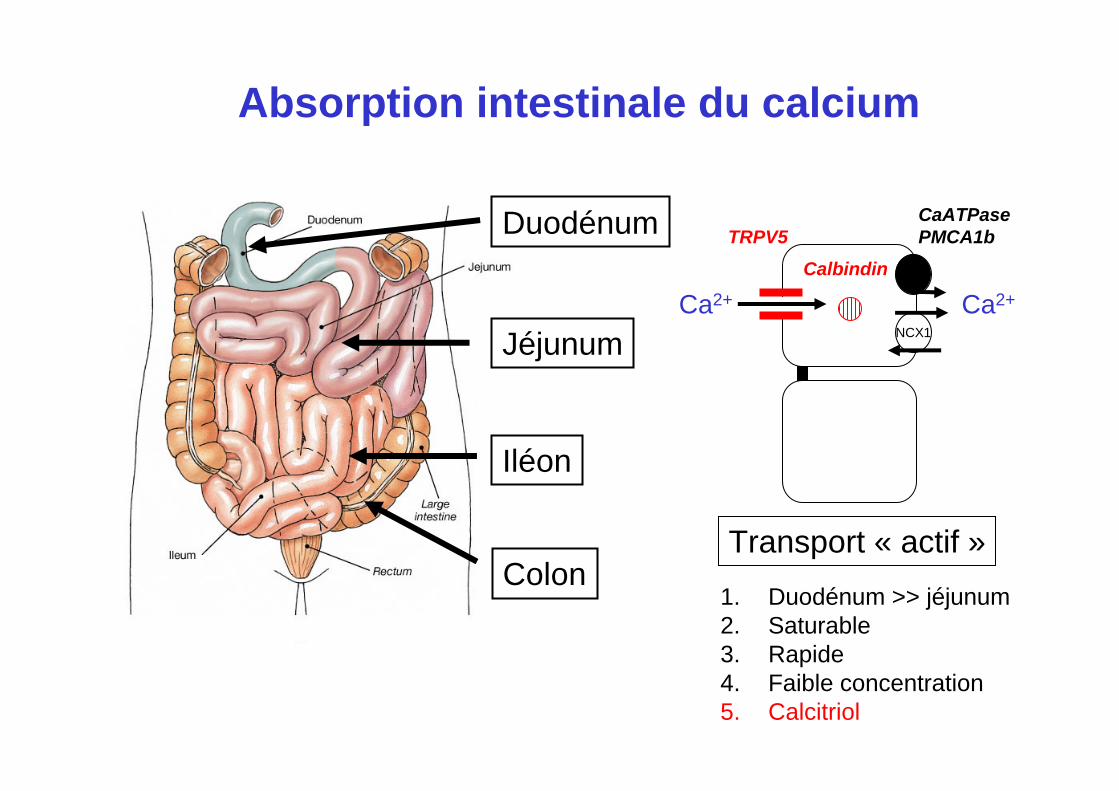
Absorption intestinale du calcium
1. Duodénum >> jéjunum2. Saturable3. Rapide4. Faible concentration5. Calcitriol
Transport « actif »
CaATPasePMCA1b
Ca2+
NCX1
Ca2+
TRPV5Calbindin
Absorption intestinale du calcium
1. Duodénum >> jéjunum2. Saturable3. Rapide4. Faible concentration5. Calcitriol
Transport « actif »
Duodénum
Jéjunum
Iléon
Colon
CaATPasePMCA1b
Ca2+
NCX1
Ca2+
TRPV5Calbindin
Absorption intestinale du calcium
1. Duodénum >> jéjunum2. Saturable3. Rapide4. Faible concentration5. Calcitriol
Transport « actif »
Duodénum
Jéjunum
Iléon
Colon
Ca2+ Ca2+
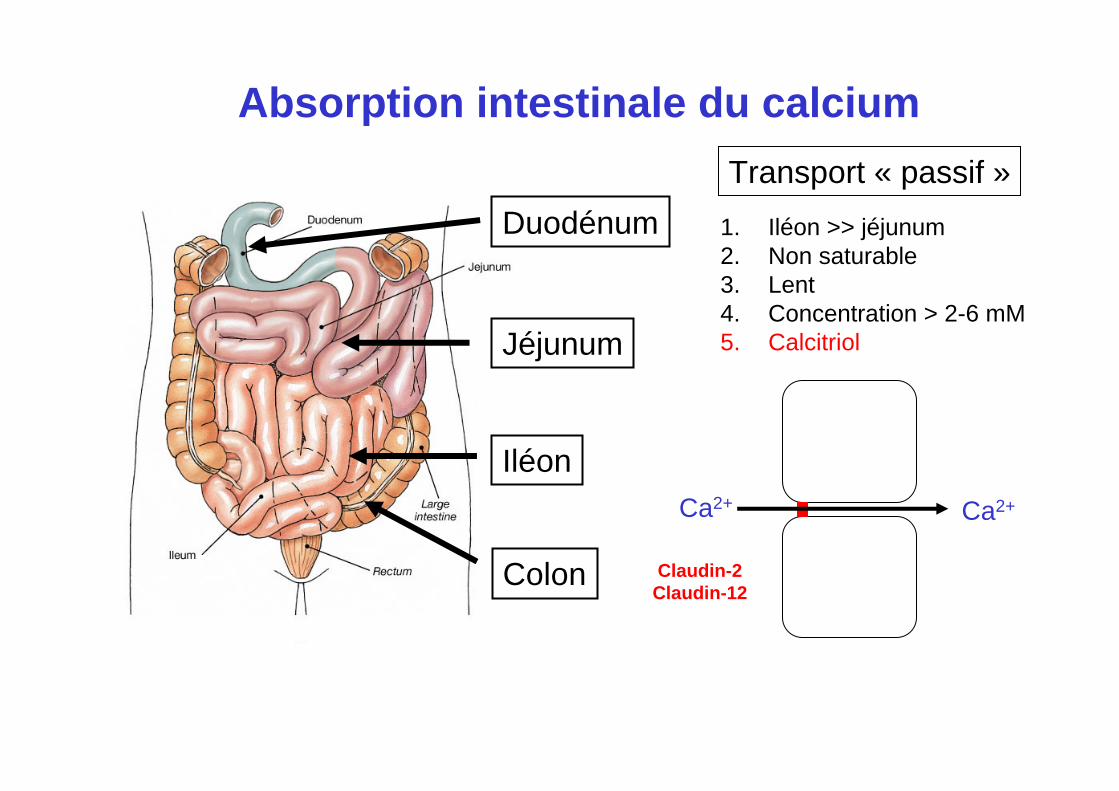
Absorption intestinale du calcium
1. Iléon >> jéjunum2. Non saturable3. Lent4. Concentration > 2-6 mM5. Calcitriol
Transport « passif »
Claudin-2Claudin-12
Ca2+ Ca2+
Absorption intestinale du calciumTransport « passif »
Claudin-2Claudin-12
Fujita et al 2008 Mol Biol Cell 19:1912
1. Iléon >> jéjunum2. Non saturable3. Lent4. Concentration > 2-6 mM5. Calcitriol
CaATPasePMCA1b
Ca2+
NCX1
Ca2+
TRPV5
Ca2+ Ca2+
Calbindin
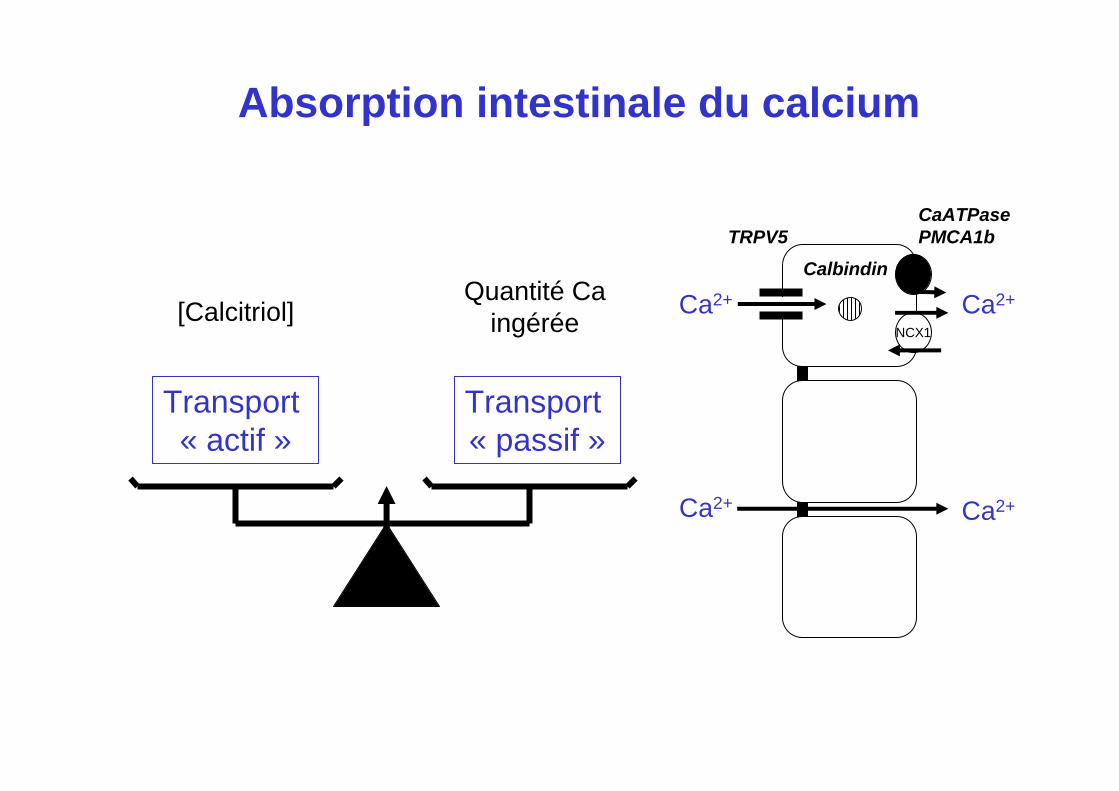
Absorption intestinale du calcium
Transport « actif »
Transport « passif »
[Calcitriol]Quantité Ca
ingérée
Duodénum
Jéjunum
Iléon
Colon
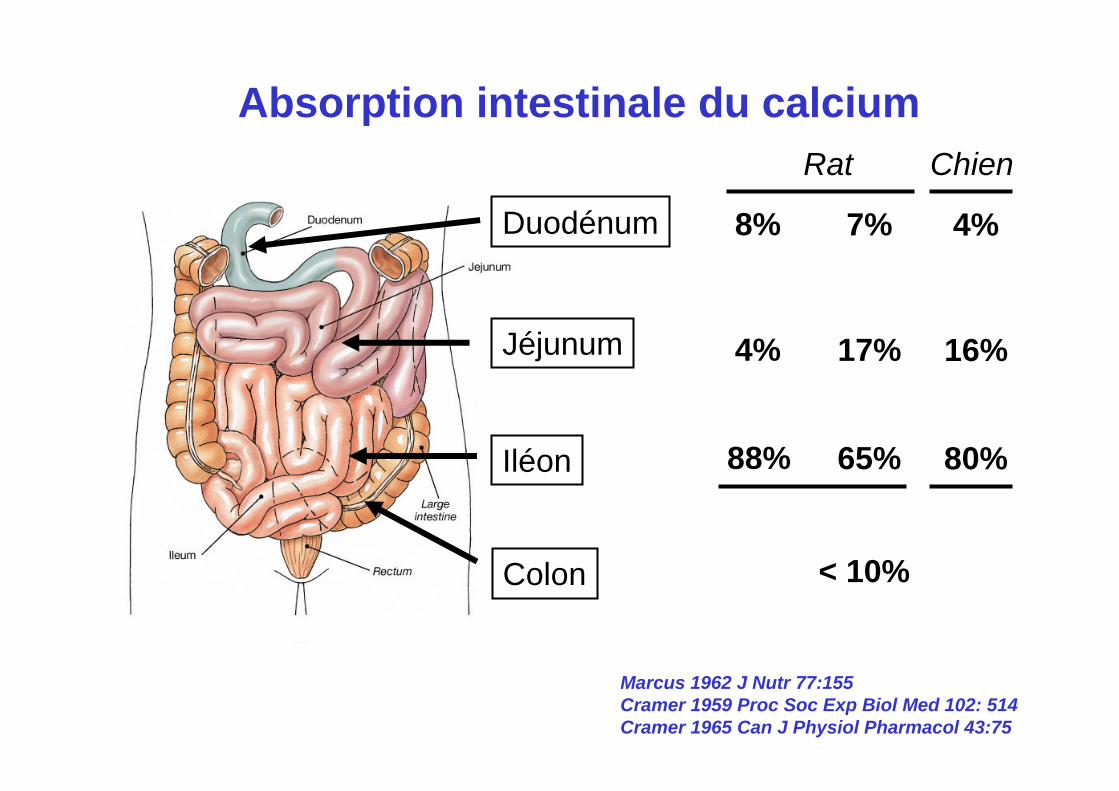
Absorption intestinale du calcium
8%
4%
88%
7%
17%
65%
4%
16%
80%
Rat Chien
< 10%
Marcus 1962 J Nutr 77:155Cramer 1959 Proc Soc Exp Biol Med 102: 514Cramer 1965 Can J Physiol Pharmacol 43:75
Duodénum
Jéjunum
Iléon
Colon
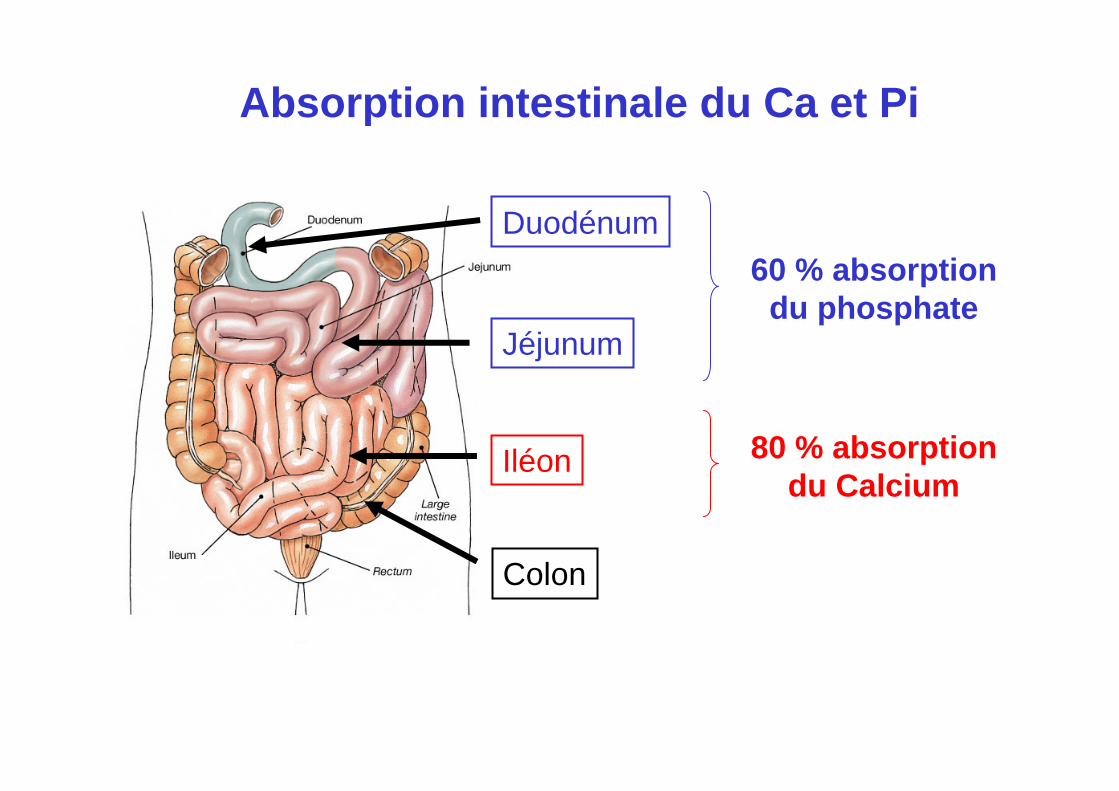
Absorption intestinale du Ca et Pi
60 % absorptiondu phosphate
80 % absorptiondu Calcium
Ca2+
absorption Intestinale
Bifteck (80g)Frites (100g)
Fromage (30g)
Fèces
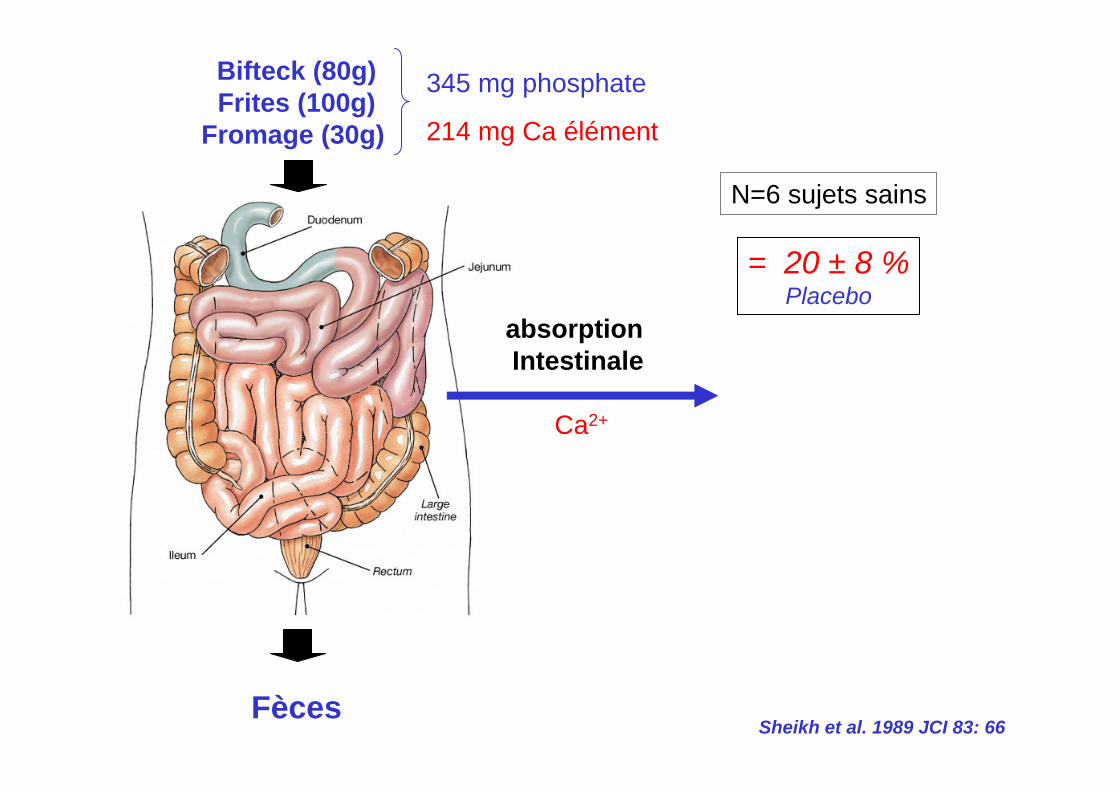
= 20 ± 8 %Placebo
Sheikh et al. 1989 JCI 83: 66
N=6 sujets sains
345 mg phosphate
214 mg Ca élément
Ca2+
absorption Intestinale
Bifteck (80g)Frites (100g)
Fromage (30g)
Fèces
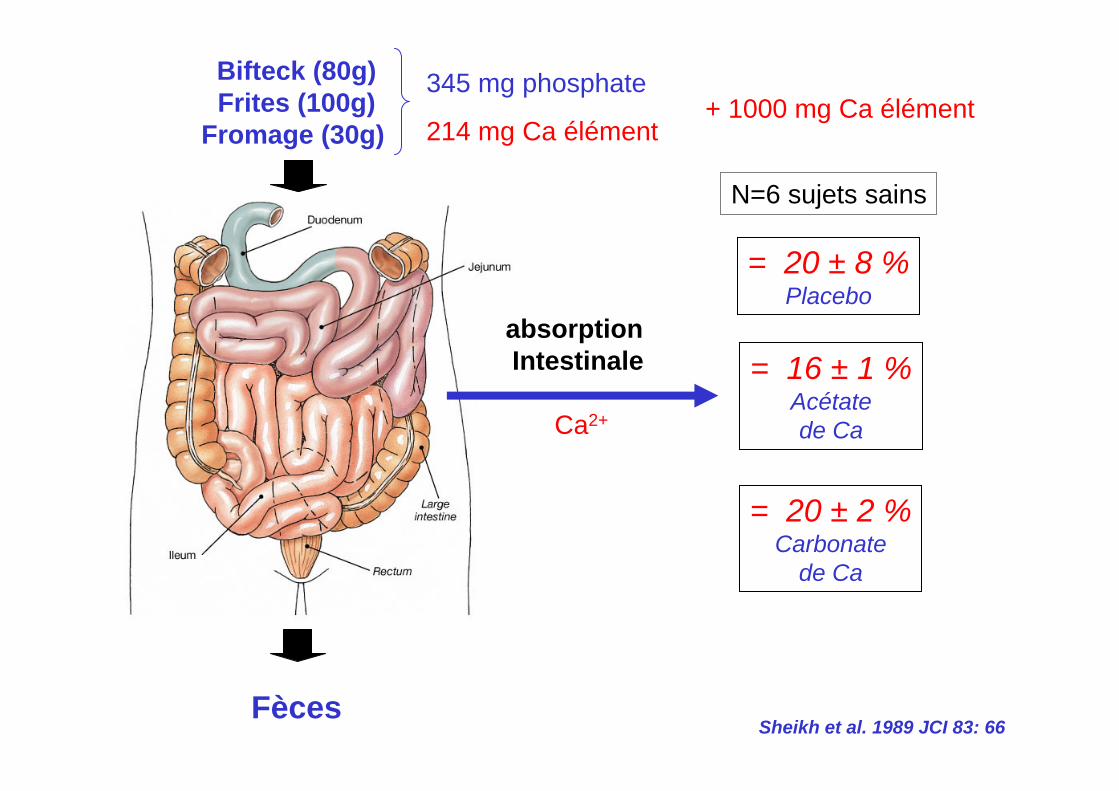
= 20 ± 8 %Placebo
= 16 ± 1 %Acétatede Ca
= 20 ± 2 %Carbonate
de Ca
Sheikh et al. 1989 JCI 83: 66
N=6 sujets sains
345 mg phosphate+ 1000 mg Ca élément
214 mg Ca élément
Ca2+
absorption Intestinale
Bifteck (80g)Frites (100g)
Fromage (30g)
Fèces
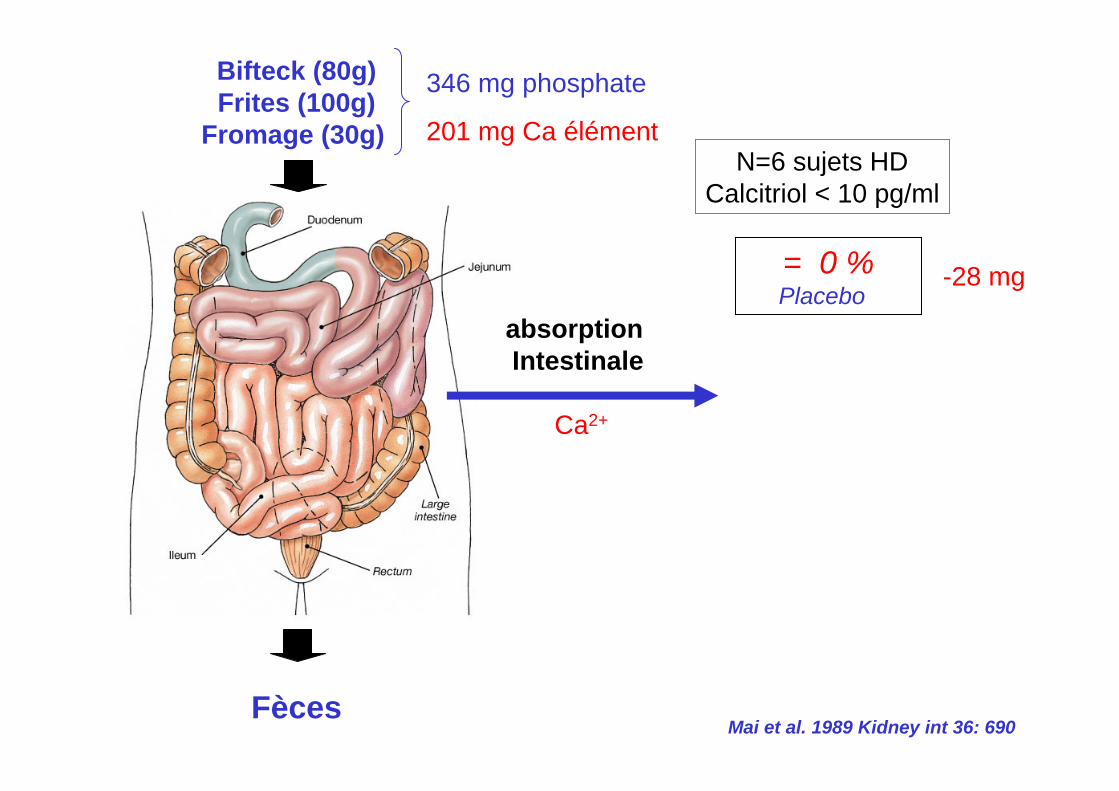
= 0 %Placebo
-28 mg
N=6 sujets HDCalcitriol < 10 pg/ml
Mai et al. 1989 Kidney int 36: 690
346 mg phosphate
201 mg Ca élément
Ca2+
absorption Intestinale
Bifteck (80g)Frites (100g)
Fromage (30g)
Fèces
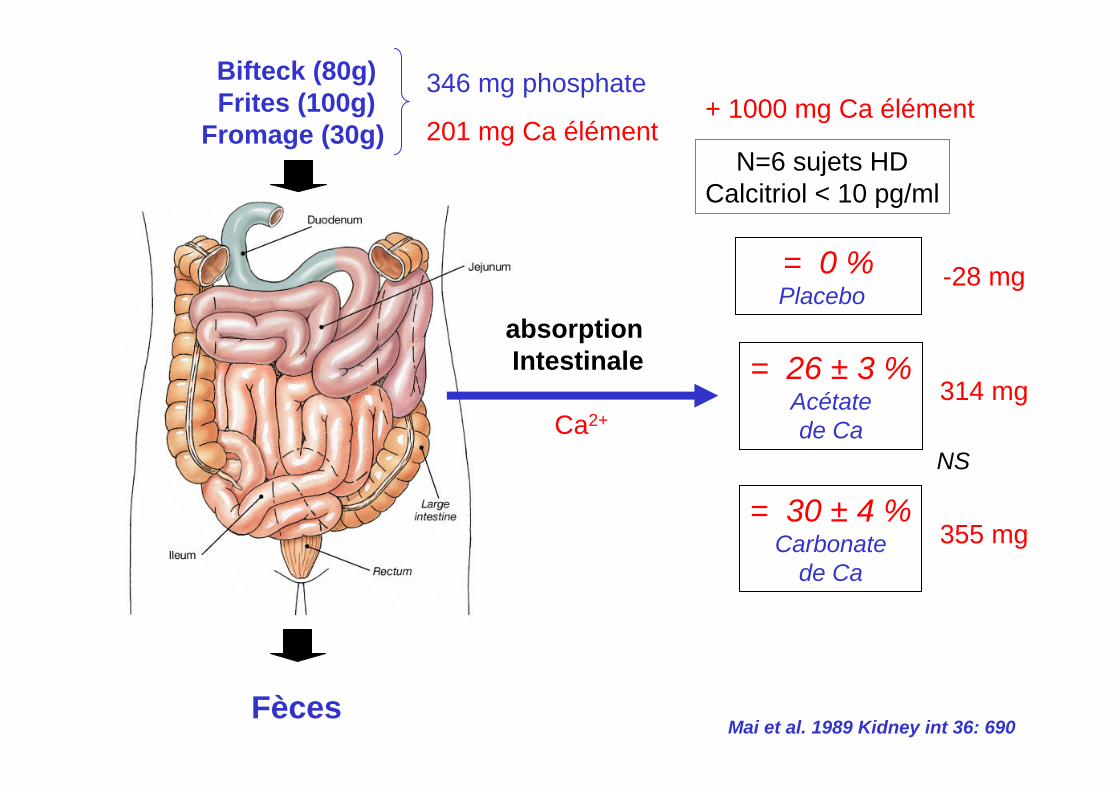
= 0 %Placebo
= 26 ± 3 %Acétatede Ca
= 30 ± 4 %Carbonate
de Ca
NS
-28 mg
314 mg
355 mg
N=6 sujets HDCalcitriol < 10 pg/ml
Mai et al. 1989 Kidney int 36: 690
346 mg phosphate+ 1000 mg Ca élément
201 mg Ca élément
Ph2,08 ± 0,53
1,51 ± 0,39
1,99 ± 0,62
1,34 ± 0,41,2
1,4
1,6
1,8
2
2,2
2,4
2,6
Ca Ac 1,02 ± 0,33 g/j CaC03 1,88 ± 0,96 g/j
7 semaines 7 semaines
N=12
mM
Schaefer et al. 1991 NDT 6:170
Comparaison du CaCO3 et CaAc
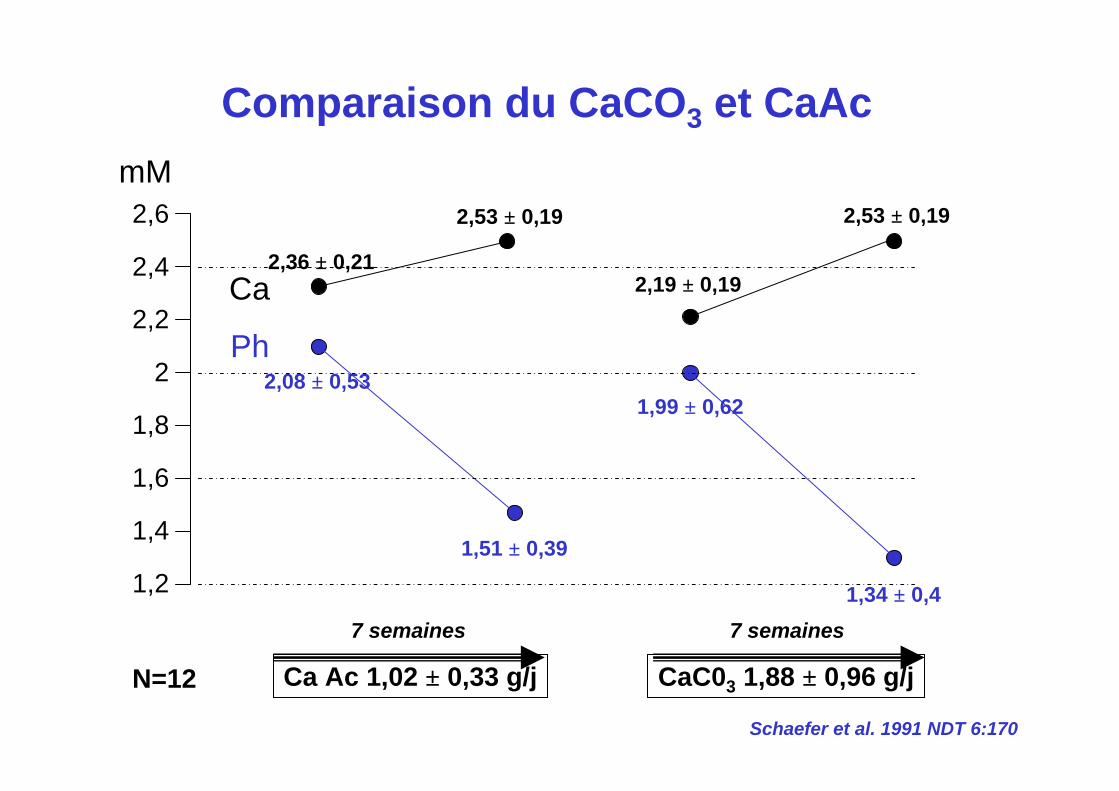
Ca
Ph
2,36 ± 0,21
2,53 ± 0,19
2,19 ± 0,19
2,08 ± 0,53
1,51 ± 0,39
1,99 ± 0,62
1,34 ± 0,41,2
1,4
1,6
1,8
2
2,2
2,4
2,6 2,53 ± 0,19
Ca Ac 1,02 ± 0,33 g/j CaC03 1,88 ± 0,96 g/j
7 semaines 7 semaines
N=12
mM
Schaefer et al. 1991 NDT 6:170
Comparaison du CaCO3 et CaAc
Comparaison du CaCO3 et CaAc
Delmez, 1992 JASN 3:9620 patients pendant 6 mois
Hypercalcémie
Phosphorémie
PTH
Ca élément g/j
8,7%
1,52 ± 0,06
403 ± 80
2,8 ± 0,3
8,3%
1,71 ± 0,06
454 ± 74
1,4 ± 0,1
Calcémie 2,54 ± 0,02 2,49 ± 0,02
CaCO3 CaAc
p <0,05
Ben Hamida, 1993 Nephron 63:258
Comparaison du CaCO3 et CaAc
28 patients pendant 6 mois
Hypercalcémie
Phosphorémie
PTH
Ca élément g/j
8,2%
1,82 ± 0,26
121 ± 153
2,37 ± 1,47
8%
1,73 ± 0,23
122 ± 69
1,24 ± 0,52
Calcémie 2,47 ± 0,11 2,5 ± 0,10
CaCO3 CaAc
p <0,05
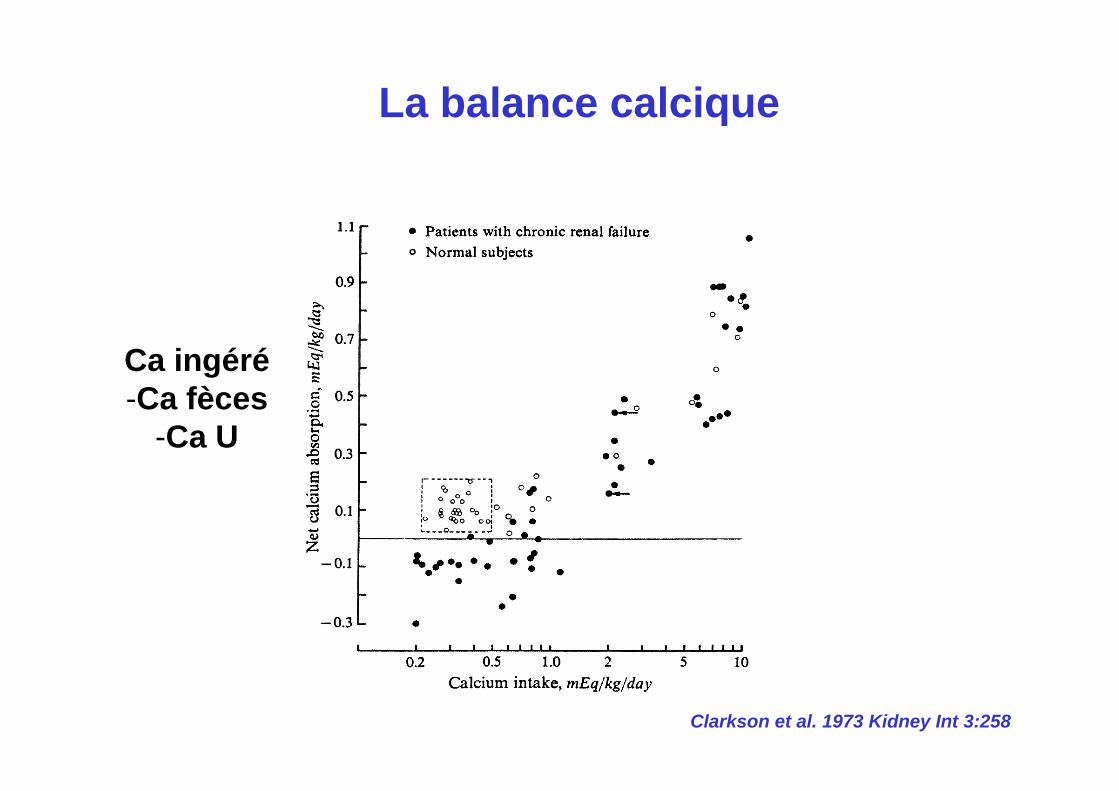
Clarkson et al. 1973 Kidney Int 3:258
Ca ingéré-Ca fèces
-Ca U
La balance calcique
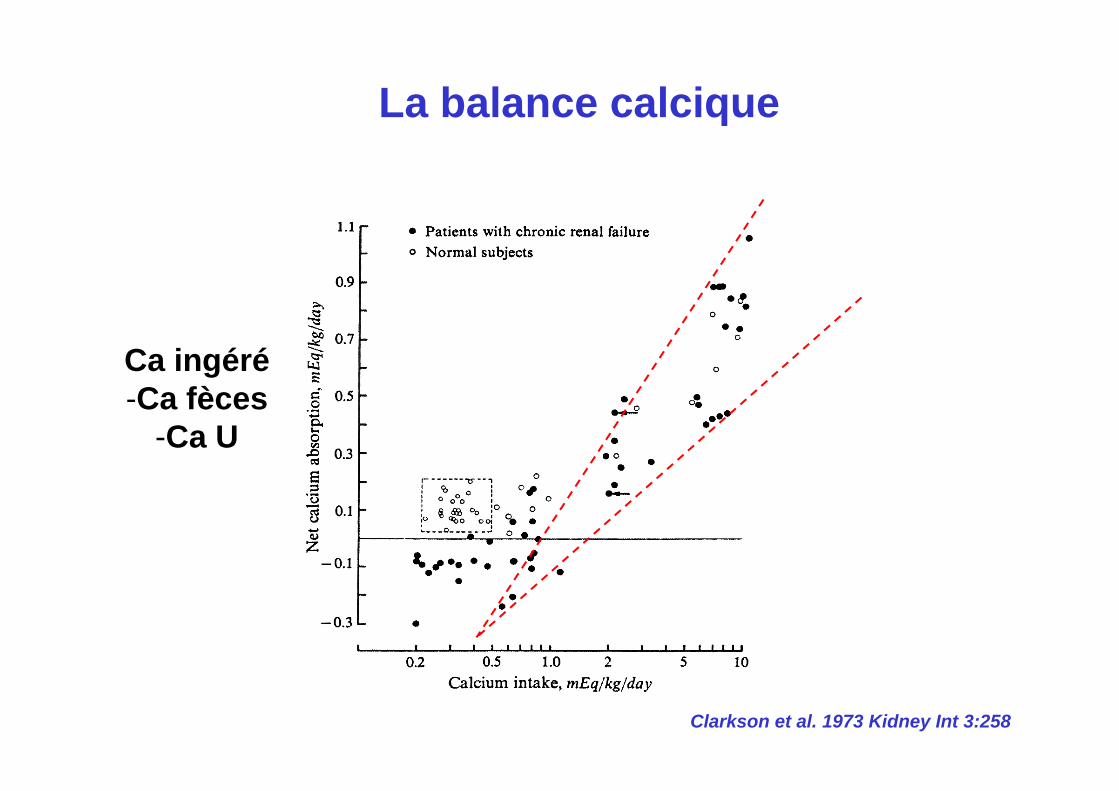
Clarkson et al. 1973 Kidney Int 3:258
La balance calcique
Ca ingéré-Ca fèces
-Ca U
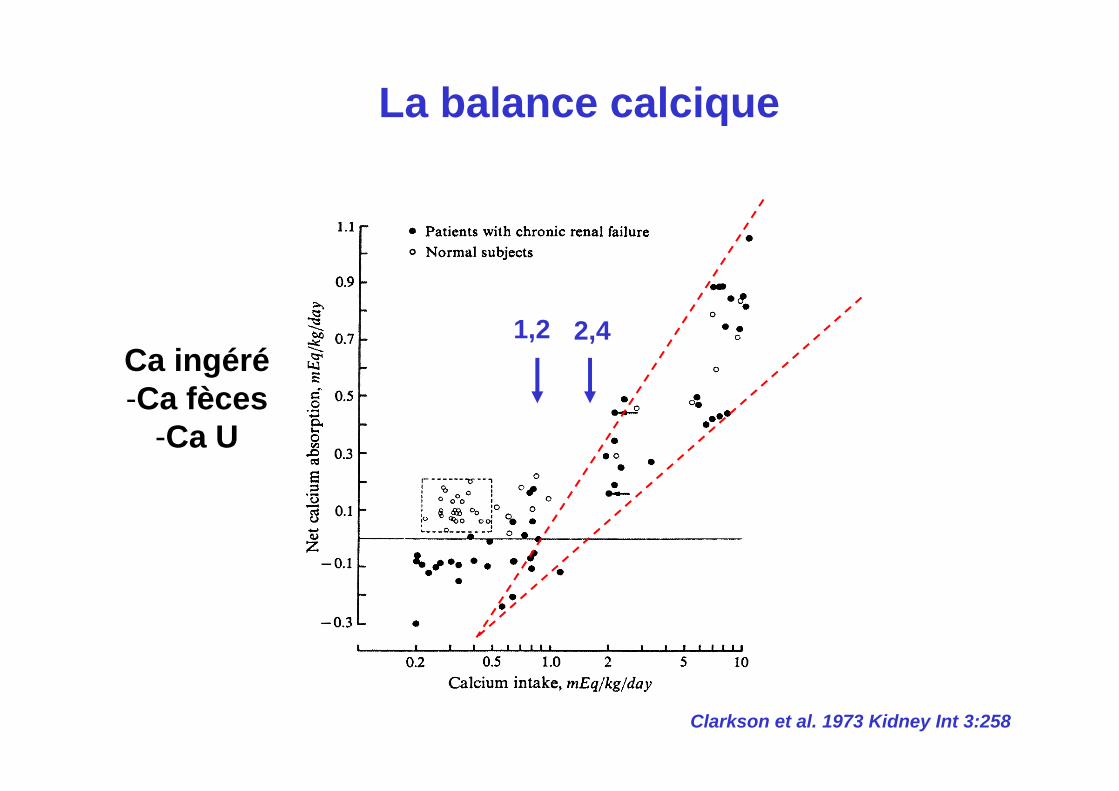
Clarkson et al. 1973 Kidney Int 3:258
La balance calcique
Ca ingéré-Ca fèces
-Ca U
1,2 2,4
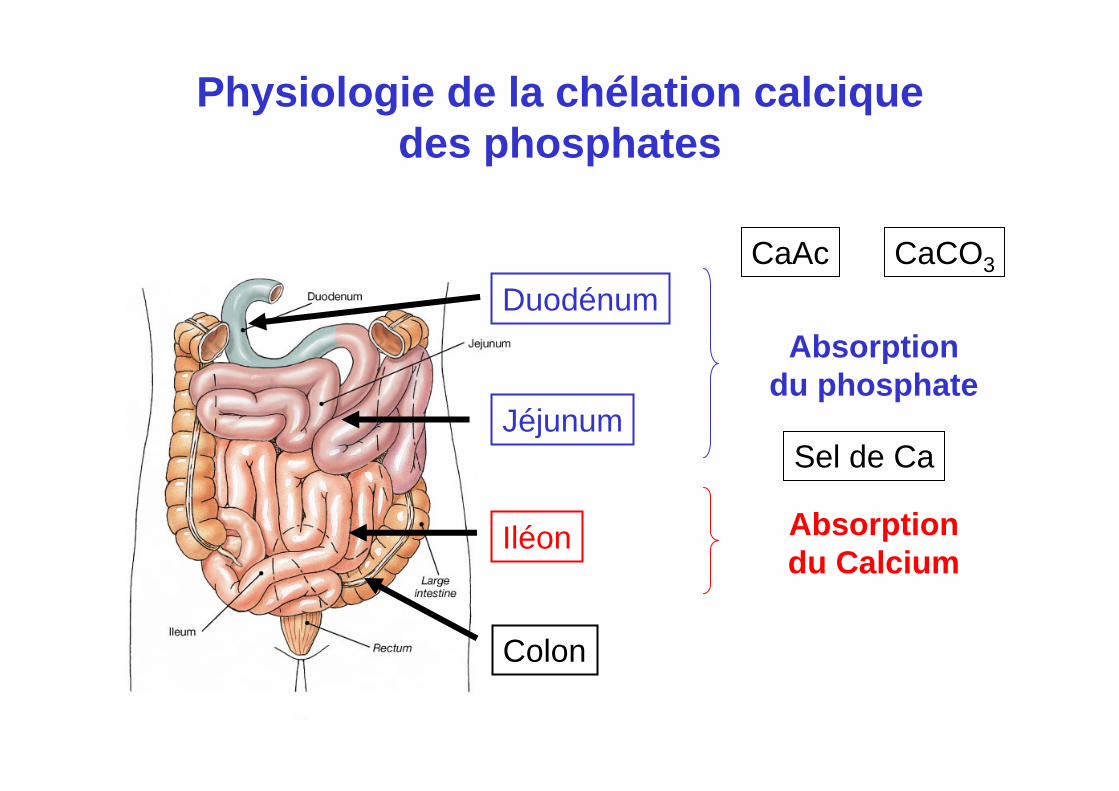
Duodénum
Jéjunum
Iléon
Colon
Absorptiondu phosphate
Absorptiondu Calcium
CaCO3CaAc
Sel de Ca
Physiologie de la chélation calcique des phosphates
Cardiovascular Calcification in Patients with ESRDImpact of Phosphate Binders
Wajeh Qunibi, MD, FACP
Professor of MedicineMedical Director of Dialysis Services
University of Texas Health Science Center
San Antonio, TX
Paris-France 1/21/2009
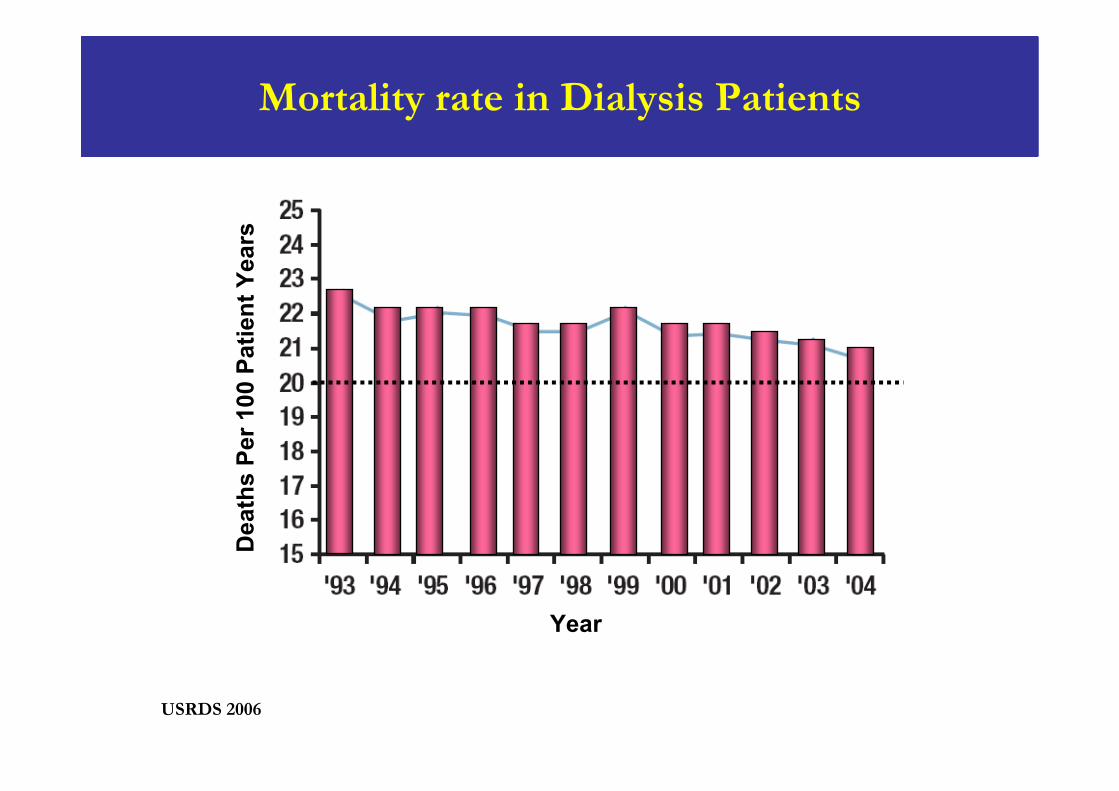
Mortality rate in Dialysis Patients
USRDS 2006
Year
Dea
ths
Per 1
00 P
atie
nt Y
ears
Corrected Serum Calcium (mg/dL)
<8.0
8.0 - 8.49
8.5 - 8.99
9.0 - 9.49
9.5 - 9.99
10.0 - 10.49
10.5 - 10.99
>=11.0
All-
Cau
se D
eath
Haz
ard
Rat
io
0.7
1.5
2
3
1
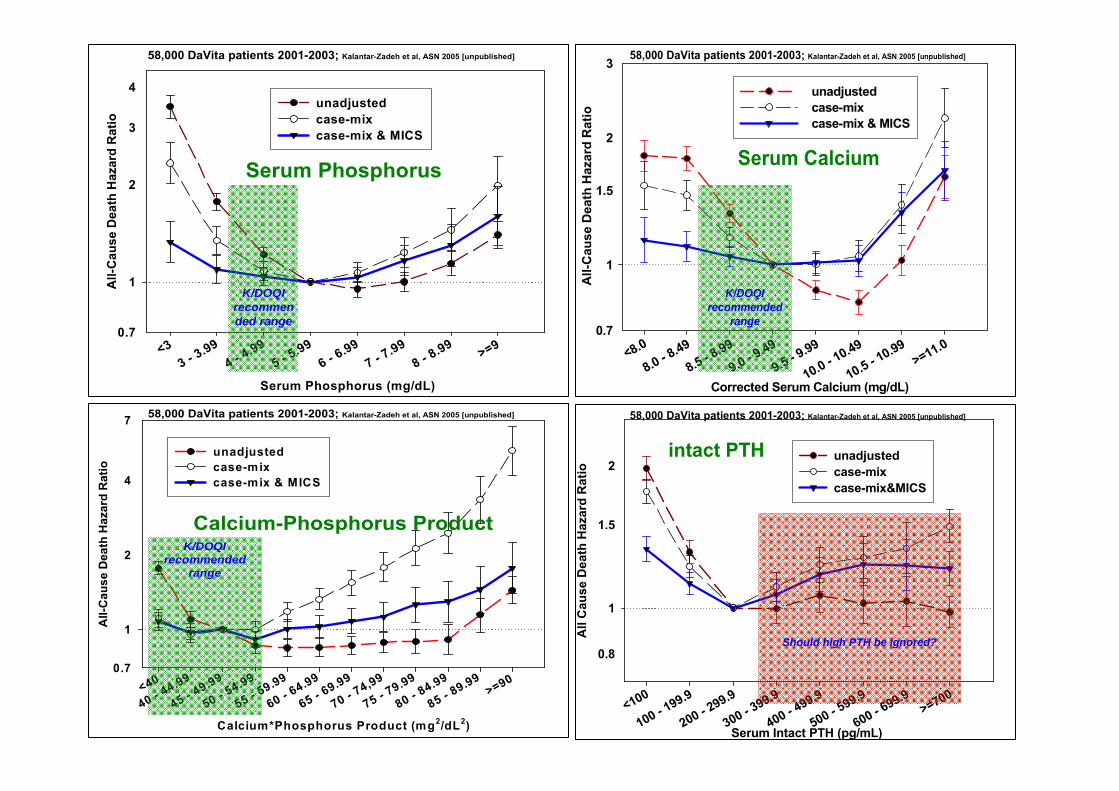
unadjustedcase-mixcase-mix & MICS
Serum Calcium
58,000 DaVita patients 2001-2003; Kalantar-Zadeh et al, ASN 2005 [unpublished]
K/DOQIrecommended
range
Serum Phosphorus (mg/dL)
<33 - 3
.994 - 4
.995 - 5
.996 - 6
.997 - 7
.998 - 8
.99 >=9
All-
Cau
se D
eath
Haz
ard
Rat
io
0.7
2
3
4
1
unadjustedcase-mixcase-mix & MICS
58,000 DaVita patients 2001-2003; Kalantar-Zadeh et al, ASN 2005 [unpublished]
Serum Phosphorus
K/DOQIrecommended range
Calcium*Phosphorus Product (mg2/dL2)
<40
40 - 44.99
45 - 49.99
50 - 54.99
55 - 59.99
60 - 64.99
65 - 69.99
70 - 74,99
75 - 79.99
80 - 84.99
85 - 89.99
>=90
All-
Cau
se D
eath
Haz
ard
Rat
io
0.7
2
4
7
1
unadjustedcase-mixcase-mix & MICS
58,000 DaVita patients 2001-2003; Kalantar-Zadeh et al, ASN 2005 [unpublished]
Calcium-Phosphorus ProductK/DOQI
recommended range
Serum Intact PTH (pg/mL)
<100
100 - 199.9
200 - 299.9
300 - 399.9
400 - 499.9
500 - 599.9
600 - 699.9
>=700
All
Cau
se D
eath
Haz
ard
Rat
io
0.8
1.5
2
1
unadjustedcase-mixcase-mix&MICS
intact PTH
58,000 DaVita patients 2001-2003; Kalantar-Zadeh et al, ASN 2005 [unpublished]
Should high PTH be ignored?
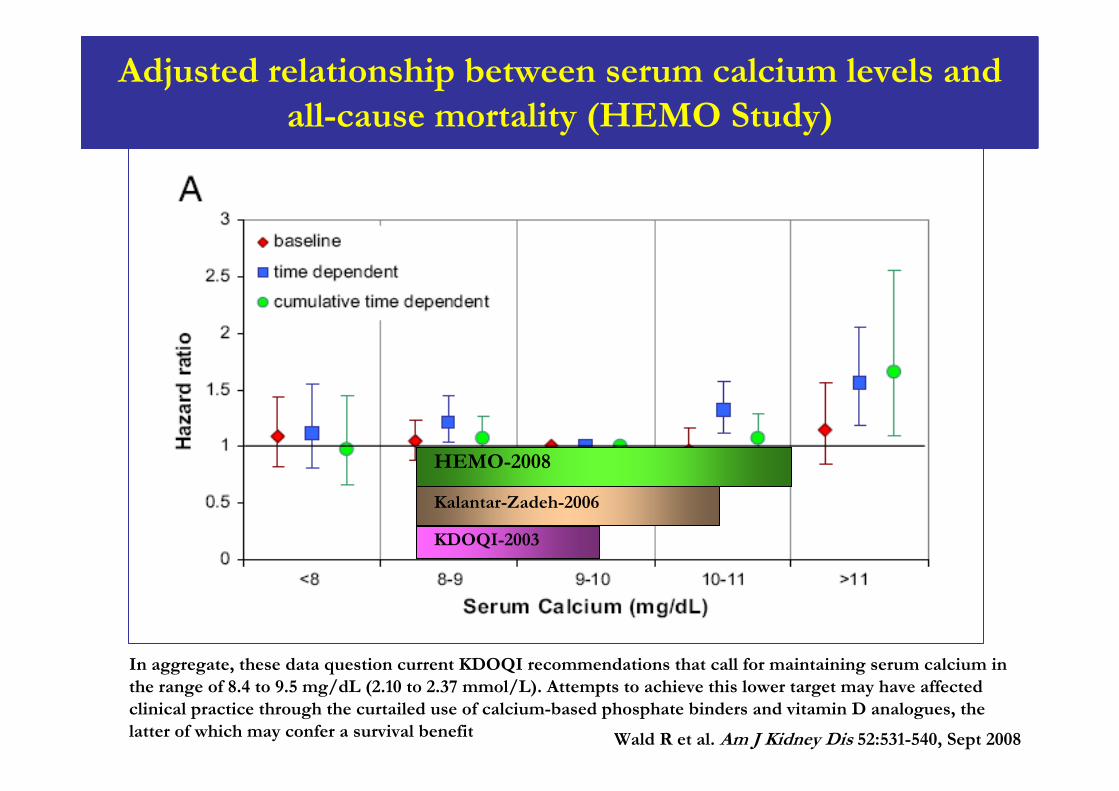
Adjusted relationship between serum calcium levels and all-cause mortality (HEMO Study)
In aggregate, these data question current KDOQI recommendations that call for maintaining serum calcium in the range of 8.4 to 9.5 mg/dL (2.10 to 2.37 mmol/L). Attempts to achieve this lower target may have affected clinical practice through the curtailed use of calcium-based phosphate binders and vitamin D analogues, the latter of which may confer a survival benefit Wald R et al. Am J Kidney Dis 52:531-540, Sept 2008
Kalantar-Zadeh-2006
HEMO-2008
KDOQI-2003
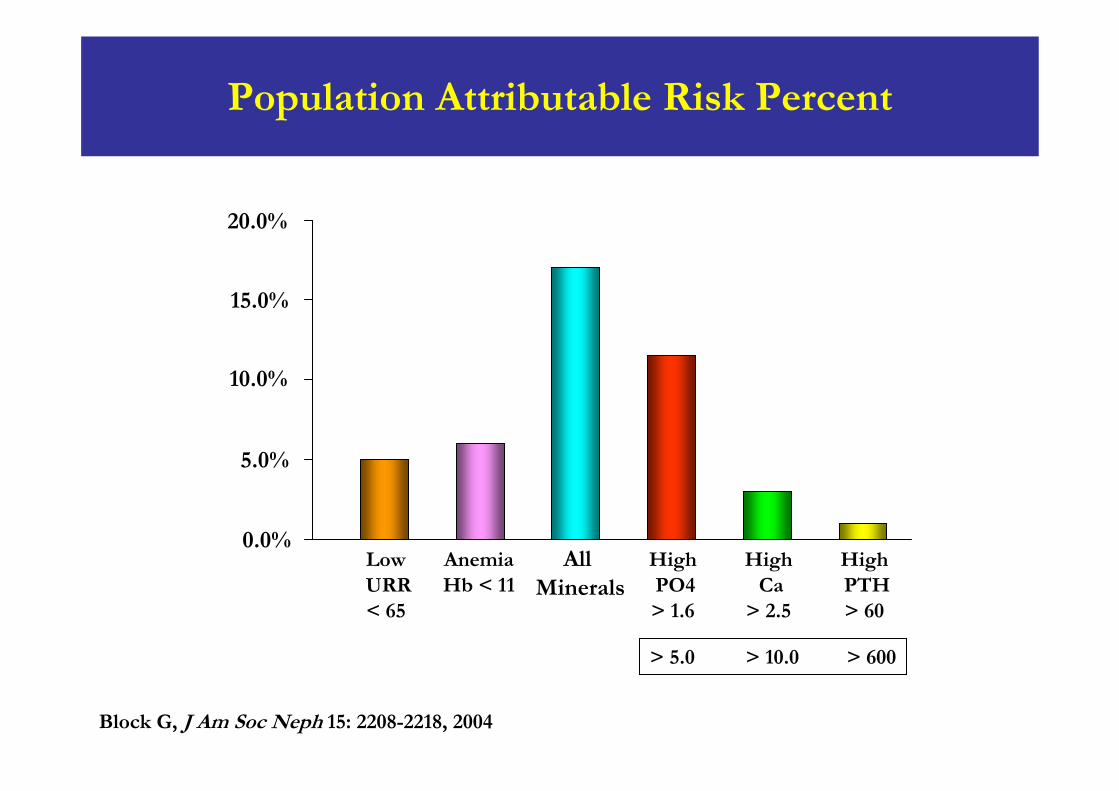
Population Attributable Risk Percent
0.0%
5.0%
10.0%
15.0%
20.0%
AllMinerals
HighPTH> 60
HighCa
> 2.5
HighPO4> 1.6
AnemiaHb < 11
LowURR< 65
Block G, J Am Soc Neph 15: 2208-2218, 2004
> 5.0 > 10.0 > 600
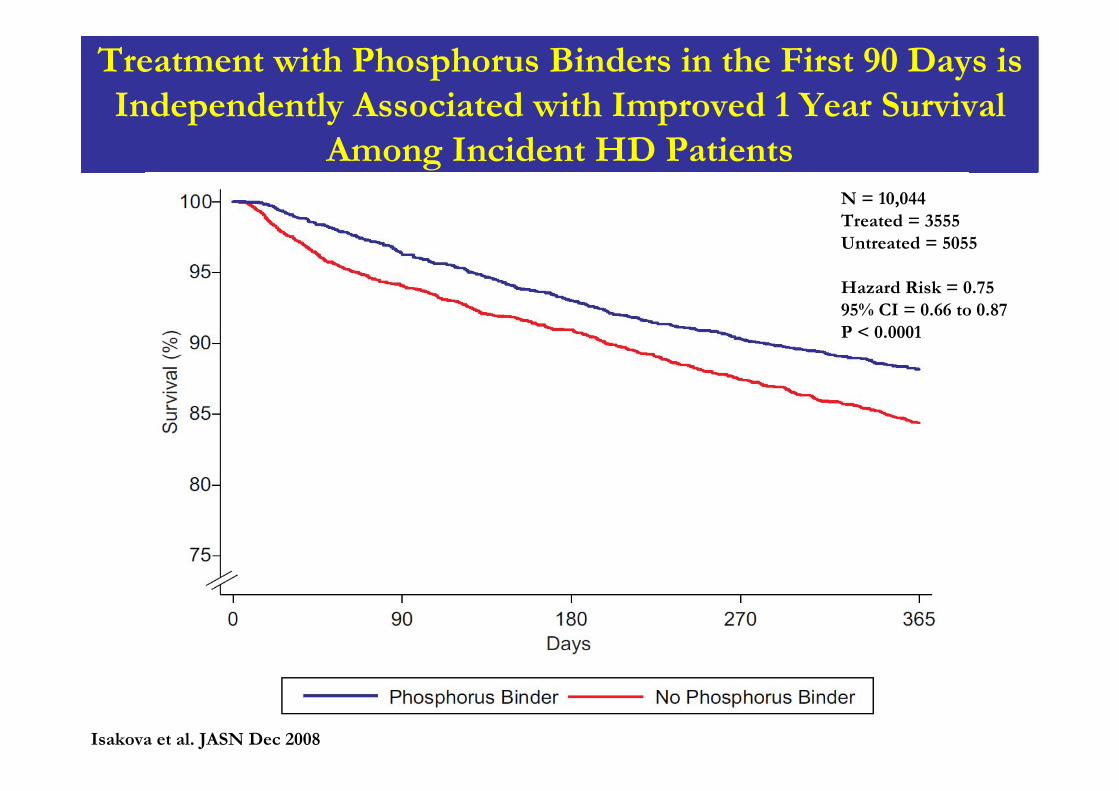
Treatment with Phosphorus Binders in the First 90 Days is Independently Associated with Improved 1 Year Survival
Among Incident HD PatientsN = 10,044Treated = 3555Untreated = 5055
Hazard Risk = 0.7595% CI = 0.66 to 0.87P < 0.0001
Isakova et al. JASN Dec 2008
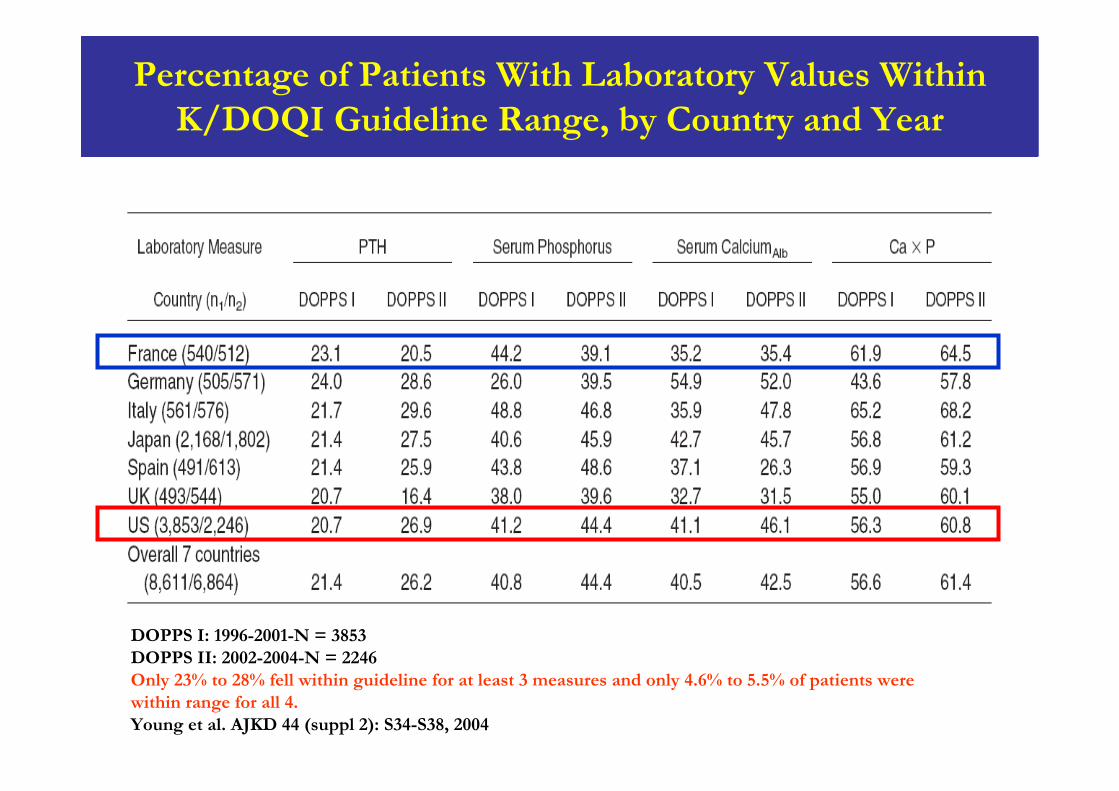
Percentage of Patients With Laboratory Values Within K/DOQI Guideline Range, by Country and Year
DOPPS I: 1996-2001-N = 3853DOPPS II: 2002-2004-N = 2246Only 23% to 28% fell within guideline for at least 3 measures and only 4.6% to 5.5% of patients were within range for all 4.Young et al. AJKD 44 (suppl 2): S34-S38, 2004

Phosphate Binders
Aluminum Hydroxide
Calcium-based phosphate binders (CBPB):Calcium AcetateCalcium Carbonate
Non-calcium, non-aluminum phosphate binders:Sevelamer HClSevelamer carbonateLanthanum Carbonate
Other investigational binders
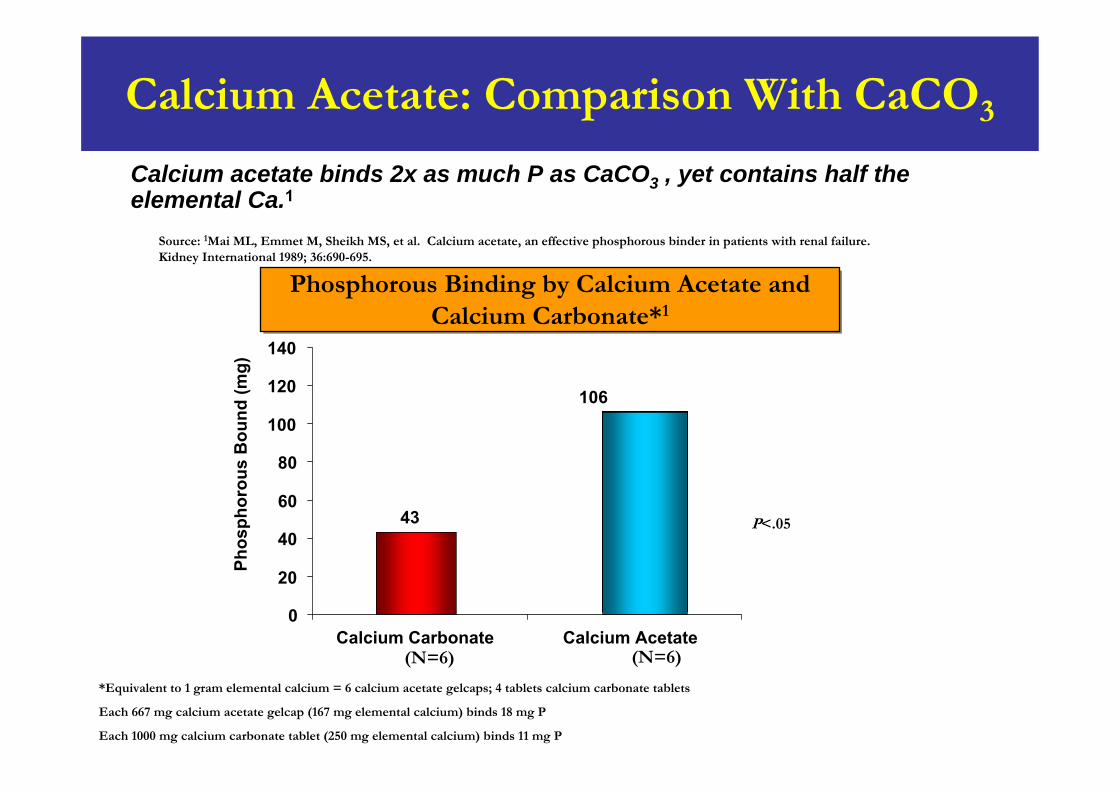
Calcium Acetate: Comparison With CaCO3
Calcium acetate binds 2x as much P as CaCO3 , yet contains half the elemental Ca.1
Phosphorous Binding by Calcium Acetate and Calcium Carbonate*1
Phosphorous Binding by Calcium Acetate and Calcium Carbonate*1
Source: 1Mai ML, Emmet M, Sheikh MS, et al. Calcium acetate, an effective phosphorous binder in patients with renal failure. Kidney International 1989; 36:690-695.
*Equivalent to 1 gram elemental calcium = 6 calcium acetate gelcaps; 4 tablets calcium carbonate tablets
Each 667 mg calcium acetate gelcap (167 mg elemental calcium) binds 18 mg P
Each 1000 mg calcium carbonate tablet (250 mg elemental calcium) binds 11 mg P
P<.05
(N=6)(N=6)
43
106
0
20
40
60
80
100
120
140
Calcium Carbonate Calcium Acetate
Phos
phor
ous
Bou
nd (m
g)
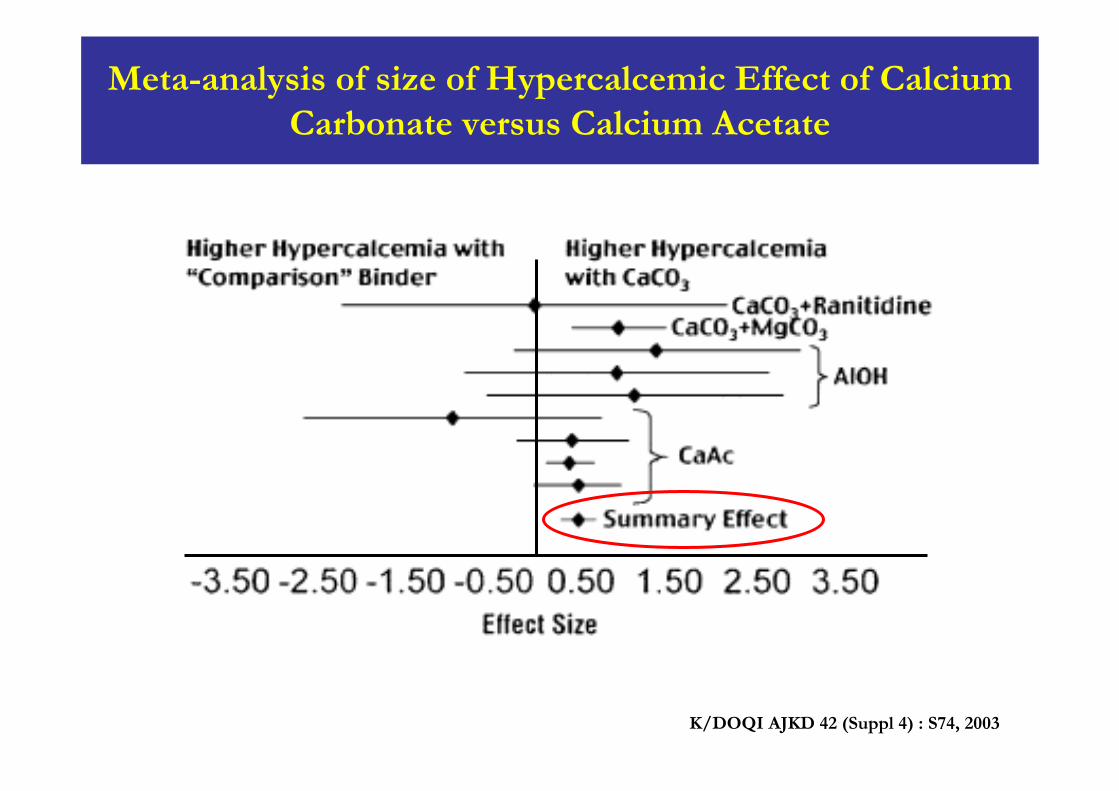
Meta-analysis of size of Hypercalcemic Effect of Calcium Carbonate versus Calcium Acetate
K/DOQI AJKD 42 (Suppl 4) : S74, 2003
100
pH 5pH 5
pH 3pH 3
pH 7pH 7
Ph
osp
hor
us
Ph
osp
hor
us
Rem
oved
Rem
oved
(%)
(%)
0
20
40
60
80
LanthanumLanthanumcarbonatecarbonate
CalciumCalciumcarbonatecarbonate
CalciumCalciumacetateacetate
AluminumAluminumhydroxidehydroxide
0
20
40
60
80
100
LanthanumLanthanumcarbonatecarbonate
CalciumCalciumcarbonatecarbonate
CalciumCalciumacetateacetate
AluminumAluminumhydroxidehydroxide
0
20
40
60
80
100
LanthanumLanthanumcarbonatecarbonate
CalciumCalciumcarbonatecarbonate
CalciumCalciumacetateacetate
AluminumAluminumhydroxidehydroxide
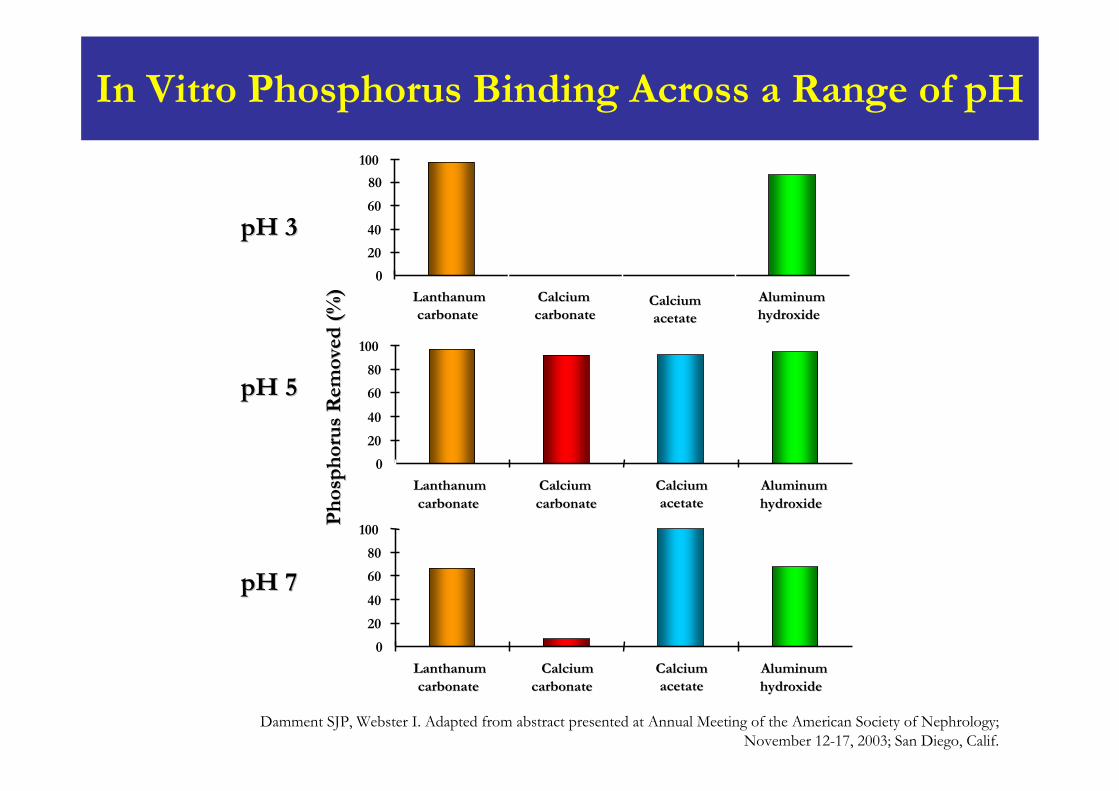
Damment SJP, Webster I. Adapted from abstract presented at Annual Meeting of the American Society of Nephrology;November 12-17, 2003; San Diego, Calif.
In Vitro Phosphorus Binding Across a Range of pH
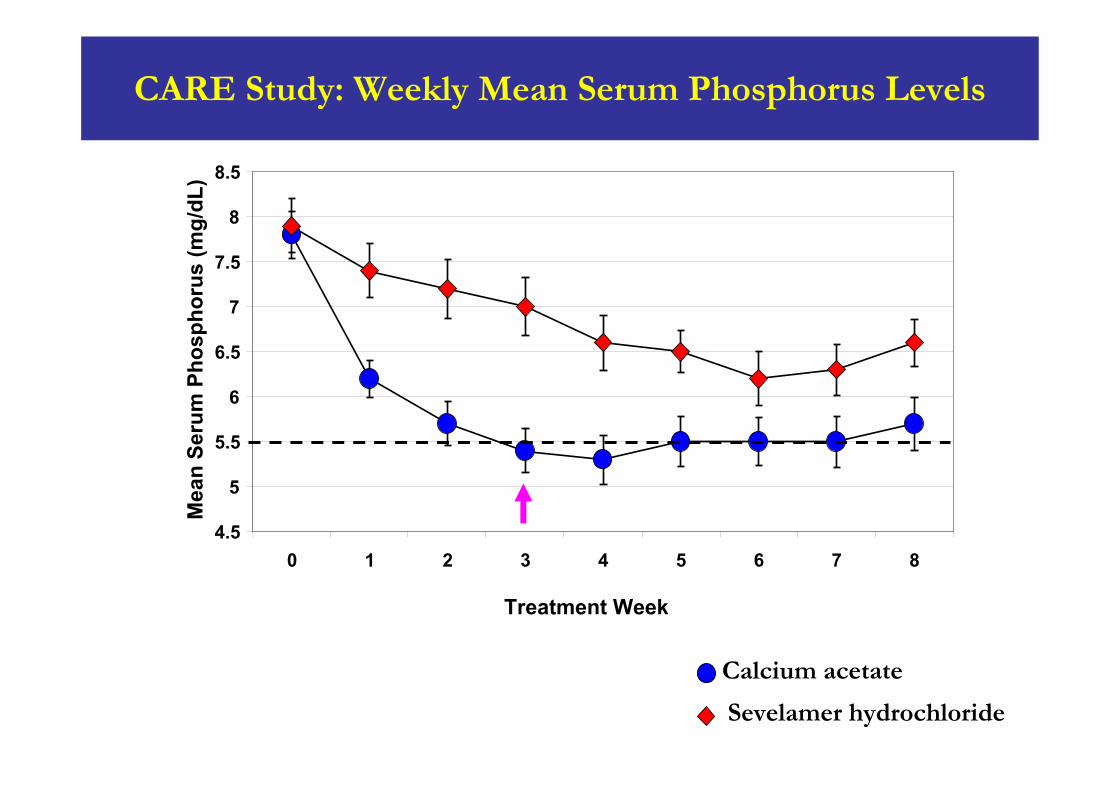
Calcium acetate
Sevelamer hydrochloride
Time-average concentration (Cavg) wks 1- 8; 1.08 mg/dL difference, p = 0.0006
CARE Study: Weekly Mean Serum Phosphorus Levels
4.5
5
5.5
6
6.5
7
7.5
8
8.5
0 1 2 3 4 5 6 7 8
Treatment Week
Mea
n Se
rum
Pho
spho
rus
(mg/
dL)
Time average concentration (Cavg) wks 1-80.63 mg/dL difference; p < 0.0001
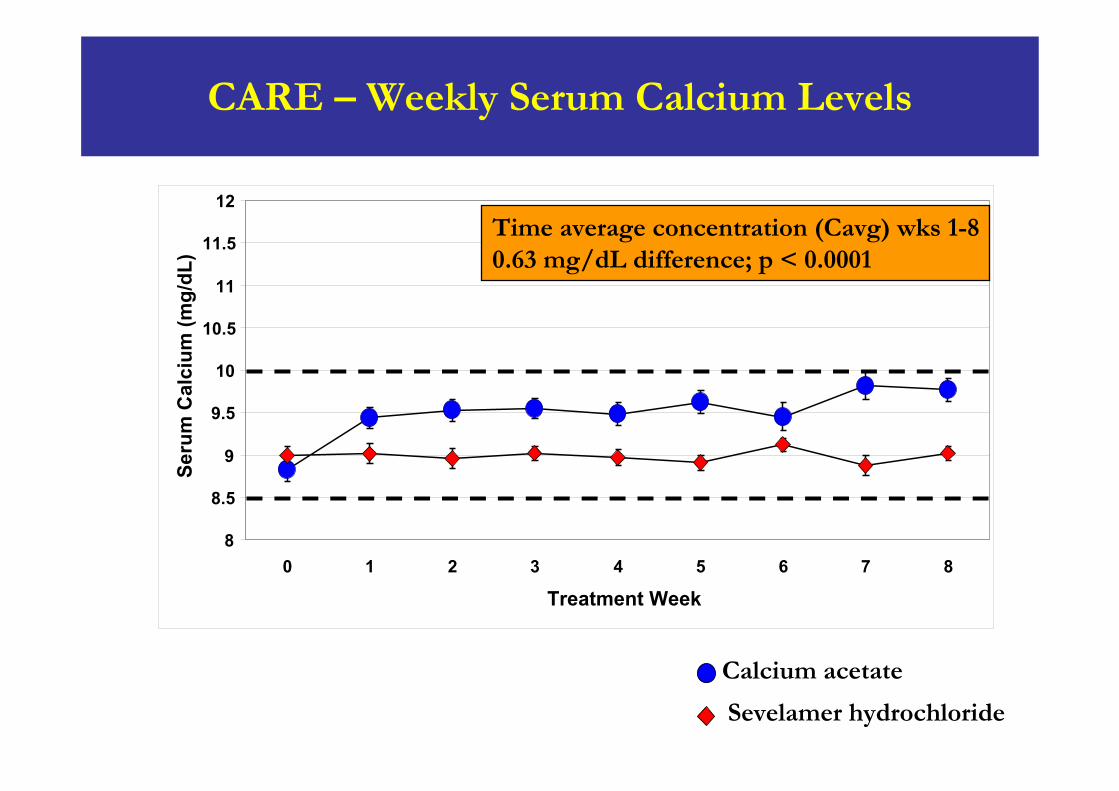
CARE – Weekly Serum Calcium Levels
Calcium acetate
Sevelamer hydrochloride
8
8.5
9
9.5
10
10.5
11
11.5
12
0 1 2 3 4 5 6 7 8
Treatment Week
Seru
m C
alci
um (m
g/dL
)
Time average concentration (Cavg) wks 1-80.63 mg/dL difference; p < 0.0001
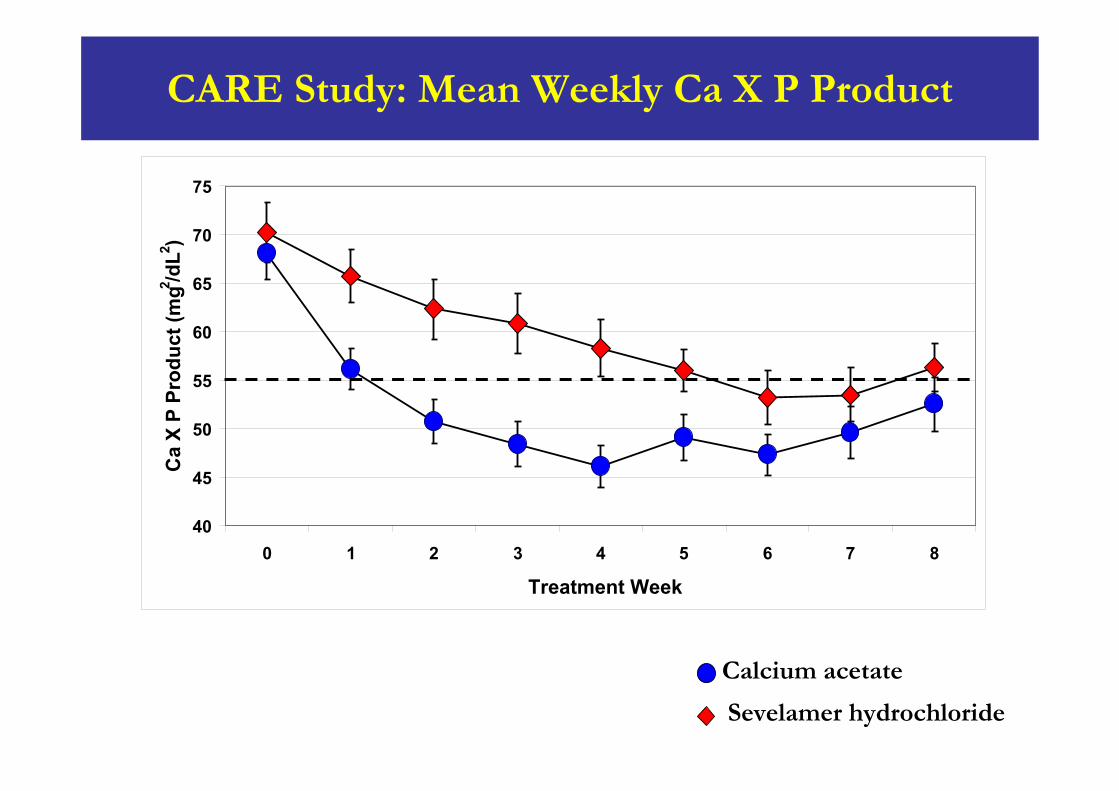
Time-average concentration (Cavg) wks 1-86.1 mg/dL difference; p = 0.022
40
45
50
55
60
65
70
75
0 1 2 3 4 5 6 7 8
Treatment Week
Ca
X P
Prod
uct (
mg2 /d
L2 )
Calcium acetate
Sevelamer hydrochloride
CARE Study: Mean Weekly Ca X P Product
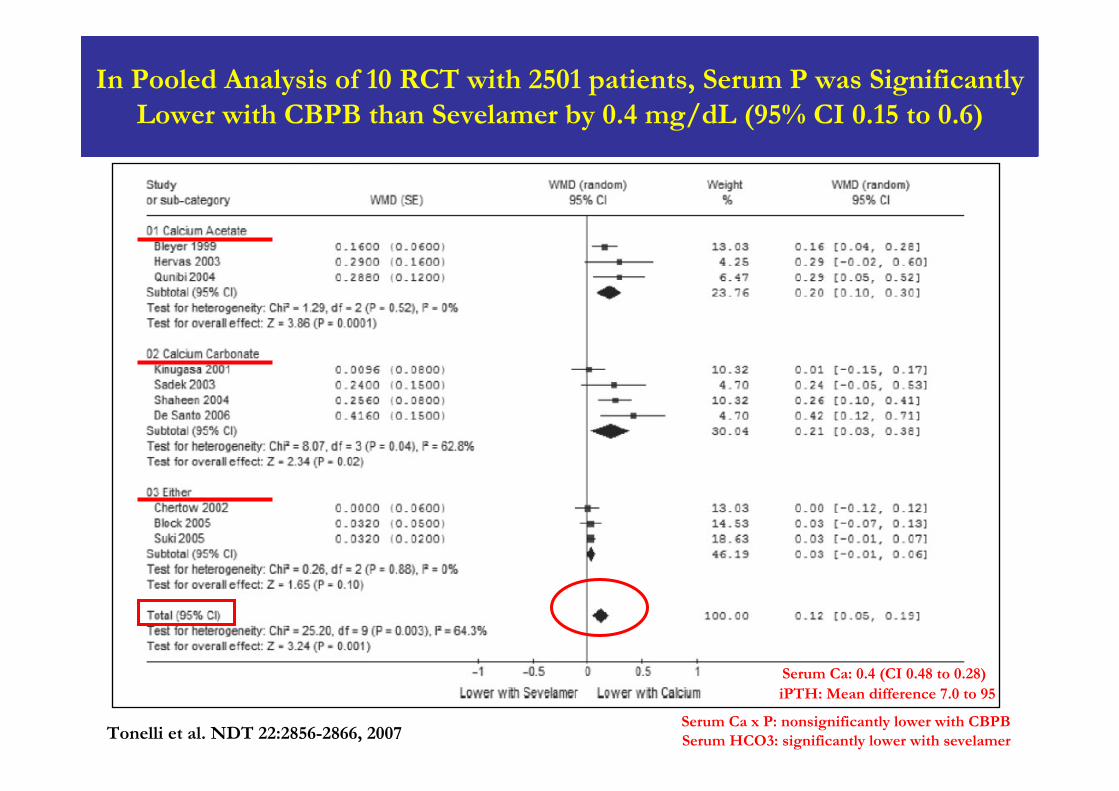
In Pooled Analysis of 10 RCT with 2501 patients, Serum P was Significantly Lower with CBPB than Sevelamer by 0.4 mg/dL (95% CI 0.15 to 0.6)
Tonelli et al. NDT 22:2856-2866, 2007
Serum Ca: 0.4 (CI 0.48 to 0.28)iPTH: Mean difference 7.0 to 95
Serum Ca x P: nonsignificantly lower with CBPBSerum HCO3: significantly lower with sevelamer
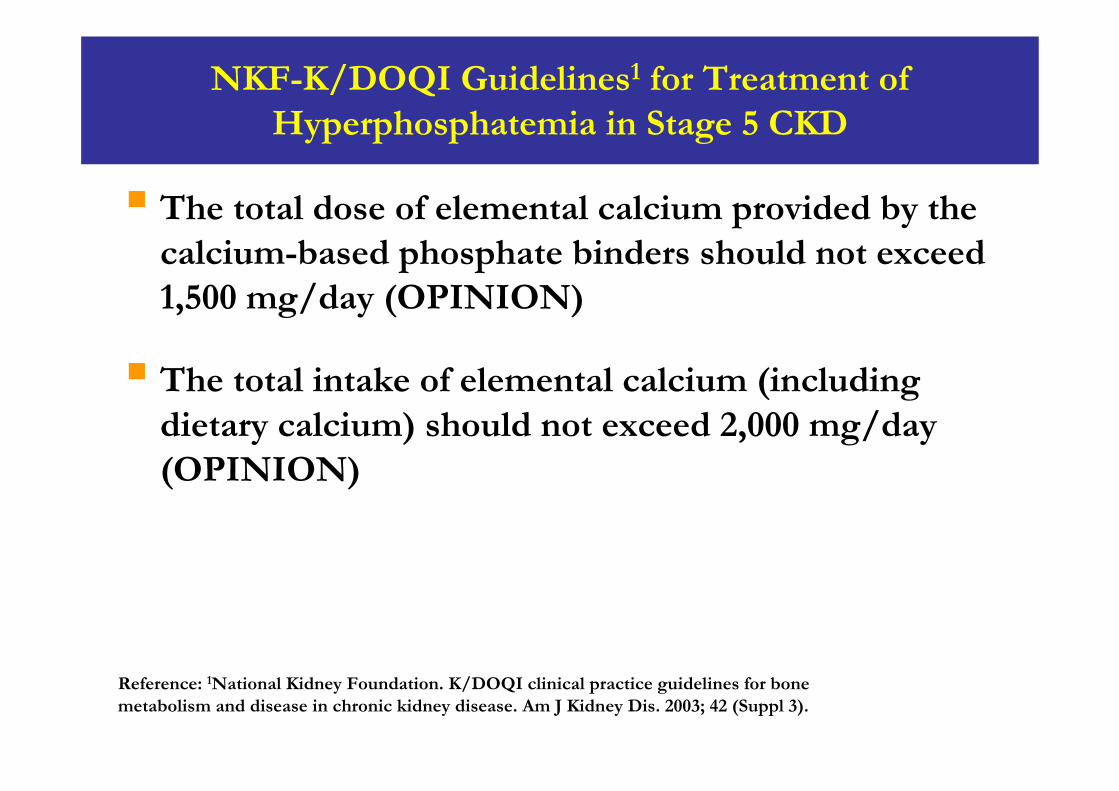
NKF-K/DOQI Guidelines1 for Treatment of Hyperphosphatemia in Stage 5 CKD
Reference: 1National Kidney Foundation. K/DOQI clinical practice guidelines for bone metabolism and disease in chronic kidney disease. Am J Kidney Dis. 2003; 42 (Suppl 3).
The total dose of elemental calcium provided by the calcium-based phosphate binders should not exceed 1,500 mg/day (OPINION)
The total intake of elemental calcium (including dietary calcium) should not exceed 2,000 mg/day (OPINION)
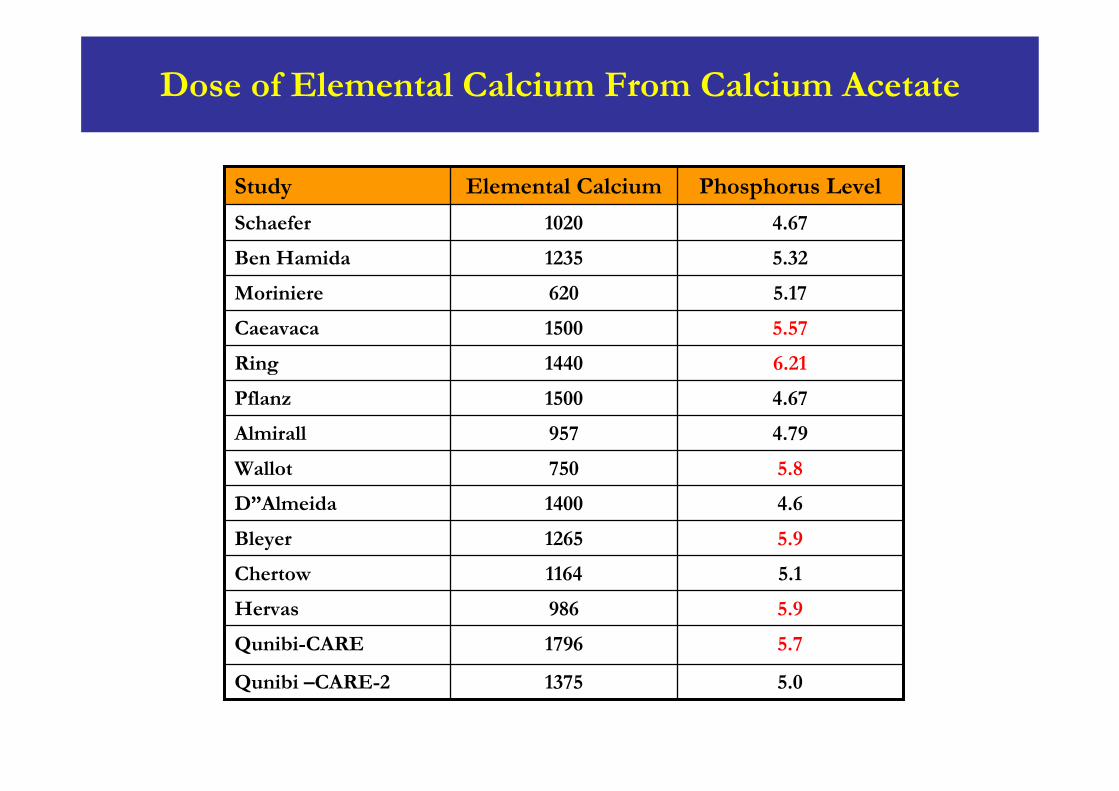
Dose of Elemental Calcium From Calcium Acetate
5.01375Qunibi –CARE-2
5.71796Qunibi-CARE
5.9986Hervas
5.11164Chertow
5.91265Bleyer
4.61400D”Almeida
5.8750Wallot
4.79957Almirall
4.671500Pflanz
6.211440Ring
5.571500Caeavaca
5.17620Moriniere
5.321235Ben Hamida
4.671020Schaefer
Phosphorus LevelElemental CalciumStudy
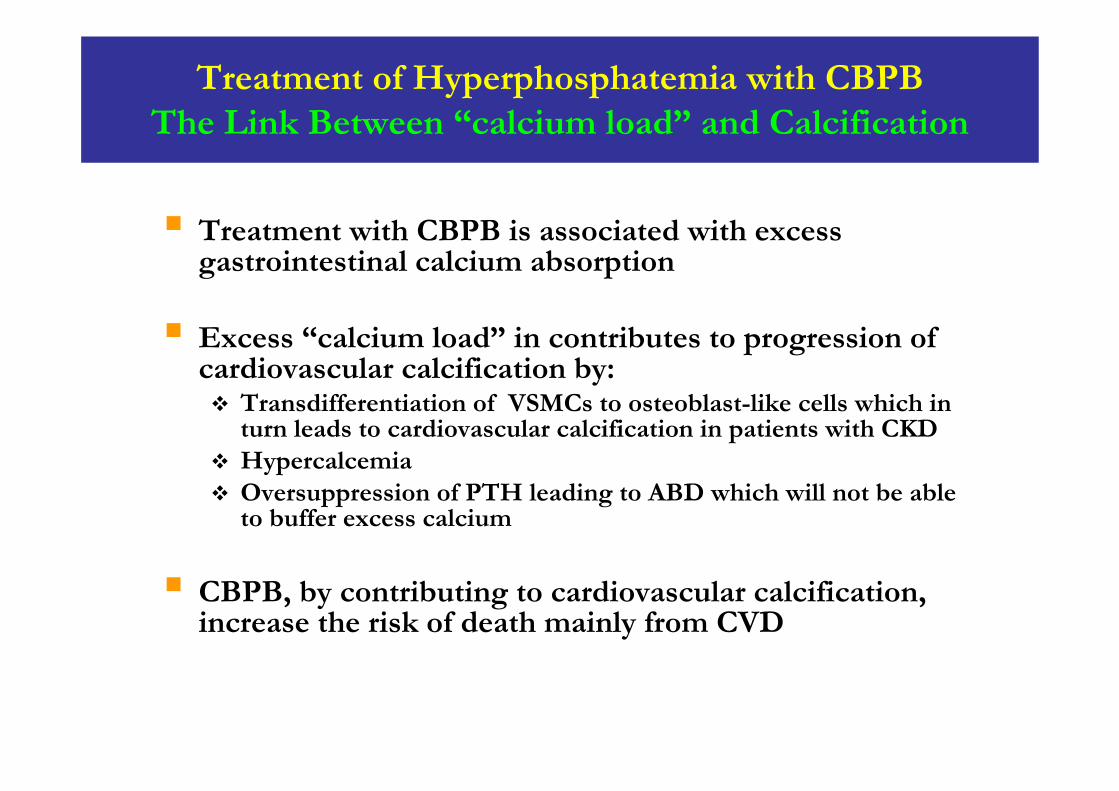
Treatment of Hyperphosphatemia with CBPBThe Link Between “calcium load” and Calcification
Treatment with CBPB is associated with excess gastrointestinal calcium absorption
Excess “calcium load” in contributes to progression of cardiovascular calcification by:
Transdifferentiation of VSMCs to osteoblast-like cells which in turn leads to cardiovascular calcification in patients with CKDHypercalcemiaOversuppression of PTH leading to ABD which will not be able to buffer excess calcium
CBPB, by contributing to cardiovascular calcification, increase the risk of death mainly from CVD
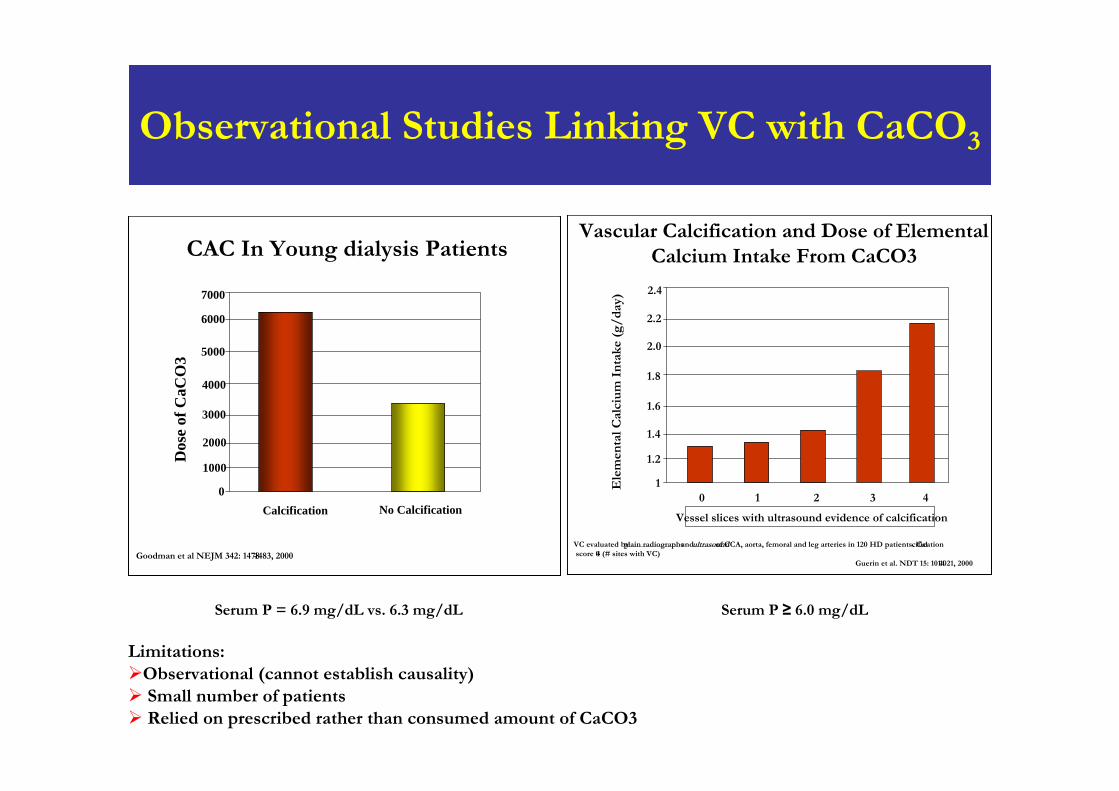
Observational Studies Linking VC with CaCO3
Serum P ≥ 6.0 mg/dLSerum P = 6.9 mg/dL vs. 6.3 mg/dL
CAC In Young dialysis Patients
0
Dos
e of
CaC
O3
1000
3000
4000
6000
2000
5000
Calcification
7000
No Calcification
Goodman et al NEJM 342: 1478-1483, 2000
Vascular Calcification and Dose of Elemental Calcium Intake From CaCO3
1
Vessel slices with ultrasound evidence of calcification
Ele
men
tal C
alci
um
In
take
(g/
day)
1.2
1.6
1.8
2.2
1.4
2.0
43210
2.4
VC evaluated by plain radiographsand ultrasoundof CCA, aorta, femoral and leg arteries in 120 HD patients. Calcificationscore 0-4 (# sites with VC)
Guerin et al. NDT 15: 1014-1021, 2000
Limitations: Observational (cannot establish causality)Small number of patientsRelied on prescribed rather than consumed amount of CaCO3
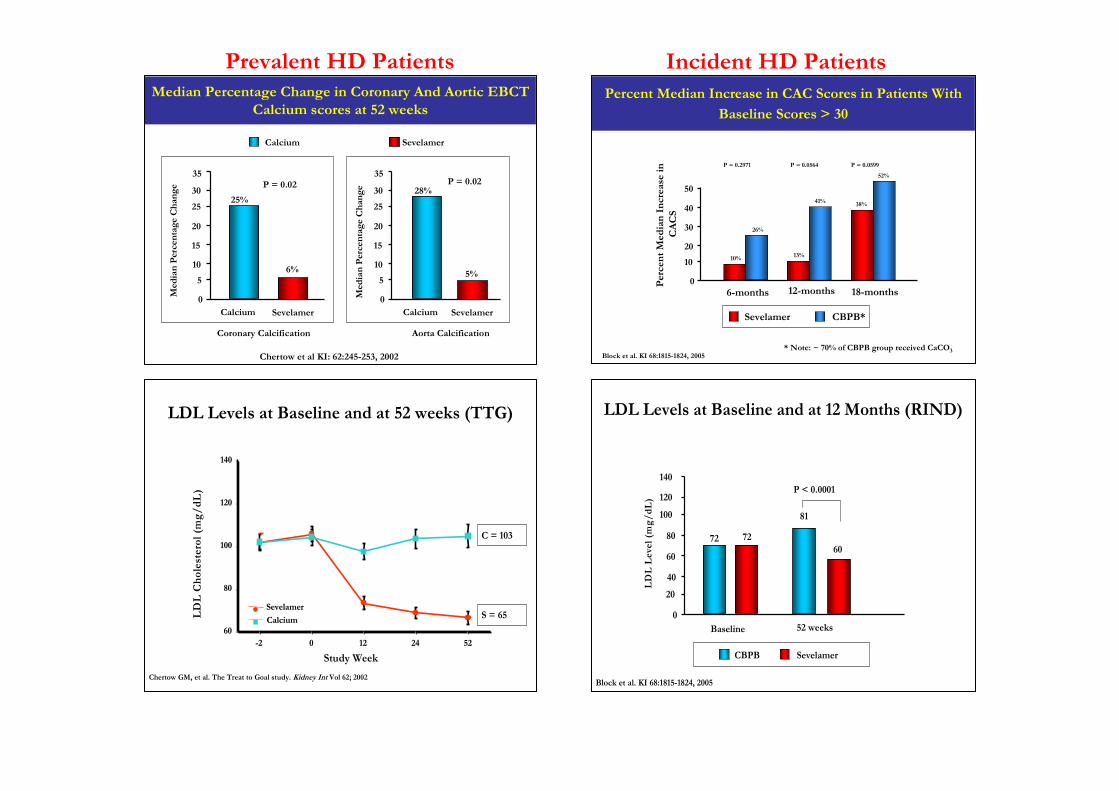
Median Percentage Change in Coronary And Aortic EBCT Calcium scores at 52 weeks
0
5
10
15
20
25
30
35M
edia
n P
erce
ntag
e C
han
ge
Calcium Sevelamer
25%
6%
P = 0.02
0
5
10
15
20
25
30
35
Med
ian
Per
cent
age
Ch
ange
Calcium Sevelamer
28%
5%
P = 0.02
Chertow et al KI: 62:245-253, 2002
SevelamerCalcium
Coronary Calcification Aorta Calcification
Percent Median Increase in CAC Scores in Patients With
Baseline Scores > 30
0
10
20
30
40
50
Per
cen
t M
edia
n I
ncr
ease
inC
AC
S
6-months
CBPB*Sevelamer
Block et al. KI 68:1815-1824, 2005
12-months 18-months
10%
26%
13%
41% 38%
52%
* Note: ~ 70% of CBPB group received CaCO3
P = 0.0599P = 0.0564P = 0.2971
LDL Levels at Baseline and at 52 weeks (TTG)
Study Week--22 00 1212 2424 5252
LD
L C
hol
este
rol (
mg/
dL
)
140140
120120
100100
8080
6060
SevelamerSevelamer
CalciumCalcium
S=102S=102C=102C=102
S=65S=65C=103C=103
Chertow GM, et al. The Treat to Goal study. Kidney Int Vol 62; 2002
S = 65
C = 103
LDL Levels at Baseline and at 12 Months (RIND)
0
20
40
60
80
100
120
140
LD
L L
evel
(m
g/dL
)
Baseline 52 weeks
72
81
P < 0.0001
7260
CBPB Sevelamer
Block et al. KI 68:1815-1824, 2005
Prevalent HD Patients Incident HD Patients
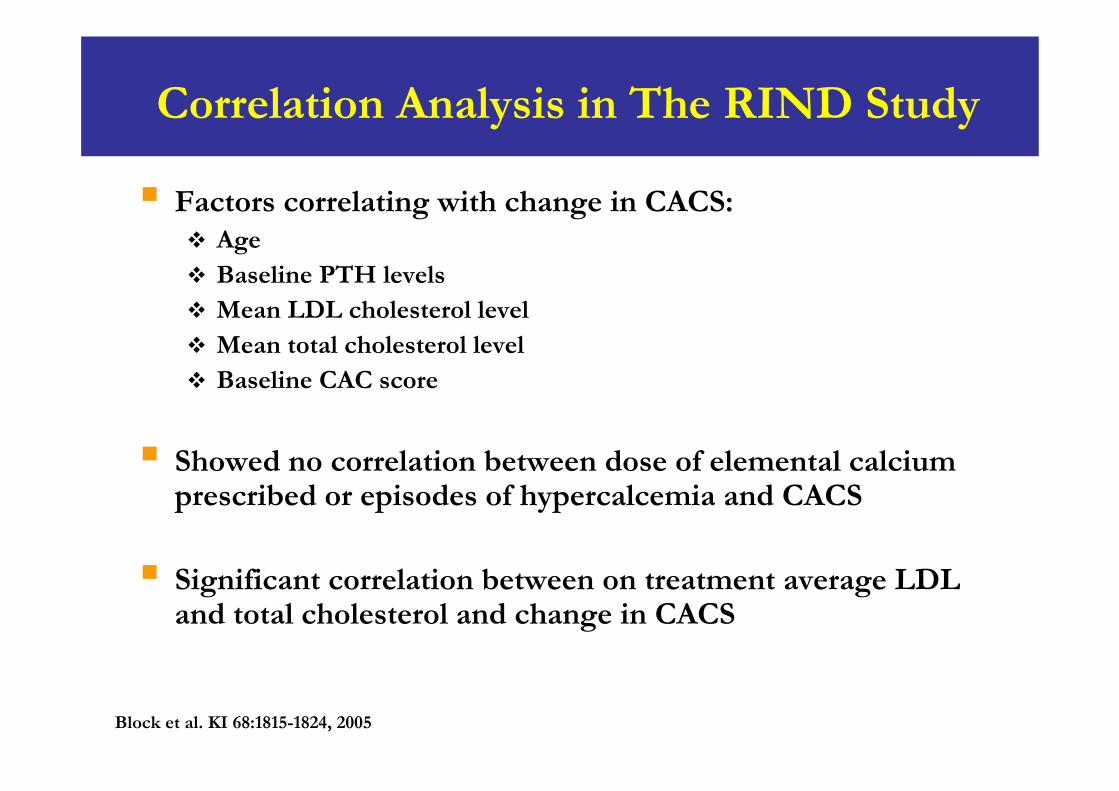
Correlation Analysis in The RIND Study
Factors correlating with change in CACS:AgeBaseline PTH levelsMean LDL cholesterol levelMean total cholesterol levelBaseline CAC score
Showed no correlation between dose of elemental calcium prescribed or episodes of hypercalcemia and CACS
Significant correlation between on treatment average LDL and total cholesterol and change in CACS
Block et al. KI 68:1815-1824, 2005
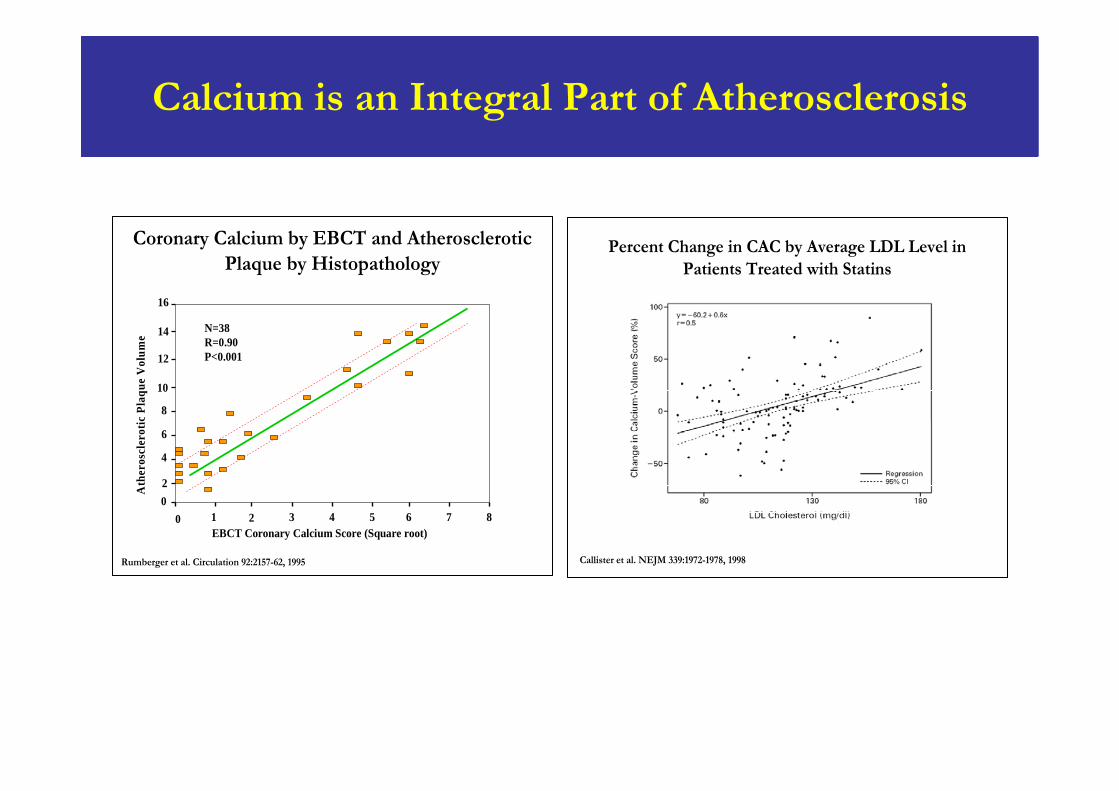
Calcium is an Integral Part of Atherosclerosis
Coronary Calcium by EBCT and Atherosclerotic Plaque by Histopathology
0 1 2 3 4 5 6 7 80
16
2
4
6
8
10
12
14
EBCT Coronary Calcium Score (Square root)
Ath
eros
cler
otic
Pla
que
Vol
ume
N=38R=0.90P<0.001
Rumberger et al. Circulation 92:2157-62, 1995
Percent Change in CAC by Average LDL Level in Patients Treated with Statins
Callister et al. NEJM 339:1972-1978, 1998
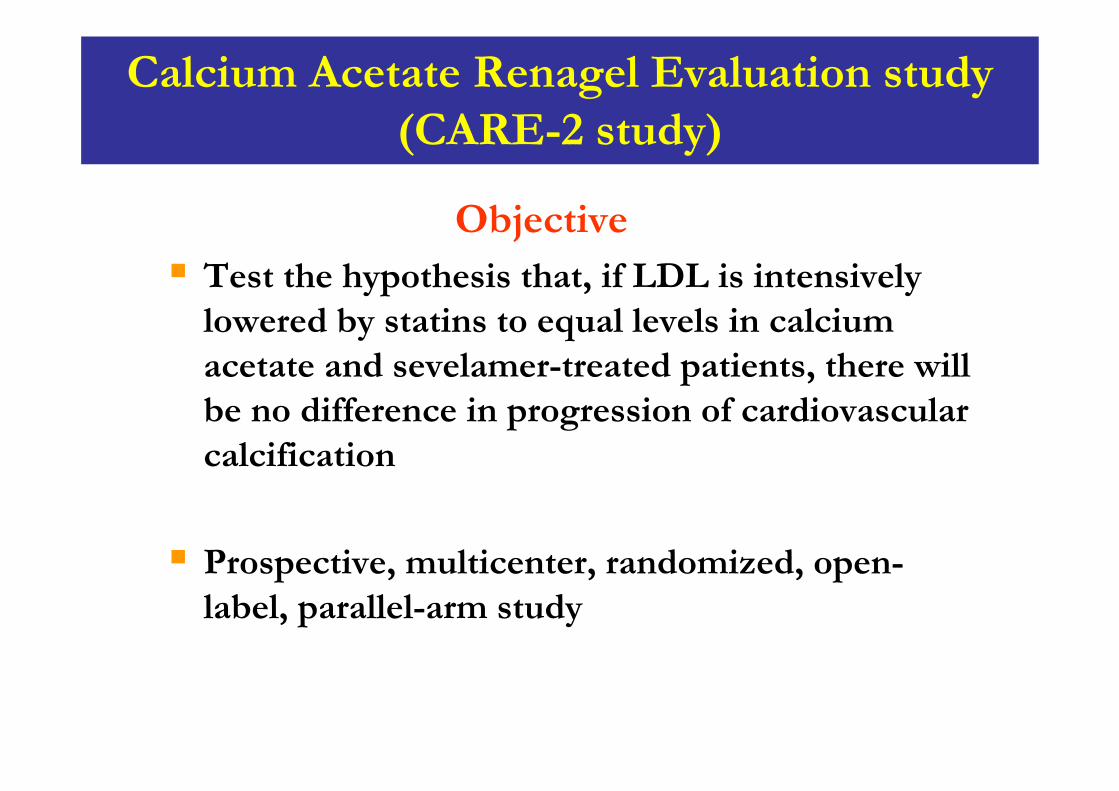
Calcium Acetate Renagel Evaluation study (CARE-2 study)
ObjectiveTest the hypothesis that, if LDL is intensively lowered by statins to equal levels in calcium acetate and sevelamer-treated patients, there will be no difference in progression of cardiovascular calcification
Prospective, multicenter, randomized, open-label, parallel-arm study
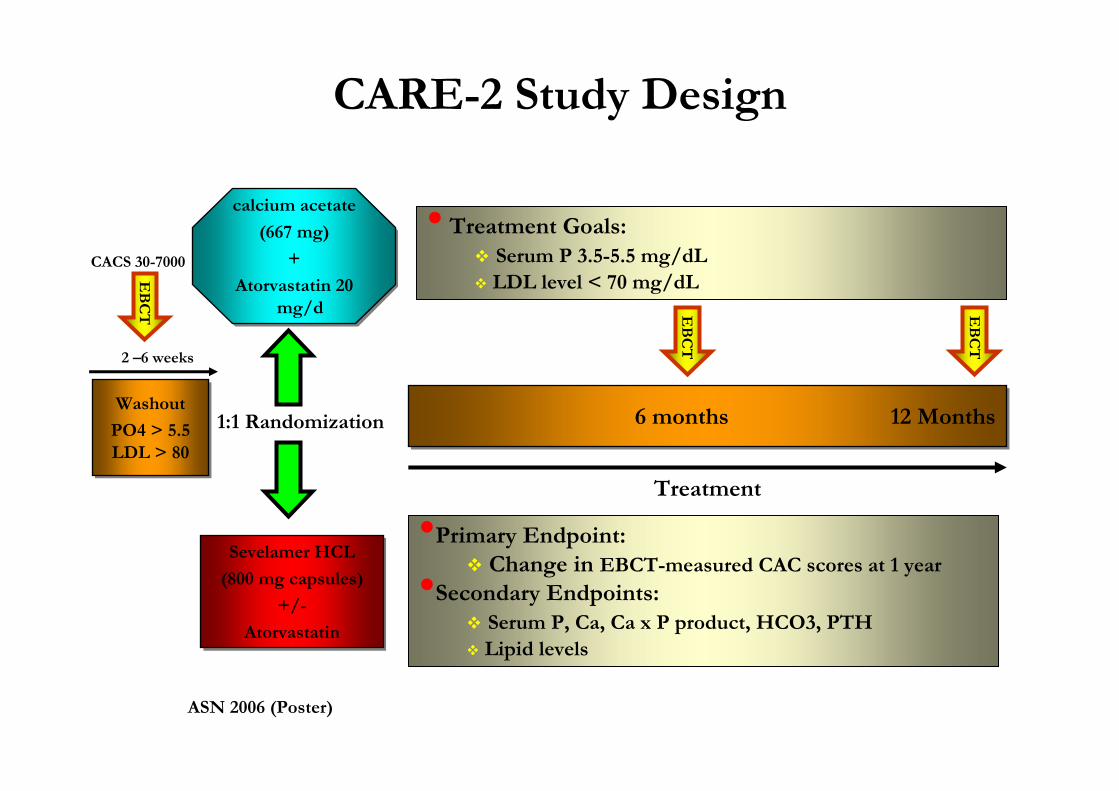
1:1 Randomization
CARE-2 Study Design
Washout
PO4 > 5.5LDL > 80
Washout
PO4 > 5.5LDL > 80
6 months 12 Months6 months 12 Months
calcium acetate
(667 mg)
+
Atorvastatin 20 mg/d
calcium acetate
(667 mg)
+
Atorvastatin 20 mg/d
Sevelamer HCL
(800 mg capsules)
+/-
Atorvastatin
Sevelamer HCL
(800 mg capsules)
+/-
Atorvastatin
2 –6 weeks
Treatment
• Treatment Goals:Serum P 3.5-5.5 mg/dLLDL level < 70 mg/dLE
BC
T
•Primary Endpoint:Change in EBCT-measured CAC scores at 1 year•Secondary Endpoints:Serum P, Ca, Ca x P product, HCO3, PTHLipid levels
EB
CT
EB
CT
CACS 30-7000
ASN 2006 (Poster)
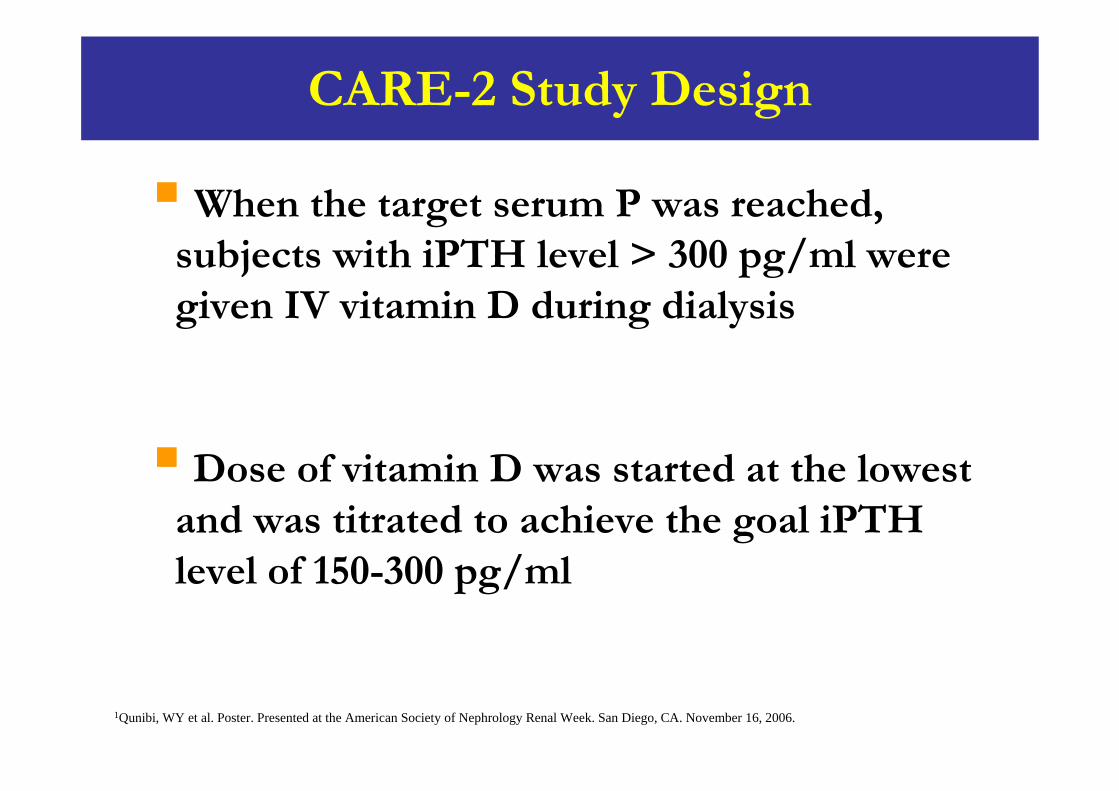
CARE-2 Study Design
When the target serum P was reached, subjects with iPTH level > 300 pg/ml were given IV vitamin D during dialysis
Dose of vitamin D was started at the lowest and was titrated to achieve the goal iPTH level of 150-300 pg/ml
1Qunibi, WY et al. Poster. Presented at the American Society of Nephrology Renal Week. San Diego, CA. November 16, 2006.
CARE-2 Study Design
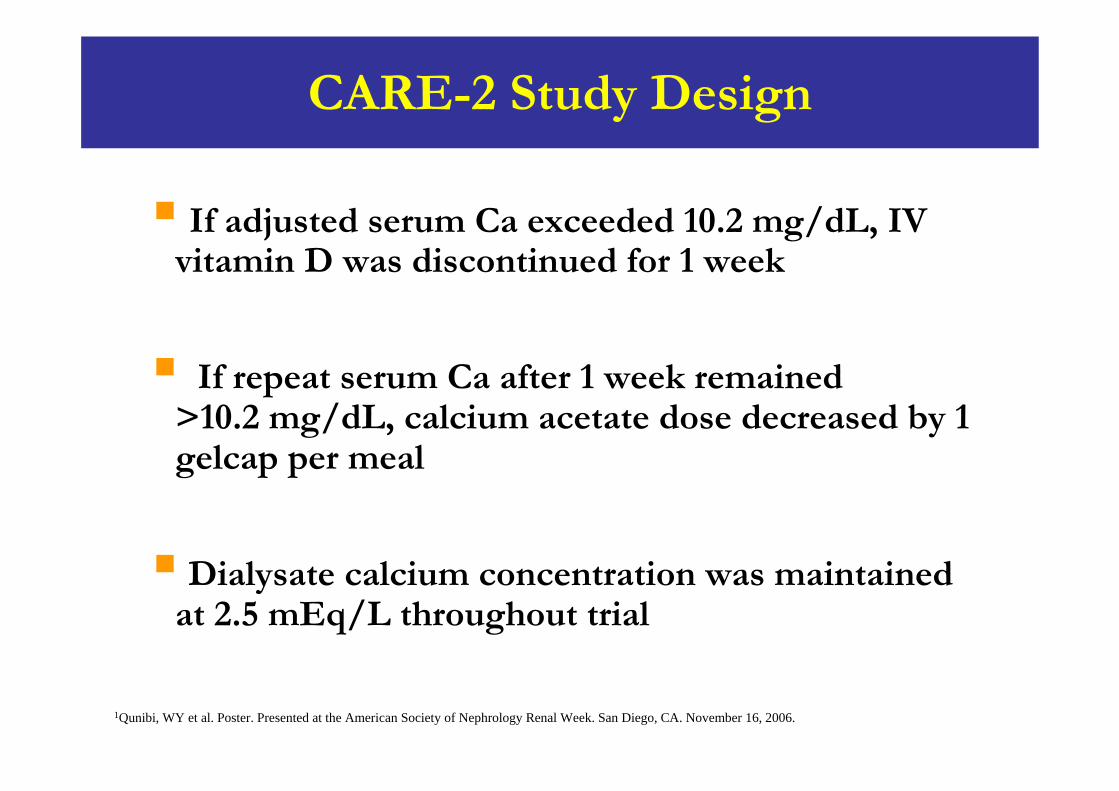
If adjusted serum Ca exceeded 10.2 mg/dL, IV vitamin D was discontinued for 1 week
If repeat serum Ca after 1 week remained >10.2 mg/dL, calcium acetate dose decreased by 1 gelcap per meal
Dialysate calcium concentration was maintained at 2.5 mEq/L throughout trial
1Qunibi, WY et al. Poster. Presented at the American Society of Nephrology Renal Week. San Diego, CA. November 16, 2006.
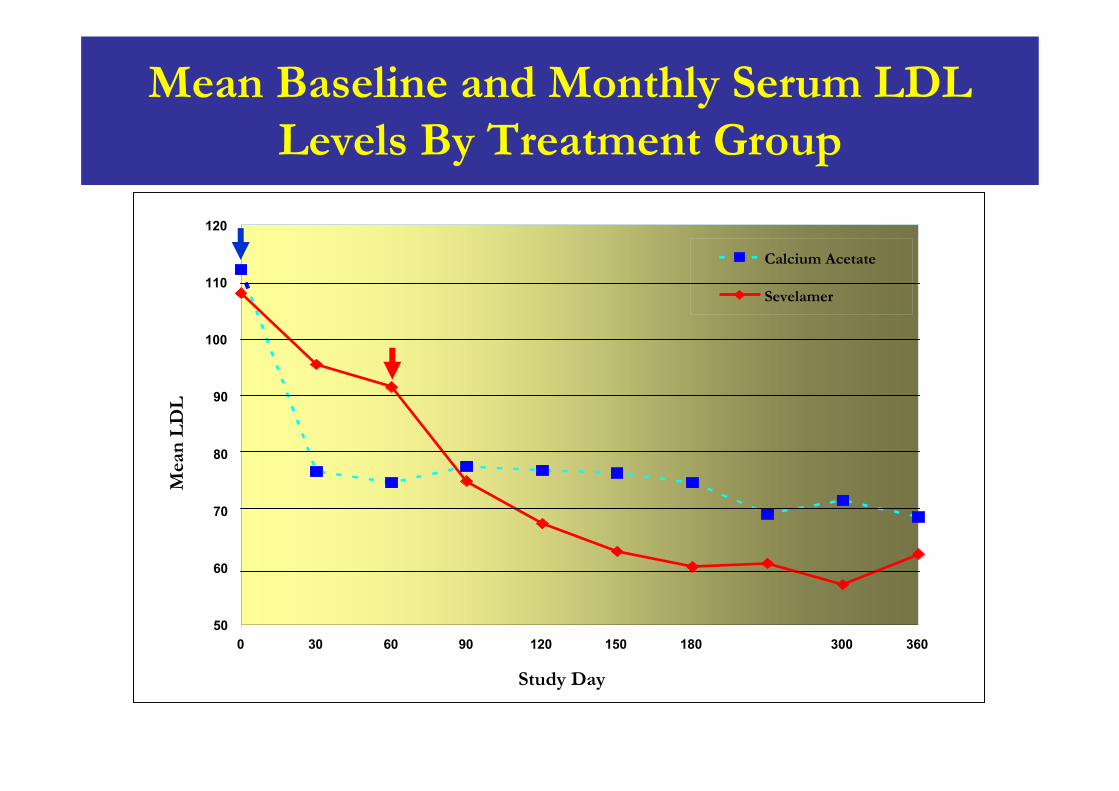
Mean Baseline and Monthly Serum LDL Levels By Treatment Group
50
60
70
80
90
100
110
120
0 30 60 90 120 150 180 240 300 360
Study Day
Mea
n L
DL
Calcium Acetate
Sevelamer
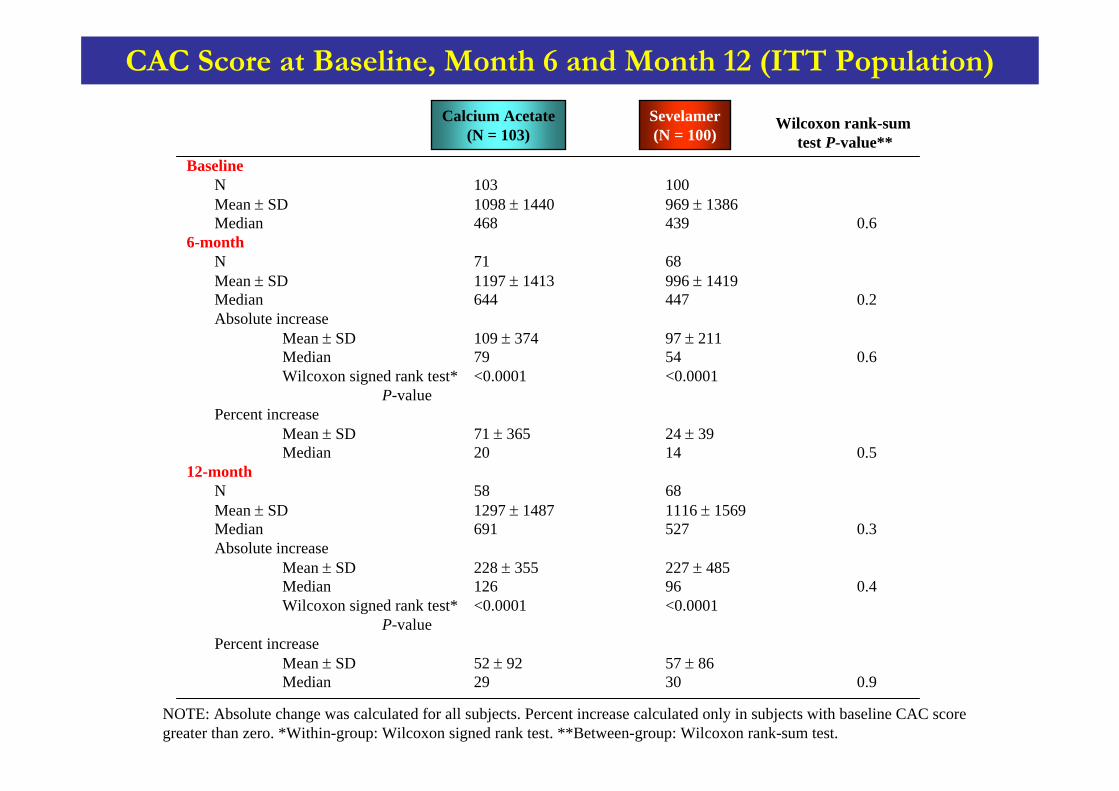
BaselineN 103 100Mean ± SD 1098 ± 1440 969 ± 1386Median 468 439 0.6
6-monthN 71 68Mean ± SD 1197 ± 1413 996 ± 1419Median 644 447 0.2Absolute increase
Mean ± SD 109 ± 374 97 ± 211Median 79 54 0.6Wilcoxon signed rank test* <0.0001 <0.0001
P-valuePercent increase
Mean ± SD 71 ± 365 24 ± 39Median 20 14 0.5
12-monthN 58 68Mean ± SD 1297 ± 1487 1116 ± 1569Median 691 527 0.3Absolute increase
Mean ± SD 228 ± 355 227 ± 485Median 126 96 0.4Wilcoxon signed rank test* <0.0001 <0.0001
P-valuePercent increase
Mean ± SD 52 ± 92 57 ± 86Median 29 30 0.9
CAC Score at Baseline, Month 6 and Month 12 (ITT Population)
Wilcoxon rank-sumtest P-value**
NOTE: Absolute change was calculated for all subjects. Percent increase calculated only in subjects with baseline CAC score greater than zero. *Within-group: Wilcoxon signed rank test. **Between-group: Wilcoxon rank-sum test.
Calcium Acetate(N = 103)
Sevelamer(N = 100)
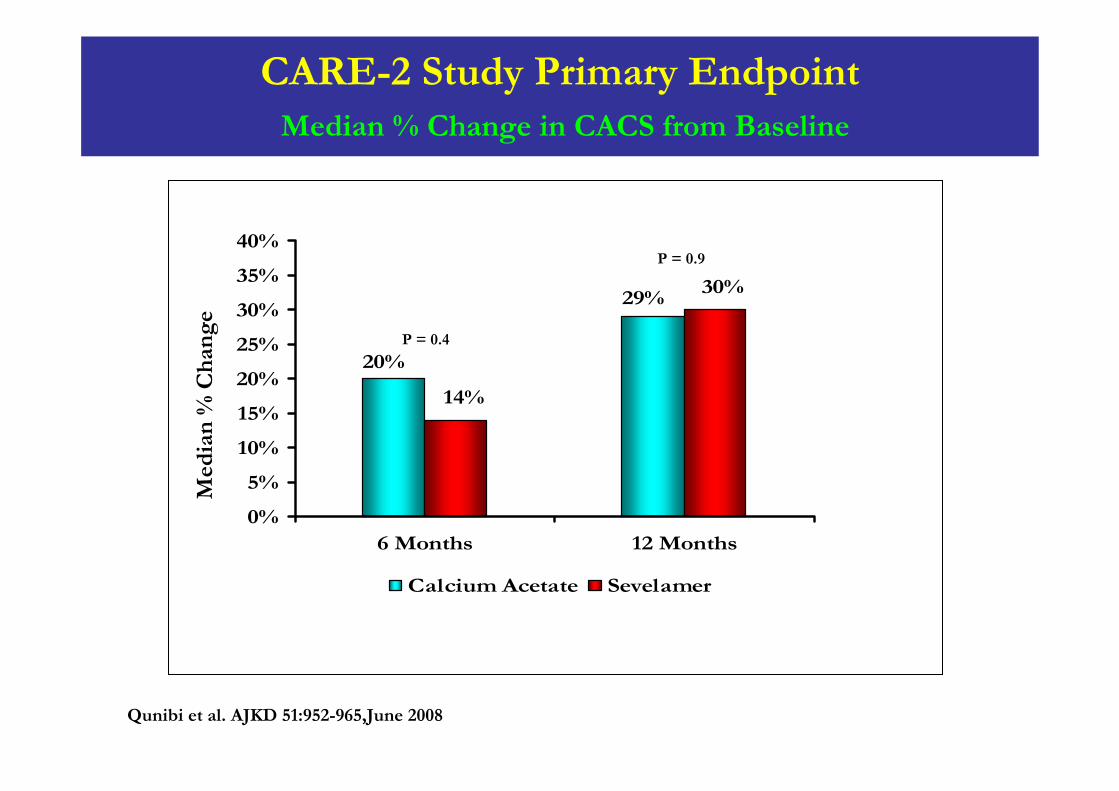
CARE-2 Study Primary EndpointMedian % Change in CACS from Baseline
29%
20%
30%
14%
0%
5%
10%
15%
20%
25%
30%
35%
40%
6 Months 12 Months
Calcium Acetate Sevelamer
Med
ian
% C
han
ge
P = 0.4
P = 0.9
Qunibi et al. AJKD 51:952-965,June 2008
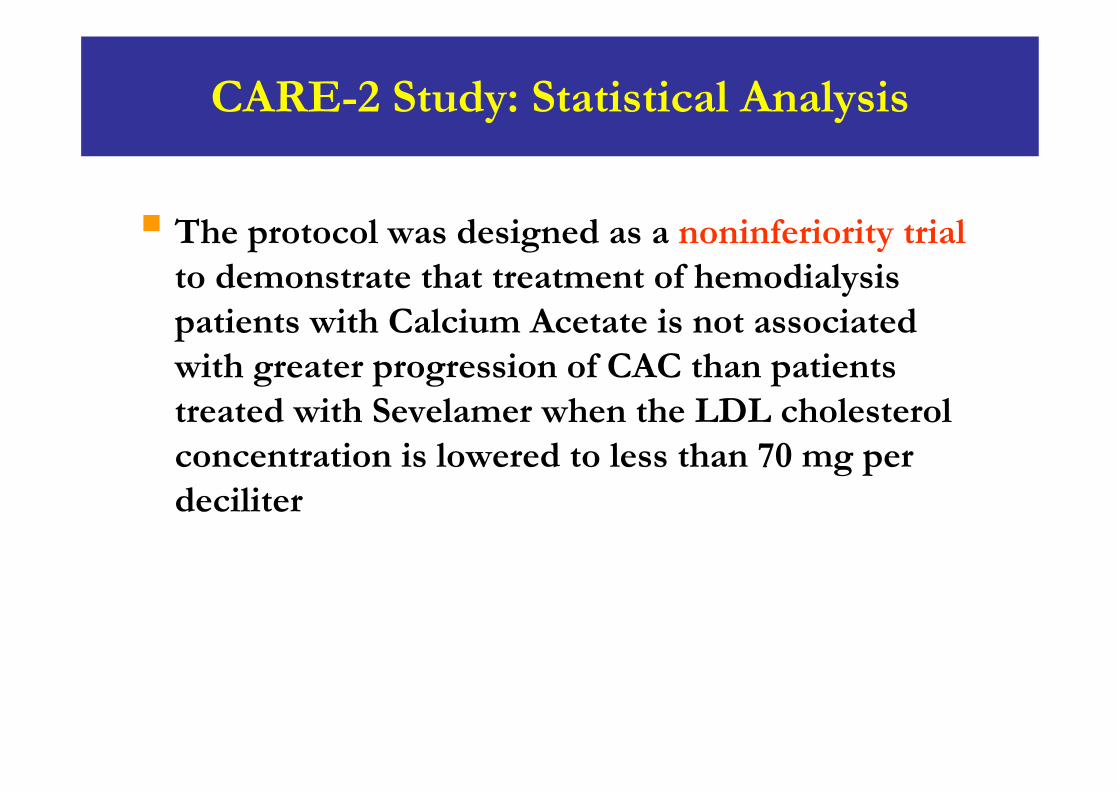
CARE-2 Study: Statistical Analysis
The protocol was designed as a noninferiority trialto demonstrate that treatment of hemodialysis patients with Calcium Acetate is not associated with greater progression of CAC than patients treated with Sevelamer when the LDL cholesterol concentration is lowered to less than 70 mg per deciliter
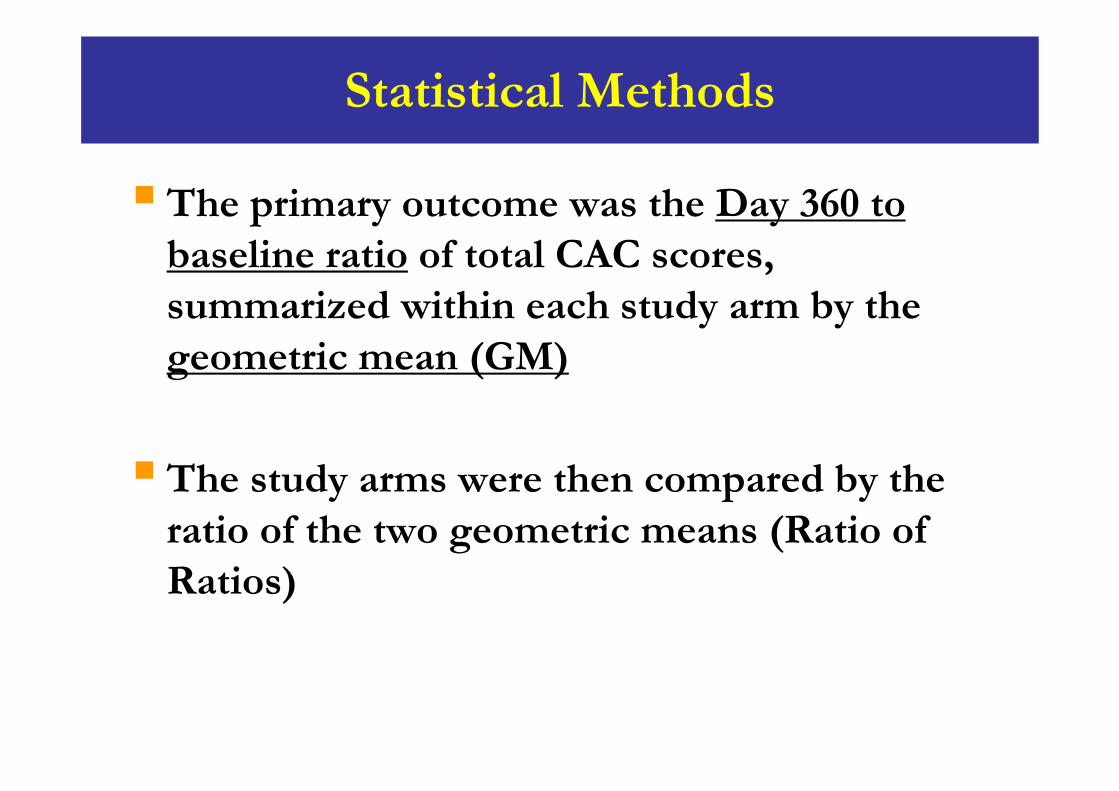
Statistical Methods
The primary outcome was the Day 360 to baseline ratio of total CAC scores, summarized within each study arm by the geometric mean (GM)
The study arms were then compared by the ratio of the two geometric means (Ratio of Ratios)
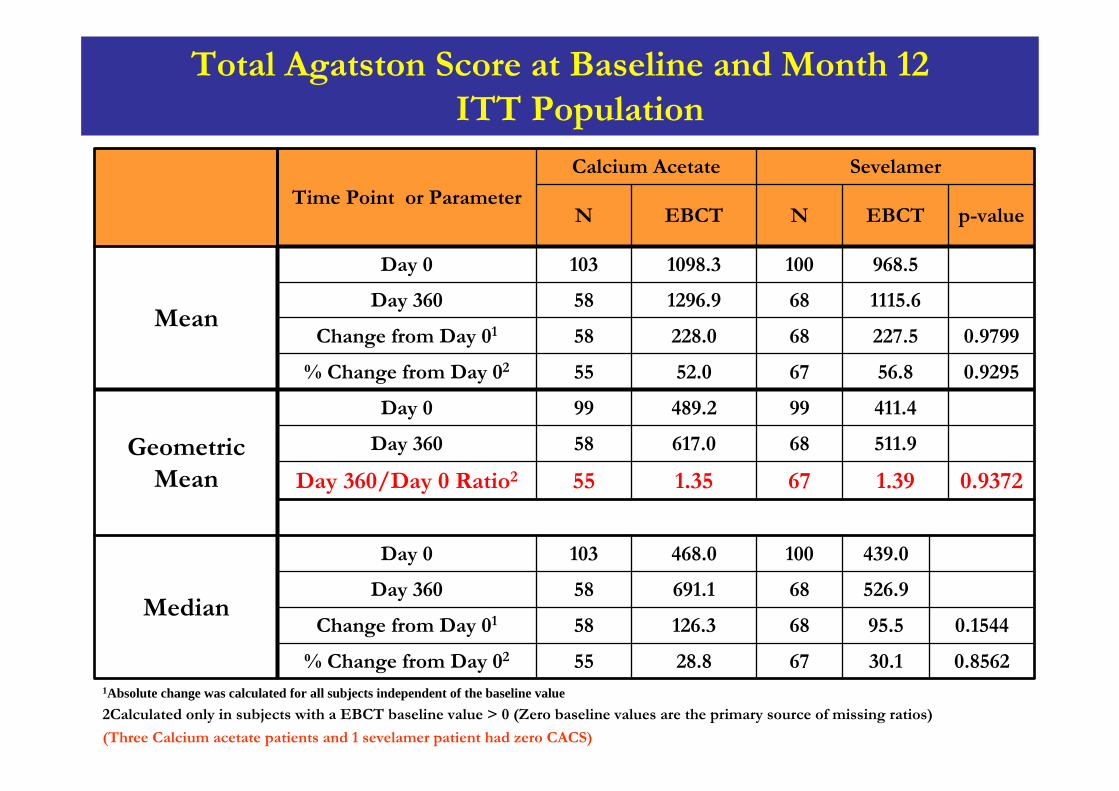
Total Agatston Score at Baseline and Month 12ITT Population
511.968617.058Day 360
0.856230.16728.855% Change from Day 02
0.154495.568126.358Change from Day 01
526.968691.158Day 360
439.0100468.0103Day 0
Median
0.93721.39671.3555Day 360/Day 0 Ratio2
411.499489.299Day 0
Geometric Mean
0.929556.86752.055% Change from Day 02
0.9799227.568228.058Change from Day 01
1115.6681296.958Day 360
968.51001098.3103Day 0
Mean
p-valueEBCTNEBCTN
SevelamerCalcium Acetate
Time Point or Parameter
1Absolute change was calculated for all subjects independent of the baseline value 2Calculated only in subjects with a EBCT baseline value > 0 (Zero baseline values are the primary source of missing ratios)
(Three Calcium acetate patients and 1 sevelamer patient had zero CACS)
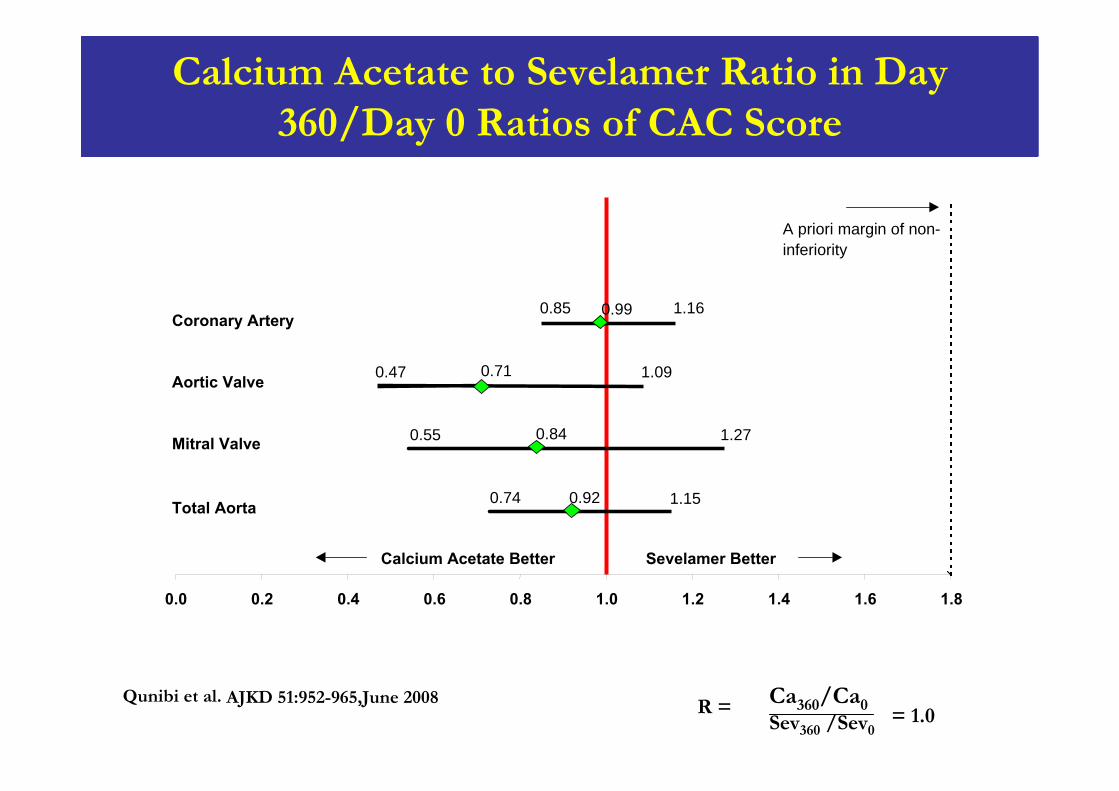
0.85 0.99 1.16
1.090.710.47
1.270.55 0.84
1.150.920.74
0.0 0.2 0.4 0.6 0.8 1.0 1.2 1.4 1.6 1.8
Coronary Artery
Total Aorta
Mitral Valve
Aortic Valve
A priori margin of non-inferiority
Calcium Acetate Better Sevelamer Better
Calcium Acetate to Sevelamer Ratio in Day 360/Day 0 Ratios of CAC Score
Qunibi et al. R = = 1.0Ca360/Ca0Sev360 /Sev0
AJKD 51:952-965,June 2008
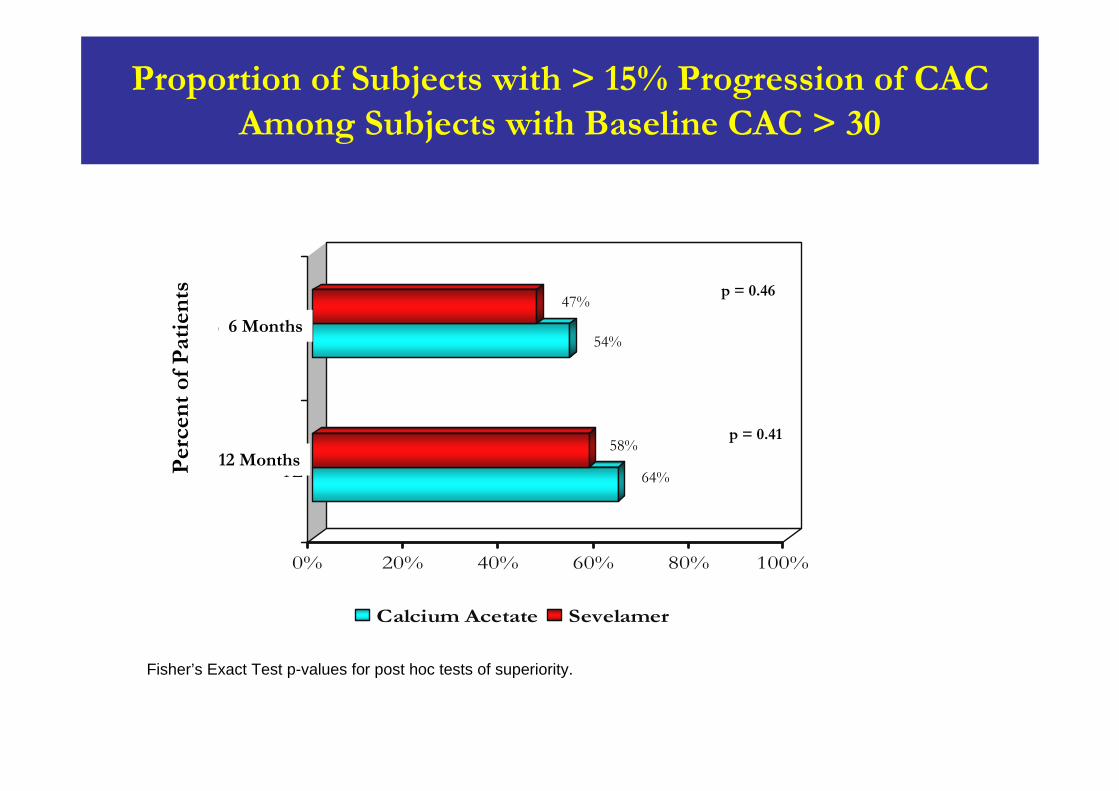
0% 20% 40% 60% 80% 100%
12
6 Months
Calcium Acetate Sevelamer
Fisher’s Exact Test p-values for post hoc tests of superiority.
p = 0.41
p = 0.46
Per
cen
t of
Pat
ien
ts
Proportion of Subjects with > 15% Progression of CAC Among Subjects with Baseline CAC > 30
54%
47%
58%
64%12 Months
6 Months
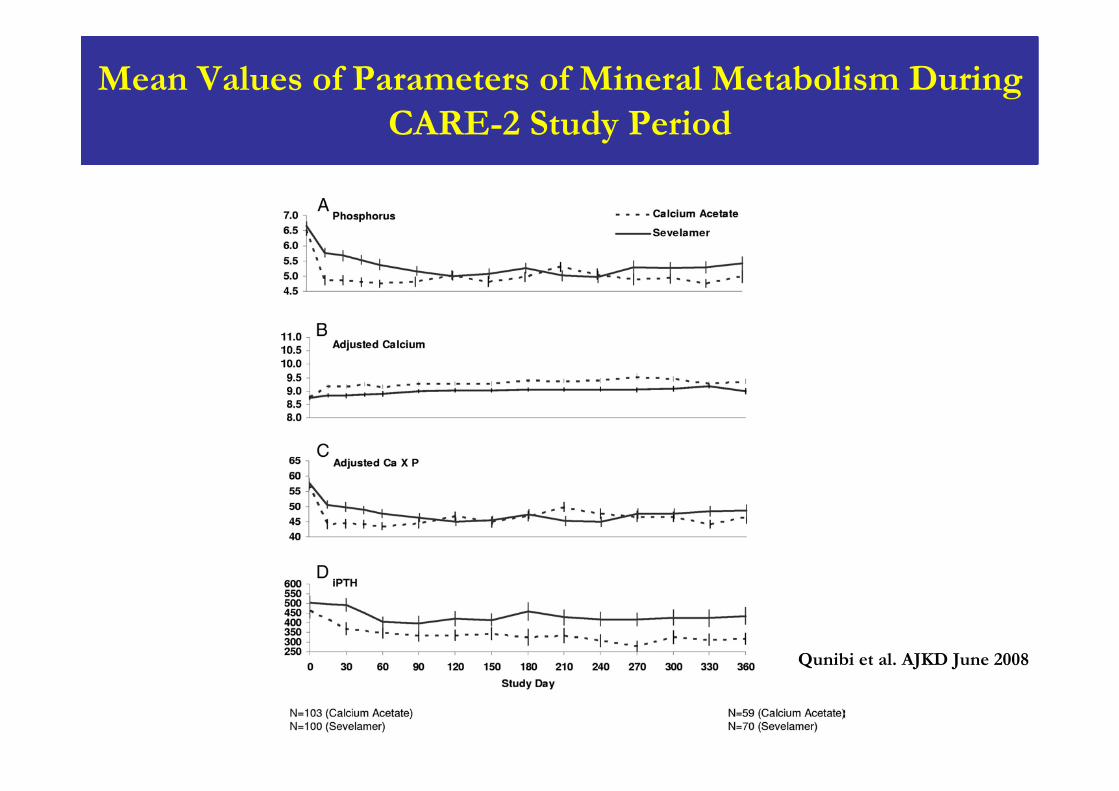
Mean Values of Parameters of Mineral Metabolism During CARE-2 Study Period
Qunibi et al. AJKD June 2008
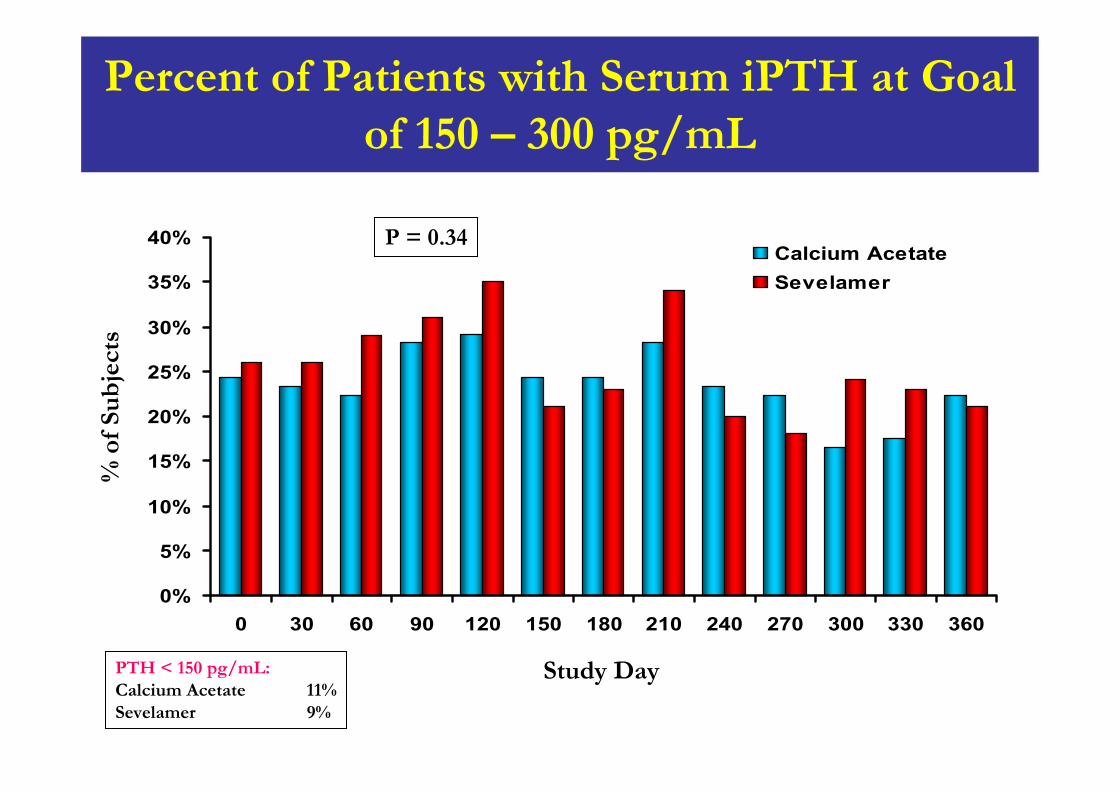
Percent of Patients with Serum iPTH at Goal of 150 – 300 pg/mL
0%
5%
10%
15%
20%
25%
30%
35%
40%
0 30 60 90 120 150 180 210 240 270 300 330 360
Calcium AcetateSevelamer
% o
f Su
bje
cts
Study Day
P = 0.34
PTH < 150 pg/mL:Calcium Acetate 11%Sevelamer 9%
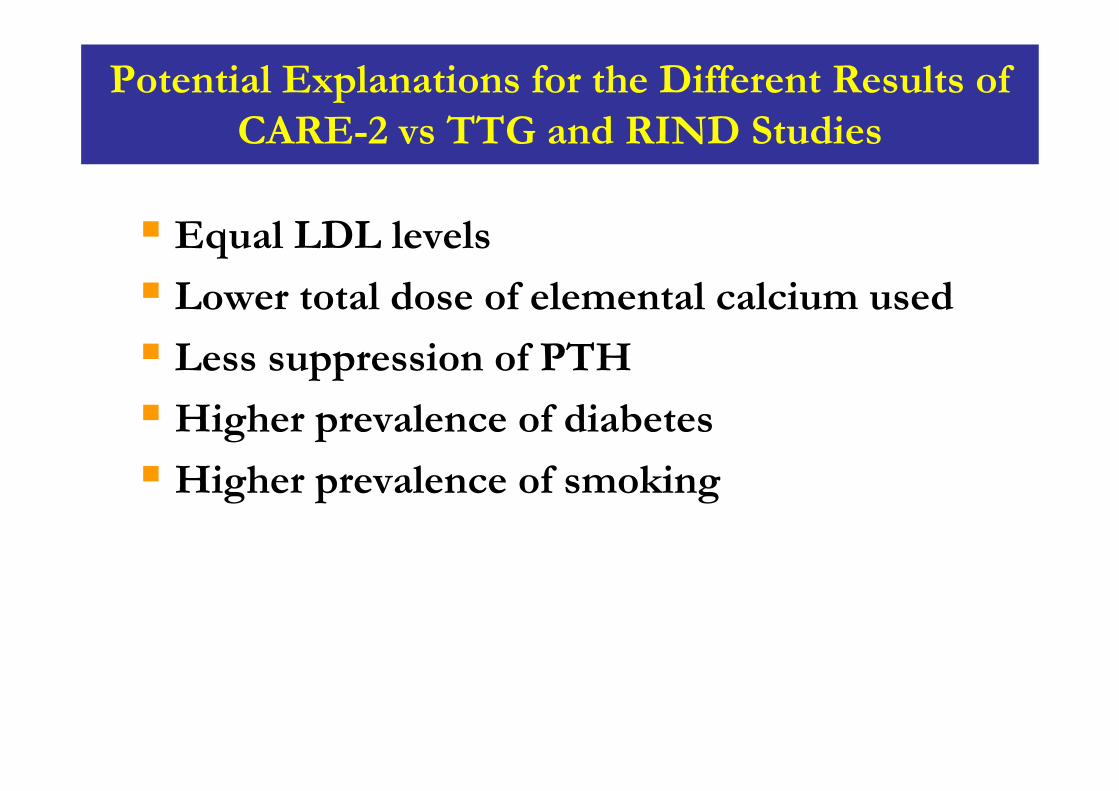
Potential Explanations for the Different Results of CARE-2 vs TTG and RIND Studies
Equal LDL levels
Lower total dose of elemental calcium used
Less suppression of PTH
Higher prevalence of diabetes
Higher prevalence of smoking
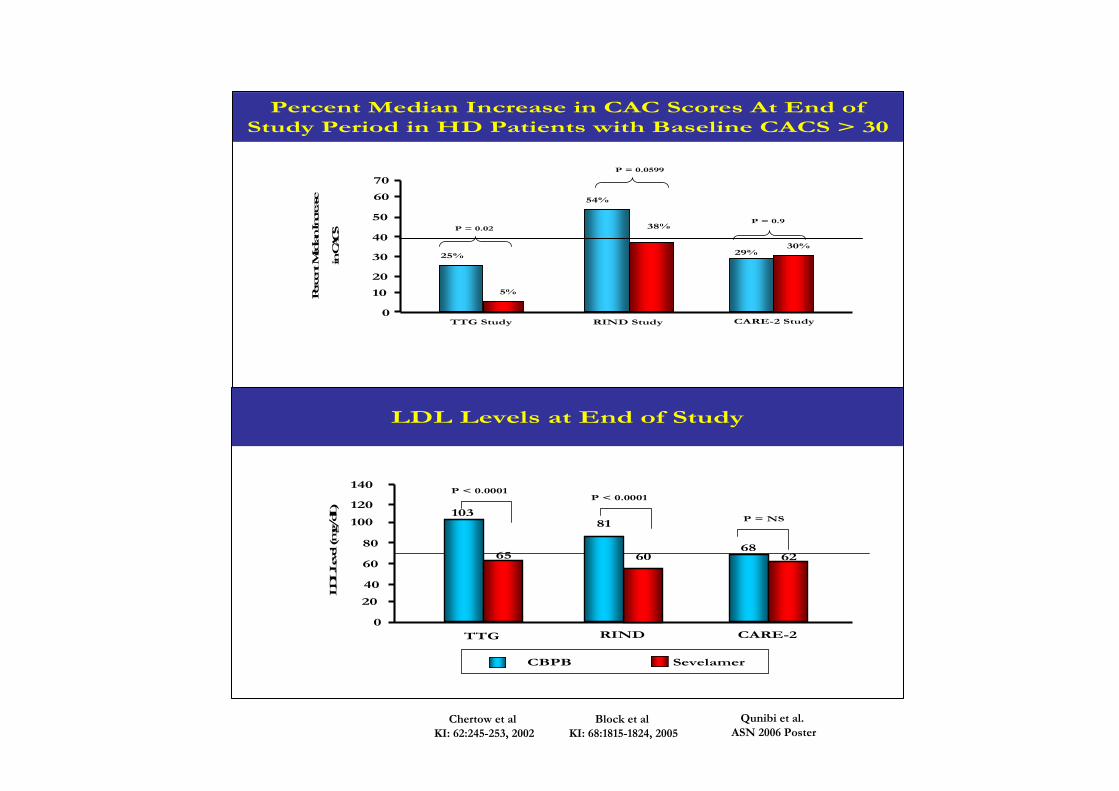
Percent Median Increase in CAC Scores At End of Study Period in HD Patients with Baseline CACS > 30
0
10
20
30
40
50
Perce
nt M
edian In
crea
se
in C
ACS
TTG Study
54%
25%
RIND Study CARE-2 Study
38%
29%30%
5%
70
60
P = 0.9
P = 0.0599
P = 0.02
Qunibi et al.ASN 2006 Poster
Chertow et al KI: 62:245-253, 2002
Block et al KI: 68:1815-1824, 2005
LDL Levels at End of Study
0
20
40
60
80
100
120
140
LDL L
evel (m
g/dL)
TTG RIND
10381
P < 0.0001
65 60
CBPB Sevelamer
CARE-2
P = NS
P < 0.0001
6862
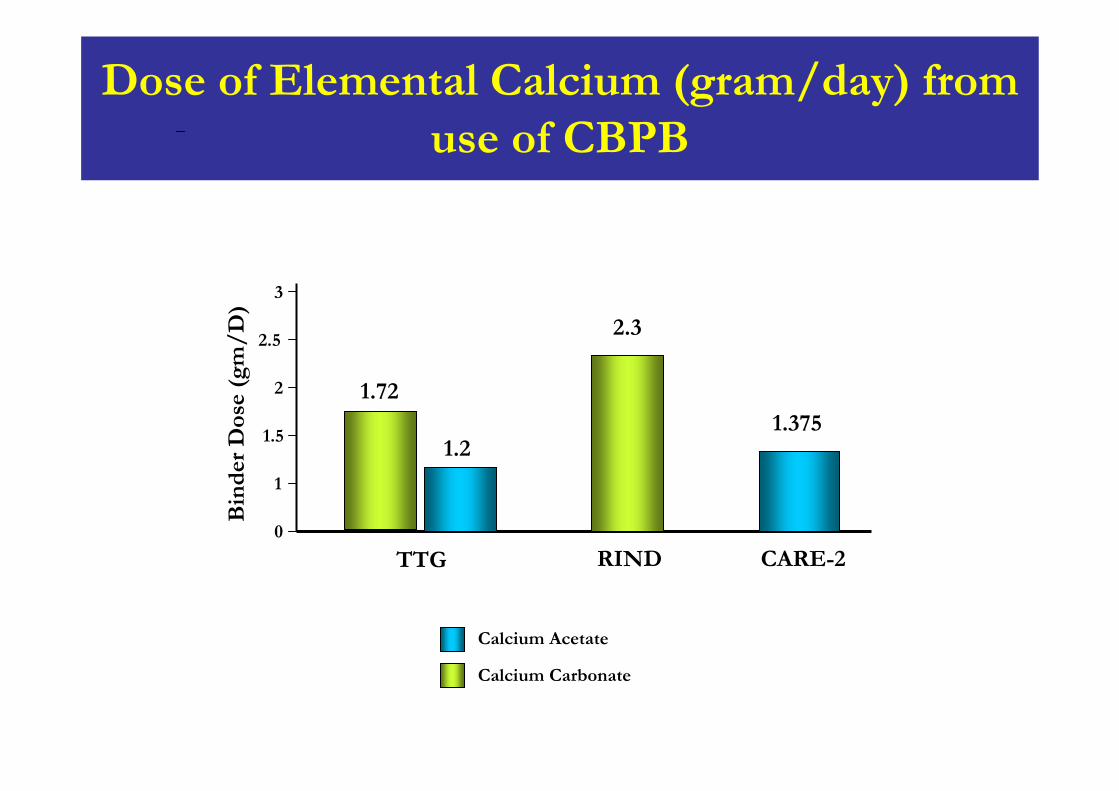
Dose of Elemental Calcium (gram/day) from use of CBPB
0
TTG RIND CARE-2
Bin
der
Dos
e (g
m/
D)
1.375
1
1.5
2
2.5
3
2.3
1.2
1.72
Calcium Acetate
Calcium Carbonate
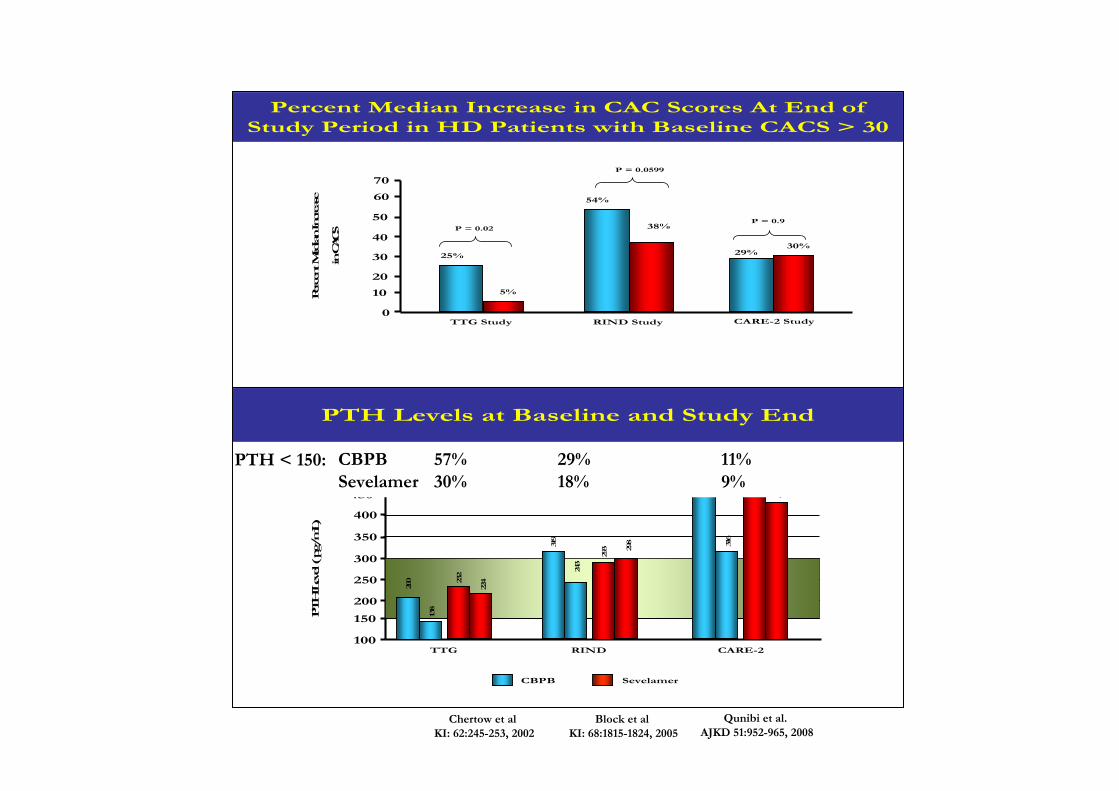
Percent Median Increase in CAC Scores At End of Study Period in HD Patients with Baseline CACS > 30
0
10
20
30
40
50
Perce
nt M
edian In
crea
se
in C
ACS
TTG Study
54%
25%
RIND Study CARE-2 Study
38%
29%30%
5%
70
60
P = 0.9
P = 0.0599
P = 0.02
Qunibi et al.AJKD 51:952-965, 2008
Chertow et al KI: 62:245-253, 2002
Block et al KI: 68:1815-1824, 2005
PTH Levels at Baseline and Study End
100
150
200
250
300
350
PTH
Lev
el ( p
g/m
L)
TTG
450
400
RIND CARE-2
500
503
CBPB Sevelamer
200
138
232
224
319
243
293 29
8
464
316
434
CBPB 57% 29% 11%Sevelamer 30% 18% 9%
PTH < 150:
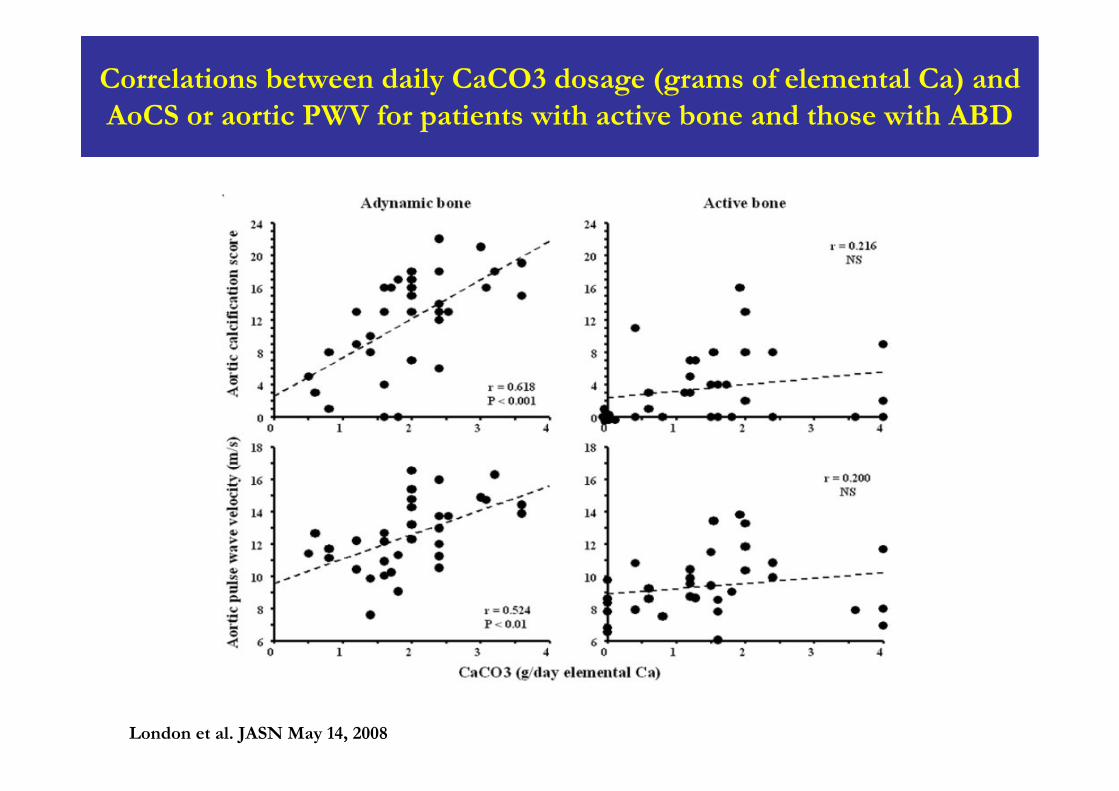
Correlations between daily CaCO3 dosage (grams of elemental Ca) and AoCS or aortic PWV for patients with active bone and those with ABD
London et al. JASN May 14, 2008
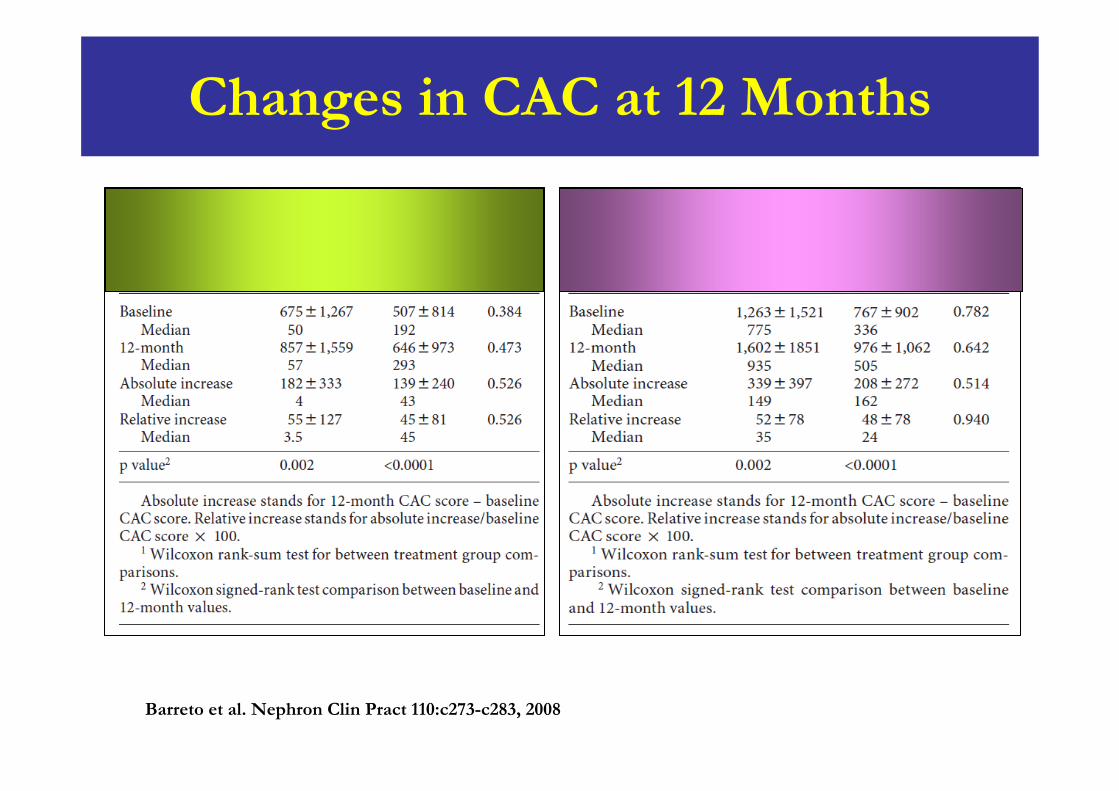
Changes in CAC at 12 Months
Barreto et al. Nephron Clin Pract 110:c273-c283, 2008
Barreto et al. Nephron Clin Pract 110:c273-c283, 2008
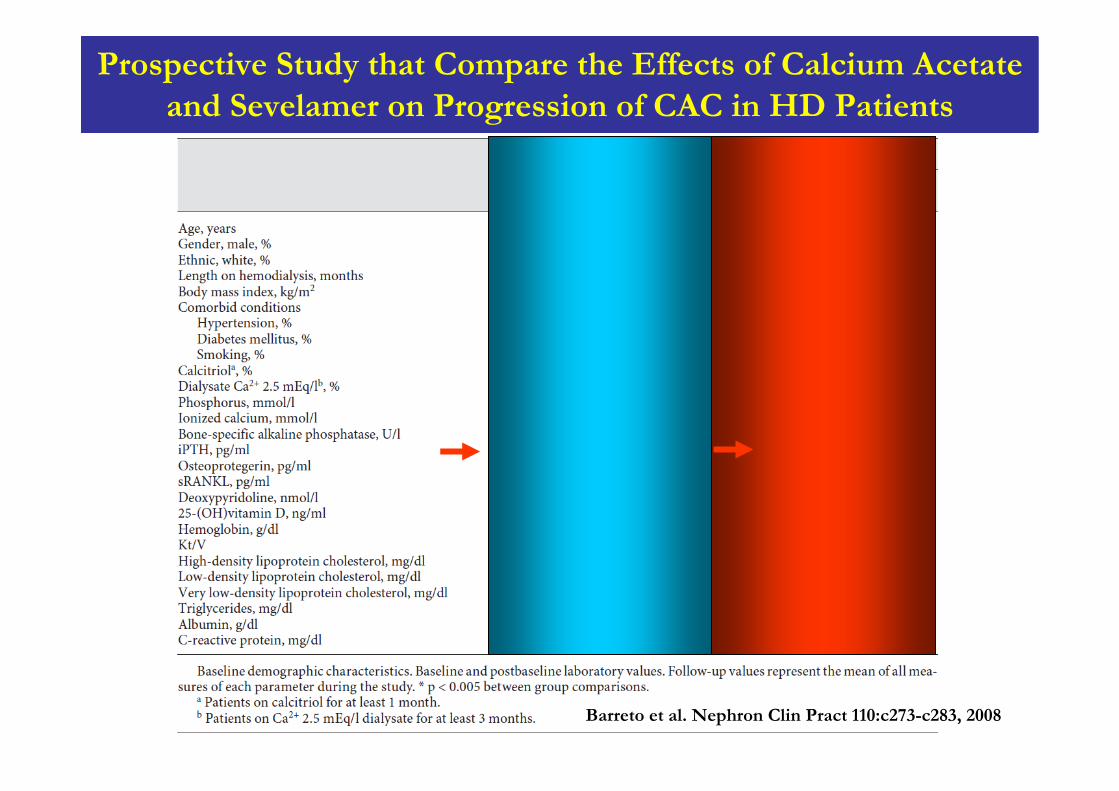
Prospective Study that Compare the Effects of Calcium Acetate and Sevelamer on Progression of CAC in HD Patients
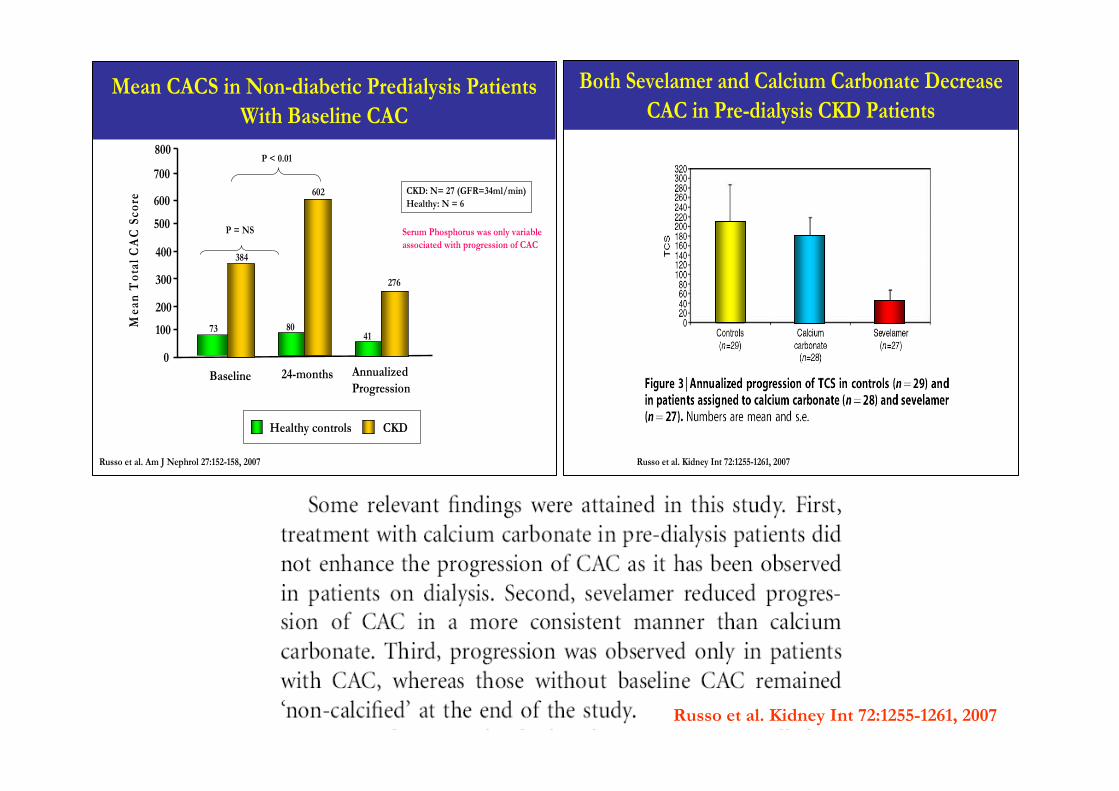
Mean CACS in Non-diabetic Predialysis Patients With Baseline CAC
0
100
200
300
400
500
600
700
Mea
n T
otal
CA
C S
core
Baseline 24-months
CKDHealthy controls
Russo et al. Am J Nephrol 27:152-158, 2007
Annualized Progression
CKD: N= 27 (GFR=34ml/min)Healthy: N = 6
800P < 0.01
P = NS
73 80
384
602
Serum Phosphorus was only variable associated with progression of CAC
41
276
Both Sevelamer and Calcium Carbonate Decrease CAC in Pre-dialysis CKD Patients
Russo et al. Kidney Int 72:1255-1261, 2007
Russo et al. Kidney Int 72:1255-1261, 2007
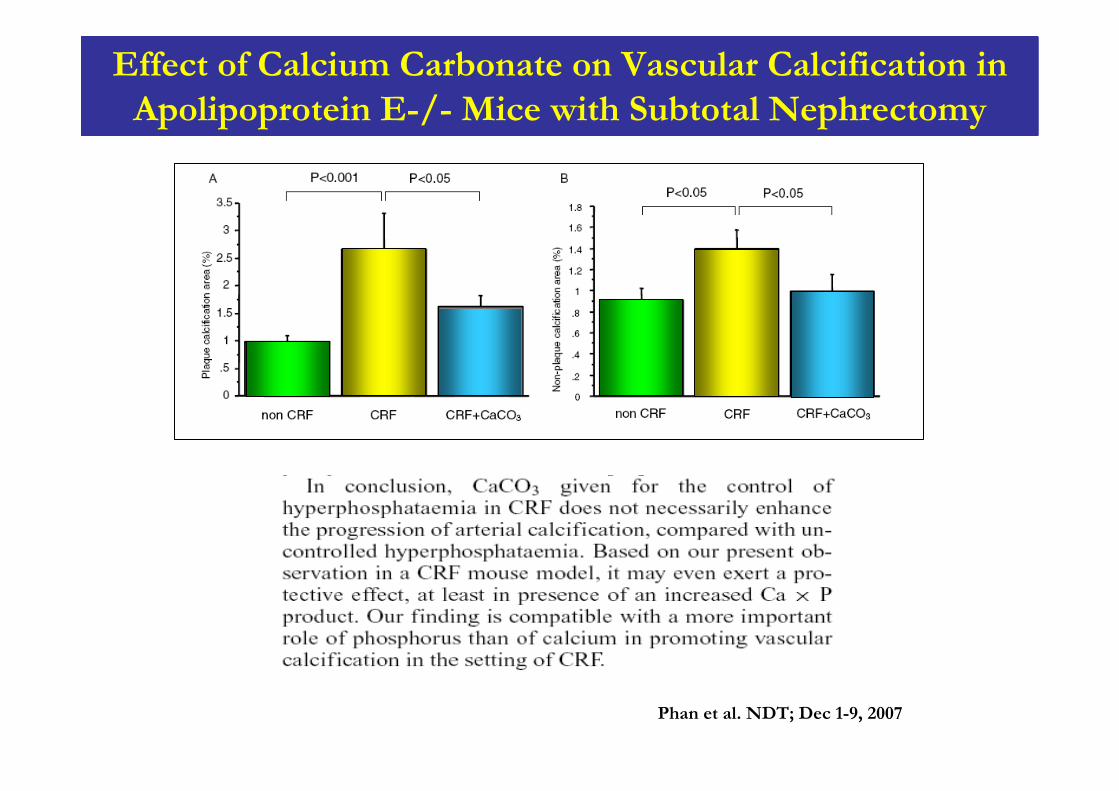
Effect of Calcium Carbonate on Vascular Calcification in Apolipoprotein E-/- Mice with Subtotal Nephrectomy
Phan et al. NDT; Dec 1-9, 2007
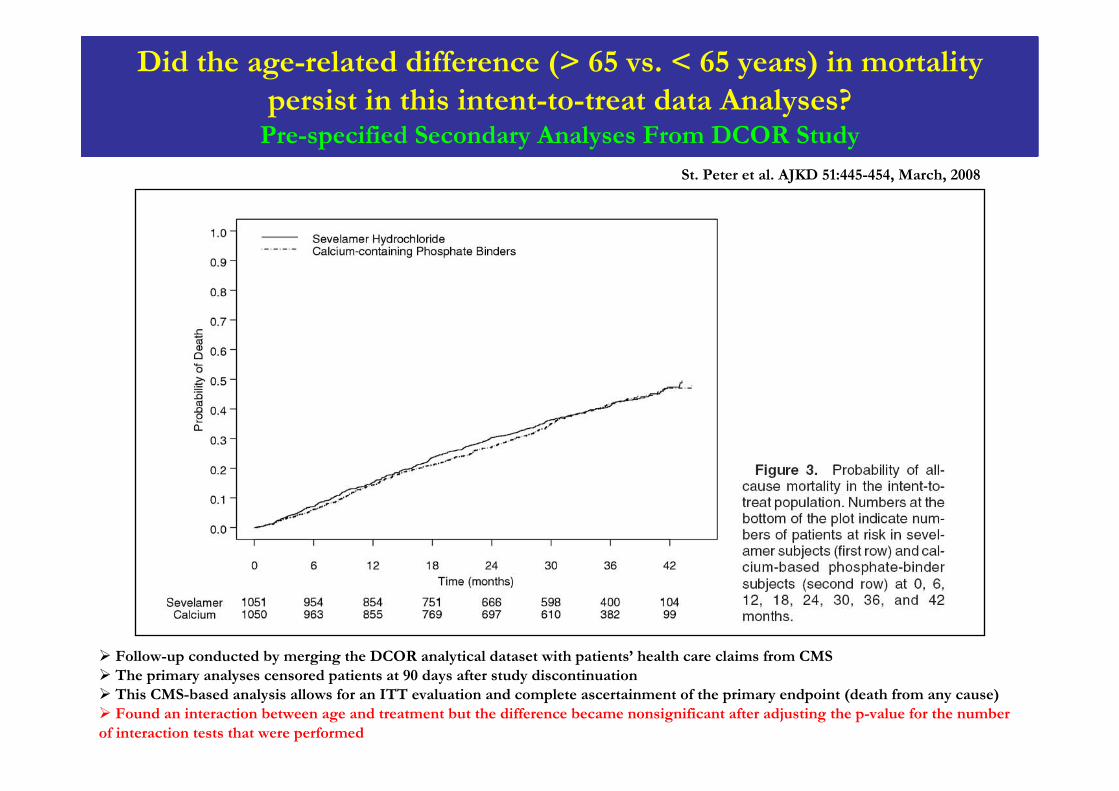
Did the age-related difference (> 65 vs. < 65 years) in mortality persist in this intent-to-treat data Analyses?
Pre-specified Secondary Analyses From DCOR Study
St. Peter et al. AJKD 51:445-454, March, 2008
Follow-up conducted by merging the DCOR analytical dataset with patients’ health care claims from CMSThe primary analyses censored patients at 90 days after study discontinuation This CMS-based analysis allows for an ITT evaluation and complete ascertainment of the primary endpoint (death from any cause)Found an interaction between age and treatment but the difference became nonsignificant after adjusting the p-value for the number
of interaction tests that were performed
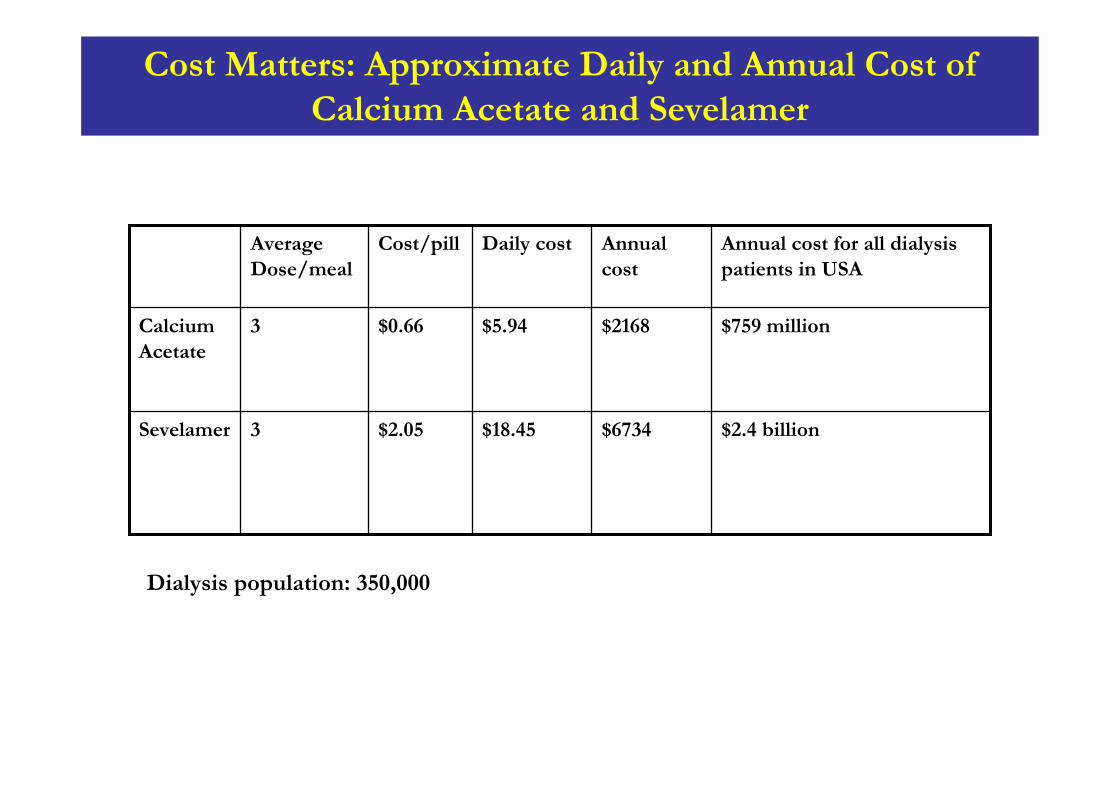
$2.4 billion
$759 million
Annual cost for all dialysis patients in USA
$6734$18.45$2.053Sevelamer
$2168$5.94$0.663Calcium Acetate
Annual cost
Daily costCost/pillAverage Dose/meal
Cost Matters: Approximate Daily and Annual Cost of Calcium Acetate and Sevelamer
Dialysis population: 350,000
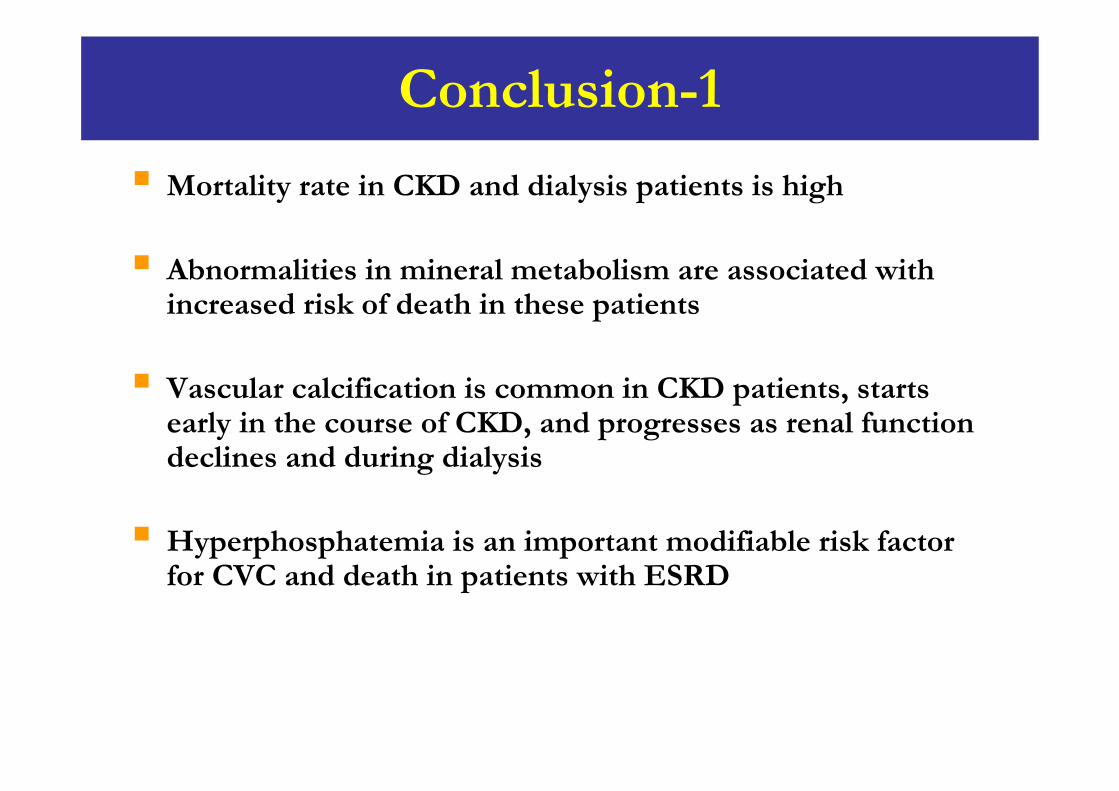
Conclusion-1
Mortality rate in CKD and dialysis patients is high
Abnormalities in mineral metabolism are associated with increased risk of death in these patients
Vascular calcification is common in CKD patients, starts early in the course of CKD, and progresses as renal function declines and during dialysis
Hyperphosphatemia is an important modifiable risk factor for CVC and death in patients with ESRD
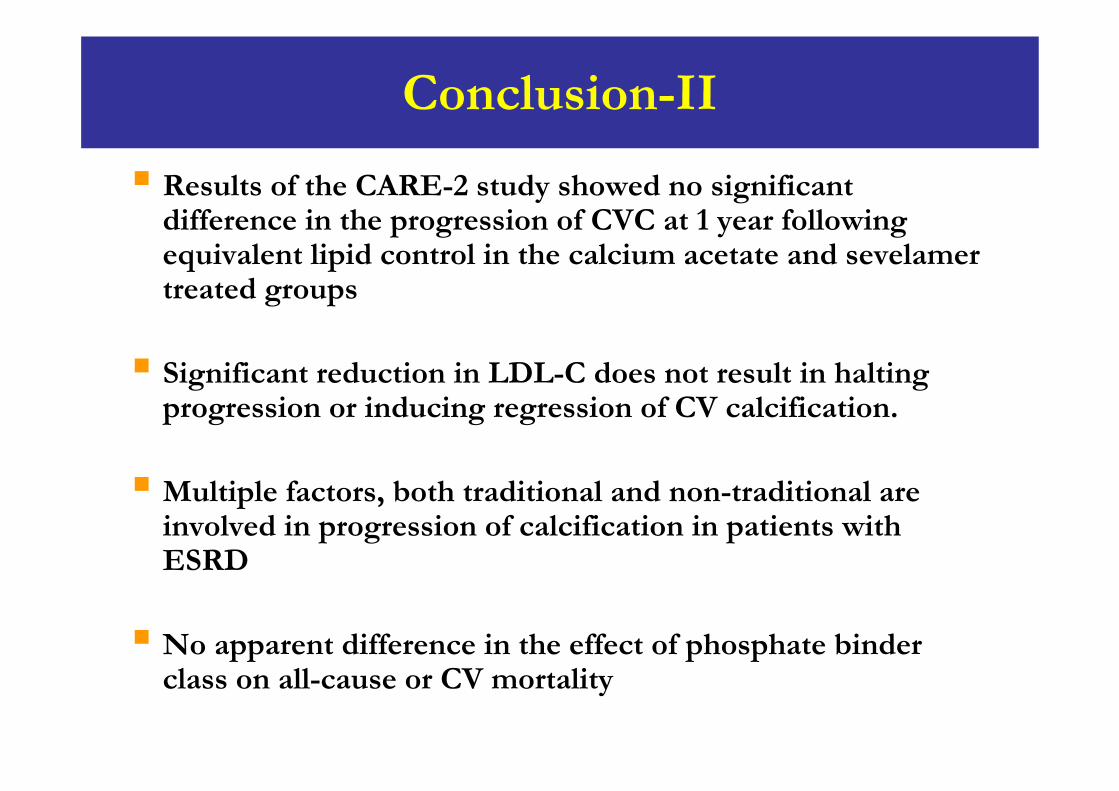
Conclusion-II
Results of the CARE-2 study showed no significant difference in the progression of CVC at 1 year following equivalent lipid control in the calcium acetate and sevelamer treated groups
Significant reduction in LDL-C does not result in halting progression or inducing regression of CV calcification.
Multiple factors, both traditional and non-traditional are involved in progression of calcification in patients with ESRD
No apparent difference in the effect of phosphate binder class on all-cause or CV mortality

Thank You
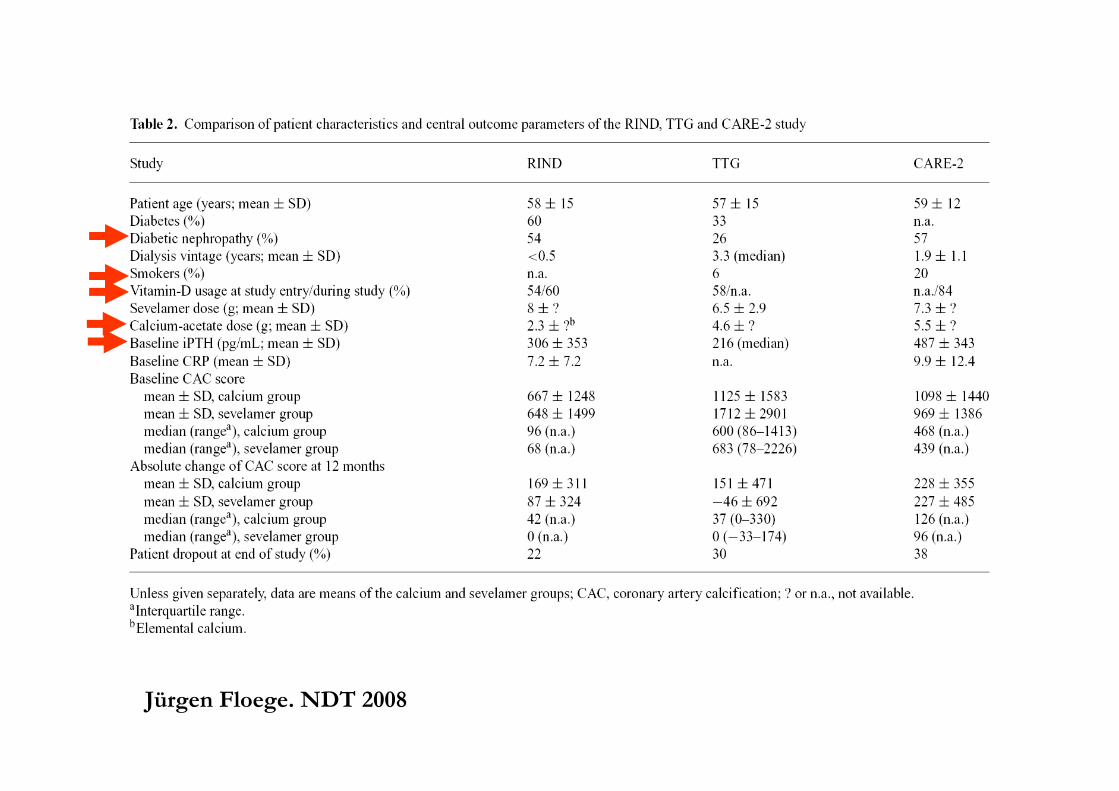
Jürgen Floege. NDT 2008
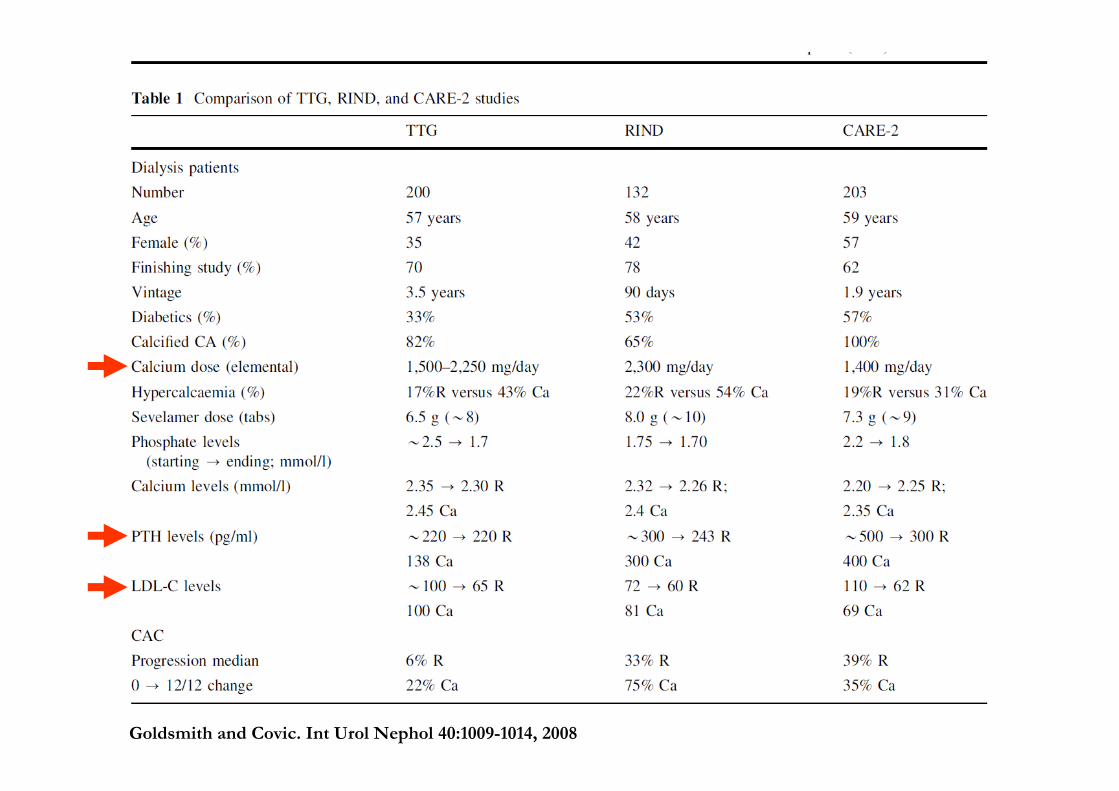
Goldsmith and Covic. Int Urol Nephol 40:1009-1014, 2008