Embed Size (px)
Citation preview
Eur. J. Biochem. 7Y, 161 - 171 (1977)
Metastable Aggregates in the Polymerisation of Tobacco-Mosaic-Virus Protein
Dieter VOGEL, Anthony C. H. DURHAM, and Guy D. DE MARCILLAC
Institut de Biologie Molkculaire et Cellulaire du Centre National de la Recherche Scientifique, Strasbourg
(Received April 1, 1977)
Metastable ‘overshoot’ aggregates are formed when tobacco mosaic virus A-protein (4- 8 S) polymerises to disks (20 - 22 S) and stacks of disks (27 - 30 S) at pH 6.8 - 7.6, 20 - 25 “C. Two cases are discernible. First, at ionic strength 0.1 M, below pH 7.1, a transient, definite 26-S peak appears: it transforms in a matter of hours into stable 22-S (disk) aggregates, at a rate that decreases with de- creasing pH and increasing temperature; above pH 7.1, there are only 4- 8-S and 22-S aggregates. Second, after a rapid increase of ionic strength from 0.1 to 0.75 M, below pH 7.6 a broad distribution of very large overshoot aggregates forms (maximum at 60 S, at pH 6.9). With decreasing pH, the maximum size of the overshoot aggregates increases and reequilibration to stacks of two disks (28 S) becomes slower. The 4- 8-S and 26-S aggregates can both form the very large overshoot aggregates, but disks and stacks of disks alone cannot.
Under these conditions, disks undergo only limited stacking (27 - 30 S) and a very slow conforma- tional change. A similar conformational change parallels the decomposition of the very large over- shoot aggregates. At pH 8, overshoot does not occur, probably because a higher pH inhibits the growth of rods.
Though the structure of the overshoot-forming aggregates is still unknown, three-layer aggregates (8 S and 26 S) are one possibility. We present a scheme including all reversible polymerisations so far observed for TMV protein and discuss their implications for the reconstitution of the virus in vitro.
When depolymerised tobacco mosaic virus (TMV) protein is brought rapidly to more strongly aggregating conditions, metastable (‘overshoot’) polymers form that subsequently give way to smaller, more stable polymers [l - 31. Scheele and Schuster [4] developed a kinetic model to simulate such behaviour, in which the protein polymerises by a slow nucleation step followed by fast propagation steps. Their model seems reasonable for the conditions of their experiments (pH below 6.8), where the protein helix can form, but it is difficult to understand how overshoot aggre- gates can form in the conditions of Adiarte et al. [3] between pH 6.9 and 8, where the two-layer mode of association predominates at equilibrium [5].
We thought that a more thorough examination of these overshoot reactions as a function of pH might give some hints about the structures of the aggregates participating. Also, since 0.1 M sodium pyrophos- phate, pH 7.25, makes the protein produce overshoot
Abbreviations TMV, tobacco mosaic virus, CD, circular di- chroism
aggregates, we hoped that using pyrophosphate as a polymerising agent might reveal something about its role in TMV reconstitution [6].
MATERIALS AND METHODS
TMV (vulgare strain) protein was prepared and stored as described earlier [7,8]. Portions of the stock solutions ( 5 mg/ml) were dialysed cold against po- tassium phosphate buffer of ionic strength 0.1 M and each desired pH, to form A-protein (4-8 S). ‘Disks’, or more accurately the equilibrium mixture of about 80 % disks (20 - 22 S) and 20 % 4 - 8-S protein, were made by dialysis for at least 24 h at room tem- perature at pH 6.9, after slow warming. After a low- speed cleaning spin and/or ultrafiltration (Millipore, pore size 0.8 pm) followed by concentration determina- tion, the protein was kept either cold (A-protein) or at room temperature (disks) until use.
We usually formed overshoot aggregates as fol- lows. 1-ml portions of the protein solution at a chosen
162 Metastable Polymerisation of TMV Protein
pH were warmed to 22 "C or 25 "C for 5 min. With good stirring, 0.7 ml of 0.25 M sodium pyrophosphate was added, with its pH preadjusted so that the final pH of the mixture was as desired. Mixing times between 1 and 40 s all produced largely similar results. The mixtures, with pH 6.8 - 8.0, protein concentra- tion 2.8-3.4 mg/ml, final ionic strength 0.72-0.78 M [9] (neglecting the mutual influence of phosphate and pyrophosphate), were again ultrafiltered and observed immediately in thermostated cuvettes.
True equilibrium of aggregation was obtained in this way. Helical aggregates, at pH 4.6, were dialysed in the cold overnight against potassium phosphate buffer, pH 8, ionic strength 0.1 M. After clarification by ultrafiltration, the solution was dialysed cold for 3 h against a mixture of 0.05 M potassium phosphate and 0.1 M sodium pyrophosphate solutions (ionic strength 0.74- 0.79 M), whose pH had been adjusted at room temperature. Then the entire solution was brought slowly to room temperature, left to dialyse for 2 days, ultrafiltered again, and observed.
Absorbance and turbidity were measured in these spectrophotometers: Zeiss PMQ I1 and Cary 118, in Strasbourg; Zeiss PMQ I1 and DMR 10, and Beckman M24 with ultraviolet accessory, in Regens- burg. Results from all the instruments agreed well together. The temperatures of the thermostatted cuvette holders were checked with a Yellow Springs Instruments 46 TUC telethermometer, with the sensor in the reference cuvette. Usually, the temperature was adjusted to 25 & 0.2 "C and checked with an Abimed 255 recorder during the slow kinetic experi- ments. Protein concentrations were determined using an absorption coefficient at 281 nm of 1.30 cm2/mg [lo], and with a correction for scattering according to Englander and Epstein Ell]. Turbidity was measured at 320 nm.
Circular dichroism (CD) measurements were per- formed with a Roussel-Jouan Dichrographe 11, with scale expansion to A = 1 x mm-'. CD results, quoted here as A E = ( E ~ - E ~ ) 1 mol-I cm-l, assuming a subunit molecular weight of 17 500, were measured at 280 and 295 nm relative to 310 nm [7], correcting for the zero values of cuvette and buffer.
Analytical sedimentation Schlieren patterns were obtained with Beckman model E ultracentrifuges (in Strasbourg and Regensburg) at 47660 or 59780 rev./ min, in double-sector cells, at 23 - 25 "C. Sedimenta- tion coefficients are reported here as SZO, ,., values. Areas under Schlieren peaks were measured by tracing enlarged images of the photographic plates on paper, cutting out and weighing the peaks, and then correct- ing them for radial dilution. Where necessary they were decomposed into Gaussian components using a computer program, with the Fletcher and Powell [12] minimisation method, provided by Mrs R. G. Adiarte.
Electron micrographs were made by Dr A. Nico- laieff. A formvar carbon-coated grid was placed on a drop of sample solution, then placed on a drop of 1 uranyl acetate negative stain (which is unavoidably at pH 5 and therefore may alter the sample slightly), then dried, and examined in a Siemens Elmiskop 101.
RESULTS
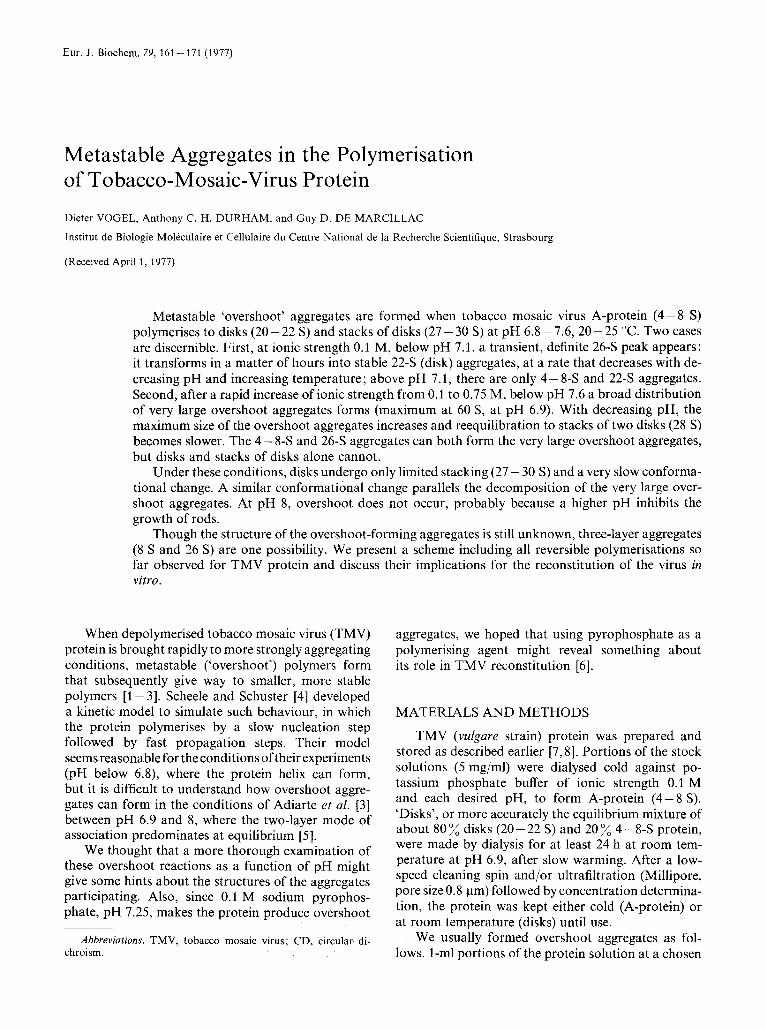
Fig.1 shows how the turbidities of solutions of TMV protein varied with time after polymerisation was initiated by raising the ionic strength to about 0.75 M with sodium pyrophosphate. With A-protein as starting material, turbidity increased rapidly for 10 - 20 min and then slowly decreased. With decreas- ing pH, the maximum turbidity became greater and the rate of decay became slower.
In contrast, with disks as starting material, the turbidity was not pH-dependent, but remained nearly constant (in the narrow, hatched region in Fig.1) right across both the time and pH range investigated. Only above pH 7.6 did disks and A-protein behave the same, and only above pH 7.4 did they have similar final turbidity values after 20 h.
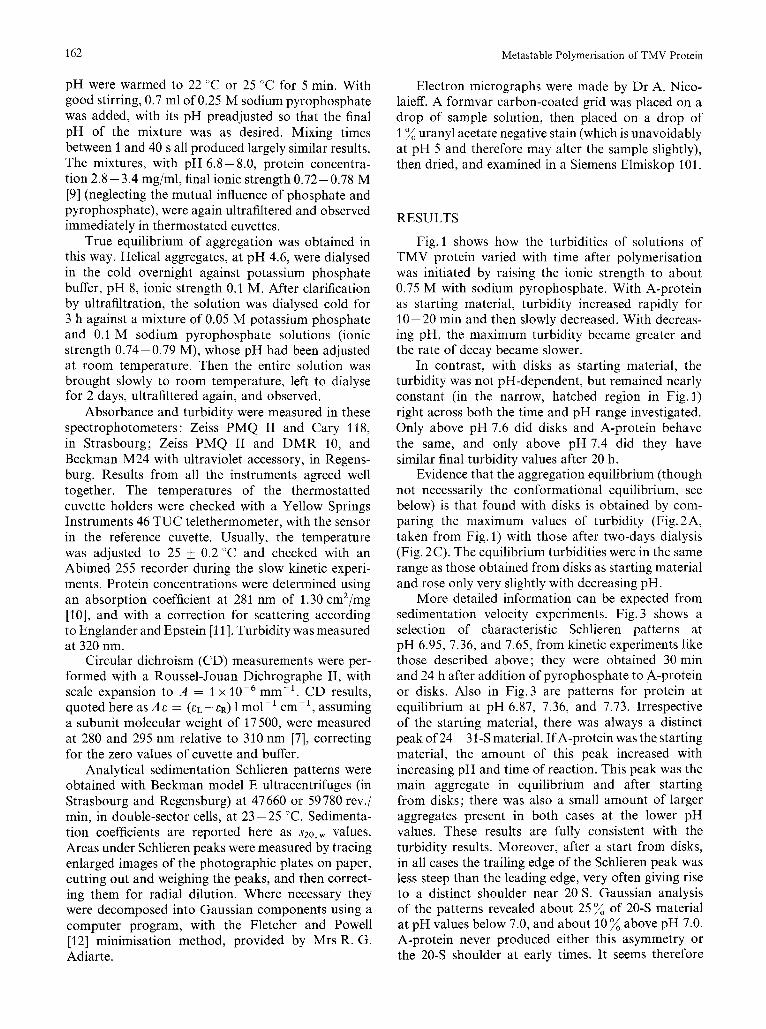
Evidence that the aggregation equilibrium (though not necessarily the conformational equilibrium, see below) is that found with disks is obtained by com- paring the maximum values of turbidity (Fig.2A, taken from Fig. 1) with those after two-days dialysis (Fig. 2C). The equilibrium turbidities were in the same range as those obtained from disks as starting material and rose only very slightly with decreasing pH.
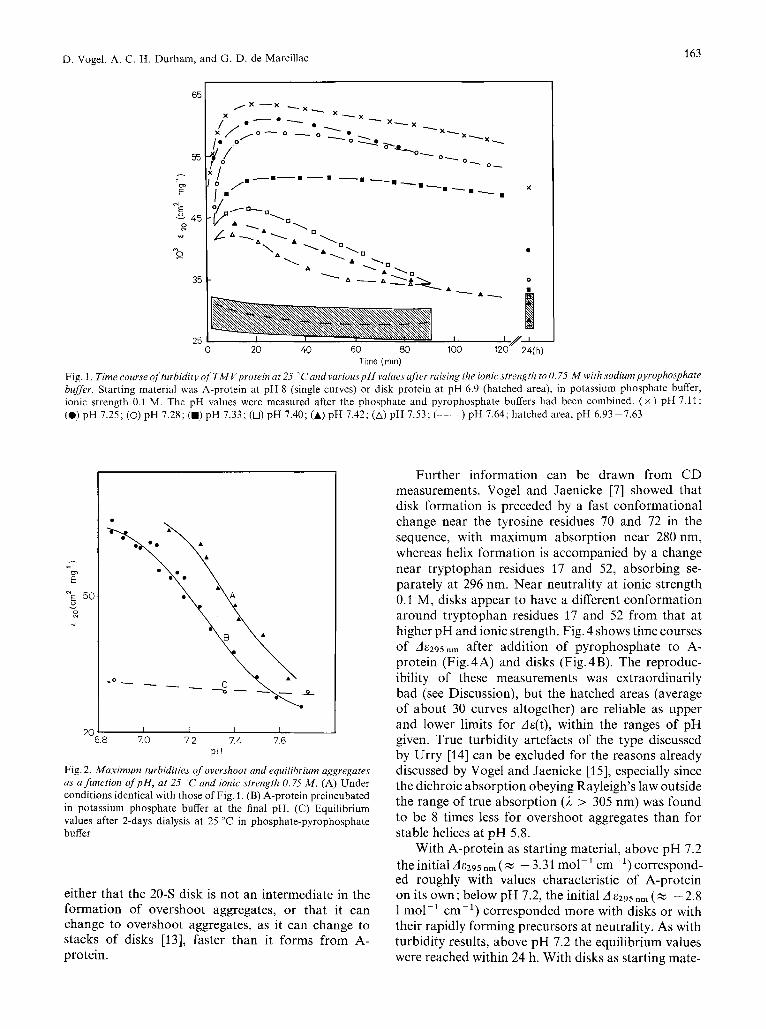
More detailed information can be expected from sedimentation velocity experiments. Fig. 3 shows a selection of characteristic Schlieren patterns at pH 6.95, 7.36, and 7.65, from kinetic experiments like those described above; they were obtained 30 min and 24 h after addition of pyrophosphate to A-protein or disks. Also in Fig.3 are patterns for protein at equilibrium at pH 6.87, 7.36, and 7.73. Irrespective of the starting material, there was always a distinct peak of 24- 31-S material. IfA-protein was the starting material, the amount of this peak increased with increasing pH and time of reaction. This peak was the main aggregate in equilibrium and after starting from disks; there was also a small amount of larger aggregates present in both cases at the lower pH values. These results are fully consistent with the turbidity results. Moreover, after a start from disks, in all cases the trailing edge of the Schlieren peak w d S less steep than the leading edge, very often giving rise to a distinct shoulder near 20 S. Gaussian analysis of the patterns revealed about 25% of 20-S material at pH values below 7.0, and about 10 % above pH 7.0. A-protein never produced either this asymmetry or the 20-S shoulder at early times. It seems therefore
D. Vogel, A. C. H. Durham, and G. D. de Marcillac 163
I I ,
35
25
0
0
A-A-..- I
-/- 100 120 24(h)
Time (min)
Fig. 1. Time course of turbidity o j T M Vprotein at 25 "Cand variouspH values after raising the ionic strength to 0.75 M with sodiumpyropho.Tphatr buffer. Starting material was A-protein at pH 8 (single curves) or disk protein at pH 6.9 (hatched area), in potassium phosphate buffer, ionic strength 0.1 M. The pH values were measured after the phosphate and pyrophosphate buffers had been combined. ( x ) pH 7.1 1 : (0) pH 7.25; (0) pH 7.28; (M) pH 7.33; (0) pH 7.40; (A) pH 7.42; (A) pH 7.53; (-----) pH 7.64; hatched area, pH 6.93-7.63
20 I I I I
6 8 70 7 2 7 4 7 6 PH
Fig. 2. Maximum turbidities of overshoot and equilibrium aggregates as a function of pH, at 25 "C and ionic strength 0.75 M . (A) Under conditi~ns identical with those of Fig. 1. (B) A-protein preincubated in potassium phosphate buffer at the final pH. (C) Equilibrium values after 2-days dialysis at 25 "C in phosphate-pyrophosphate buffer
either that the 20-S disk is not an intermediate in the formation of overshoot aggregates, or that it can change to overshoot aggregates, as it can change to stacks of disks [13], faster than it forms from A- protein.
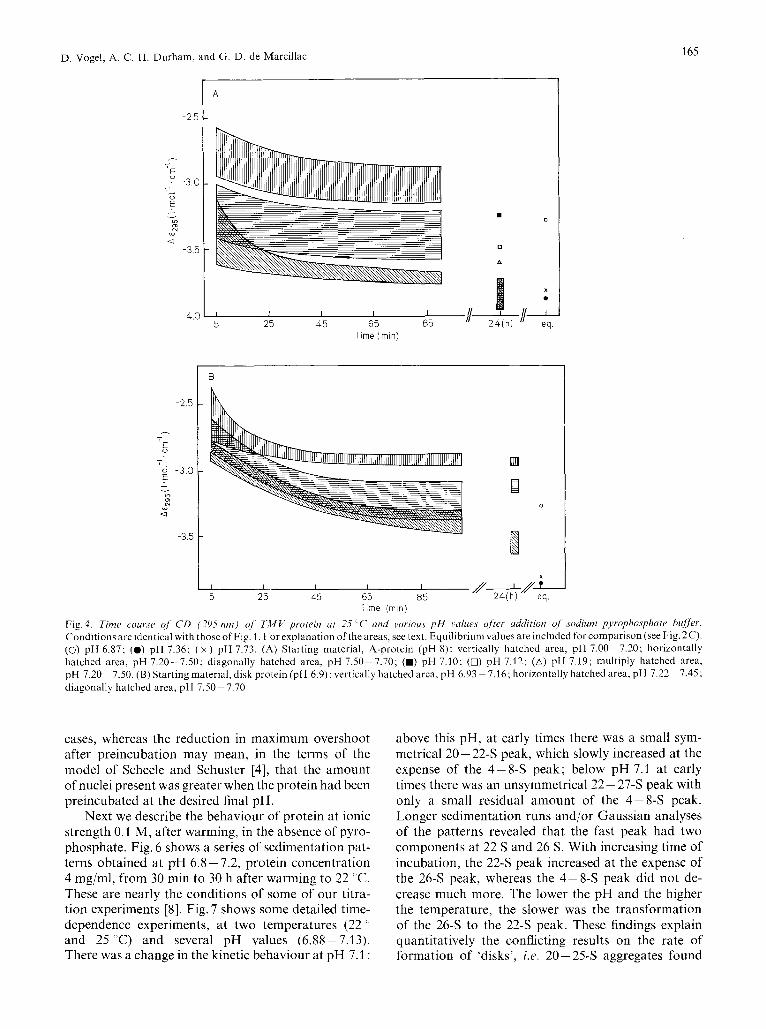
Further information can be drawn from CD measurements. Vogel and Jaenicke [7] showed that disk formation is preceded by a fast conformational change near the tyrosine residues 70 and 72 in the sequence, with maximum absorption near 280 nm, whereas helix formation is accompanied by a change near tryptophan residues 17 and 52, absorbing se- parately at 296 nm. Near neutrality at ionic strength 0.1 M, disks appear to have a different conformation around tryptophan residues 17 and 52 from that at higher pH and ionic strength. Fig. 4 shows time courses of dE295nm after addition of pyrophosphate to A- protein (Fig. 4A) and disks (Fig. 4B). The reproduc- ibility of these measurements was extraordinarily bad (see Discussion), but the hatched areas (average of about 30 curves altogether) are reliable as upper and lower limits for Ae(t), within the ranges of pH given. True turbidity artefacts of the type discussed by Urry [14] can be excluded for the reasons already discussed by Vogel and Jaenicke [15], especially since the dichroic absorption obeying Rayleigh's law outside the range of true absorption (A > 305 nm) was found to be 8 times less for overshoot aggregates than for stable helices at pH 5.8.
With A-protein as starting material, above pH 7.2 the initial A6295 nm (z - 3.31 mo1-l cm-') correspond- ed roughly with values characteristic of A-protein on its own; below pH 7.2, the initial d &295 ",,, ( z -2.8 1 mol-' cm-') corresponded more with disks or with their rapidly forming precursors at neutrality. As with turbidity results, above pH 7.2 the equilibrium values were reached within 24 h. With disks as starting mate-
164
0.5 h
24 h
Equil.
Metastable Polymerisation of TMV Protein
pH 6.9 pH 7.36 pH 7.7 Fig. 3. Sclilieren patterns of' owrshooi and equilibrium aggregates, in potus.sizmni pliosphatelsodium pyrophosphnte buffer at ionic sfrenRflz 0.75 M , 23 f 2 "C, protein concmtruiion 3.3 nzglml. Upper traces starting from A-protein (at pH 8: ionic strength 0.1 M), lower traces from disks (at pH 6.9; ionic strength 0.1 M). The times given are measured from the addition of sodium pyrophosphate. The exact pH values used are discussed in the text
rial, the initial values ( z - 2.8 1 mol-' cm-') were characteristic of disks, but at high ionic strength, equilibrium C D values were never reached. At 280 nm (not shown), no characteristic changes were observed during the first 2 h for either starting aggregate. The values were significantly more positive than for equilibrium conditions, with the differences growing less as pH increased. Again, the approach to equi- librium was faster for A-protein as starting material than for disks.
These C D results, both at 280 and 295 nm, seem to indicate that in overshoot aggregates the change in size was accompanied by a change in conformation, whereas in the aggregates produced starting from disks the conformation seems somewhat frozen. Thus 'true' equilibration, including changes in the states of aggregation plus conformation, takes a long time and cannot be observed by turbidity or sedimentation alone. The conformational change can be minute, considering the high sensitivity of CD measure- ments.
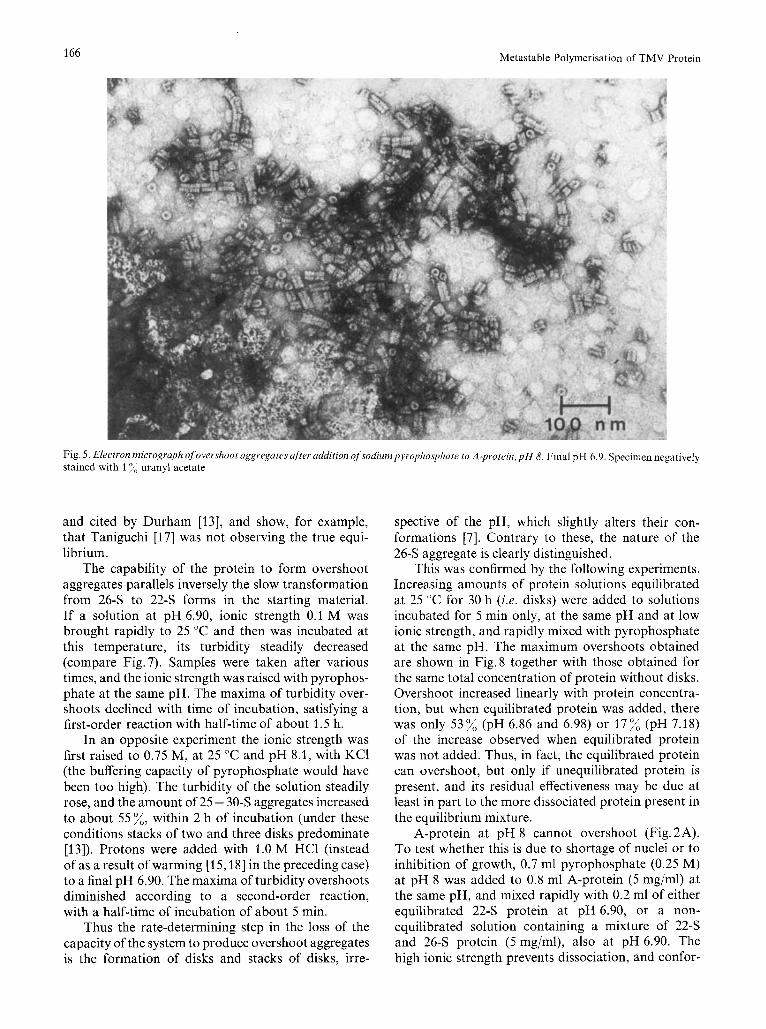
Electron micrographs (Fig. 5) of the overshoot aggregates show rods of diameter 18 nm, with a thin hole in the middle, like TMV. The average length of 20-60 nm (at pH 6.9) corresponds to stacks of 4- 12 disks. The maximum length was about 300 nm. The longer particles often had nicks and gaps visible.
If the pH of A-protein starting material was pre- adjusted by cold dialysis to values between 6.8 and 7.7 instead of 8.0, the pH-dependent rapid conforma- tional change [15,16] took place during the heating, before pyrophosphate was added. Under these con- ditions, the kinetics of rapid increase and slow decay of turbidity at any final pH were very similar to those obtained by the procedure described above. How- ever, the maximum turbidities were significantly reduced (Fig.2B compared with Fig.2A). Also, in Schlieren patterns obtained at pH 7.00 and 7.15, the fastest peaks were now at 44 S instead of 51 S, and 37 S instead of 40 S, respectively. The overall similarity irrespective of the starting material indicates that the rate-determining step was the same in both
D. Vogel, A. C. H. Durham. and G. D . de Marcillac 165
-2 5
- - 5 - 3 0 - 0
E - - LD
N ", 4
-3.5
-4 c
A
85 " 2 4 ( h ) I' eq. 5 25 4 5 65 Time (rnin)
0
1 I I
5 25 45 65 85 Time (rnin)
Fig.4. Time cour.~e of C D (295 nm) of l 'MV protein ut 25 ' C and vuri0u.y p H vulurs ufter uddition of sodium pyropho.~pi~ate bufPr. Conditions are identical with those of Fig. 1. For explanation ofthe areas. see text. Equilibrium values are included for comparison (see Fig. 2C). (0) pH 6.87; (0) pH 7.36; ( x ) pH 7.73. (A) Starting material, A-protein (pH 8): vertically hatched area, pH 7.00-7.20; horizontally hatched area, pH 7.20--7.50; diagonally hatched area, pH 7.50-7.70; (m) pH 7.10; (0) pH 7.12; (A) pH 7.19: multiply hatched area, pH 7.20- 7.50. (B) Starting material, disk protein (pH 6.9): vertically hatched area, pH 6.93 - 7.16; horizontally hatched area, pH 7.22- 7.45; diagonally hatched area, pH 7.50- 7.70
cases, whereas the reduction in maximum overshoot after preincubation may mean, in the terms of the model of Scheele and Schuster [4], that the amount of nuclei present was greater when the protein had been preincubated at the desired final pH.
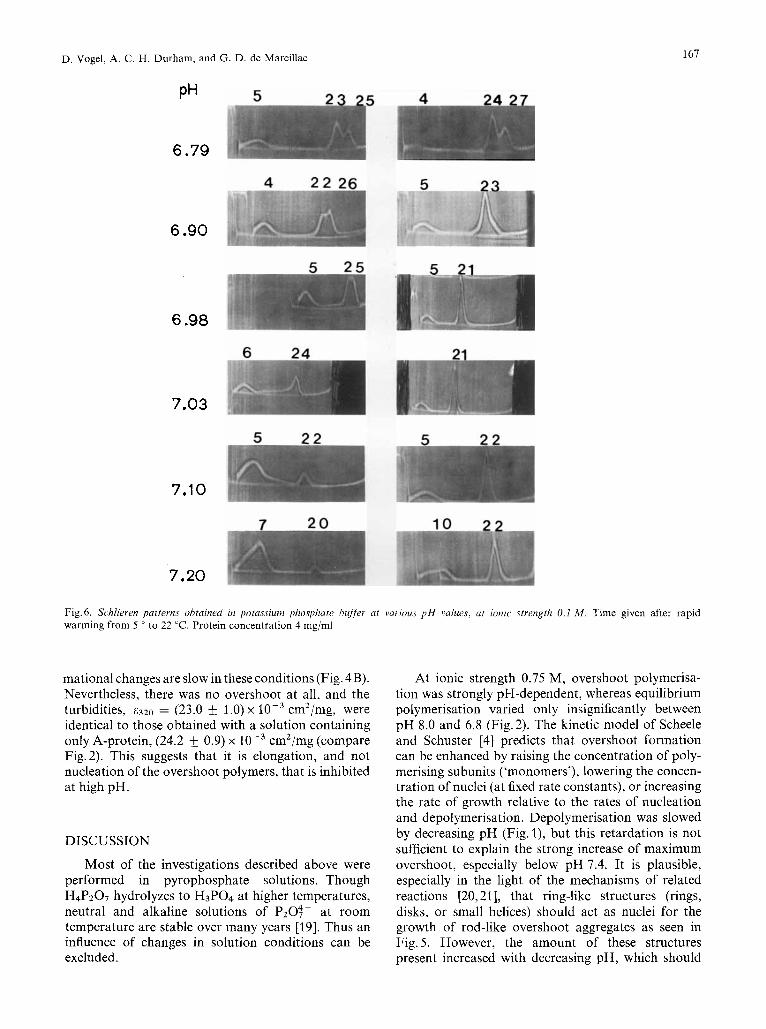
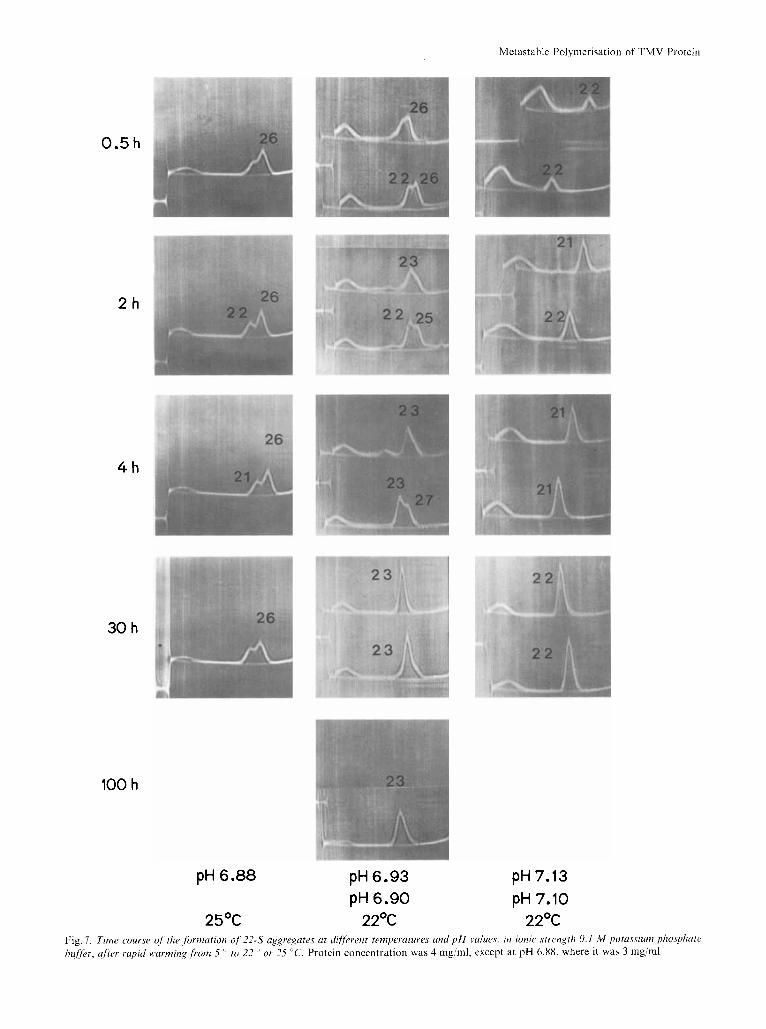
Next we describe the behaviour of protein at ionic strength 0.1 M, after warming, in the absence of pyro- phosphate. Fig. 6 shows a series of sedimentation pat- terns obtained at pH 6.8 - 7.2, protein concentration 4 mg/ml, from 30 min to 30 h after warming to 22 "C. These are nearly the conditions of some of our titra- tion experiments [8]. Fig. 7 shows some detailed time- dependence experiments, at two temperatures (22 ' and 25 "C) and several pH values (6.88-7.13). There was a change in the kinetic behaviour at pH 7.1 :
above this pH, at early times there was a small sym- metrical 20- 22-S peak, which slowly increased at the expense of the 4- 8-S peak; below pH 7.1 at early times there was an unsymmetrical 22 - 27-S peak with only a small residual amount of the 4-8-S peak. Longer sedimentation runs and/or Gaussian analyses of the patterns revealed that the fast peak had two components at 22 S and 26 S. With increasing time of incubation, the 22-S peak increased at the expense of the 26-S peak, whereas the 4-8-S peak did not de- crease much more. The lower the pH and the higher the temperature, the slower was the transformation of the 26-S to the 22-S peak. These findings explain quantitatively the conflicting results on the rate of formation of 'disks', i.e. 20 - 25-S aggregates found
166 Metastable Polymerisation of TMV Protein
Fig. 5 . Electron micrograph of overshoot aggregates after addition ofsodiumpyrophosphate to A-protein, p H 8. Final pH 6.9. Specimen negatively stained with 1 % uranyl acetate
and cited by Durham [13], and show, for example, that Taniguchi [17] was not observing the true equi- librium.
The capability of the protein to form overshoot aggregates parallels inversely the slow transformation from 26-S to 22-S forms in the starting material. If a solution at pH 6.90, ionic strength 0.1 M was brought rapidly to 25 "C and then was incubated at this temperature, its turbidity steadily decreased (compare Fig. 7). Samples were taken after various times, and the ionic strength was raised with pyrophos- phate at the same pH. The maxima of turbidity over- shoots declined with time of incubation, satisfying a first-order reaction with half-time of about 1.5 h.
In an opposite experiment the ionic strength was first raised to 0.75 M, at 25 "C and pH 8.1, with KC1 (the buffering capacity of pyrophosphate would have been too high). The turbidity of the solution steadily rose, and the amount of 25 - 30-S aggregates increased to about 55 %, within 2 h of incubation (under these conditions stacks of two and three disks predominate [13]). Protons were added with 1.0 M HC1 (instead of as a result of warming [ 15,181 in the preceding case) to a final pH 6.90. The maxima of turbidity overshoots diminished according to a second-order reaction, with a half-time of incubation of about 5 min.
Thus the rate-determining step in the loss of the capacity of the system to produce overshoot aggregates is the formation of disks and stacks of disks, irre-
spective of the pH, which slightly alters their con- formations [7]. Contrary to these, the nature of the 26-S aggregate is clearly distinguished.
This was confirmed by the following experiments. Increasing amounts of protein solutions equilibrated at 25 "C for 30 h (i.e. disks) were added to solutions incubated for 5 min only, at the same pH and at low ionic strength, and rapidly mixed with pyrophosphate at the same pH. The maximum overshoots obtained are shown in Fig.8 together with those obtained for the same total concentration of protein without disks. Overshoot increased linearly with protein concentra- tion, but when equilibrated protein was added, there was only 53% (pH 6.86 and 6.98) or 17% (pH 7.18) of the increase observed when equilibrated protein was not added. Thus, in fact, the equilibrated protein can overshoot, but only if unequilibrated protein is present, and its residual effectiveness may be due at least in part to the more dissociated protein present in the equilibrium mixture.
A-protein at pH 8 cannot overshoot (Fig. 2A). To test whether this is due to shortage of nuclei or to inhibition of growth, 0.7 ml pyrophosphate (0.25 M) at pH 8 was added to 0.8 ml A-protein (5 mg/ml) at the same pH, and mixed rapidly with 0.2 ml of either equilibrated 22-S protein at pH 6.90, or a non- equilibrated solution containing a mixture of 22-S and 26-S protein (5 mgiml), also at pH 6.90. The high ionic strength prevents dissociation, and confor-
D. Vogel, A. C. H. Durham, and G. D. de Marcillac
PH
167
6.79
6.90
6.98
7.03
7.10
7.20
Fig. 6 . Srhlieren patterns obtained in potassium phosphate buffer at various p H values, at ionic strength 0.1 M . Time given after rapid warming from 5 O to 22 "C. Protein concentration 4 mg/ml
mational changes are slow in these conditions (Fig. 4 B). Nevertheless, there was no overshoot at all, and the turbidities, &320 = (23.0 5 1.0) x cm2/mg, were identical to those obtained with a solution containing only A-protein, (24.2 & 0.9) x cm2/mg (compare Fig.2). This suggests that it is elongation, and not nucleation of the overshoot polymers, that is inhibited at high pH.
DISCUSSION
Most of the investigations described above were performed in pyrophosphate solutions. Though H4P207 hydrolyzes to H3P04 at higher temperatures, neutral and alkaline solutions of P20?- at room temperature are stable over many years [19]. Thus an influence of changes in solution conditions can be excluded.
At ionic strength 0.75 M, overshoot polymerisa- tion was strongly pH-dependent, whereas equilibrium polymerisation varied only insignificantly between pH 8.0 and 6.8 (Fig.2). The kinetic model of Scheele and Schuster [4] predicts that overshoot formation can be enhanced by raising the concentration of poly- merising subunits ('monomers'), lowering the concen- tration of nuclei (at fixed rate constants), or increasing the rate of growth relative to the rates of nucleation and depolymerisation. Depolymerisation was slowed by decreasing pH (Fig. l), but this retardation is not sufficient to explain the strong increase of maximum overshoot, especially below pH 7.4. It is plausible, especially in the light of the mechanisms of related reactions [20,21], that ring-like structures (rings, disks, or small helices) should act as nuclei for the growth of rod-like overshoot aggregates as seen in Fig. 5. However, the amount of these structures present increased with decreasing pH, which should
Metastable Polymerisation of TMV Protein
0.5 h
2h
4h
30 h
100 h
pH 6.88 pH 6.93 pH 7.13 pH 6.90 pH 7.10
25OC 22OC 22OC Fig. I. Time course o j the formation of 2 2 4 aggregates ut riifyerenr temperatures and p H whres. in ionic strrnXrh 0. I M potassium phosphate bufler, after rapid warming from 5 '' to 22 or 25 "C. Protein concentration was 4 mg/ml, except at pH 6.88, where it was 3 mg/ml
D. Vogel, A. C. H. Durham, and G. D. de Marcillac 169
0 18 -
016 -
E :: m - m
2 014 - c m 1?
0 m u 4
012.
010 .
2 00 2 50 3 00 Protein concentrat ion (rng rn.')
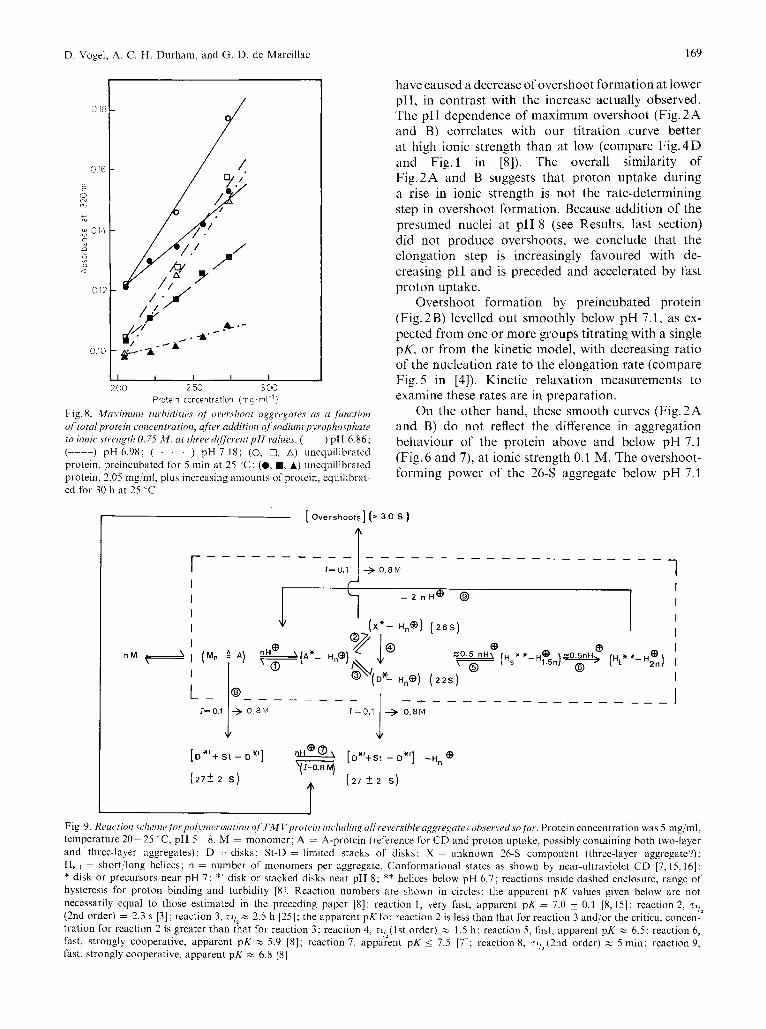
Fig. 8 . Maximum turhidities oj overshoot aggwga/e.s as a ,function of total protein concentration, uftrr addidition of .sodium pyrophosphate to ionic .strength 0.75 M , at three dgferentpH d u e s . (-) pH 6.86; (----) pH 6.98; (-.-.-.-) pH 7.18; (0, 0, A) unequilibrated protein, preincubated for 5 min at 25 ' C ; (0, a, A) unequilibrated protein, 2.05 mg/ml, plus increasing amounts of protein, equilibral- ed for 30 h at 25 "C
have caused a decrease of overshoot formation at lower pH, in contrast with the increase actually observed. The pH dependence of maximum overshoot (Fig. 2 A and B) correlates with our titration curve better at high ionic strength than at low (compare Fig.4D and Fig. 1 in [S]). The overall similarity of Fig.2A and B suggests that proton uptake during a rise in ionic strength is not the rate-determining step in overshoot formation. Because addition of the presumed nuclei at pH 8 (see Results, last section) did not produce overshoots, we conclude that the elongation step is increasingly favoured with de- creasing pH and is preceded and accelerated by fast proton uptake.
Overshoot formation by preincubated protein (Fig.2B) levelled out smoothly below pH 7.1, as ex- pected from one or more groups titrating with a single pK, or from the kinetic model, with decreasing ratio of the nucleation rate to the elongation rate (compare Fig. 5 in [4]). Kinetic relaxation measurements to examine these rates are in preparation.
On the other hand, these smooth curves (Fig.2A and B) do not reflect the difference in aggregation behaviour of the protein above and below pH 7.1 (Fig. 6 and 7), at ionic strength 0.1 M. The overshoot- forming power of the 26-S aggregate below pH 7.1
[ Overshoots] (> 30
I I I - 2 n ~ @ @ I I
I
I V $j;~n'l ( 2 6 s )
d Q n M - I (Mn E0.5 nH\ ( Hs* *- Hy5n) go 5nH>
0 @ 7
I %( D'- Hn@) (22,;
- - - - - - - - - - _ _ - _ _ _ _ _ I=0 .1 + 0 . 8 M I
(I=0.8 M)
( 2 7 2 2 S)
[ D * ' + S t - D * ' ] T H d o \ [D*'+St -.*'I - H n @
(27k 2 S)
Fig. 9. Rruction sclzerne fi),-l,oljnicriscition of T M Vproi"iri iirc~lutling all reversible u g p q a t e s observed.vo far . Protein concentration was 5 mg/ml, temperature 20-25 "C, pH 5-8. M = monomer; A = A-protein (reference for CD and proton uptake. possibly containing both two-layer and three-layer aggregates); D = disks: St-D = limited stacks of disks: X = unknown 26-S component (three-layer aggregate?); HS,l = short/long heliccs; n = number of monomers per aggregate. Conformational states as shown by near-ultraviolet C D [7,15,16]: * disk or precursors near pH 7: *' disk or stacked disks near pH 8 ; ** helices below pH 6.7; reactions inside dashed enclosure, range of hysteresis for proton binding and turbidity [8]. Reaction numbers are shown in circles; the apparent pK values given below are not necessarily equal to those estimated in the preceding paper 181: reaction 1, very fast, apparent pK = 7.0 0.1 [8,15]; reaction 2. rl,2 (2nd order) = 2.3 s [ 3 ] ; reaction 3 , ~ 1 1 ~ c 2.5 h [25]; the apparent pK for reaction 2 Is less than that for reaction 3 and/or the critical concen- tration for reaction 2 is greater than that for reaction 3: reaction 4, ~l , , ( ls t order) c 1.5 h ; reaction 5, fast. apparent pK % 6.5; reaction 6, fast, strongly cooperative, apparent pK h 5.9 [ X I ; reaction 7, apparent pK i 7.5 [7]; reaction 8, rli2(2nd order) z 5 min; reaction 9, fast, strongly cooperative, apparent pK Y 6.8 [8]
170 Metastable Polymerisation of TMV Protein
continued that of the 4-8-S protein above pH 7.1. Its strong dependence on the 22-S/26-S ratio (Fig.7 and kinetic experiment), independent of the nearly constant concentration of the 4- 8-S protein, clearly shows that structural considerations have to be incor- porated into a kinetic model to explain the occurrence of overshoot aggregates. In this sense, overshoot for- mation could in principle be used as a method of detecting structural changes in other proteins.
In the light of these new findings, the mechanisms of TMV protein polymerisation near pH 7 and the structures of the aggregates formed need to be dis- cussed again. The scheme in Fig. 9 tries to summarise some of the most important transitions so far observed in TMV protein. 'Parallel' reactions are assumed to lead to disks (22 S, 'D') and 26-S ('X') aggregates, though 'A' and/or 'A"' may be inhomogeneous, containing both small two-layer and three-layer aggre- gates (see below). X is favoured kinetically below pH 7.1 (22 "C), and D thermodynamically between about pH 7.3 and 6.8. The critical pH 7.1 for X may mean that it has a slightly lower apparent pK or a higher critical concentration than D. The rate of aggregation to D above pH 7.1 seems to be slow in itself, not determined by a slow decomposition of small three-layer aggregates (D. Vogel, unpublished observation).
In this scheme, X aggregates can produce overshoot aggregates, whereas disks can produce stacks of disks. On the other hand, both X and D can transform to helices, since the titration curves, unlike the sedimenta- tion patterns, are nearly identical with or without prolonged incubation at pH 6.9, 22 "C [8]: small helices gradually come into existence below pH 6.8 and form longer helices below pH 6.0. As the pH mounts above 6.7, helix breakdown leads first to A-protein [2], which then reassembles into disks or 26-S aggregates, which in turn disassemble to A-pro- tein above pH 7.3.
At present the structures of the 26-S and the over- shoot aggregates cannot be conclusively deduced. Overshoot formation would be most easily under- standable if the 26-S aggregates were small helices. Against this, though, is the sharpness of the Schlieren peak and its definite sedimentation value, though of course sedimentation patterns can often give false impressions of homogeneity.
One special case of limited helices can be seen in the TMV mutant PM6 [22] ; its protein helices curve round till their two ends meet. The CD spectrum of the overshoot aggregates is similar but not identical to that of disks. Their somewhat less negative AEZW (Fig.4A) and more positive dezso would be in qualita- tive though not quantitative agreement with a small admixture of helices [7]. Presumably the conforma- tion of the subunits within the overshoot aggregates is not uniform, in view of the striking irreproducibility
of the CD data. Preliminary optical diffraction patterns of the electron micrographs do not yet allow us to distinguish unambiguously between short helices and stacks of disks (D. Vogel & E. Mandelkow, unpub- lished).
The sedimentation coefficient of the 26-S aggre- gate is intermediate between that of disks and that of two-disk stacks [13], which suggests that the 26-S aggregate might contain three layers of subunits. The third layer would destroy the pairing found be- tween two layers of a disk [23,24] which would offer another explanation why it can give rise to overshoot formation. The 8-S aggregate may have three layers [13]; if so it would be a reasonable precursor for the 26-S aggregate, which would explain the continuity of overshoot formation with pH (Fig. 2). In phosphate buffer a distinct or nearly distinct single 8-S peak is occassionally found under conditions where the 4-Sj20-S (A/D) equilibrium mixture is the normal state of the protein [25,26]. In pyrophosphate buffer, on the other hand, this 8-S protein occurs regularly at moderate ionic strengths [9,27]. Strengthening of the polymerising conditions in that case led to 25 k 3-S aggregates, at significantly lower pH values, instead of the 20 k 2-S aggregates found in phosphate buffer.
These observations fit very well with our findings and with the idea that the direct 8-S + 20 2-S transformation is hindered, like the 26-S -+ 22-S but not the 8-S -+ 25 3-S transformation. However, this last reaction has a lower apparent pK than the 20-S formation (Fig.6 and 7). The question arises whether the real reaction is
26-5 - 22-s I L I I
PK3 layers' P K z layers
4 - 5 (2 layers )
1 ' I 8-5
( 3 layers) (pyrophosphate - stabi l ized)
Investigations to clarify these relationships and the structure of the 26-S and overshoot aggregates are in preparation now.
Very recently a study has been published [28] showing a totally different polymerisation behaviour for TMV protein than that presented here (transient saturation instead of overshoot). The working condi- tions are not comparable : different amino acid com- position (two exchanges), lower starting temperature (4 - 11 "C) and protein concentration (0.5 - 2.0 mg/ ml). The influence of these parameters deserve thor- ough investigations and may be extremely helpful in clarifying the detailed polymerisation mechanism of this complex system.
171 D. Vogel, A. C. H. Durham, and G. D. de Marcillac
The metastable aggregates described here certainly could affect the reconstitution of the virus in vitro from its components. Several authors have performed reconstitution experiments with disks and A-protein, in equilibrium and after chilling plus rapid re-warming, at pH 7.0 to 7.3, with various salts at various concen- trations [6,27,29-381. All agree that disks act as nuclei, but conflicting results have been reported in other respects. We can now see that the 20-30-S aggregates [32,34,35] may behave differently, depend- ing strongly on their history of pH, temperature, ionic strength, and reaction time (Fig.6 and 7). The same holds for the slow changes in molecular weight and/or structure, after addition of pyrophos- phate buffer to either A-protein (Fig. 1,2,4A) or disks (Fig. 4B). Preliminary experiments (D. Vogel, unpub- lished) have shown a rough correspondence between the rate of reconstitution and the nature of the aggre- gates present (Fig. 4B). In the presence of 26-S aggre- gates (Fig. 7), the time curves of reconstitution showed distinct lag phases during the first 5 min, which di- minished steadily when the amount of 22-S aggregate increased. Thus in the interaction of TMV protein and RNA, especially the early steps are potentially complicated by the existence of overshoot aggregates. A more precise knowledge of the structure of the various aggregates is desirable in connexion with the new model of virus assembly [39,40].
This work was made possible by a Hahilitutionsstipendium and grant from the Deutsche Forschungs~emeinschaft (Vo 24611 + 2) to D.V. We gratefully acknowledge the working facilities in Stras- bourg and Regensburg and the steady interest of Drs L. Hirth and R. Jaenicke in this work. We thank Drs A. Nicolaieff (Strasbourg) and E. Mandelkow (Max-Planck-Institut fur Medizinische For- schung, Heidelberg) for help with electron microscopy and optical diffraction, respectively. We thank Miss E. Gregori for skilful technical assistance, Mrs R. G. Adiarte and Mr J. Krauss for help with the computer calculations.
REFERENCES 1. Scheele, R. B., Schuster, T. M. & Khairallah, L. H. (1973)
2. Scheele, R. B. & Schuster, T. M. (1975) J . Mol. Biol. 94, 519-
3. Adiarte, A. L., Vogel, D. & Jaenicke, R. (1975) Biochem. Bio-
4. Scheele, R. B. & Schuster, T. M. (1974) Biopolymers, 13, 275-
Abstr. 17th Ann. Meet. Biophys. Soc., p. 290a.
525.
phys. Res. Cornmun. 63, 432-440.
288.
5 . Durham, A. C. H.&Klug, A.(1972)J.Mol. Biol.67,315-332. 6. Fraenkel-Conrat, H. & Singer, B. (1964) Virology, 23, 354-
7. Vogel, D. & Jaenicke, R. (1976) Eur. J . Biochem. 61,423-431. 8. Durham, A. C. H., Vogel, D. & de Marcillac, G. D. (1977)
9. Lonchampt, M., Lebeurier, G. & Hirth, L. (1972) FEBS Lett.
10. Jaenicke, R. & Lauffer, M. A. (1969) Biochemistry, 8, 3083-
11. Englander, S. W. & Epstein, H. T. (1957) Arch. Biochem. Bio-
12. Fletcher, R. & Powell, M. J. D. (1963) Computer J . 6,163- 168. 13. Durham, A. C. H. (1972) J . Mol. Bid. 67, 289-305. 14. Urry, D. W. (1972) Biochim. Biophys. Acta, 265, 115-168. 15. Vogel, D. & Jaenicke, R. (1974) Eur. J . Biochem. 41,607-615. 16. Vogel, D. (1973) Biochem. Biophys. Res. Commun. 52,335-341. 17. Taniguchi, M. (1969) Biochim. Biophys. Acta, 181,244-249. 18. Butler, P. J. G., Durham, A. C. H. & Klug, A. (1972) J . Mol.
Biol. 72, 1 - 18. 19. Gmelins Handhuch d. Anorg. Chemie (1965) 8th edn, vol. 16 C,
pp. 229- 235, Verlag Chemie, Weinheim/BergstraRe. 20. Oosawa, F. (1970) J . Theor. Biol. 27, 69-86. 21. Butler, P. J. G. & Klug, A. (1971) Nut. New Biol. 229, 47-50. 22. Hubert, J. J., Bourque, D. P. & Zaitlin, M. (1976) J . Mol.
23. Durham, A. C. H., Finch, J. T. & Klug, A. (1971) Nut. New
24. Champness, J. N., Bloomer, A. C., Bricogne, G., Butler, P. J.
25. Durham, A. C. H. & Klug, A. (1971) Nut. New Biol. 229,42-
26. Rodionova, N. P., Vesenina, N. E., Atabekova, T. I . , Dzhava-
27. Lebeurier, G., Morel, M. C. & Hirth, L. (1974) FEBS Lett. 41,
28. Tachibana, H., Husimi, Y. & Wada, A. (1977) Biophys. Chem.
29. Butler, P. J. G. (1972) J . Mol. Biol. 72, 25-35. 30. Richards, K. E. & Williams, R. C. (1972) Proc. Nut1 Acad. Sci.
31. Butler, P. J. G. & Klug, A. (1972) Proc. Natl Acad. Sci. U.S.A.
32. Okada, Y. & Ohno, T. (1972) Mol. Gen. Genet. 114, 205-213. 33. Butler, P. J. G. &Finch, J. T. (1973) J. Mol. Biol. 78,637-649. 34. Lebeurier, G. & Hirth, L. (1973) FEBS Lett. 34, 19-23. 35. Lebeurier, G., Lonchampt, M. & Hirth, L. (1973) FEBS Lett.
36. Richards, K. E. & Williams, R. C. (1973) Biochemistry, 12,
37. Butler, P. J. G . (1974) J . Mol. Biol. 82, 333-341. 38. Butler, P. J. G. (1974) J . Mol. Biol. 82, 343-353. 39. Butler, P. J . G., Finch, J. T. & Zimmern, D. (1977) Nature
40. Lebeurier, G., Nicolaieff, A. & Richards, K. E. (1977) Proc.
362.
Eur. J. Biochem. 79, 151 - 159.
22,297 - 300.
3092.
phys. 68,144- 149.
Biol. 108, 789 - 798.
Biol. 229, 37 - 42.
G: & Klug, A. (1976) Nature (Lond.) 259, 20-24.
47.
khia, V. G. & Atabekov, J. G. (1973) Virology, 5Z, 24-33.
25-29.
6, 173-189.
U.S.A. 69, 1121-1124.
69,2950 - 2953.
35,54- 58.
4574- 4581.
(Lond.) 265,217-219.
Natl Acad. Sci. U.S.A. 74, 149-153.
D. Vogel, Institut fur Biophysik und Physikalische Biochemie, Fachbereich Biologie und Vorklinische Medizin der Universitat Regensburg, UniversitatsstraRe 31, D-8400 Regensburg, Federal Republic of Germany
A. C. H. Durham and G. D. de Marcillac, Institut de Biologic Moleculaire et Cellulaire du C.N.R.S., 15 Rue Rene-Descartes, Esplanade, F-67084 Strasbourg-Cedex, France