Embed Size (px)
Citation preview
DEFENCE DÉFENSE&
Defence Research andDevelopment Canada
Recherche et développementpour la défense Canada
Non-Destructive Quantification of Plastic
Deformation in Steel
Employing X-Ray Diffraction Peak Broadening Analysis
Dr. Shannon P. Farrell
Technical Memorandum
DRDC Atlantic TM 2012-102
September 2013
Defence R&D Canada – Atlantic
Copy No. _____

This page intentionally left blank.
Non-Destructive Quantification of Plastic Deformation in Steel Employing X-Ray Diffraction Peak Broadening Analysis
Dr. Shannon P. Farrell
Defence R&D Canada – Atlantic Technical Memorandum DRDC Atlantic TM 2012-102 September 2013
Principal Author
Original signed by Dr. Shannon P. Farrell
Dr. Shannon P. Farrell
Defence Scientist / Dockyard Laboratory (Atlantic)
Approved by
Original signed by Dr. Leon Cheng
Dr. Leon Cheng
Section Head / Dockyard Laboratory (Atlantic)
Approved for release by
Original signed by Dr. Leon Cheng
Dr. Leon Cheng
Chair / Document Review Panel
© Her Majesty the Queen in Right of Canada, as represented by the Minister of National Defence, 2013
© Sa Majesté la Reine (en droit du Canada), telle que représentée par le ministre de la Défense nationale, 2013
DRDC Atlantic TM 2012-102 i
Abstract ……..
The X-ray diffraction (XRD) pattern of an alloy, such as steel, reveals, among other properties (ex., phase composition, crystal structure), information about the strain state, crystallite (domain) size and dislocation density. While well-established non-destructive methods are available to quantify elastic strain (and residual stress); dislocation density has proven to be a particularly elusive quantity to evaluate non-destructively. Dislocation density provides important information about the state of a material and the extent to which it was deformed. This has a strong influence on the mechanical behaviour of a material during and after deformation. The goal of this work is to examine the underpinning science behind XRD peak broadening analysis and develop a methodology for evaluating plastic deformation in ferromagnetic steel alloys.
An overview of the principles of XRD, how the crystallographic structure of steel accommodates stress and how X-rays interact with steel structures are documented. A historical perspective on XRD peak broadening analysis is provided. Two approaches, the modified Williamson–Hall and Warren–Averbach, have been identified to enable quantification of dislocation density and crystallite size. Both approaches that account for strain anisotropy are believed to offer the best potential for success. A variety of potential defence applications have been identified and a possible way ahead for advancement of this technology has been mapped. It is thus recommended to modify the portable XRD hardware and software to enable calculation of the dislocation density and crystallite size using both these approaches. This, together with elastic strain / residual stress analysis, would enable better evaluation of the current state of health of steel structures and components as they near predetermined life limits and assess the risk in extending these limits.
Résumé ….....
La diffraction des rayons X (DRX) issue d’un alliage comme l’acier renseigne sur ses propriétés, dont sa composition de phase, sa structure cristalline, sa déformation, la taille (domaine) des cristallites et la densité des dislocations. Bien qu’il existe des méthodes non destructives reconnues qui permettent de quantifier la déformation élastique (et les contraintes résiduelles), il s’avère particulièrement difficile de mesurer la densité des dislocations au moyen de techniques non destructives. La densité des dislocations fournit d’importantes données sur l’état d’un matériau et l’ampleur de sa déformation. En outre, elle influe considérablement sur le comportement mécanique d’un matériau pendant et après sa déformation. Les présents travaux visent à étudier le fondement scientifique des analyses de l’étalement des pics de DRX et à élaborer une méthode d’évaluation de la déformation plastique des alliages ferromagnétiques à base d’acier.
Le présent document donne un aperçu des principes de DRX, de la manière dont la structure cristallographique de l’acier s’adapte à une déformation et de la façon dont les rayons X interagissent avec les structures d’acier. On y présente aussi un historique des analyses de l’étalement des pics de DRX. On juge que deux approches, soit la méthode de Williamson–Hall modifiée et celle de Warren–Averbach, permettent de quantifier la densité des dislocations et la
ii DRDC Atlantic TM 2012-102
taille des cristallites. Ces méthodes, qui tiennent compte de l’anisotropie liée aux déformations, présenteraient les meilleures chances de succès. Diverses applications possibles en matière de défense ont été identifiées, ainsi qu’un moyen potentiel de développer la technologie dans le domaine de la DRX. On recommande donc de modifier des logiciels et du matériel portatif de DRX de manière à pouvoir calculer la densité des dislocations et la taille des cristallites à l’aide des deux approches susmentionnées. En procédant ainsi et en recourant à une analyse de la déformation élastique et des contraintes résiduelles, il pourrait s’avérer possible de mieux évaluer l’état actuel de composants et de structures d’acier qui s’approchent de leur fin de vie utile préétablie, de même que les risques posés par un prolongement de cette dernière.
DRDC Atlantic TM 2012-102 iii
Executive summary
Non-Destructive Quantification of Plastic Deformation in Steel: Employing X-Ray Diffraction Peak Broadening Analysis
Shannon P. Farrell; DRDC Atlantic TM 2012-102; Defence R&D Canada – Atlantic; September 2013.
Introduction: In order to better analyze the strain state and extent of deformation in a structure, novel non-destructive characterization techniques are needed. One such technique, X-ray diffraction (XRD), offers a myriad of information that may be used to quantify, among other properties, the elastic and plastic strain response of structures/components. The relationship between XRD peak position and elastic strain is well known. The strain redistribution in a material subjected to loads in excess of its elastic limits, or plastic deformation, has proven to be a particularly elusive quantity for Non-Destructive Evaluation (NDE). This document is intended to provide a rationale for development of a new XRD peak analysis capability at DRDC Atlantic.
Results: The methods for the quantification of plasticity from a variety of XRD studies have been elucidated by several authors in the literature. Two approaches have been identified for XRD peak broadening analysis using the portable miniature XRD and more conventional laboratory XRD. For portable, ex., ship-board, experiments, a more simplistic approach that balances the need for accuracy against processing time is identified. A more thorough and comprehensive laboratory analysis approach, Rietveld refinement, is identified for situations where accuracy is critical. A plan for development of the methodology and instrumentation is proposed. A variety of potential defence applications have been identified.
Significance: Ability to assess both elastic strain and plastic deformation in a component/structure is expected to better evaluate the current state of health of steel structures and components as they near predetermined life limits and assess the risk in extending these limits. Although this work is supported by an applied research project on “Materials in Support of Logistic Vehicle Modernization” (12st), successful development and application of this technique could support structural health assessments of other CAF platforms as well.
Future plans: In-house experimentation is required to further develop methodology for laboratory and portable XRD peak broadening analysis using conventional XRD and portable miniature XRD (mXRD), respectively. Once successfully developed, this proposed new capability that offers residual elastic strain/stress and plastic deformation analysis could be used to quantify plasticity and evaluate fatigue life of the structure or specific components of logistic vehicles.
iv DRDC Atlantic TM 2012-102
Sommaire .....
Non-Destructive Quantification of Plastic Deformation in Steel: Employing X-Ray Diffraction Peak Broadening Analysis
Shannon P. Farrell ; DRDC Atlantic TM 2012-102 ; R & D pour la défense Canada – Atlantique; septembre 2013.
Introduction : Pour mieux analyser l’état sous contrainte et l’ampleur de la déformation d’une structure, il faut recourir à de nouvelles techniques non destructives de caractérisation, dont la diffraction des rayons X (DRX), qui fournit une foule de données pouvant se prêter à la quantification des propriétés d’une structure et de composants, y compris leur réaction aux déformations plastiques et élastiques. La relation entre l’emplacement des pics de DRX et la déformation élastique est bien connue. La redistribution d’une déformation dans un matériau soumis à des charges dépassant sa limite d’élasticité (déformation plastique) s’avère particulièrement difficile à quantifier au moyen d’une évaluation non destructive. Le présent document vise à justifier l’élaboration d’une nouvelle analyse des pics de DRX dans les installations de RDDC Atlantique.
Résultats : Plusieurs auteurs se sont penchés sur les méthodes de quantification de la plasticité employées dans le cadre de diverses études de DRX. Deux approches ont été identifiées en matière d’analyse de l’étalement des pics de DRX au moyen d’un appareil de DRX miniature portatif et d’un instrument de laboratoire plus classique. Dans le cas d’expériences réalisées à l’aide d’un appareil portatif (p. ex. dispositif embarqué), on a identifié une approche plus simple consistant en un compromis entre l’exactitude nécessaire et le temps de traitement. Dans celui d’une analyse en laboratoire dont l’exactitude est cruciale, on a identifié une approche plus complète et rigoureuse (amélioration de Rietveld). On propose un plan d’élaboration de méthode et de développement d’instrument et présente diverses applications possibles dans le domaine de la défense.
Importance : La capacité d’évaluer les déformations élastiques et plastiques d’un composant ou d’une structure en acier devrait permettre de mieux évaluer son état actuel lorsqu’il ou elle s’approche de sa fin de vie utile préétablie, de même que les risques posés par un prolongement de cette dernière. Bien que les travaux à ce chapitre reposent sur un projet de recherche appliquée intitulé « Matériaux à l’appui de la modernisation du véhicule logistique » (12st), l’élaboration et l’application de la capacité susmentionnée pourraient aussi se prêter à l’évaluation de l’état structural d’autres plateformes de l’Aviation canadienne.
Perspectives : Des expériences internes doivent être réalisées pour développer de manière plus poussée une méthode d’analyse de l’étalement des pics de DRX reposant sur un appareil miniature portatif et un instrument de laboratoire classique. Une fois élaborée, la nouvelle méthode d’analyse des contraintes résiduelles, des déformations plastiques et des déformations élastiques pourrait permettre de quantifier la plasticité et d’évaluer la durée de vie en fatigue de la structure ou certains composants d’un véhicule logistique.
DRDC Atlantic TM 2012-102 v
Table of contents
Abstract …….. ................................................................................................................................. i Résumé …..... ................................................................................................................................... i Executive summary ........................................................................................................................ iii Sommaire ..... .................................................................................................................................. iv Table of contents ............................................................................................................................. v List of figures ................................................................................................................................ vii List of tables ................................................................................................................................... ix 1 Introduction ............................................................................................................................... 1 2 Motivation and Objectives ........................................................................................................ 2 3 X-Ray Diffraction Theory ........................................................................................................ 3
3.1 Principles of X-Ray Diffraction .................................................................................... 3 3.1.1 Diffraction of X-Rays .......................................................................................... 3 3.1.2 X-Ray Diffraction Detection ............................................................................... 5
3.2 Measurement of Elastic Strain & Stress Analysis ......................................................... 6 3.2.1 The Portable Miniature X-Ray Diffractometer .................................................... 6 3.2.2 Elastic Strain Analysis ......................................................................................... 7
4 Diffraction of X-rays from Crystal Structures .......................................................................... 8 4.1 Interaction of X-Rays with Structures ........................................................................... 8
4.1.1 Ideal Lattice Structures ........................................................................................ 8 4.1.2 Structural Defects ................................................................................................ 9 4.1.3 Dislocations and Slip Planes ................................................................................ 9 4.1.4 Systematic XRD Peak Absences ....................................................................... 10
4.2 Crystallographic Strain ................................................................................................ 11 4.2.1 Elastic Strain ...................................................................................................... 11 4.2.2 Plastic Strain ...................................................................................................... 11
4.3 XRD Peak Broadening Analysis ................................................................................. 13 4.3.1 Empirical Correlation with Hardness Measurements ........................................ 13 4.3.2 Empirical Correlation with Yield Strength ........................................................ 14
5 Methodology for XRD Peak Broadening Analysis ................................................................ 19 5.1 History of XRD Peak Broadening Analysis ................................................................ 19
5.1.1 Scherrer Approach (1918) ................................................................................. 19 5.1.2 Stokes – Wilson Approach (1944) ..................................................................... 20 5.1.3 Stokes Approach (1948) .................................................................................... 20 5.1.4 Warren – Averbach Approach (1950) ............................................................... 21 5.1.5 Williamson – Hall Approach (1953) ................................................................. 21 5.1.6 Wilkens Approach (1967) .................................................................................. 22 5.1.7 Rietveld Approach (1967) ................................................................................. 22
vi DRDC Atlantic TM 2012-102
5.2 Instrumental Component of XRD Peak Broadening Analysis .................................... 235.3 Microstructural Component of XRD Peak Broadening Analysis ................................ 23
5.3.1 Williamson – Hall (W-H) Approach ................................................................. 235.3.1.1 Classical W-H Approach ......................................................................... 235.3.1.2 Modified W-H approach .......................................................................... 265.3.1.3 Practical Applications of the W-H Approaches ....................................... 28
5.3.2 XRD Peak Broadening With Warren – Averbach (W-A) ................................. 295.3.2.1 Classical W-A Approach ......................................................................... 295.3.2.2 Modified W-A Approach ......................................................................... 305.3.2.3 Practical Applications of the W-A Approaches ....................................... 33
5.3.3 Analysis of XRD Peak-Broadening Approaches ............................................... 335.3.3.1 Correlation with TEM Investigations ...................................................... 335.3.3.2 Summary and Comparison of XRD Peak Broadening Approaches ......... 37
6 Conclusions ............................................................................................................................. 387 Future Work ............................................................................................................................ 39
7.1 Development of Portable miniature XRD ................................................................... 397.2 Experimentation .......................................................................................................... 397.3 Potential Applications ................................................................................................. 39
Vehicle Restraints ...................................................................................................... 40Armaments ................................................................................................................ 40
References ..... ............................................................................................................................... 41Annex A Description of Equation Symbols ................................................................................ 45
DRDC Atlantic TM 2012-102 vii
List of figures
Figure 1: Interaction of X-rays with the diffracting planes in a crystalline material. ...................... 4
Figure 2: X-ray diffraction in 3 dimensions. ................................................................................... 4
Figure 3: Schematic showing XRD pattern for polycrystalline HY80 steel exhibiting narrow diffraction peaks (collected using Cu Kα radiation). .................................................... 5
Figure 4: Position Sensitive Scintillation Detectors for polycrystalline HY80 steel. ...................... 6
Figure 5: XRD peak fitting for the {211} of ferrite in HY80 steel. The y-axis is intensity, the upper x-axis is θ angle and the lower x-axis is detector channel. The red curve represents the measured diffraction peak. The blue curve represents the best fit model from the constituent green and brown curves that represent contributions from Cr Kα1 and Kα2 splitting, respectively. ................................................................ 7
Figure 6: Schematic showing typical XRD pattern for polycrystalline HY80 steel exhibiting exaggerated broadening of diffraction peaks. ............................................................... 9
Figure 7: XRD pattern showing the allowable XRD peaks for a material with the bcc structure. ...................................................................................................................... 10
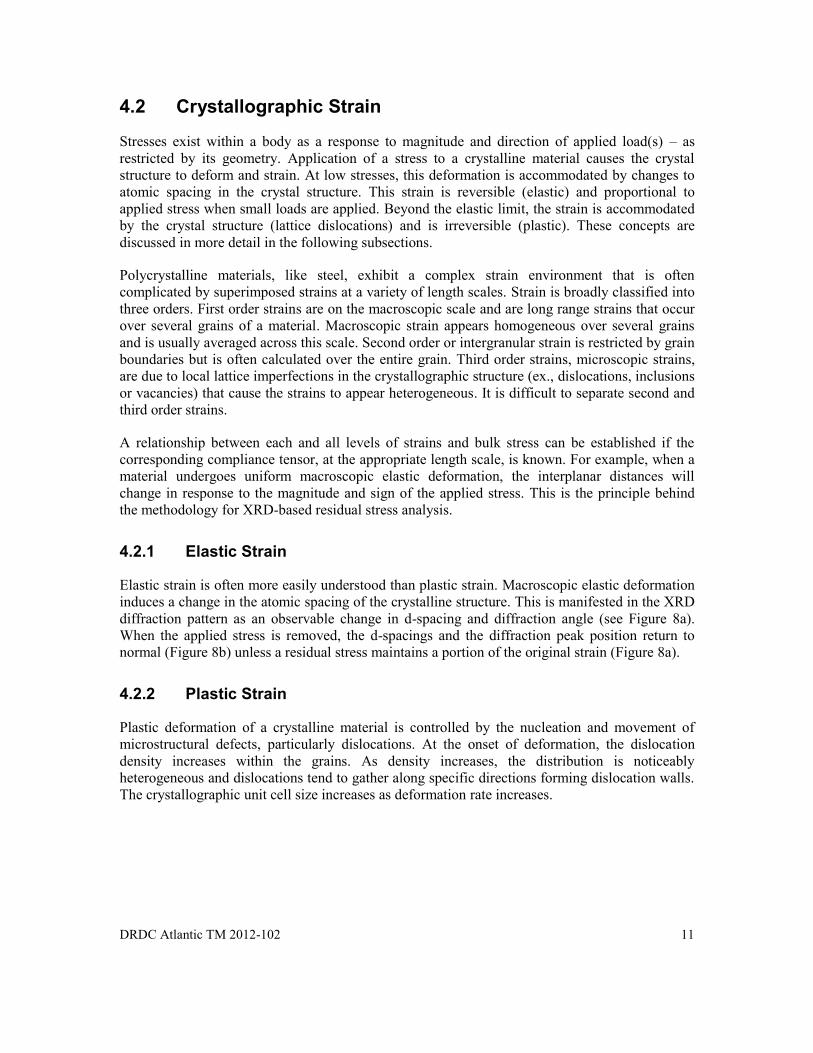
Figure 8: Crystallographic lattice and associated diffraction peak profiles before (blue) and after (red) a stress is applied. The Bragg angle increases left to right, while d-spacing increases right to left. Under stress (a), elastic strain and d-spacing increases, while diffraction angle decreases. When stress is removed (b), the concurrence in position of both peaks indicates the absence of elastic strain. Under stress (c), elastic strain is observable and the increased broadness of the peak indicates yielding has occurred. In (d) the stress has been removed, but while there is no evidence for elastic strain, plastic deformation is discernible. ........................... 12
Figure 9: Graph of the relationship between the {211} FWHM (half breadth) and Rockwell C hardness for M50 high-speed tool steel [8]. ................................................................ 14
Figure 10: Graphs showing the estimated local yield stress from hardness data (triangles) and XRD FWHM (circles) in shot-peened surface layers of several steels [9]. Solid black, solid grey and dashed lines represent the bulk fracture stress, yield stress, and the maximum stress of the bulk material. ............................................................. 15
Figure 11: Graph of the relationship between the {420} FWHM (half breadth) and percent cold work for Rene 95 [8]. .......................................................................................... 16
Figure 12: Graphs of a) the dependence of the FWHM (using Mn Kα radiation) of {311} XRD peak against true plastic strain for Alloy 600 and b) tensile stress-strain curve for the same material [8]. .................................................................................. 17
Figure 13: Variation in a) degree of cold work (equivalent accumulated true plastic strain) and b) Yield strength with axial displacement in a J-weld mock-up of Alloy 600 [8]. ............................................................................................................................... 18
Figure 14: Schematic showing the relative size differences between particles, crystals, crystallites and domains [17]. ...................................................................................... 20
viii DRDC Atlantic TM 2012-102
Figure 15: Schematic of the classic W-H plot showing the clustering of data points for the selected diffraction peaks. ........................................................................................... 24
Figure 16: W-H plots for mechanically alloyed Fe92Al2Si6 [33]. a) shows the apparently random nature of the classic W-H plot, while b) shows the result for addition of a strain anisotropy factor. ............................................................................................... 25
Figure 17: Typical (a) W-H plot and modified W-H plot for strongly deformed copper [34]. ..... 28
Figure 18: Typical a) W-A and b) modified W-A plots for nanocrystalline Cu [42]. ................... 31
Figure 19: Linear regression plot of against ln(L) for cold rolled and equal-channel angular pressed steel [29]. ........................................................................................... 32
Figure 20: Typical a) W-A and b) modified W-A plots for ball-milled Galena [43]. ................... 34
Figure 21: W-H plots showing strain anisotropy in samples of as-deformed Cu (triangles), as-deformed (circles) and annealed (squares) Cu with 0.5 wt% Al2O3 [46]. Solid symbols represent experimental results while open symbols were calculated. ........... 35

DRDC Atlantic TM 2012-102 ix
List of tables
Table 1: Comparison of calculated and measured dislocation densities of martensitic steels (3 wt% C) [47]. ........................................................................................................... 36
Table 2: Measured (TEM) and calculated (XRD) dislocation densities during heat treatment and creep of tempered ferritic steels [44]. ................................................................... 36

x DRDC Atlantic TM 2012-102
This page intentionally left blank.
DRDC Atlantic TM 2012-102 1
1 Introduction
The design of engineered components and structures is constrained by, among other factors, the properties of the materials, the manufacturing methods employed and the conditions of operation or service. Once manufacturing is complete, it is the conditions in service that act to change material’s state and the other characteristics of a component/structure. Such changes often lead to eventual failure of the component/structure system if repair or replacement (partial or entire) are not undertaken at the appropriate time. Often the cost (both from a monetary, downtime and personnel perspective) of replacement or failure of a specific component makes it cost effective to conduct periodic inspections for signs of degradation of mechanical properties.
Assessments of material state using techniques that do not damage the structure/component or otherwise alter the properties to be measured are highly valued. Non-destructive evaluation (NDE) techniques provide a means to assess the condition of a component or structure. This provides inputs to estimate the risk of failure related to continued usage versus repair or replacement.
One such NDE technique, X-ray diffraction (XRD), is widely recognized for its accurate determination of the crystallographic properties of crystalline materials, such as steels. XRD is routinely used for accurate determination of crystallographic lattice parameters. This enables accurate measurement of macroscopic elastic strain and quantification of residual stress. Unfortunately, the strain redistribution in a material subjected to loads in excess of its elastic limits, that is, one which is plastically deformed, has proven to be a particularly elusive quantity for NDE. Developing the methodology for conducting XRD peak broadening analysis for evaluating plastic deformation of ferromagnetic steel alloys is the focus of this document. In addition, the ability to use XRD to predict plasticity, or the maximum plastic deformation before failure, of a steel structure or component may also be achievable.
Defence R&D Canada – Atlantic (DRDC Atlantic) and Proto Manufacturing Inc. developed a portable miniature XRD (mXRD) to quantify residual stress in components and structures (see Section 3.2.1). The mXRD uses XRD peak profile analysis functions to determine the position of a selected XRD peak and relates it to crystallographic elastic macroscopic strain – and residual stress. Other latent information obtained from peak broadening is often ignored during routine elastic strain / stress analysis. It is believed that through careful selection of XRD peak broadening functions, quantification of crystallite size, micro-strain and dislocation density may be realized.
The goal of this study was to examine the science behind quantification of plastic deformation using XRD and to determine the feasibility of applying a XRD peak broadening approach for evaluating plastic deformation in ferromagnetic steel alloys. Section 2 will provide an overview of this study. Section 3 introduces the principles of XRD and the measurement of strain (and stress analysis). Section 4 discusses the diffraction of X-rays from crystallographic structures. Section 5 summarizes the history of and the most popular approaches to XRD peak broadening analysis, while Section 6 discusses potential future development and identifies several potential applications.
2 DRDC Atlantic TM 2012-102
2 Motivation and Objectives
This research study is supported by a DRDC led applied research project on “Materials in Support of Logistic Vehicle Modernization” (12st), but this potential technique is applicable to all CF platforms. It is hoped that non-destructive assessment of elastic and plastic strain in a component/structure may better evaluate the current state of health of steel structures and components as they near predetermined life limits – and assess the risk in extending these limits.
This study is part of a larger effort to investigate the scientific methodology and feasibility for using XRD-based non-destructive analytical techniques for quantification of plastic deformation in steel components and structures. The ultimate objective of this effort is to develop an understanding of the physical relationship between crystallographic structure, plastic deformation mechanisms and XRD peak broadening to establish a reliable method for quantification of plastic deformation. This will be established when the following five objectives are satisfied;
1. To examine how crystallographic structures accommodate stress in excess of the elastic limits.
2. To determine if/how different plastic deformation mechanisms affect XRD peak attributes (ex., peak position, broadening) in a measurable way.
3. To modify the mXRD system and develop the procedures for quantification of peak broadening and calculation of plastic strain.
4. To conduct laboratory qualification experiments to determine limitations of this approach (ex. influence of crystallographic texture, microstructure, and plastic deformation) and develop procedures to minimize these effects.
5. To develop a concept for using plastic deformation and residual stress analysis to evaluate the current state of health of steel structures and components as they near predetermined life limits – and assess the risk in extending these limits.
This document serves as the deliverable for the first two objectives. This document will also provide a plan for completion of the work under objective 3 and will define the laboratory experiments required to meet objective 4. If this approach is found to be promising and feasible, additional follow-on studies will address structures / components at various points in their life-cycles to meet objective 5.
DRDC Atlantic TM 2012-102 3
3 X-Ray Diffraction Theory
The manifestation of desirable physical and chemical material properties may be readily discerned through investigation of the atomic-scale structure with XRD. XRD is a well-established and widely used technique for identification and characterization of the crystallographic structure of materials. Its shallow penetration depth makes it ideal for quantification of surface phenomena. This Section introduces some of the fundamental principles of XRD and DRDC Atlantic’s portable miniature XRD.
3.1 Principles of X-Ray Diffraction
This discussion will focus on attributes of X-ray radiation that are pertinent to the rationale for using diffractometers to measure the structural properties of polycrystalline steel. Such topics as the generation and properties of X-rays and diffraction from single crystals are covered elsewhere [1].
3.1.1 Diffraction of X-Rays
In XRD, a collimated beam of polychromatic X-ray radiation (Kα1, Kα2 and Kβ lines) is directed through optics (ex., monochromater, slits, and aperture) onto a stationary target (i.e., the specimen of interest). X-rays not absorbed by the target are diffracted, or reflected, from the surface. X-rays that diffract from specific crystallographic planes that make up the atomic-scale structure are more intense. X-rays that don’t diffract from specific planes form incoherent scattering and tend to show up as background radiation.
Coherent diffraction requires that the planes be arranged in a specific geometry with respect to the incident X-rays as governed by Bragg’s Law (Equation 1) [1]. Bragg’s law relates the wavelength of the incident X-ray beam (λ), the atomic distance between specific diffracting planes (d) and the order of the atomic plane (n) to the angle between the crystallographic plane and the diffracted X-ray (θ) [1]. A complete list and description of each equation symbol appears in Annex A.
sin2nd (1)
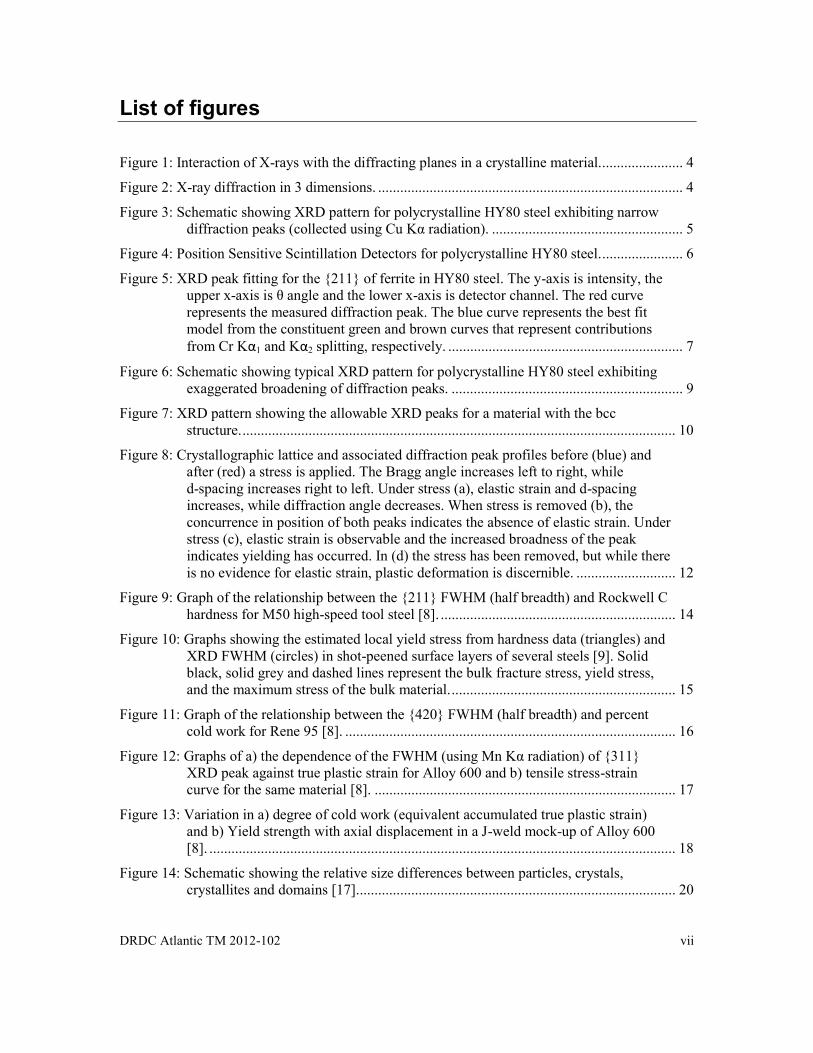
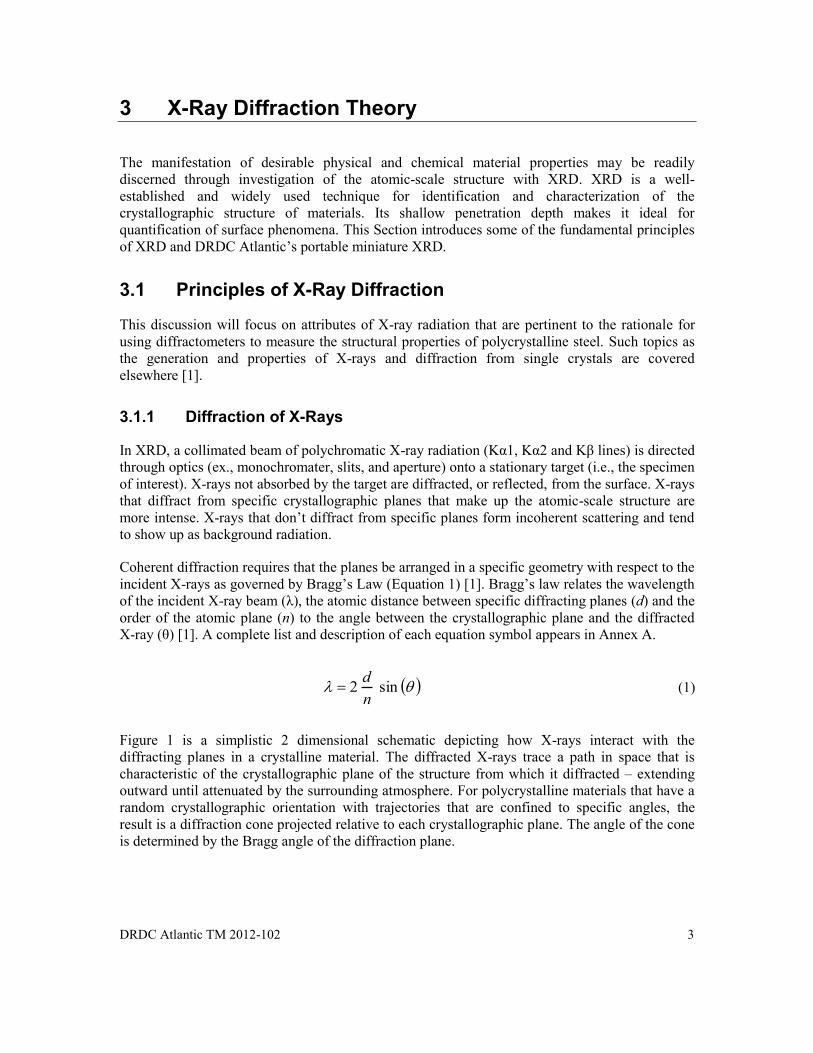
Figure 1 is a simplistic 2 dimensional schematic depicting how X-rays interact with the diffracting planes in a crystalline material. The diffracted X-rays trace a path in space that is characteristic of the crystallographic plane of the structure from which it diffracted – extending outward until attenuated by the surrounding atmosphere. For polycrystalline materials that have a random crystallographic orientation with trajectories that are confined to specific angles, the result is a diffraction cone projected relative to each crystallographic plane. The angle of the cone is determined by the Bragg angle of the diffraction plane.
4 DRDC Atlantic TM 2012-102
Figure 1: Interaction of X-rays with the diffracting planes in a crystalline material.
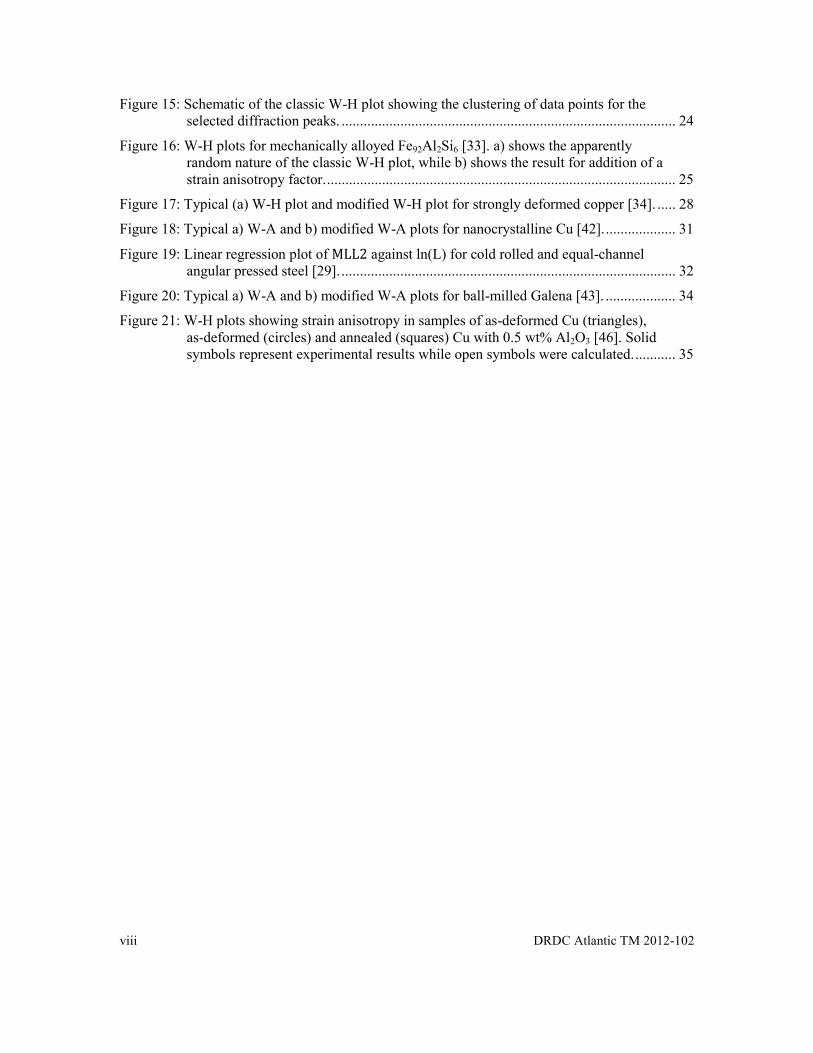
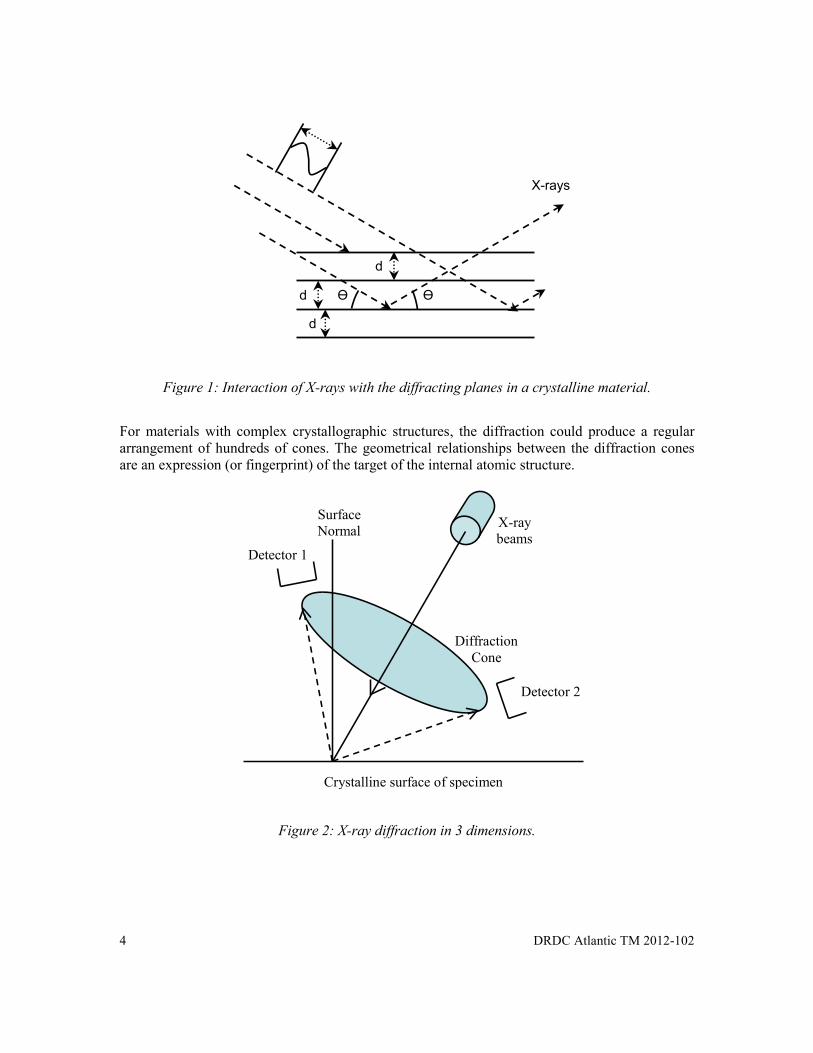
For materials with complex crystallographic structures, the diffraction could produce a regular arrangement of hundreds of cones. The geometrical relationships between the diffraction cones are an expression (or fingerprint) of the target of the internal atomic structure.
Figure 2: X-ray diffraction in 3 dimensions.
d
d
d
Ө Ө
X-rays
Surface Normal
Detector 1
Detector 2
X-ray beams
Diffraction Cone
Crystalline surface of specimen
DRDC Atlantic TM 2012-102 5
3.1.2 X-Ray Diffraction Detection
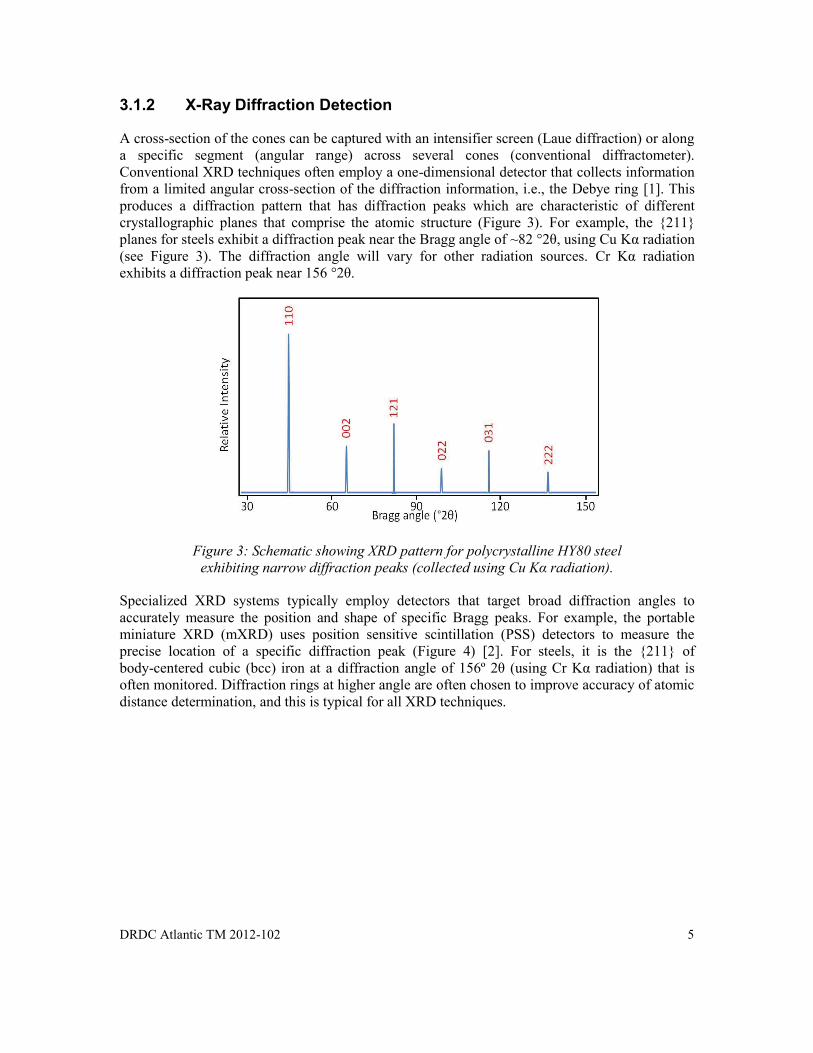
A cross-section of the cones can be captured with an intensifier screen (Laue diffraction) or along a specific segment (angular range) across several cones (conventional diffractometer). Conventional XRD techniques often employ a one-dimensional detector that collects information from a limited angular cross-section of the diffraction information, i.e., the Debye ring [1]. This produces a diffraction pattern that has diffraction peaks which are characteristic of different crystallographic planes that comprise the atomic structure (Figure 3). For example, the {211} planes for steels exhibit a diffraction peak near the Bragg angle of ~82 °2θ, using Cu Kα radiation (see Figure 3). The diffraction angle will vary for other radiation sources. Cr Kα radiation exhibits a diffraction peak near 156 °2θ.
Figure 3: Schematic showing XRD pattern for polycrystalline HY80 steel exhibiting narrow diffraction peaks (collected using Cu Kα radiation).
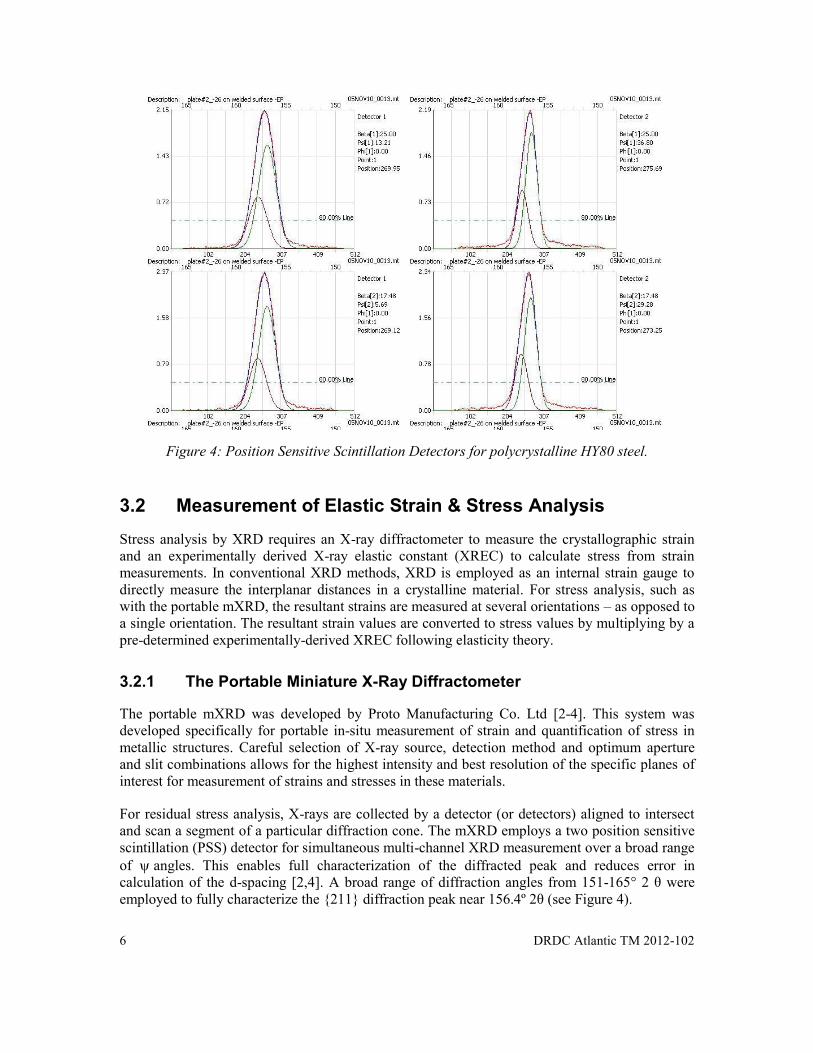
Specialized XRD systems typically employ detectors that target broad diffraction angles to accurately measure the position and shape of specific Bragg peaks. For example, the portable miniature XRD (mXRD) uses position sensitive scintillation (PSS) detectors to measure the precise location of a specific diffraction peak (Figure 4) [2]. For steels, it is the {211} of body-centered cubic (bcc) iron at a diffraction angle of 156º 2θ (using Cr Kα radiation) that is often monitored. Diffraction rings at higher angle are often chosen to improve accuracy of atomic distance determination, and this is typical for all XRD techniques.
6 DRDC Atlantic TM 2012-102
Figure 4: Position Sensitive Scintillation Detectors for polycrystalline HY80 steel.
3.2 Measurement of Elastic Strain & Stress Analysis Stress analysis by XRD requires an X-ray diffractometer to measure the crystallographic strain and an experimentally derived X-ray elastic constant (XREC) to calculate stress from strain measurements. In conventional XRD methods, XRD is employed as an internal strain gauge to directly measure the interplanar distances in a crystalline material. For stress analysis, such as with the portable mXRD, the resultant strains are measured at several orientations – as opposed to a single orientation. The resultant strain values are converted to stress values by multiplying by a pre-determined experimentally-derived XREC following elasticity theory.
3.2.1 The Portable Miniature X-Ray Diffractometer
The portable mXRD was developed by Proto Manufacturing Co. Ltd [2-4]. This system was developed specifically for portable in-situ measurement of strain and quantification of stress in metallic structures. Careful selection of X-ray source, detection method and optimum aperture and slit combinations allows for the highest intensity and best resolution of the specific planes of interest for measurement of strains and stresses in these materials.
For residual stress analysis, X-rays are collected by a detector (or detectors) aligned to intersect and scan a segment of a particular diffraction cone. The mXRD employs a two position sensitive scintillation (PSS) detector for simultaneous multi-channel XRD measurement over a broad range of angles. This enables full characterization of the diffracted peak and reduces error in calculation of the d-spacing [2,4]. A broad range of diffraction angles from 151-165° 2 θ were employed to fully characterize the {211} diffraction peak near 156.4º 2θ (see Figure 4).
DRDC Atlantic TM 2012-102 7
3.2.2 Elastic Strain Analysis
Once measured, the diffraction data must be analysed to obtain the XRD peak position or d-spacing. The first step is to correct the incoherent scatter or background against any non-linearity in detector signal output. This is done by subtracting the diffraction data of a specimen that does not have diffraction peaks over the collection range from 151-165° 2θ range. Incoherent scattering that often occurs in the background at higher diffraction angles is then corrected by fitting the peak to a linear background over this region.
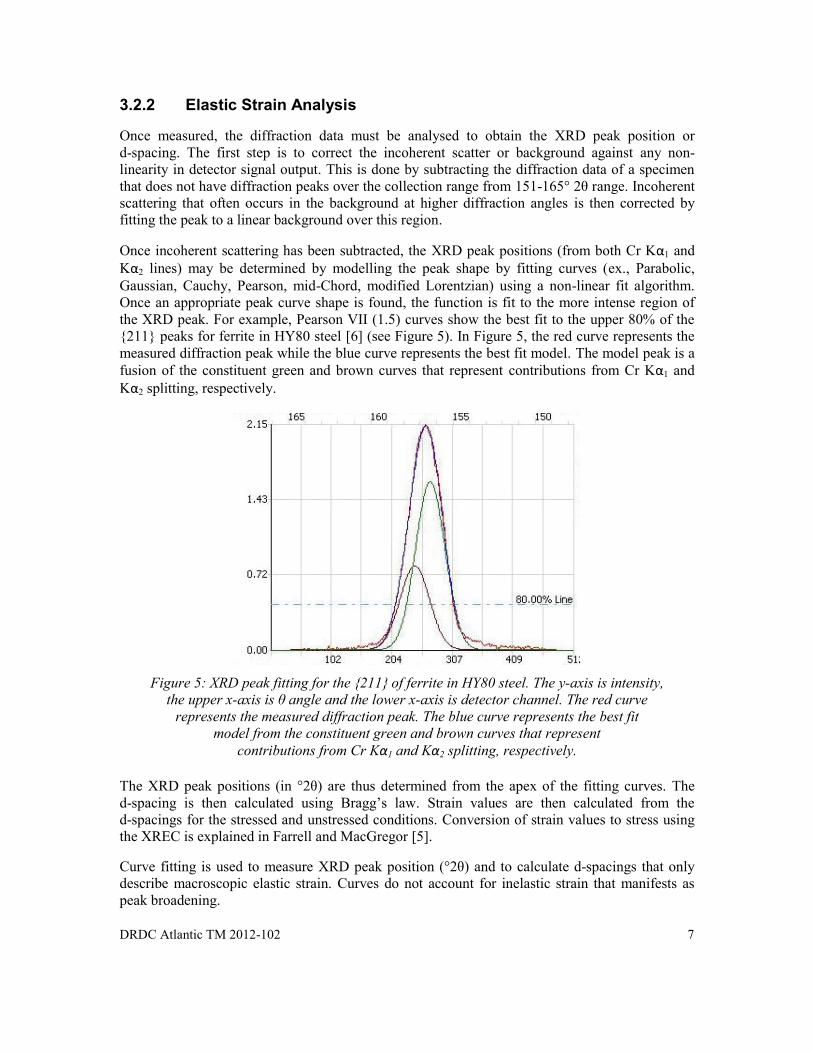
Once incoherent scattering has been subtracted, the XRD peak positions (from both Cr Kα1 and Kα2 lines) may be determined by modelling the peak shape by fitting curves (ex., Parabolic, Gaussian, Cauchy, Pearson, mid-Chord, modified Lorentzian) using a non-linear fit algorithm. Once an appropriate peak curve shape is found, the function is fit to the more intense region of the XRD peak. For example, Pearson VII (1.5) curves show the best fit to the upper 80% of the {211} peaks for ferrite in HY80 steel [6] (see Figure 5). In Figure 5, the red curve represents the measured diffraction peak while the blue curve represents the best fit model. The model peak is a fusion of the constituent green and brown curves that represent contributions from Cr Kα1 and Kα2 splitting, respectively.
Figure 5: XRD peak fitting for the {211} of ferrite in HY80 steel. The y-axis is intensity,
the upper x-axis is θ angle and the lower x-axis is detector channel. The red curve represents the measured diffraction peak. The blue curve represents the best fit
model from the constituent green and brown curves that represent contributions from Cr Kα1 and Kα2 splitting, respectively.
The XRD peak positions (in °2θ) are thus determined from the apex of the fitting curves. The d-spacing is then calculated using Bragg’s law. Strain values are then calculated from the d-spacings for the stressed and unstressed conditions. Conversion of strain values to stress using the XREC is explained in Farrell and MacGregor [5].
Curve fitting is used to measure XRD peak position (°2θ) and to calculate d-spacings that only describe macroscopic elastic strain. Curves do not account for inelastic strain that manifests as peak broadening.
8 DRDC Atlantic TM 2012-102
4 Diffraction of X-rays from Crystal Structures
X-ray diffraction (XRD) is a well-established technique for the identification and characterization of crystallographic structure of crystalline materials such as steel. The analysis or interrogation of diffraction data requires some additional considerations with respect to how X-rays interact with a material as well as the application of techniques to optimize the quality of the diffraction data.
The crystallographic structure of materials is very responsive to external stresses and the structural strain response occurs in very predictable ways. This Section will introduce the basic concepts of ideal and real structures as well as strain development in steel. While the intent is not to describe the crystal structures of steel in detail, it is important to consider the nature of the alloys at the atomic level before discussing XRD peak broadening. Although focusing on steel, many of the concepts are applicable to other alloy systems as well.
4.1 Interaction of X-Rays with Structures
4.1.1 Ideal Lattice Structures
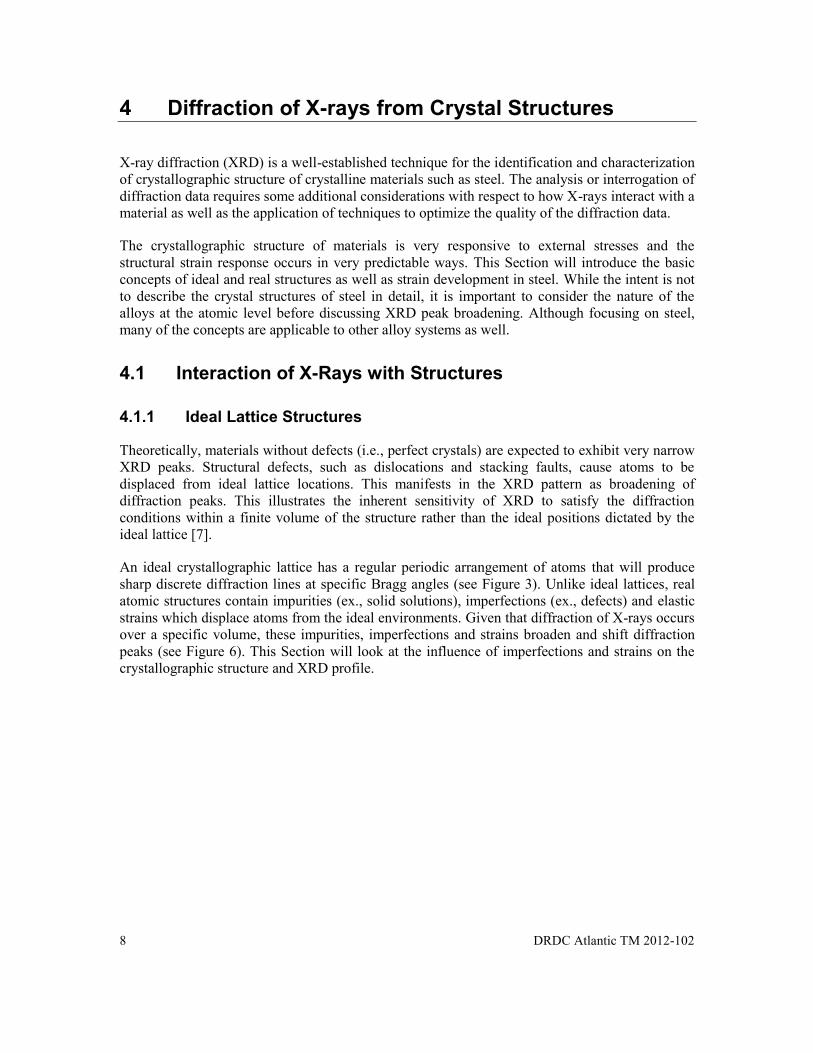
Theoretically, materials without defects (i.e., perfect crystals) are expected to exhibit very narrow XRD peaks. Structural defects, such as dislocations and stacking faults, cause atoms to be displaced from ideal lattice locations. This manifests in the XRD pattern as broadening of diffraction peaks. This illustrates the inherent sensitivity of XRD to satisfy the diffraction conditions within a finite volume of the structure rather than the ideal positions dictated by the ideal lattice [7].
An ideal crystallographic lattice has a regular periodic arrangement of atoms that will produce sharp discrete diffraction lines at specific Bragg angles (see Figure 3). Unlike ideal lattices, real atomic structures contain impurities (ex., solid solutions), imperfections (ex., defects) and elastic strains which displace atoms from the ideal environments. Given that diffraction of X-rays occurs over a specific volume, these impurities, imperfections and strains broaden and shift diffraction peaks (see Figure 6). This Section will look at the influence of imperfections and strains on the crystallographic structure and XRD profile.
DRDC Atlantic TM 2012-102 9
Figure 6: Schematic showing typical XRD pattern for polycrystalline HY80 steel exhibiting exaggerated broadening of diffraction peaks.
4.1.2 Structural Defects
Defects are classified as atomic level point defects (ex., vacancies, impurities), line defects (ex., dislocations), planar defects (ex., surfaces or interfaces), or volume defects (ex., cracks, inclusions) that depend on the scale of the anomaly. Atomic level point defects are beyond the resolution of low-energy (non-synchrotron) XRD equipment, while volume defects are too large to fully characterize.
XRD is best suited for analysis of both line and planar defects. Line defects (dislocations) occur along specific crystallographic directions in the crystal and is the average influence of one or a group of atoms being pulled slightly out of position with respect to the ideal crystal structure. Planar defects include grain boundaries that are the interface between two different crystal grains, or crystallites, that have a different orientation such that the structures do not match up exactly at the interface.
Defects play an important role in development of chemical, physical, mechanical, electronic and magnetic properties. The deformability of metals is directly related to the nature of defects in the crystal structure.
4.1.3 Dislocations and Slip Planes
Dislocation (edge and screw) and dislocation motion (slip) occurs by sequential bond breaking and bond reforming along specific crystallographic planes and directions. Slip, which is the main phenomenon in plastic deformation, generally occurs on the most densely packed planes along the most densely packed directions. In face centered cubic (fcc) structures, the {111} family of planes have the densest packing of atoms. There are four sets of non-parallel planar stacks in each fcc crystal or grain, and on each plane there are three nonparallel close packed <110> directions. The slip plane and direction constitute the slip system.
10 DRDC Atlantic TM 2012-102
Compared with fcc crystals, the closed packed planes in bcc structures are not as tightly packed. In bcc, the planes with the highest atomic packing density are the {110} family of planes. There are 6 sets of non-parallel planes in this family in any one crystal as can be discerned from the bcc unit cell. The atoms are in contact with one another along the <111> family of directions which are the densest packed in bcc crystals; slip occurs along such close-packed directions. Since slip can occur in multiple directions in each slip plane, there are altogether 48 possible primary slip directions that can occur in bcc crystals.
Slip in bcc crystals can also occur along the same close-packed directions on other less-densely-packed planes after the slip process begins on the {110} family of planes. These "secondary” slip planes require more energy for slip than the primary planes. Secondary slip planes include the {211} and {321} families of planes in the bcc structure.
4.1.4 Systematic XRD Peak Absences
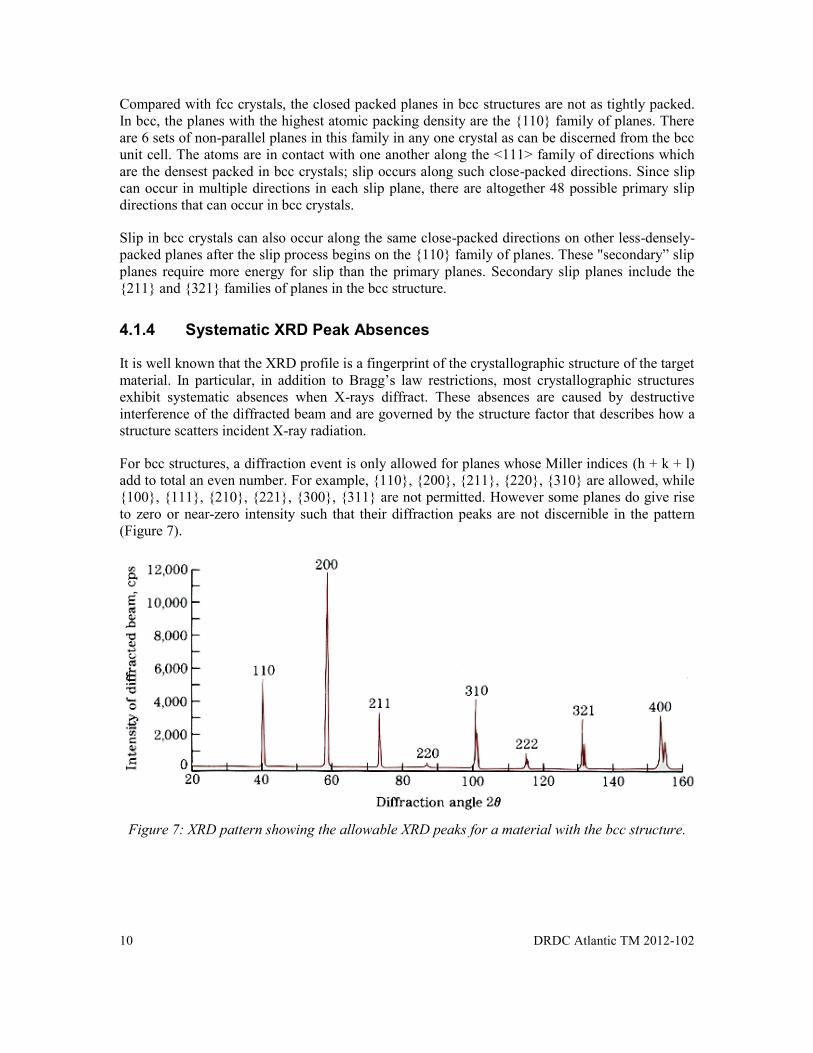
It is well known that the XRD profile is a fingerprint of the crystallographic structure of the target material. In particular, in addition to Bragg’s law restrictions, most crystallographic structures exhibit systematic absences when X-rays diffract. These absences are caused by destructive interference of the diffracted beam and are governed by the structure factor that describes how a structure scatters incident X-ray radiation.
For bcc structures, a diffraction event is only allowed for planes whose Miller indices (h + k + l) add to total an even number. For example, {110}, {200}, {211}, {220}, {310} are allowed, while {100}, {111}, {210}, {221}, {300}, {311} are not permitted. However some planes do give rise to zero or near-zero intensity such that their diffraction peaks are not discernible in the pattern (Figure 7).
Figure 7: XRD pattern showing the allowable XRD peaks for a material with the bcc structure.
DRDC Atlantic TM 2012-102 11
4.2 Crystallographic Strain
Stresses exist within a body as a response to magnitude and direction of applied load(s) – as restricted by its geometry. Application of a stress to a crystalline material causes the crystal structure to deform and strain. At low stresses, this deformation is accommodated by changes to atomic spacing in the crystal structure. This strain is reversible (elastic) and proportional to applied stress when small loads are applied. Beyond the elastic limit, the strain is accommodated by the crystal structure (lattice dislocations) and is irreversible (plastic). These concepts are discussed in more detail in the following subsections.
Polycrystalline materials, like steel, exhibit a complex strain environment that is often complicated by superimposed strains at a variety of length scales. Strain is broadly classified into three orders. First order strains are on the macroscopic scale and are long range strains that occur over several grains of a material. Macroscopic strain appears homogeneous over several grains and is usually averaged across this scale. Second order or intergranular strain is restricted by grain boundaries but is often calculated over the entire grain. Third order strains, microscopic strains, are due to local lattice imperfections in the crystallographic structure (ex., dislocations, inclusions or vacancies) that cause the strains to appear heterogeneous. It is difficult to separate second and third order strains.
A relationship between each and all levels of strains and bulk stress can be established if the corresponding compliance tensor, at the appropriate length scale, is known. For example, when a material undergoes uniform macroscopic elastic deformation, the interplanar distances will change in response to the magnitude and sign of the applied stress. This is the principle behind the methodology for XRD-based residual stress analysis.
4.2.1 Elastic Strain
Elastic strain is often more easily understood than plastic strain. Macroscopic elastic deformation induces a change in the atomic spacing of the crystalline structure. This is manifested in the XRD diffraction pattern as an observable change in d-spacing and diffraction angle (see Figure 8a). When the applied stress is removed, the d-spacings and the diffraction peak position return to normal (Figure 8b) unless a residual stress maintains a portion of the original strain (Figure 8a).
4.2.2 Plastic Strain
Plastic deformation of a crystalline material is controlled by the nucleation and movement of microstructural defects, particularly dislocations. At the onset of deformation, the dislocation density increases within the grains. As density increases, the distribution is noticeably heterogeneous and dislocations tend to gather along specific directions forming dislocation walls. The crystallographic unit cell size increases as deformation rate increases.
12 DRDC Atlantic TM 2012-102
Figure 8: Crystallographic lattice and associated diffraction peak profiles before (blue) and after (red) a stress is applied. The Bragg angle increases left to right, while d-spacing increases right to left. Under stress (a), elastic strain and d-spacing increases, while diffraction angle decreases.
When stress is removed (b), the concurrence in position of both peaks indicates the absence of elastic strain. Under stress (c), elastic strain is observable and the increased broadness
of the peak indicates yielding has occurred. In (d) the stress has been removed, but while there is no evidence for elastic strain, plastic deformation is discernible.
DRDC Atlantic TM 2012-102 13
The number of dislocations increases dramatically during plastic deformation. Dislocations spawn from existing dislocations, and from defects, grain boundaries and surface irregularities. Dislocations interact with defects in a variety of ways that depend on their adjacent localized strain field. In general, there is compression in the region of higher atomic density (slip plane) and tension following the dislocation direction.
Figure 8 shows a schematic of how crystal lattice strains affect diffraction peaks. Strains in excess of the elastic limit activate dislocations in the crystallographic structure that is related to the magnitude of applied stress. This manifests as broadening of the diffraction peak (Figures 8c and d). The strain response is often a superposition of both macroscopic and microscopic strains (see Figure 8c) [6]. The plastic strain (as indicated by diffraction peak broadness) does not decrease, like elastic strain, after the stress is removed (Figure 8d).
4.3 XRD Peak Broadening Analysis
The effect of atomic-level features (ex., lattice distortions, point defects, dislocation density), crystallite dimensions (ex., domains over which diffraction is coherent) and other factors (ex., residual stress, micro-cracks, distortion) on XRD data is readily available. XRD-based analytical methods range from standard simplistic approaches that relate the position of specific diffraction peaks to full diffraction profile refinement analysis. This section presents some of the standard empirical analysis approaches, while Section 5 examines quantitative approaches for peak broadening analysis.
4.3.1 Empirical Correlation with Hardness Measurements
The full-width at half maximum (FWHM) or the integral breadth (IB) may be employed to define the shape of an XRD peak. The FWHM is defined as the distance at 50% of the intensity maximum from side to side of the peak while IB is the area under the peak normalized by the peak intensity (height) [1].
Often an empirical relationship between XRD peak breadths, even without correction for instrumental broadening, can be related directly to the mechanical properties of engineering interest. Examples include the alteration of yield strength in cold worked alloys, and hardness in martensitic steels. Traditional measurement techniques are inherently destructive and either requires removal of a specimen or indentations on the surface. XRD techniques require neither.
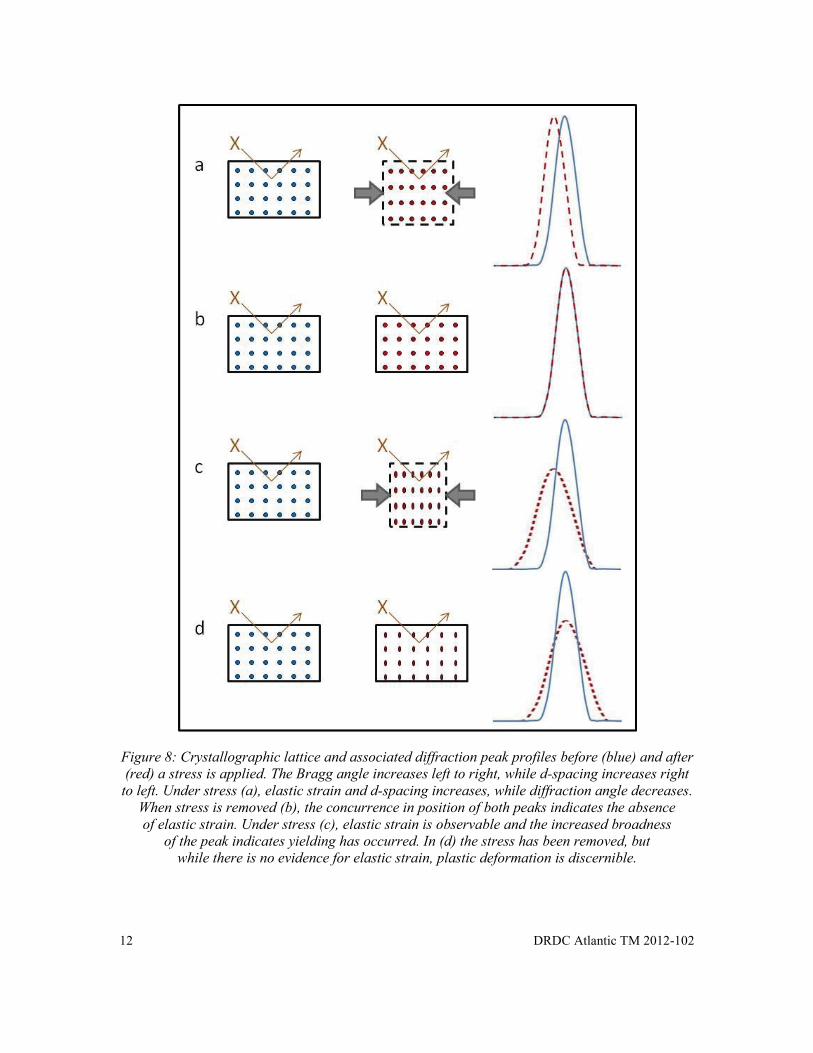
Prevéy [8] investigated the empirical relationship between the {211} FWHM (half breadth) and Rockwell C hardness for M50 high-speed tool steel (see Figure 9). Tool steel coupons were quenched and tempered to known hardness and had their {211} XRD peak breadths measured. Figure 9 shows the empirical curves that were produced. The hardness can then be calculated from the measured FWHM non-destructively for M50 high-speed tool steels.
14 DRDC Atlantic TM 2012-102
Figure 9: Graph of the relationship between the {211} FWHM (half breadth) and
Rockwell C hardness for M50 high-speed tool steel [8].
4.3.2 Empirical Correlation with Yield Strength
A direct correlation can be made between local yield strength and XRD peak breadth in work-hardened surface layers. Nobre et al. [9] used shot-peening to mechanically alter and induce local plastic deformation that would introduce compressive residual stress into the surface layers of several steel specimens. They then developed an empirical equation (Eq. 2) to relate the local yield stress (σ) to the bulk yield stress (σ0) and the change in the XRD FWHM or hardness value.
(2)
The variable H0 may be used to represent either the bulk FWHM or hardness value while ΔH represents the change in FWHM or hardness after plastic deformation. The constant γ is independent of strain-hardening and is close to 1 for FWHM and close to 2.8 for hardness data. Nobre et al. [9] estimated yield stress from both XRD FWHM and hardness values as a function of depth (using a layer removal technique). The results have shown that both the hardness and XRD peak breadth, associated with plastic deformation, are related to the strain-hardening capacity of the steel. Local yield stresses calculated from both hardness and XRD peak breadth data are shown in Figure 10. Results correlate well and are believed to reflect real changes in yield stress with depth.
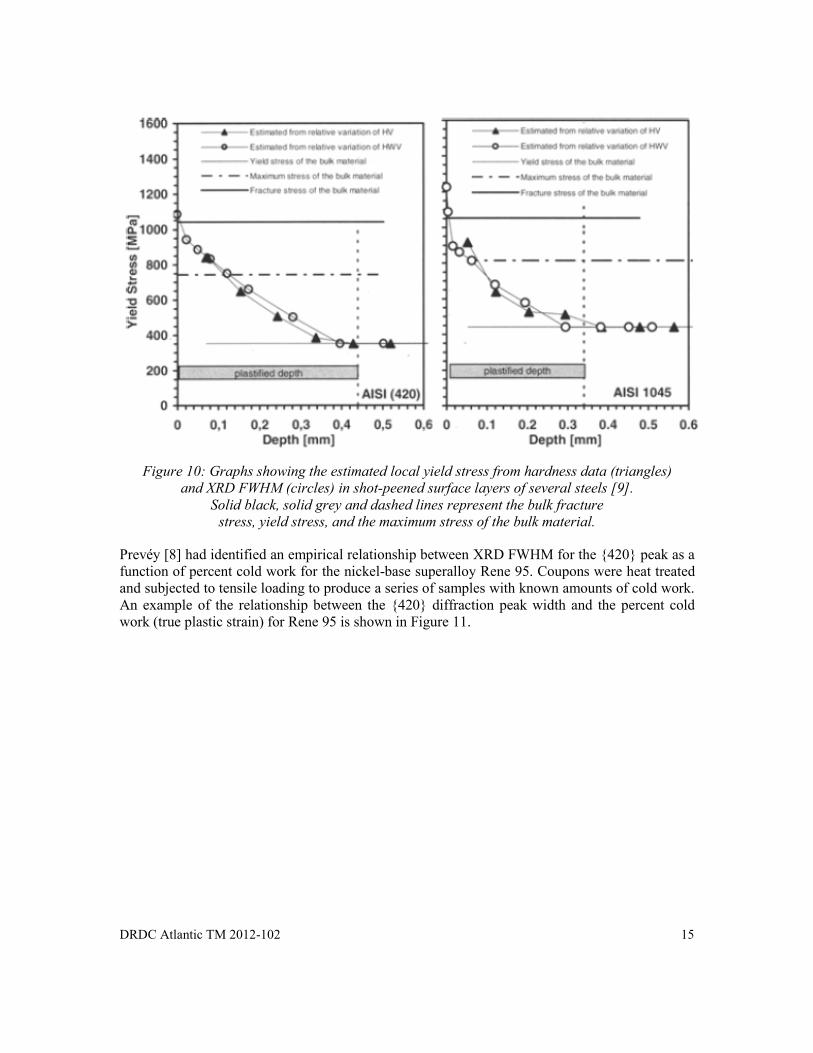
DRDC Atlantic TM 2012-102 15
Figure 10: Graphs showing the estimated local yield stress from hardness data (triangles)
and XRD FWHM (circles) in shot-peened surface layers of several steels [9]. Solid black, solid grey and dashed lines represent the bulk fracture
stress, yield stress, and the maximum stress of the bulk material.
Prevéy [8] had identified an empirical relationship between XRD FWHM for the {420} peak as a function of percent cold work for the nickel-base superalloy Rene 95. Coupons were heat treated and subjected to tensile loading to produce a series of samples with known amounts of cold work. An example of the relationship between the {420} diffraction peak width and the percent cold work (true plastic strain) for Rene 95 is shown in Figure 11.
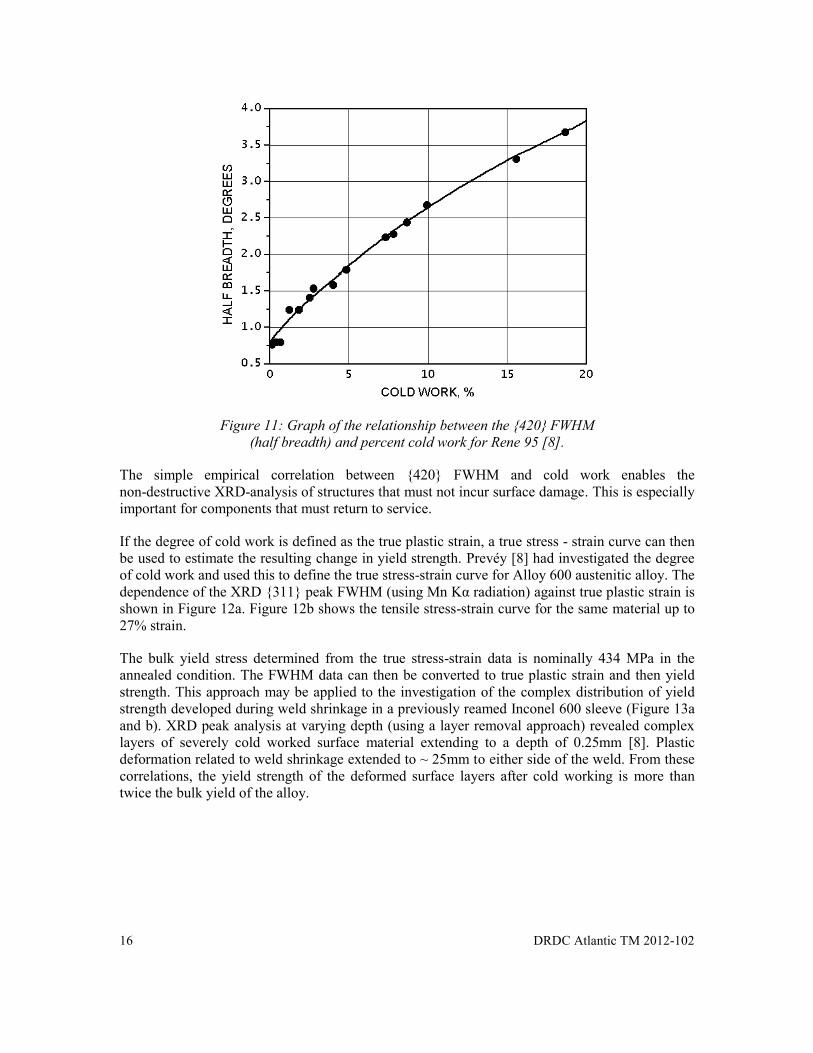
16 DRDC Atlantic TM 2012-102
Figure 11: Graph of the relationship between the {420} FWHM
(half breadth) and percent cold work for Rene 95 [8].
The simple empirical correlation between {420} FWHM and cold work enables the non-destructive XRD-analysis of structures that must not incur surface damage. This is especially important for components that must return to service.
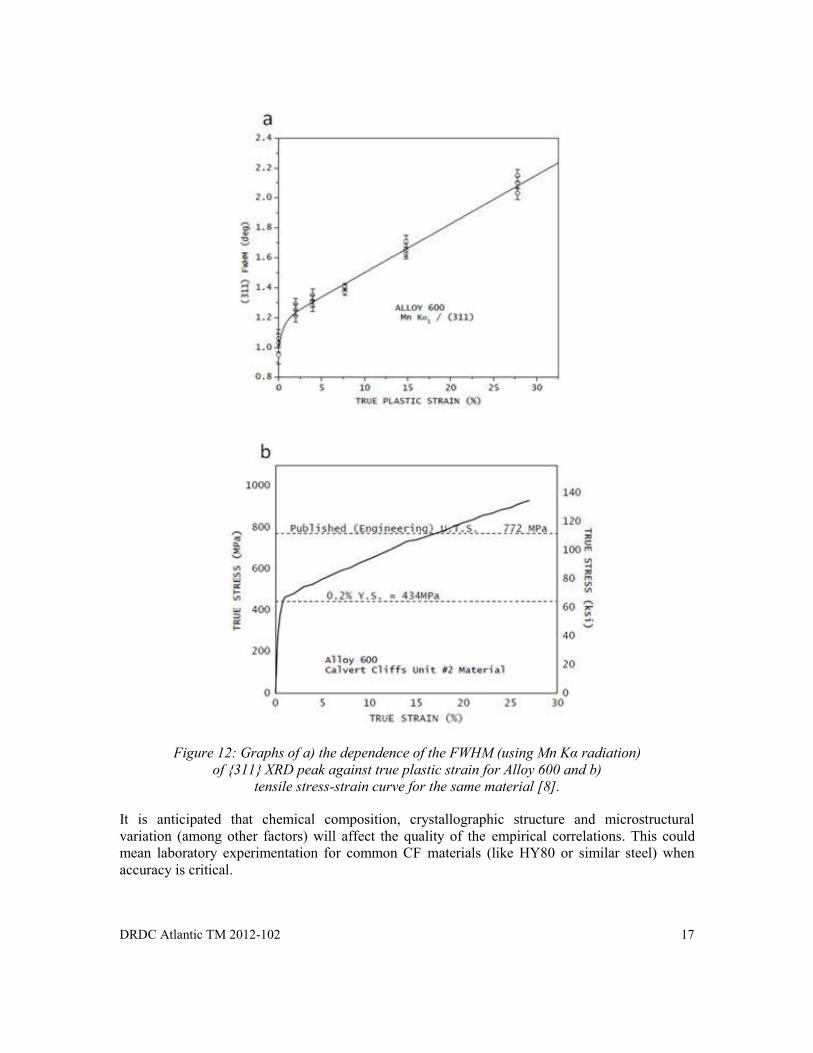
If the degree of cold work is defined as the true plastic strain, a true stress - strain curve can then be used to estimate the resulting change in yield strength. Prevéy [8] had investigated the degree of cold work and used this to define the true stress-strain curve for Alloy 600 austenitic alloy. The dependence of the XRD {311} peak FWHM (using Mn Kα radiation) against true plastic strain is shown in Figure 12a. Figure 12b shows the tensile stress-strain curve for the same material up to 27% strain.
The bulk yield stress determined from the true stress-strain data is nominally 434 MPa in the annealed condition. The FWHM data can then be converted to true plastic strain and then yield strength. This approach may be applied to the investigation of the complex distribution of yield strength developed during weld shrinkage in a previously reamed Inconel 600 sleeve (Figure 13a and b). XRD peak analysis at varying depth (using a layer removal approach) revealed complex layers of severely cold worked surface material extending to a depth of 0.25mm [8]. Plastic deformation related to weld shrinkage extended to ~ 25mm to either side of the weld. From these correlations, the yield strength of the deformed surface layers after cold working is more than twice the bulk yield of the alloy.
DRDC Atlantic TM 2012-102 17
Figure 12: Graphs of a) the dependence of the FWHM (using Mn Kα radiation)
of {311} XRD peak against true plastic strain for Alloy 600 and b) tensile stress-strain curve for the same material [8].
It is anticipated that chemical composition, crystallographic structure and microstructural variation (among other factors) will affect the quality of the empirical correlations. This could mean laboratory experimentation for common CF materials (like HY80 or similar steel) when accuracy is critical.

18 DRDC Atlantic TM 2012-102
Figure 13: Variation in a) degree of cold work (equivalent accumulated true plastic strain)
and b) Yield strength with axial displacement in a J-weld mock-up of Alloy 600 [8].
DRDC Atlantic TM 2012-102 19
5 Methodology for XRD Peak Broadening Analysis
XRD peak broadening is caused by both intergranular and microscopic strain (strain of the 2nd and 3rd order, respectively), crystallite size and instrumental effects. By careful reduction of the instrumental effects, peak shape parameters such as FWHM or the IB may be calculated. The FWHM and IB have been shown to be proportional to the number and distribution of defects (such as stacking faults, point defects and sub-grain boundaries) and inversely proportional to crystallite size [1].
Developing XRD peak broadening models that relate to the microstructural state of the material requires some fundamental understanding of crystal and microstructure of the alloys. These analytical approaches can then be applied to the experimental determination of crystallite size and dislocation density in materials. The following sub-sections provide a summary of the history of peak broadening analysis and discuss some pros and cons of the more popular approaches. The next sub-section identifies specific approaches and provides more comprehensive details of their application to peak broadening analysis.
5.1 History of XRD Peak Broadening Analysis
5.1.1 Scherrer Approach (1918)
Scherrer [16] was the first to identify a quantitative relationship between diffraction peak breadth parameters and crystallite size. The Scherrer approach relates the broadness of the diffraction peak at a specific height using the FWHM or IB (often denoted as β and measured in radians) to the Scherrer constant or shape factor (K), X-ray wavelength (λ), the mean size of the ordered crystallites (D) and the Bragg angle (θ).
(3)
Most investigators use average values (over the first 10 reflections) of 0.87 and 1.10 as the Scherrer constants for the FWHM and IB, respectively. While adequate, the constants are both crystal structure and Bragg reflection specific and can vary significantly. Langford and Wilson [18] calculated Scherrer constants for cubic, tetragonal and orthorhombic crystal systems that may be applied to nearly spherical grains. One drawback is that the Scherrer equation is limited to grains smaller than about 0.1 μm, which precludes those observed in steel microstructures. For clarification, Figure 14 differentiates the sizes of crystallites, grains and crystals.
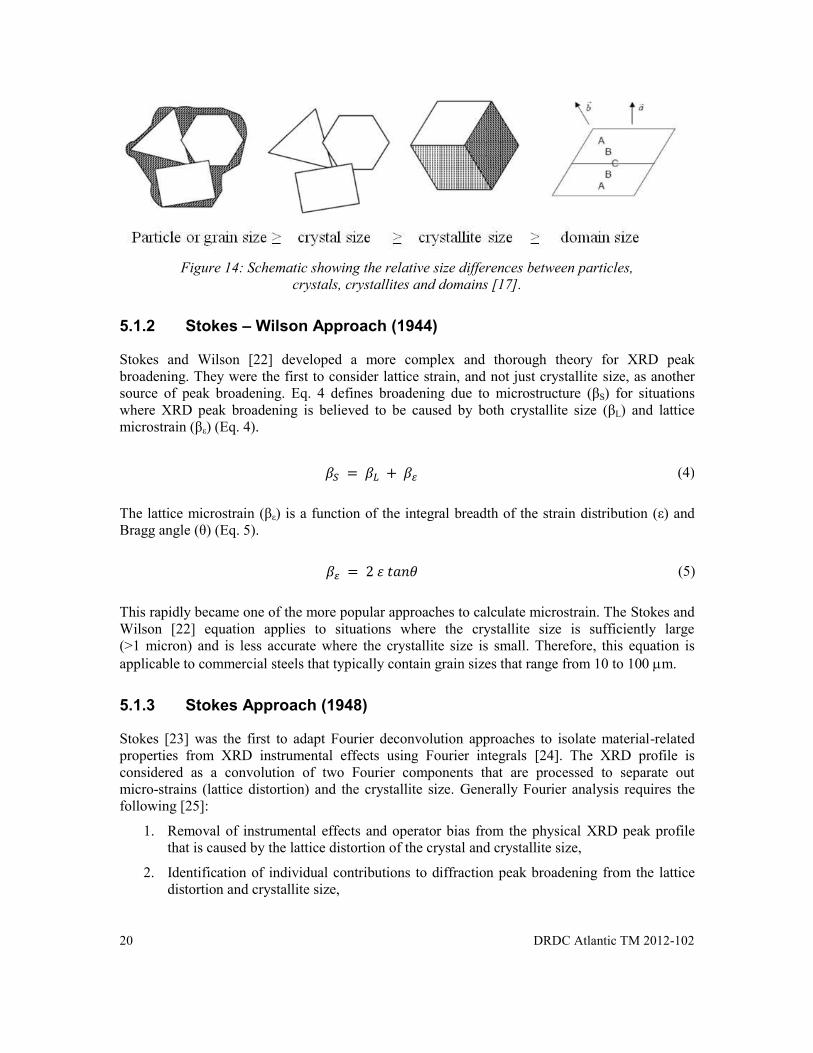
20 DRDC Atlantic TM 2012-102
Figure 14: Schematic showing the relative size differences between particles,
crystals, crystallites and domains [17].
5.1.2 Stokes – Wilson Approach (1944)
Stokes and Wilson [22] developed a more complex and thorough theory for XRD peak broadening. They were the first to consider lattice strain, and not just crystallite size, as another source of peak broadening. Eq. 4 defines broadening due to microstructure (βS) for situations where XRD peak broadening is believed to be caused by both crystallite size (βL) and lattice microstrain (βε) (Eq. 4).
The lattice microstrain (βε) is a function of the integral breadth of the strain distribution (ε) and Bragg angle (θ) (Eq. 5).
(5)
This rapidly became one of the more popular approaches to calculate microstrain. The Stokes and Wilson [22] equation applies to situations where the crystallite size is sufficiently large (>1 micron) and is less accurate where the crystallite size is small. Therefore, this equation is applicable to commercial steels that typically contain grain sizes that range from 10 to 100 m.
5.1.3 Stokes Approach (1948)
Stokes [23] was the first to adapt Fourier deconvolution approaches to isolate material-related properties from XRD instrumental effects using Fourier integrals [24]. The XRD profile is considered as a convolution of two Fourier components that are processed to separate out micro-strains (lattice distortion) and the crystallite size. Generally Fourier analysis requires the following [25]:
1. Removal of instrumental effects and operator bias from the physical XRD peak profile that is caused by the lattice distortion of the crystal and crystallite size,
2. Identification of individual contributions to diffraction peak broadening from the lattice distortion and crystallite size,
(4)
DRDC Atlantic TM 2012-102 21
3. Quantitative determination of the distribution structural defects (ex., dislocations, stacking faults, vacancies) from broadening of diffraction peaks.
5.1.4 Warren – Averbach Approach (1950)
The Stokes approach was further developed by Bertaut [26] and Warren and Averbach [27]. This was based on an improved analysis approach and the observation that the diffraction order (or the contribution from a specific crystallographic plane) played a role in the calculation of microstrain and not crystallite size. Both authors proved that it is possible to determine the column length distribution (to estimate crystallite size) from deconvolution of the Fourier size coefficients during Fourier analysis of XRD peak profiles.
The Warren – Averbach approach has been further developed to include different scaling factors that act to better determine particle size, density of dislocations, and degree of twinning and faulting. This method for separating size and strain broadening is less constrained and more suitable for mXRD instrumentation. Evolution of the Warren – Averbach approach is discussed in more detail in Section 5.3.2.
5.1.5 Williamson – Hall Approach (1953)
Hall [20], similar to Stokes and Wilson [22], showed that particle (crystallite) size and stress effects simultaneously affect XRD peak breadth. He was the first to introduce the concept that the density of dislocations is proportional to the average distance between diffraction planes – published in a letter to the editor in 1949 [28]. Hall devised the following equation that assumes anisotropic strain defined by the Laue stress distribution function (σL; independent of direction) and the elastic modulus for a particular crystallographic plane (Ehkl) that is defined for a specific Bragg reflection as defined by the Bragg angle (θ) and the wavelength of the X-ray radiation (λ).
(6)
A more extensive paper by Williamson – Hall [19] discussed evolution of the Hall equation (Eq. 6) and proposed an approach for resolving both the crystallite size and strain broadening contributions to XRD peak profiles. The classical Williamson – Hall (W-H) approach is defined by the general expression for XRD peak broadening analysis [19]. The four terms represent the observed XRD peak breadth (βO), instrumental contribution (βI), grain size broadening (βL) and strain broadening (βε), respectively.
(7)
The W-H approach [19] is a simple approach that considered Lorentzian fits to both crystallite size and microstrain components to diffraction peak broadening. In this approach, FWHM and IB of individual peak profiles for the entire XRD pattern are plotted as a function of 2sin(θ)/λ [19]. The intercept and slope of the regression line correspond to the size parameters and mean square strain, respectively. Unfortunately, strain anisotropy introduces nonlinearity in the data that requires a more sophisticated analysis approach.
22 DRDC Atlantic TM 2012-102
The W-H approach was later modified and developed to relate strain broadening to crystallite size, dislocation density and the Burgers vector [29]. The modified W-H approach represents the first equations to consider Burgers vectors in slip systems, higher order hkl reflections and prevailing dislocation type (screw or edge). Evolution of the Williamson – Hall approach is discussed in more detail in Section 5.3.1.
5.1.6 Wilkens Approach (1967)
Wilkens [30] was the first to attribute lattice distortions to dislocations in the deformed crystals. In particular, the strain normal to the diffraction plane ( is a function of the dislocation density (ρ), length of the Burgers vector (b), the effective outer cutoff radii of dislocations (Re), the Fourier length (L) and the average contrast factor ) [30]
(8)
The average contrast factor is discussed in more detail in Section 5.3.1. The Wilkens approach fostered the development of the modified Williamson – Hall and Warren – Averbach approaches.
5.1.7 Rietveld Approach (1967)
Rietveld refinement revolutionized approaches that use isolated diffraction peaks to enable full diffraction profile analysis. In the Rietveld method (and similar approaches) each data point in the continuous diffraction spectrum is an observation. Crystal structure and instrumental parameters are varied using a least-squares approach until the best fit between the measured and theoretical XRD pattern is realized [31]. Instrumental parameters include equipment specific constraints (ex., X-ray wavelength, angles, step size) that have set values (and are not refined) and a background fit function that is characteristic of the equipment. Crystallographic-related fit parameters include diffraction peak shape (fit parameters and functions), lattice constants (spacing and angles), scaling factors (polarization, preferred orientation, absorption and temperature) and structural parameters (atomic positions, occupancies, displacement, and multiplicity) [31].
Rietveld investigations often start with a theoretical model that was previously determined on the specific instrument and is similar to the crystallographic material being investigated. It is ideal for whole XRD pattern modeling of lattice parameters, structural disorder, phase percentages (ex., austenite), crystallite size, and micro strain. The dislocation density and crystallinity may then be calculated using the aforementioned approaches.
Since the original publication and program development by Rietveld [31], there has been a proliferation of versions of the popular computer program with more recent versions offering more complex fit models - for example, the popular approach by Young [32]. Therefore, it is likely that quantification of plastic deformation will inevitably become as routine as lattice parameter refinement and elastic strain analysis. Unfortunately, this can lead to gross errors that are often overlooked when the calculations are trivialized. This is true of XRD strain and stress analysis where significant errors (as large as 40%) may be introduced with improper equipment, procedures and elastic constants.
DRDC Atlantic TM 2012-102 23
5.2 Instrumental Component of XRD Peak Broadening Analysis
The more popular approaches for XRD peak broadening analysis tend to explain broadening in terms of the microstructural state of the material under investigation and instrumental factors (ex., measurement noise, continuous background). In general, it is far easier to consider removal of instrumental effects. Of the two most common approaches, one consists of isolating the microstructural component, while the other looks to deconvolute the different signals. The former and most common approach involves collecting the XRD pattern of a “perfect” crystal standard. The “perfect” background is then subtracted from the measured XRD pattern. The latter involves a variety of numerical modeling and extraction methods, such as those described by Guinebretiere [14]. For the following Sections, unless indicated, it is assumed that instrumental factors have been removed prior to modeling the microstructure.
5.3 Microstructural Component of XRD Peak Broadening Analysis
The Williamson – Hall and Warren – Averbach methods are both based on the concept that the diffraction peak profile in reciprocal space results from the convolution of three contributions. The first contribution represents the broadening effect of the instrumental components. The second and third contributions are microstructural and represent the broadening effect from the crystallite size and microdistortion (related to dislocations), respectively. Crystallite size and microdistortions are then obtained by deconvolution of the XRD peak using different hypotheses.
5.3.1 Williamson – Hall (W-H) Approach
The Williamson – Hall approach, introduced in Section 5.1.5, can be used to deconvolute the contributions from both stress and particle size contributions on XRD peak broadening. As mentioned previously, this approach assumes strain broadening is strictly caused by dislocations and relates FWHM and IB to crystallite size, dislocation density and the Burgers vector [29]. The following sub-sections are a summary of the work on the modified Williamson – Hall approach.
5.3.1.1 Classical W-H Approach
The classical Williamson – Hall (W-H) approach [19] relies on the principle that size broadening (BL, Eq. 3) and strain broadening (Be, Eq. 4) vary with respect to Bragg angle (θ). The combination of which (Eq. 7) shows that the size contribution varies as a function of 1/cos(θ), while the strain component varies as a function of tan(θ). The W-H approach assumes that the convolution of the combined effect may be separated using a sum of squares approach.
(9)
Or,
24 DRDC Atlantic TM 2012-102
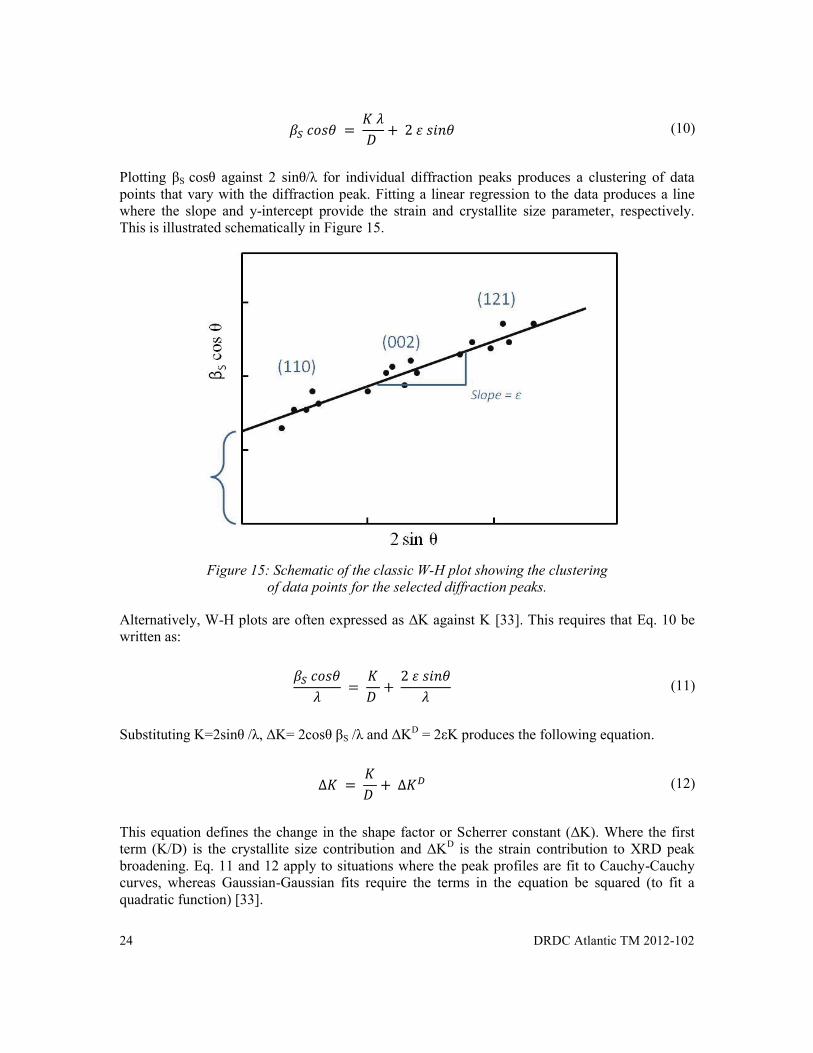
(10)
Plotting βS cosθ against 2 sinθ/λ for individual diffraction peaks produces a clustering of data points that vary with the diffraction peak. Fitting a linear regression to the data produces a line where the slope and y-intercept provide the strain and crystallite size parameter, respectively. This is illustrated schematically in Figure 15.
Figure 15: Schematic of the classic W-H plot showing the clustering
of data points for the selected diffraction peaks.
Alternatively, W-H plots are often expressed as ΔK against K [33]. This requires that Eq. 10 be written as:
(11)
Substituting K=2sinθ /λ, ΔK= 2cosθ βS /λ and ΔKD = 2εK produces the following equation.
(12)
This equation defines the change in the shape factor or Scherrer constant (ΔK). Where the first term (K/D) is the crystallite size contribution and ΔKD is the strain contribution to XRD peak broadening. Eq. 11 and 12 apply to situations where the peak profiles are fit to Cauchy-Cauchy curves, whereas Gaussian-Gaussian fits require the terms in the equation be squared (to fit a quadratic function) [33].
DRDC Atlantic TM 2012-102 25
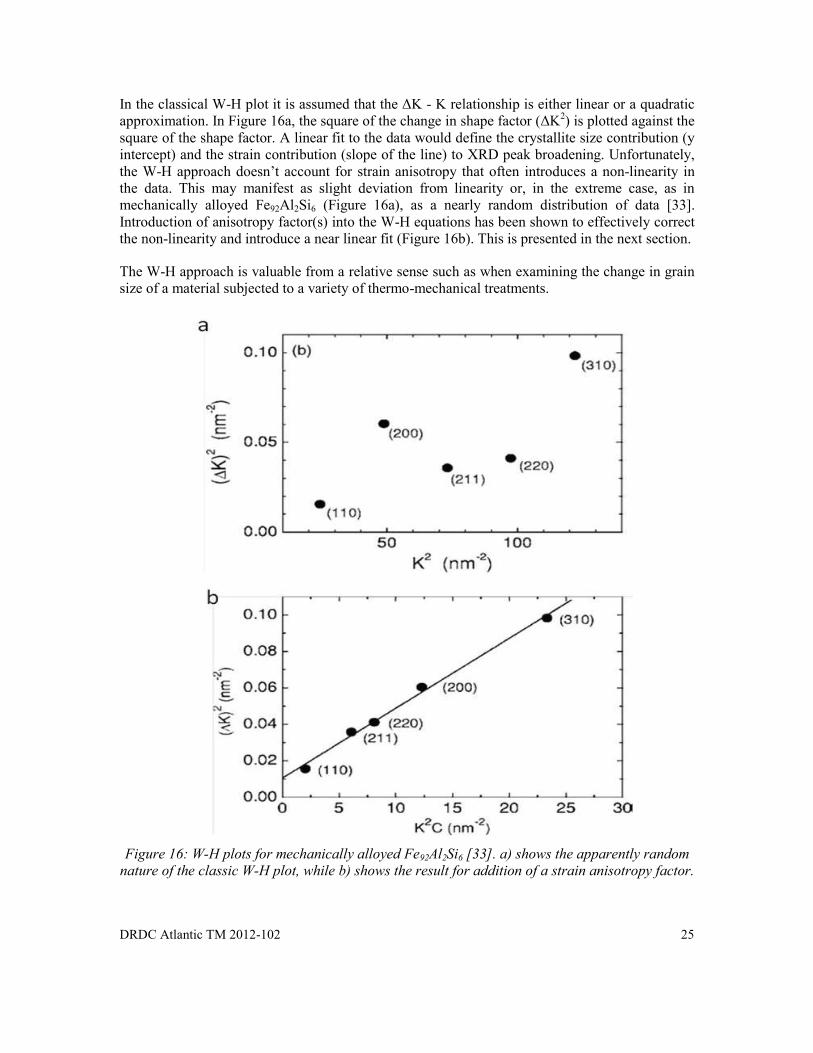
In the classical W-H plot it is assumed that the ΔK - K relationship is either linear or a quadratic approximation. In Figure 16a, the square of the change in shape factor (ΔK2) is plotted against the square of the shape factor. A linear fit to the data would define the crystallite size contribution (y intercept) and the strain contribution (slope of the line) to XRD peak broadening. Unfortunately, the W-H approach doesn’t account for strain anisotropy that often introduces a non-linearity in the data. This may manifest as slight deviation from linearity or, in the extreme case, as in mechanically alloyed Fe92Al2Si6 (Figure 16a), as a nearly random distribution of data [33]. Introduction of anisotropy factor(s) into the W-H equations has been shown to effectively correct the non-linearity and introduce a near linear fit (Figure 16b). This is presented in the next section.
The W-H approach is valuable from a relative sense such as when examining the change in grain size of a material subjected to a variety of thermo-mechanical treatments.
Figure 16: W-H plots for mechanically alloyed Fe92Al2Si6 [33]. a) shows the apparently random
nature of the classic W-H plot, while b) shows the result for addition of a strain anisotropy factor.
26 DRDC Atlantic TM 2012-102
5.3.1.2 Modified W-H approach
Ungár [34,35] has clearly shown that the diffraction peak broadening experienced by each set of diffraction planes is not identical and, while the FWHM does tend to increase with reflection order (or diffraction angle), it is not monotonic. With anisotropic strain, it may be necessary to measure strain in all planes that are perpendicular to the crystallographic axes (h00), (0k0), (00l), (hk0) (h0l) (0kl) to capture strain contributions along the a, b and c directions. This anisotropy can play an important role in understanding the evolution of strain (elastic and plastic) and for selection of XRD peaks for analysis.
Many of the more sophisticated analysis approaches assume that strain broadening is strictly caused by dislocations. A variety of modified W-H approaches have been proposed based on a dislocation model for strain that relate peak broadening to crystallite size, dislocation density and the Burgers vector [29,34,35].
Ignoring crystallite size effects, strain in a dislocated crystal is related to the ‘formal’ dislocation density (ρ*) and the fluctuation in the dislocation density (Q*). Therefore ΔKD is represented by the equation [34]:
(13)
Where R1 and R2 are parameters determined by the effective outer cutoff radii of dislocations. The variable p* is the formal dislocation density that is directly available from diffraction peak broadening and Q* is the formal fluctuation in the dislocation density [34] that are described by:
(14)
(15)
Where p and Q are the true values for the dislocation density and its fluctuation, respectively, is the average dislocation contrast factor for a particular hkl reflection direction (g) along the length of the Burgers vector (b). Given that the equations are diffraction order dependent, g=K at exact Bragg angles [35].
Combining the previous 4 equations produces the following equation;
(16)
Equation 16 was reported by Ungár [34,35,36,38] and differs slightly from other authors [29,33,37] in terms of how the constants are defined. The first term in Eq. 16 provides the
DRDC Atlantic TM 2012-102 27
crystallite size contribution that is related to the shape factor or Scherrer constant (K). Often an average constant of 0.9 is used for calculations involving the FWHM. The first term may be determined by interpolation of the modified W-H plots at
The second and third terms account for the effect of dislocations on diffraction peak broadening in terms of dislocation density (ρ), the length of the Burgers vector (b) and the dislocation constants. The length of the Burgers vector (b) is calculated from the a lattice parameter for the bcc structure according to the relation . R1 and R2 are dislocation constants that describe the effective outer cut-off radius for the dislocations. These constants must be obtained from the tails (asymptotic broadening decay) of the diffraction peak profiles during Fourier transformations. K is the Sherrer constant or diffraction vector defined by the relation
.
The first component of the strain contribution is the dominant portion of the equation and shows that dislocations are the primary source of strain in a crystal. In fact, the second term is often ignored due to Q not being well defined [33]. The key point is that the proper scaling factor becomes instead of K and that the modified W-H plots show the relationship between ΔK and or ΔK2 and – see Figure 16b [35].
The term is the average dislocation contrast factor that depends on the relative positions of the diffraction vector, the Burgers vector and dislocation line vectors. For cubic systems, the contrast factor is defined with a fitting parameter (q) [36]:
(17)
(18)
When elastic anisotropy information is decomposed into pure edge and screw dislocations, they can be defined by the following linear combinations [7].
(19)
For , the expression becomes:
(20)
In this way, the screw fraction of the dislocations (φ) may be calculated from average fitting parameters for contrast factors for the pure edge and screw components, respectively [38].
28 DRDC Atlantic TM 2012-102
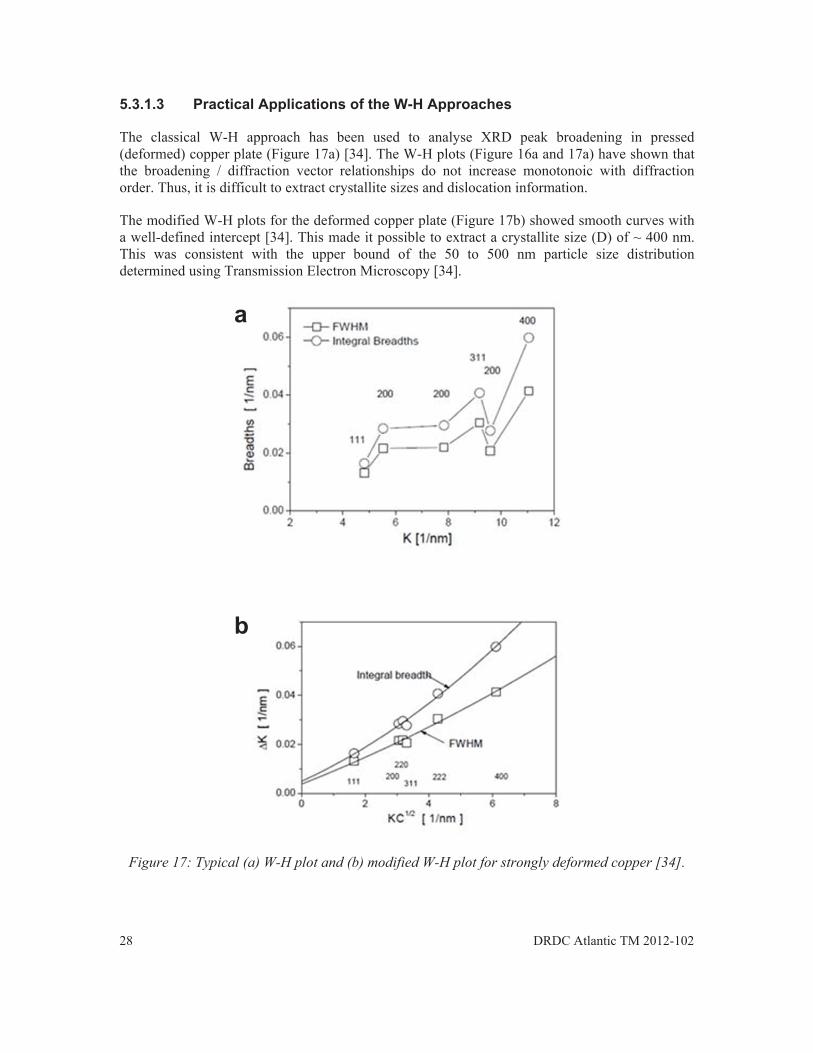
5.3.1.3 Practical Applications of the W-H Approaches
The classical W-H approach has been used to analyse XRD peak broadening in pressed (deformed) copper plate (Figure 17a) [34]. The W-H plots (Figure 16a and 17a) have shown that the broadening / diffraction vector relationships do not increase monotonoic with diffraction order. Thus, it is difficult to extract crystallite sizes and dislocation information.
The modified W-H plots for the deformed copper plate (Figure 17b) showed smooth curves with a well-defined intercept [34]. This made it possible to extract a crystallite size (D) of ~ 400 nm. This was consistent with the upper bound of the 50 to 500 nm particle size distribution determined using Transmission Electron Microscopy [34].
Figure 17: Typical (a) W-H plot and (b) modified W-H plot for strongly deformed copper [34].
a
b
DRDC Atlantic TM 2012-102 29
5.3.2 XRD Peak Broadening With Warren – Averbach (W-A)
Similar to the W-H approach, the Warren – Averbach (W-A) approach considers size broadening to be angle independent and strain broadening to be diffraction angle dependent [27]. The W-A approach that is often used to deconvolute size-strain broadening is perhaps the least constrained method for analyzing XRD peak broadening.
5.3.2.1 Classical W-A Approach
The classical W-A approach [27] has become one of the more rigorous and widely used methods for deconvolution of size and strain effects in XRD peak broadening analysis. While originally used for plastically deformed materials, it is widely accepted for use with other materials [27].
While there are many approaches that employ Fourier-deconvolution, the W-A approach follows the Stokes method because of its wide acceptance and reduced bias [39]. The basic equation (Eq. 21) used for the W-A approach relates the real components of the Fourier coefficients for the density distribution profile, AL, to the crystallite size, , and distortion or strain, , contributions [27].
(21)
The Fourier Length, L is defined by Eq. 22, where n is an integer and a3 is the unit of the Fourier length in the direction of the diffraction vector (g) as defined by the angular range of the measured diffraction profile (θ2 – θ1) [36,40,41].
(22)
For small Fourier lengths, the size and strain components of the equation can be approximated by [41].
(23)
And
(24)
Where Dhkl is the domain normal to the hkl diffracting planes and is given by:
(25)
30 DRDC Atlantic TM 2012-102
Combining Eq. 21 and 24 the real part of the Fourier transformation, for large (negligible crystallite size effects) deformed (with dislocations) crystals, may be evaluated as [40,41]:
(26)
Where is the component of strain normal to the diffraction plane averaged over L. Ungár [36] and Nair [41] employ a similar equation, where the constant K replaces and
is replaced by the equivalent function .
(27)
In the classical W-A plot it is assumed that the ln AL versus relationship is a linear approximation. Thus a linear fit to the data should produce an intercept where provides the crystallite size and the slope defines the strain ( or ).
Similar to the W-H approach, the W-A approach requires the use of strain anisotropy factor(s) to effectively correct non-linearity in the data. Figure 18a shows the W-A plot for nanocrystalline Cu [42] that is typical for materials that exhibit strain anisotropy. Figure 18b is from the same XRD peak broadening data after introduction of a strain anisotropy factor using the modified W-A equations [42].
5.3.2.2 Modified W-A Approach
In the modified W-A approach, Equation 27 may be combined with the Wilkens [30] equation (Eq. 8) to produce the following relationship:
(28)
Now the density distribution profile, AL is related directly to the crystallite size, , the dislocation density (ρ), length of the Burgers vector (b), the effective outer cut-off radii of dislocations (Re), and the average contrast factor ).
When this is turned into a power series, where:
(29)
The modified W-A equation becomes:
(30)
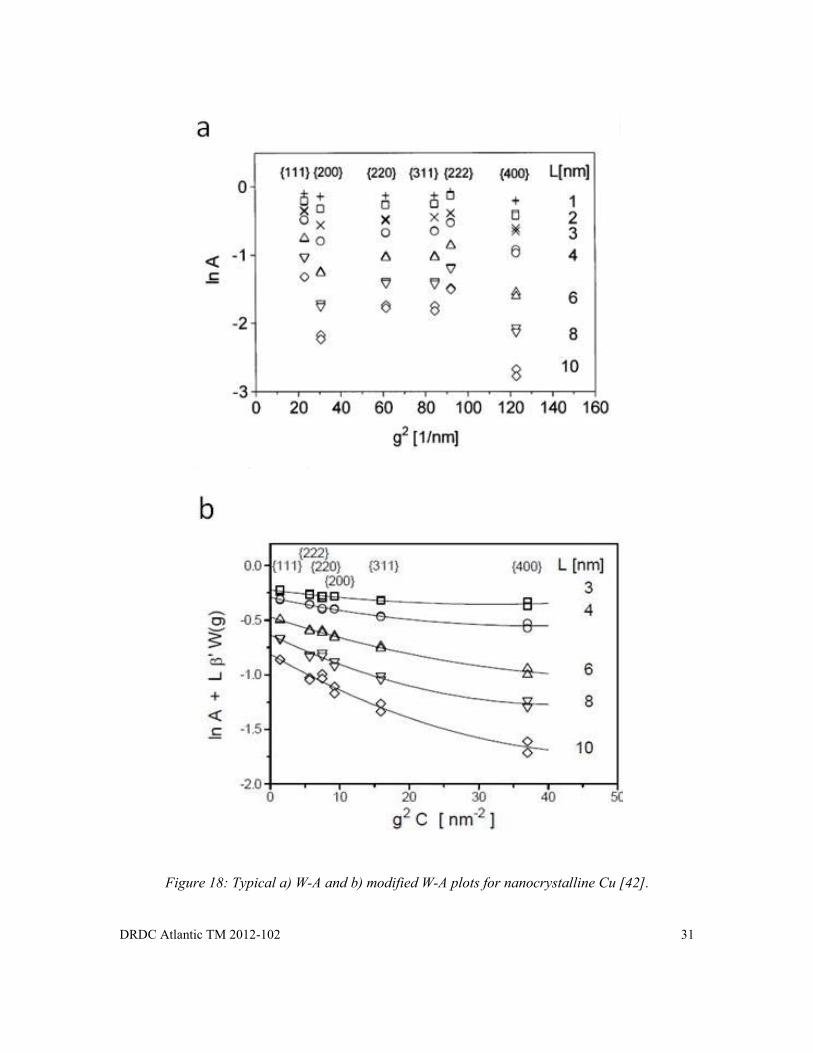
DRDC Atlantic TM 2012-102 31
Figure 18: Typical a) W-A and b) modified W-A plots for nanocrystalline Cu [42].
32 DRDC Atlantic TM 2012-102
Where O is small and represents higher orders of [29,35]. Plotting ln AL against K as produces a data set that can be fit to a linear function for each series of hkl reflections. Extrapolation of the lines to produces a value for the area-weighted mean column length or crystallite size (L0). Dislocation density calculation requires extraction of the 2nd term in Eq. 29 to define a new term ML and division of both sides by L2 [29].
(31)
Plotting against ln(L) provides a dataset that may be fit with a linear relation where the slope
of the line represents the dislocation density and the intercept at defines the effective outer cut-off radius.
As an example, Movaghar Garabagh et al. [29] examined XRD peak broadening analysis to gain a better understanding of the deformation process and deformed structure of martensitic steel. They determined dislocation densities and crystallite sizes using the classical and modified W-H and W-A approaches. Crystallite size was found to decrease with strain on average from 96 nm for cold rolled steel to 69 nm for equal-channel angular pressed (ECAP) steel. Dislocation densities of 1.3 and 1.34 x 10¹² m-2 for cold rolled and ECAP, respectively, were extracted by plotting against ln(L) (Figure 19) [29]. While dislocation densities were similar, the fraction of screw dislocations increased from 73 to 83%.
Figure 19: Linear regression plot of against ln(L) for cold rolled and equal-channel angular pressed steel [29].
DRDC Atlantic TM 2012-102 33
5.3.2.3 Practical Applications of the W-A Approaches
An application of the W-A and modified W-A diffraction peak broadening analysis approach is shown in Figures 18 and 20. The classical W-H approach has been used to analyse peak broadening in nanocrystalline Cu [42] and ball-milled Galena [43]. Similar to W-H plots, the W-A plots (Figure 9a and 11a) have shown that the broadening / diffraction vector relationships do not increase monotonously with diffraction order. Thus, it is difficult to extract crystallite sizes and dislocation information for these and other deformed samples.
The modified W-H plots (Figures 18b and 20b) showed smooth curves with a well-defined intercept [34]. This made it possible to extract the crystallite sizes and dislocation densities for each sample tested.
5.3.3 Analysis of XRD Peak-Broadening Approaches
5.3.3.1 Correlation with TEM Investigations
Dislocation density and crystallite size may be evaluated using Transmission Electron Microscopy (TEM) and the approaches described above. This Section examines some of the studies that report reliable complementary TEM and XRD peak broadening data to clarify the precision, with respect to TEM, of the XRD results. TEM is especially suited to lower dislocation densities, while the XRD method is less reliable when peak broadening is less pronounced (i.e., there is lower dislocation density) [44].
Ortiz and Shaw [45] examined severely plastically deformed aluminum alloy in an attempt to correlate crystallite sizes determined through Rietveld XRD peak broadening analysis with TEM measurements. The W-A approach provided a crystallite range from 5 to 50 nm with an average of 15 nm. Results were quantitatively similar to TEM analyses which revealed grain sizes from 6 to 45 nm with an average of 16 nm. The use of the Scherrer approach and Stokes and Wilson approach underestimated crystallite size values by a factor of 2 [45].
Kužel et al. [46] conducted a structural investigation of sub-micron crystalline metals obtained by high-pressure torsional deformation. TEM measurements varied from 100-500 nm, while XRD (W-H) were smaller and varied from 50-300 nm. Kužel et al. [46] attributed this to a consequence of differences between grain and crystallite coherent domain sizes. It is likely a consequence of anisotropic strain that is apparent in their W-H plot (Figure 21). More accurate results would be expected with using the modified W-H equations and inclusion of a strain contrast factor. Kužel et al. [46] reported dislocation densities in the range from 1014 – 1015 m-2, consistent with other published works for these materials.
34 DRDC Atlantic TM 2012-102
Figure 20: Typical a) W-A and b) modified W-A plots for ball-milled Galena [43].
DRDC Atlantic TM 2012-102 35
Figure 21: W-H plots showing strain anisotropy in samples of as-deformed Cu (triangles),
as-deformed (circles) and annealed (squares) Cu with 0.5 wt% Al2O3 [46]. Solid symbols represent experimental results while open symbols were calculated.
TakeBayahi et al. [47] compared TEM results with the modified W-H and W-A approaches to quantify dislocation densities in as-quenched and tempered martensitic steels (3 wt% C). Results are shown in Table 1. The W-H equations did not include a dislocation contrast factor even though W-H plots clearly exhibited some non-linearity. A contrast factor was used for the modified W-A equations and is expected to be more accurate given the preceding discussion.
While TEM analysis was conducted on specimens in the as-quenched and tempered (at 623 and 923 K) conditions, it was difficult to evaluate the as-tempered specimen as the dislocations tended to aggregate over the entire background of the lath structure [44]. TEM analysis results were consistent with both W-H and modified W-A analysis at 623 and 923K.
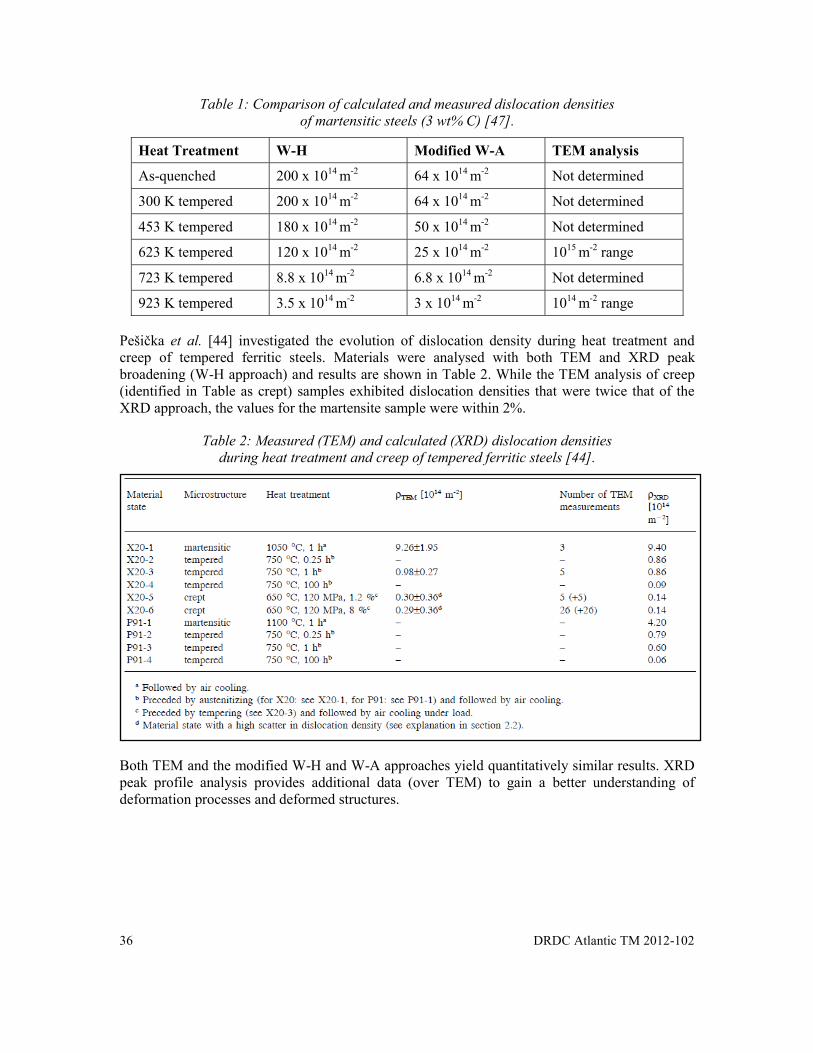
36 DRDC Atlantic TM 2012-102
Table 1: Comparison of calculated and measured dislocation densities of martensitic steels (3 wt% C) [47].
Heat Treatment W-H Modified W-A TEM analysis
As-quenched 200 x 1014 m-2 64 x 1014 m-2 Not determined
300 K tempered 200 x 1014 m-2 64 x 1014 m-2 Not determined
453 K tempered 180 x 1014 m-2 50 x 1014 m-2 Not determined
623 K tempered 120 x 1014 m-2 25 x 1014 m-2 1015 m-2 range
723 K tempered 8.8 x 10¹⁴ m-2 6.8 x 10¹⁴ m-2 Not determined
923 K tempered 3.5 x 10¹⁴ m-2 3 x 10¹⁴ m-2 1014 m-2 range
Pešička et al. [44] investigated the evolution of dislocation density during heat treatment and creep of tempered ferritic steels. Materials were analysed with both TEM and XRD peak broadening (W-H approach) and results are shown in Table 2. While the TEM analysis of creep (identified in Table as crept) samples exhibited dislocation densities that were twice that of the XRD approach, the values for the martensite sample were within 2%.
Table 2: Measured (TEM) and calculated (XRD) dislocation densities during heat treatment and creep of tempered ferritic steels [44].
Both TEM and the modified W-H and W-A approaches yield quantitatively similar results. XRD peak profile analysis provides additional data (over TEM) to gain a better understanding of deformation processes and deformed structures.
DRDC Atlantic TM 2012-102 37
5.3.3.2 Summary and Comparison of XRD Peak Broadening Approaches
Empirical correlation between the breadth of select peaks and material properties offer the simplest, least time-consuming approach. This requires the sacrifice of the ability to deconvolute strain and crystallite size and account for crystalline anisotropy.
The W-H approach balances simplicity with the need to deconvolute strain and crystallite size contributions. The modified W-H approach sacrifices timeliness and simplicity for strain anisotropy. The W-H approaches are less prone to error when peak overlap is significant but unfortunately, only a few peaks in the pattern are analyzed.
The W-A approach is better at separating the instrumental and microstructural components of peak broadening. It offers a full pattern refinement as opposed to selected peaks, providing the best resolution of strain anisotropy and crystallite size. It generally produces more accurate crystallite size distribution than the W-H approach and provides a length average size rather than a volume average size.
Experimentation is required to gain a better understanding of the absolute accuracy of each approach and the balance with respect to the accuracy needed for a given application or investigation. This will help ascertain the best situation to use the W-H approach as opposed to the more effort intensive W-A approach.
It is anticipated that chemical composition, crystallographic structure and microstructural variation (among other factors) will affect the quality of the plastic deformation analysis. Similar to XRD-based residual stress analysis, plastic deformation analysis will depend on the desired accuracy of the results and the methodology that will be used for calibration of the XRD equipment. This could mean laboratory experimentation for common CF materials (like HY80 or similar steel) when accuracy is critical. The accuracy is difficult to quantify but may mean that constants would have to be measured for each microstructure or alloy. This will require more extensive experimental research.
38 DRDC Atlantic TM 2012-102
6 Conclusions
The first two principal objectives of this study have been realized. The fundamental principles behind XRD and DRDC Atlantic’s portable miniature XRD have been explained. Analyses of how X-rays interact with the crystallographic structure of a material and techniques to optimize the quality of the diffraction data have been described. Simple empirical correlations between XRD peak broadening and yield stress have been shown (Section 4.3). Measuring the dependence of diffraction peak FWHM against true plastic strain (through cold work or tensile loading) can be used to create true stress-strain curves for a material. From these correlations, the yield strength of cold worked surface layers can be determined.
While a variety of approaches have been developed for quantitative XRD peak broadening analysis, the modified Williamson – Hall (W-H) and Warren – Averbach (W-A) approaches are more applicable. Both techniques consider the contributions from crystallite size and microdistortion (related to dislocation density) in addition to instrumental effects. The significant advantage of both ‘modified’ approaches is that they account for the effect of dislocations on diffraction peak broadening in terms of dislocation density, the length of the Burgers vector and strain anisotropy (using dislocation constants).
The equations have been examined and practical examples that compare results with TEM studies are presented. In comparison, the W-H approach is less prone to error when XRD peak overlap is significant but, unfortunately, only a few peaks in the pattern are analyzed. Meanwhile, the W-A approach does a better job at separating the instrumental and microstructural components of peak broadening. It offers a full pattern refinement as opposed to selected peaks. It generally produces more accurate crystallite size distribution than the W-H approach. The W-A approach also gives a length average size rather than a volume average size.
XRD peak profile analysis has been shown to be a useful tool to resolve the microstructure of polycrystalline materials. Approaches are not simple and require care to apply successfully and accurately. Further work is required to determine (i) when it is acceptable to use simple approaches (empirical correlation, classical W-H approach) and (ii) when, and why, more complicated approaches are warranted and the relative conditions for each usage.
Development of mXRD hardware and software and extensive laboratory experimentation are still required before peak broadening approaches may be applied successfully and the accuracy verified. It is still uncertain as to what level these extensive calculations may be performed with the mXRD software and what will require more sophisticate analysis. This analysis will fall under future work.
DRDC Atlantic TM 2012-102 39
7 Future Work
The mXRD is more sensitive for analysis of a limited number of high angle diffraction peaks and less suitable for full XRD pattern analysis. For portable, on site experiments, the more simplistic approaches that provide suitable plastic deformation estimates while minimizing processing time may be more appropriate. Future work will focus on development of the portable mXRD for measurement of dislocation density and examine potential future CF applications.
7.1 Development of Portable miniature XRD
The mXRD developer (Proto Manufacturing Inc.) was contracted (phase 1) to conduct an independent literature review and to examine the analytical methodology to enable the mXRD to quantify plastic deformation. The results of the literature review and derivation of the fundamental equations validate the use of the modified W-H and W-A approaches for XRD peak profile analysis. During the next phase of the contract, the contractor will be expected to adapt the mXRD system and conduct experiments to validate the use of mXRD peak broadening analysis to quantify plastic strain.
7.2 Experimentation
Before application of peak broadening approaches, extensive laboratory experimentation will be needed to determine empirical curves for select alloys subjected to specific processing approaches. Similar to residual stress analysis, this would be best achieved by extracting coupons from a similar engineered structure. Extensive testing would then be required to improve understanding of how dislocation density, crystallite size and XRD peak broadening change with increasing plastic deformation.
Similar to XRD-based residual stress analysis, plastic deformation analysis will likely require experimental calibration of the XRD equipment prior to measurement. This will most likely examine the effect of chemical composition, crystallographic structure and microstructural variation (among other factors) on the quality of the plastic deformation analysis.
7.3 Potential Applications
The portability and flexibility of the mXRD makes it useful for stress and dislocation density measurements on shaped structures/parts that will be returning to service. For example, the evaluation of parts prior to service will provide baseline/normal condition before failure.
As this project is supported under the “Materials in Support of Logistic Vehicle Modernization” (12st) program, there are a variety of applications that are relevant. Some potential applications include the following.
40 DRDC Atlantic TM 2012-102
Vehicle Restraints
During military operations it is often necessary to use restraint provisions to control vehicle motions during transport or, although rare, during external airlift situations. XRD has potential to detect residual elastic strain and plastic distortion in the strained provisions to ensure that hooks meet requirements. Evaluation of elastic and plastic strain during cyclic fatigue loads (to simulate in-service loadings) would help to preclude in-service failures or to maintain specifications during repair/replacement.
Armaments
Autofretting is a fabrication technique in which a structure is subjected to considerable forces that cause the internal surface layers to yield (plastically deform) and result in compressive residual stresses. For armaments, the process involves forcing an oversized mandril through a gun tube to expand the bore and introduce plastic deformation inside the tube. The compressive residual stresses act to increase resistance to stress corrosion cracking. Evaluation of elastic and plastic strain would provide insight into the fatigue life of armaments and likely prolong service life.
DRDC Atlantic TM 2012-102 41
References .....
[1] Cullity, B.D. (1978), Elements of X-Ray Diffraction, 2nd ed., Addison Wesley Publishing Co. Inc.
[2] Belassel, M. (2001), Residual stress analyzer: Theory of operation manual, Beta Version, in Proto Manufacturing Ltd. Instrument Manual, p. 120.
[3] Brauss, M.E.; Gorveatte, G.V. and Porter, J.F. (1996), Development of a miniature X-ray diffraction based stress analysis system suitable for use on marine structures”, in Proceedings of SPIE’s Non-destructive Evaluation of Materials and Composites (Scottsdale, Arizona), pp 307-317.
[4] Pineault, J.A.; Brauss, M.E. and Porter, J.F. (1993), Characterization of plastic strain in HY-80 using X-Ray diffraction techniques, in Proceedings of the Conference on Naval Applications of Material Technology (Halifax, Nova Scotia), Defence Research Establishment Atlantic.
[5] Farrell, S.P. and MacGregor, L.W. (2008), Residual stress analysis of Q1N submarine pressure hull steel with the portable miniature X-ray diffractometer (U), (DRDC Atlantic TM 2007-335) Defence R&D Canada – Atlantic.
[6] James, M.R. and Lu, J. (1996), Introduction, in Handbook of Measurement of Residual Stresses, Ed. By J. Lu, Society for Experimental Mechanics, The Fairmont Press, Lilburn, GA, pp. 1-4.
[7] Jeong, J.S. ; Koo, Y.M.; Jeong, I.K.; Kim, S.K. and Kwon, S.K. (2011) Micro-structural study of high-Mn TWIP steels using diffraction profile analysis, in Materials Science & Engineering A, 530, pp. 128-134.
[8] Prevéy, P.S. (1986), X-Ray Diffraction Residual Stress Techniques, in Metals Handbook 10, Metals Park: American Society for Metals, pp. 380-392.
[9] Nobre, J.P., Dias, A.M. and Kornmeier, M. (2004), An Empirical Methodology to Estimate a Local Yield Stress in Work-Hardened Surface Layers, in Exp. Mech., 44, pp. 76-84.
[10] Hornbach, D.J. and Prevéy, P.S. (1997), Tensile Residual Stress Fields Produced in Austenitic Alloy Weldments, in proc. Energy Week Conf, 6 pages.
[11] Turski, M., Pratihar, S., Edwards, L., Daymond, M. R. and Fitzpatrick, M.E. (2006), The effect of plastic anisotropy on the residual stress within a 316L, stainless steel bead-on-plate specimen, in Materials Science Forum, 524-525, pp. 679-684.
[12] Klug, H.P. and Alexander, L.E. (1974), X-ray Diffraction Procedures for Polycrystalline and Amorphous Materials. New York: Wiley.
42 DRDC Atlantic TM 2012-102
[13] Crosa, M., Boero, V. and Franchini-Angela, M. (1999), Determination of Mean Crystallite Dimensions from X-Ray Diffraction Peak Profiles: A Comparative Analysis of Synthetic Hematites, in Clays and Clay Minerals, 47(6), pp. 742-747.
[14] Guinebretiere, R. (2010), X-Ray Diffraction by Polycrystalline Materials, ISTE Publishing Company, John Wiley & Sons.
[15] Boumaiza, A., Ji, V. And Rouag, N. (2009), The Nondestructive Estimation of Mechanical Properties of a Carbon Steel by X-ray Diffraction Peak Broadening, J. Testing and Eval., 37, pp. 343-346.
[16] Scherrer, P. (1918), Bestimmung der Grösse und der inneren Struktur von Kolloidteilchen mittels Röntgenstrahlen, Nachr. Ges. Wiss. Göttingen, 26, pp 98-100.
[17] Mitchell, S. and Pérez-Ramírez, J. (2013), X-ray Diffraction, Rietveld method, http://cc.usst.edu.cn/Download/26da9cdf-6134-41fc-bf56-6dcccd9edd20.pdf (May 2013).
[18] Langford, J.I. and Wilson, A.J.C. (1978), Scherrer after sixty years: A survey and some new results in the determination of crystallite size, J. Appl. Cryst. 11, pp. 102-113.
[19] Williamson, G.K., and Hall, W.H., (1953), X-ray line broadening from filed aluminium and wolfram, in Acta Met., 1, pp. 22-31.
[20] Hall, E.O. (1951), The deformation and ageing of mild steel III. Discussion of results, in Proc. Phys. Soc. Sect. B, 64, pp. 747-753.
[21] Petch, N.J. (1953), Cleavage strength of polycrystals, in J. Iron Steel Inst., 174(1), pp. 25-28.
[22] Stokes, A.R. and Wilson, A.J.C. (1944), A method of calculating the integral breaths of Debye-Scherrer lines: generalization to non-cubic crystals, in Proc. Camb. Phil. Soc., 40, pp. 197-198.
[23] A.R. Stokes, (1948), A numerical Fourier Analysis method for the correction of widths and shapes of lines on X-ray powder photographs, in Proceedings Phys. Soc. London, 61, pp. 382-391
[24] Williamson, G.K. and Smallman, R.E. (1955), Dislocation densities in some annealed and cold-worked metals from measurements on the X-ray Debye-Scherrer Spectrum, in Phil. Mag., 1, pp. 34-46.
[25] Klimanek, P. (1993), X-ray diffraction analysis of substructures in plastically deformed BCC materials, Colloque C7, in supplement au Journal de Physique III, 3, pp.2149-54.
[26] Bertaut, E.F.C. (1949), Étude aux rayons X de la répartition des dimensions des cristallites dans une poudre crystalline, in CR Acad. Sci. Paris, 228, pp. 492-494.
[27] Warren, B.E. and Averbach, B.L. (1950), The effect of cold-work distortion on X-ray patterns, in J. Appl. Phys., 21, pp. 595-599.
DRDC Atlantic TM 2012-102 43
[28] Hall, W.H. (1949), X-Ray Broadening in Metals, in Proc. Phys. Soc. A, 62, pp. 741–743.
[29] Movaghar Garabagh, M.R., Hossein Nedjad, S., Shirazi, H., Iranpour Mobarekeh, M. and Nili Ahmadabadi, M. (2008), X-ray diffraction peak profile analysis aiming at better understanding of the deformation process and deformed structure of a martensitic steel, in Thin Solid Films, 516, pp. 8117-24.
[30] Wilkens, M. (1970), The Determination of Density and Distribution of Dislocations in Deformed Single Crystals from Broadened X-Ray Diffraction Profiles, in Phys. Status Solidi A, 104, pp. K1–K6.
[31] Rietveld, H.M. (1967), Line profiles of neutron powder diffraction peaks for structure refinement, in Acta Cryst., 22, pp. 151-152.
[32] Young, R.A. (1993), The Rietveld method, in IUCr monographs on crystallography, no. 5, Oxford University Press, New York.
[33] Shen, T.D., Schwarz, R.B. and Thompson, J.D. (2005) Soft Magnetism in Mechanically Alloyed Nanocrystalline Materials, in Phys. Rev B, 72, pp. 014431-1 – 0144311-8.
[34] Ungár, T. and Borgély, A. (1996), The Effect of Dislocation Contrast on X-Ray Line Broadening: A New Approach to Line Profile Analysis, in Appl. Phys. Lett., 69, pp. 3173-3175.
[35] Ungár, T. (1997), Strain Broadening Caused by Dislocations, in Adv. X-ray Anal., proc. Denver X-ray Conference, 40.
[36] Ungár, T., Victoria, M., Marmy, P., Hanárk, P. and Szenes, G. (2000), A New Procedure of X-Ray Line Profile Analysis Applied to Study the dislocation Structure and Subgrain Size-Distributions in Fatigued MANET Steel, in J. Nucl. Mat., 276, pp. 278-282.
[37] Kunieda, T., Nakai, M., Murata, Y., Koyama, T., and Morinaga, M. (2005), Estimation of the System Free Energy of Martensite Phase in an Fe-Cr-C Ternary Alloy, in ISIJ Intern., 45, pg. 1909-1914.
[38] Ungár, T., Dragomir, I., Révész, Á. and Borgély, A. (1999), The Contrast Factors of Dislocations in Cubic Crystals: The Dislocation Model of Strain Aniostropy in Practice, in J. Appl. Cryst., 32, pp. 992-1002.
[39] Balzar, D. (1999), Voigt-Function Model in Diffraction Line-Broadening Analysis, in Defect and Microstructure Analysis from Diffraction, ed by R.L. Snyder, H.J. Bunge, and J. Fiala, International Union of Crystallography Monographs on Crystallography, 10 (Oxford University Press, New York, 1999) pp. 94-126.
[40] Cong, Z. and Murata, Y. (2011), Dislocation Density of Lath Martensite in 10Cr-5W Heat-Resistant Steels, in Mat. Trans., 52, pp. 2151-2154
[41] Nain, P.K., and Vasudevan, R. (1995), Residual Stresses of Type-II and Type-III and Their Estimation, in Proc. Eng. Sci., 20, pp. 39-52
44 DRDC Atlantic TM 2012-102
[42] Ungár, T., Ott, S., Sanders, P.G., Borbély, A. and Weertman, J.R. (1998), Dislocations, Grain Size and Planar Faults in Nanostructured Copper Determined by High Resolution X-Ray Diffraction and a New Procedure for Peak Profile Analysis, in Acta Mater., 46, pp. 3693–3699.
[43] Ungár, T., Martinetto, P., Ribárik, G., Dooryhée, E., Walter, Ph. and Anne, M.J. (2002), Revealing the Powdering Methods of Black Makeup in Ancient Egypt by Fitting Microstructure Based Fourier Coefficients to the Whole X-Ray Diffraction Profiles of Galena, in Appl. Phys., 91, pp. 2455–2465.
[44] Pešička, J., Kužel, R., Dronhofer, A. and Eggeler, G. (2003), The Evolution of Dislocation Density During Heat Treatment and Creep of Tempered Martensitic Ferritic Steels, in Acta Mat., 51, pp. 4847-4862.
[45] Ortiz, A.L. and Shaw, L. (2004), X-Ray Diffraction of a Severely Plastically Deformed Aluminum Alloy, in Acta Mat., 52, pp. 2185-2197.
[46] Kužel, R., Matĕj, Z., Cherkaska, V., Pešička, J., Čıžek, J., Procházka, I. and Islamgaliev, R.K., (2004), Structural Investigations of Submicrocrystalline Metals Obtained by High-Pressure Torsion Deformation, in J. Alloys Compd. 378, pp. 242–247.
[47] Takebayashi, S., Kuneida, T., Yoshinaga, N., Ushioda, K. And Ogata, S. (2010), Comparison of the Dislocation Density in Martensitic Steels Evaluated by Some X-Ray Diffraction Methods, in ISIJ Intern., 50, pp. 875-882.
[48] Gray, H., Wagner, L. and Lutjering, G. (1987), Influence of Shot Peening Induced Surface Roughness, Residual Macrostresses and Dislocation Density on the Elevated Temperature HCF-Properties of Ti Alloys, in Proc. 3rd Int. Conf. on Shot Peening (ICSP3), H. Wohlfahrt, R. Kopp, and O. Vöhringer, Editors, pp. 447-457.
[49] Holzapfel, H., Schulze, V., Vöhringer, O. and Macherauch, E. (1996) Stability and Relaxation Behaviour of Shot Peening Induced Residual Stresses in AISI 4140 During Bending Fatigue, in Proc. 6th Int. Conf. on Shot Peening (ICSP6), J. Champaigne, Editor, pp. 413-423.
[50] McGregor, R., Farrell, S., Thompson, I., Porter, J. and McLaughlin, S. (2010) Characterization of Dutch Breech Pressure-Hull Area of HMCS Chicoutimi (U), (DRDC Atlantic 2010-177) Defence R&D Canada – Atlantic.
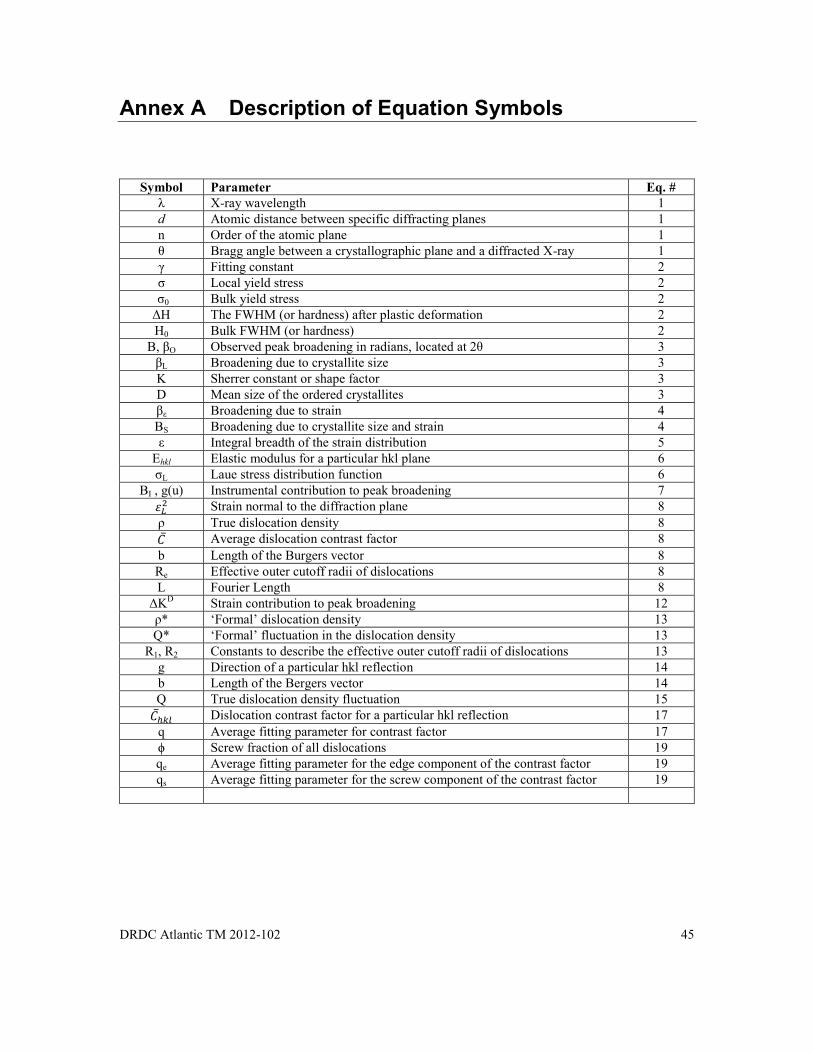
DRDC Atlantic TM 2012-102 45
Annex A Description of Equation Symbols
Symbol Parameter Eq. # λ X-ray wavelength 1 d Atomic distance between specific diffracting planes 1 n Order of the atomic plane 1 θ Bragg angle between a crystallographic plane and a diffracted X-ray 1 γ Fitting constant 2 σ Local yield stress 2
σ0 Bulk yield stress 2 ΔH The FWHM (or hardness) after plastic deformation 2 H0 Bulk FWHM (or hardness) 2 Β, βO Observed peak broadening in radians, located at 2θ 3 βL Broadening due to crystallite size 3 K Sherrer constant or shape factor 3 D Mean size of the ordered crystallites 3 βε Broadening due to strain 4 ΒS Broadening due to crystallite size and strain 4 ε Integral breadth of the strain distribution 5
Ehkl Elastic modulus for a particular hkl plane 6 σL Laue stress distribution function 6
ΒI , g(u) Instrumental contribution to peak broadening 7 Strain normal to the diffraction plane 8
ρ True dislocation density 8 Average dislocation contrast factor 8
b Length of the Burgers vector 8 Re Effective outer cutoff radii of dislocations 8 L Fourier Length 8
ΔKD Strain contribution to peak broadening 12 ρ* ‘Formal’ dislocation density 13 Q* ‘Formal’ fluctuation in the dislocation density 13
R1, R2 Constants to describe the effective outer cutoff radii of dislocations 13 g Direction of a particular hkl reflection 14 b Length of the Bergers vector 14 Q True dislocation density fluctuation 15
Dislocation contrast factor for a particular hkl reflection 17 q Average fitting parameter for contrast factor 17 ϕ Screw fraction of all dislocations 19 qe Average fitting parameter for the edge component of the contrast factor 19 qs Average fitting parameter for the screw component of the contrast factor 19

46 DRDC Atlantic TM 2012-102
This page intentionally left blank.
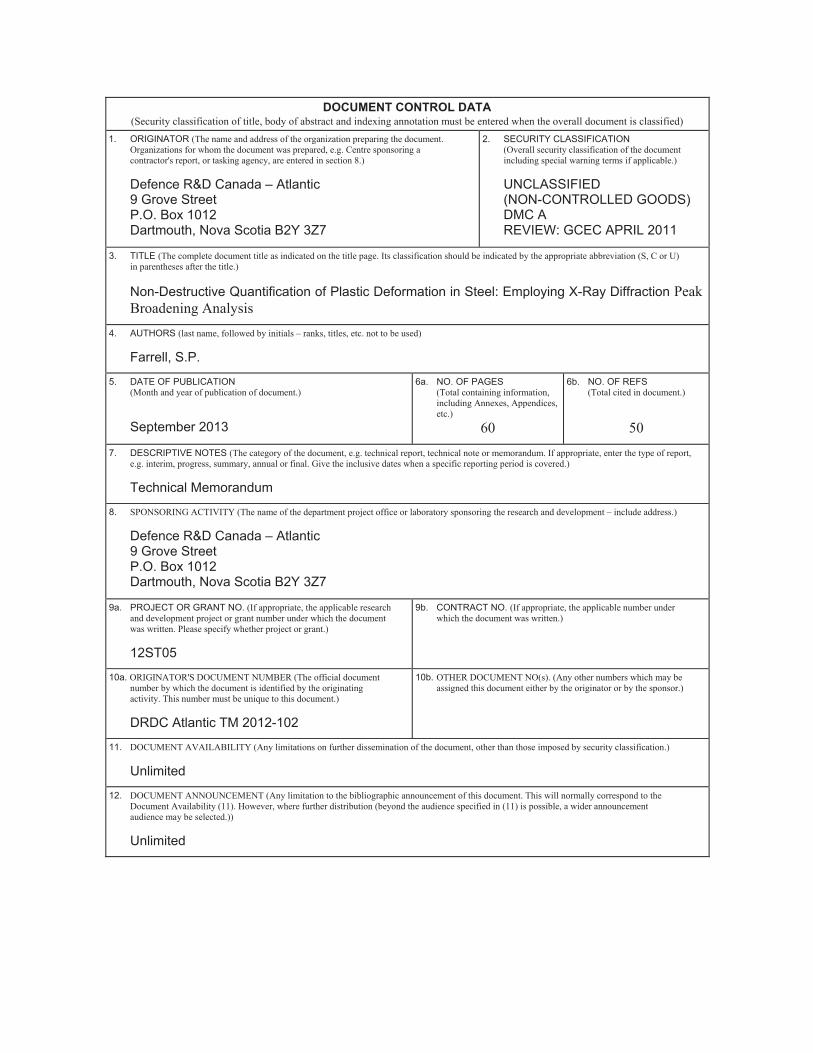
DOCUMENT CONTROL DATA (Security classification of title, body of abstract and indexing annotation must be entered when the overall document is classified)
1. ORIGINATOR (The name and address of the organization preparing the document. Organizations for whom the document was prepared, e.g. Centre sponsoring a contractor's report, or tasking agency, are entered in section 8.) Defence R&D Canada – Atlantic 9 Grove Street P.O. Box 1012 Dartmouth, Nova Scotia B2Y 3Z7
2. SECURITY CLASSIFICATION (Overall security classification of the document including special warning terms if applicable.)
UNCLASSIFIED (NON-CONTROLLED GOODS) DMC A REVIEW: GCEC APRIL 2011
3. TITLE (The complete document title as indicated on the title page. Its classification should be indicated by the appropriate abbreviation (S, C or U) in parentheses after the title.)
Non-Destructive Quantification of Plastic Deformation in Steel: Employing X-Ray Diffraction Peak Broadening Analysis
4. AUTHORS (last name, followed by initials – ranks, titles, etc. not to be used) Farrell, S.P.
5. DATE OF PUBLICATION (Month and year of publication of document.) September 2013
6a. NO. OF PAGES (Total containing information, including Annexes, Appendices, etc.)
60
6b. NO. OF REFS (Total cited in document.)
50 7. DESCRIPTIVE NOTES (The category of the document, e.g. technical report, technical note or memorandum. If appropriate, enter the type of report,
e.g. interim, progress, summary, annual or final. Give the inclusive dates when a specific reporting period is covered.) Technical Memorandum
8. SPONSORING ACTIVITY (The name of the department project office or laboratory sponsoring the research and development – include address.) Defence R&D Canada – Atlantic 9 Grove Street P.O. Box 1012 Dartmouth, Nova Scotia B2Y 3Z7
9a. PROJECT OR GRANT NO. (If appropriate, the applicable research and development project or grant number under which the document was written. Please specify whether project or grant.)
12ST05
9b. CONTRACT NO. (If appropriate, the applicable number under which the document was written.)
10a. ORIGINATOR'S DOCUMENT NUMBER (The official document number by which the document is identified by the originating activity. This number must be unique to this document.) DRDC Atlantic TM 2012-102
10b. OTHER DOCUMENT NO(s). (Any other numbers which may be assigned this document either by the originator or by the sponsor.)
11. DOCUMENT AVAILABILITY (Any limitations on further dissemination of the document, other than those imposed by security classification.)
Unlimited
12. DOCUMENT ANNOUNCEMENT (Any limitation to the bibliographic announcement of this document. This will normally correspond to the Document Availability (11). However, where further distribution (beyond the audience specified in (11) is possible, a wider announcement audience may be selected.)) Unlimited
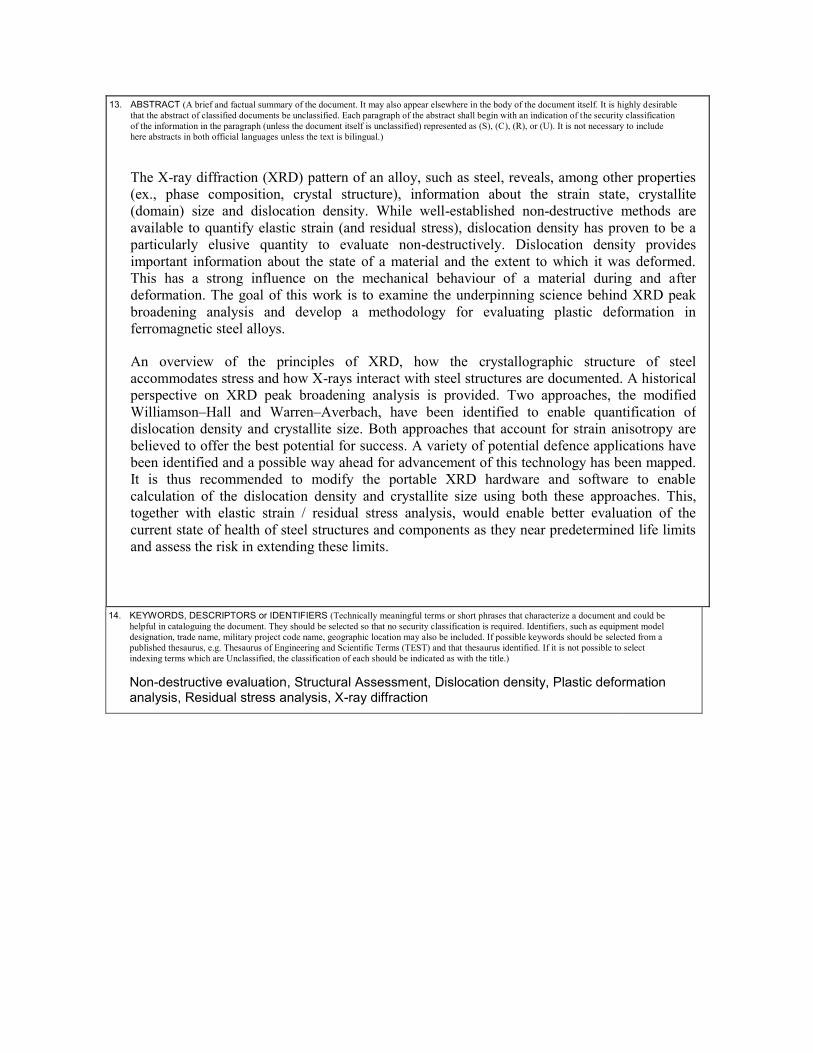
13. ABSTRACT (A brief and factual summary of the document. It may also appear elsewhere in the body of the document itself. It is highly desirable that the abstract of classified documents be unclassified. Each paragraph of the abstract shall begin with an indication of the security classification of the information in the paragraph (unless the document itself is unclassified) represented as (S), (C), (R), or (U). It is not necessary to include here abstracts in both official languages unless the text is bilingual.)
The X-ray diffraction (XRD) pattern of an alloy, such as steel, reveals, among other properties (ex., phase composition, crystal structure), information about the strain state, crystallite (domain) size and dislocation density. While well-established non-destructive methods are available to quantify elastic strain (and residual stress), dislocation density has proven to be a particularly elusive quantity to evaluate non-destructively. Dislocation density provides important information about the state of a material and the extent to which it was deformed. This has a strong influence on the mechanical behaviour of a material during and afterdeformation. The goal of this work is to examine the underpinning science behind XRD peak broadening analysis and develop a methodology for evaluating plastic deformation in ferromagnetic steel alloys.
An overview of the principles of XRD, how the crystallographic structure of steel accommodates stress and how X-rays interact with steel structures are documented. A historicalperspective on XRD peak broadening analysis is provided. Two approaches, the modified Williamson–Hall and Warren–Averbach, have been identified to enable quantification of dislocation density and crystallite size. Both approaches that account for strain anisotropy are believed to offer the best potential for success. A variety of potential defence applications have been identified and a possible way ahead for advancement of this technology has been mapped.It is thus recommended to modify the portable XRD hardware and software to enable calculation of the dislocation density and crystallite size using both these approaches. This,together with elastic strain / residual stress analysis, would enable better evaluation of the current state of health of steel structures and components as they near predetermined life limits and assess the risk in extending these limits.
14. KEYWORDS, DESCRIPTORS or IDENTIFIERS (Technically meaningful terms or short phrases that characterize a document and could be helpful in cataloguing the document. They should be selected so that no security classification is required. Identifiers, such as equipment model designation, trade name, military project code name, geographic location may also be included. If possible keywords should be selected from a published thesaurus, e.g. Thesaurus of Engineering and Scientific Terms (TEST) and that thesaurus identified. If it is not possible to select indexing terms which are Unclassified, the classification of each should be indicated as with the title.) Non-destructive evaluation, Structural Assessment, Dislocation density, Plastic deformation analysis, Residual stress analysis, X-ray diffraction

This page intentionally left blank.