Embed Size (px)
Citation preview
7/27/2019 PELTON & FRANCIS TURBINES
http://slidepdf.com/reader/full/pelton-francis-turbines 1/37
FACULTY OF CIVIL AND ENVIRONMENTAL
ENGINEERING
DEPARTMENT OF WATER & ENVIROMENTAL ENGINEERING
WATER ENGINEERING LABORATORY
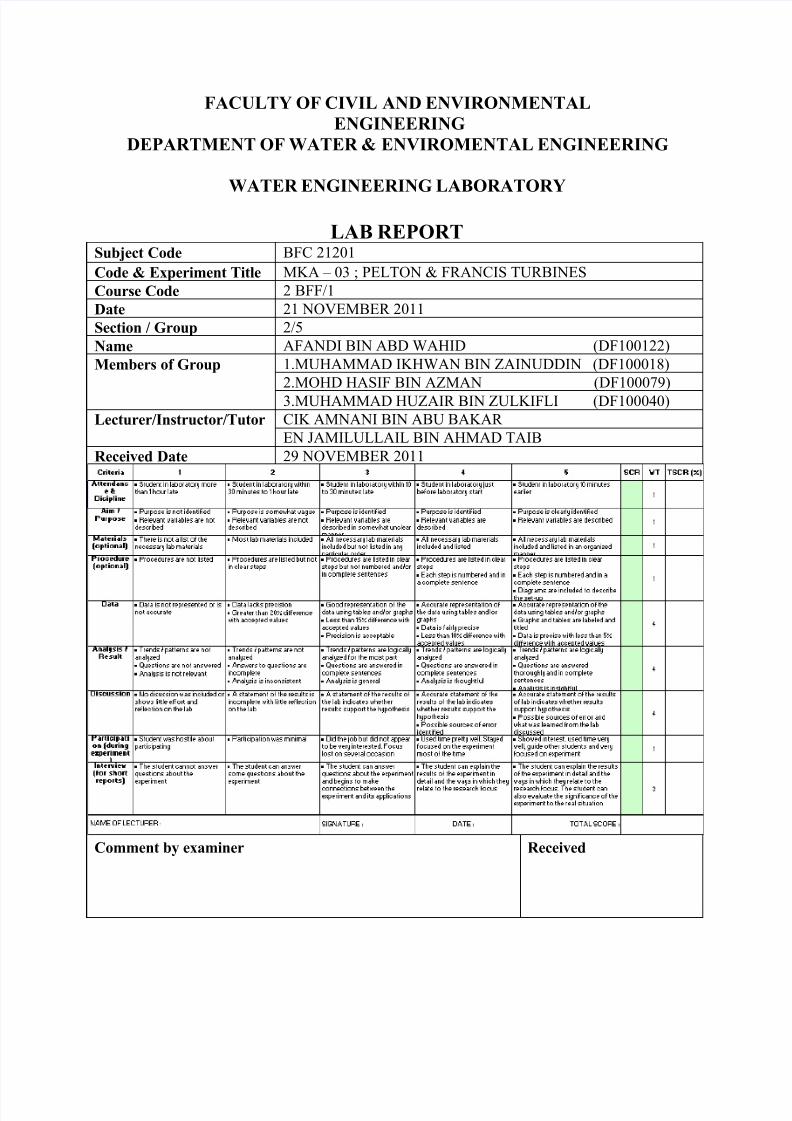
LAB REPORTSubject Code BFC 21201
Code & Experiment Title MKA – 03 ; PELTON & FRANCIS TURBINES
Course Code 2 BFF/1
Date 21 NOVEMBER 2011
Section / Group 2/5
Name AFANDI BIN ABD WAHID (DF100122)
Members of Group 1.MUHAMMAD IKHWAN BIN ZAINUDDIN (DF100018)
2.MOHD HASIF BIN AZMAN (DF100079)
3.MUHAMMAD HUZAIR BIN ZULKIFLI (DF100040)
Lecturer/Instructor/Tutor CIK AMNANI BIN ABU BAKAR
EN JAMILULLAIL BIN AHMAD TAIB
Received Date 29 NOVEMBER 2011
Comment by examiner Received

7/27/2019 PELTON & FRANCIS TURBINES
http://slidepdf.com/reader/full/pelton-francis-turbines 2/37
STUDENTS’ ETHICAL CODE
(SEC)
DEPARTMENT OF WATER & ENVIRONMENTAL
ENGINEERINGFACULTY OF CIVIL & ENVIRONMENTAL
ENGINEERING
UNIVERSITI TUN HUSSEIN ONN MALAYSIA
BATU PAHAT, JOHOR
“I declare that I have prepared this report with my own efforts. I also
declare not receive or give any assistance in preparing this report and
make this affirmation in the belief that nothing is in, it is true”
……………………………………….
(STUDENT SIGNATURE)
NAME : AFANDI BIN ABD WAHID
MATRIC NO. : DF100122
DATE : 29 NOVEMBER 2011

7/27/2019 PELTON & FRANCIS TURBINES
http://slidepdf.com/reader/full/pelton-francis-turbines 3/37
STUDENTS’ ETHICAL CODE
(SEC)
DEPARTMENT OF WATER & ENVIRONMENTAL
ENGINEERING
FACULTY OF CIVIL & ENVIRONMENTAL
ENGINEERING
UNIVERSITI TUN HUSSEIN ONN MALAYSIA
BATU PAHAT, JOHOR
“I declare that I have prepared this report with my own efforts. I also
declare not receive or give any assistance in preparing this report and
make this affirmation in the belief that nothing is in, it is true”
………………………………………. (STUDENT SIGNATURE)
NAME : MUHAMMAD IKHWAN BIN ZAINUDDIN
MATRIC NO. : DF100018
DATE : 29 NOVEMBER 2011

7/27/2019 PELTON & FRANCIS TURBINES
http://slidepdf.com/reader/full/pelton-francis-turbines 4/37
STUDENTS’ ETHICAL CODE
(SEC)
DEPARTMENT OF WATER & ENVIRONMENTAL
ENGINEERING
FACULTY OF CIVIL & ENVIRONMENTAL
ENGINEERING
UNIVERSITI TUN HUSSEIN ONN MALAYSIA
BATU PAHAT, JOHOR
“I declare that I have prepared this report with my own efforts. I also
declare not receive or give any assistance in preparing this report and
make this affirmation in the belief that nothing is in, it is true”
………………………………………. (STUDENT SIGNATURE)
NAME : MOHD HASIF BIN AZMAN
MATRIC NO. : DF100079
DATE : 29 NOVEMBER 2011

7/27/2019 PELTON & FRANCIS TURBINES
http://slidepdf.com/reader/full/pelton-francis-turbines 5/37
STUDENTS’ ETHICAL CODE
(SEC)
DEPARTMENT OF WATER & ENVIRONMENTAL
ENGINEERING
FACULTY OF CIVIL & ENVIRONMENTAL
ENGINEERING
UNIVERSITI TUN HUSSEIN ONN MALAYSIA
BATU PAHAT, JOHOR
“I declare that I have prepared this report with my own efforts. I also
declare not receive or give any assistance in preparing this report and
make this affirmation in the belief that nothing is in, it is true”
……………………………………. (STUDENT SIGNATURE)
NAME : MUHAMMAD HUZAIR BIN ZULKIFLI
MATRIC NO. : DF100040
DATE : 29 NOVEMBER 2011
7/27/2019 PELTON & FRANCIS TURBINES
http://slidepdf.com/reader/full/pelton-francis-turbines 6/37
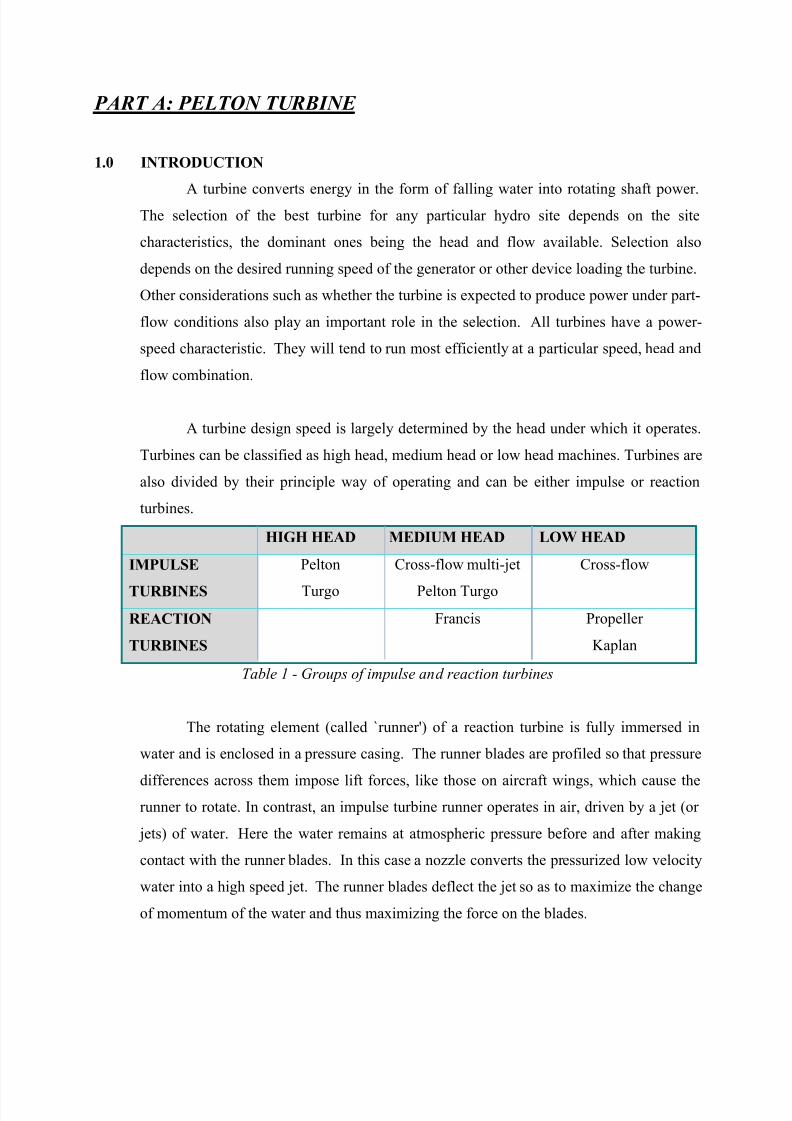
PART A: PELTON TURBINE
1.0 INTRODUCTION
A turbine converts energy in the form of falling water into rotating shaft power.The selection of the best turbine for any particular hydro site depends on the site
characteristics, the dominant ones being the head and flow available. Selection also
depends on the desired running speed of the generator or other device loading the turbine.
Other considerations such as whether the turbine is expected to produce power under part-
flow conditions also play an important role in the selection. All turbines have a power-
speed characteristic. They will tend to run most efficiently at a particular speed, head and
flow combination.
A turbine design speed is largely determined by the head under which it operates.
Turbines can be classified as high head, medium head or low head machines. Turbines are
also divided by their principle way of operating and can be either impulse or reaction
turbines.
HIGH HEAD MEDIUM HEAD LOW HEAD
IMPULSE
TURBINES
Pelton
Turgo
Cross-flow multi-jet
Pelton Turgo
Cross-flow
REACTION
TURBINES
Francis Propeller
Kaplan
Table 1 - Groups of impulse and reaction turbines
The rotating element (called `runner') of a reaction turbine is fully immersed in
water and is enclosed in a pressure casing. The runner blades are profiled so that pressure
differences across them impose lift forces, like those on aircraft wings, which cause therunner to rotate. In contrast, an impulse turbine runner operates in air, driven by a jet (or
jets) of water. Here the water remains at atmospheric pressure before and after making
contact with the runner blades. In this case a nozzle converts the pressurized low velocity
water into a high speed jet. The runner blades deflect the jet so as to maximize the change
of momentum of the water and thus maximizing the force on the blades.
7/27/2019 PELTON & FRANCIS TURBINES
http://slidepdf.com/reader/full/pelton-francis-turbines 7/37
Impulse turbines are usually cheaper than reaction turbines because there is no
need for a specialist pressure casing, or for carefully engineered clearances.
However, they are only suitable for relatively high heads.
2.0 OBJECTIVE
Determine the characteristics of Pelton Turbine operation by using several speed.
3.0 LEARNING OUTCOMES
At the end of the course, students should be able to apply the knowledge and skill they
have learned to:
i. Understand the basic operating system of the Pelton turbine.
ii. Understand the factors which influence the efficiency of turbine
4.0 THEORY
A Pelton Turbine characteristic operation curve can be derived by using the same
method as a pump. It is because the velocity is usually assumed as an independent
parameter when the plotting of power, efficiency, torque and discharge are carried out.
Mechanical Power, P m (watt) = Rotation ( , Nm) Circular velocity ( , rad/sec).
Where, T =Force( N ) Radius(m)( Nm) and minsec/60
min/2 radius (rad/s) where, 1 revolution
is equal to 2 radius. Meanwhile, Water Power, gHQ P w where, is water density
(100kg/m3), g is gravity constant (9.81m/s
2), H is head at inlet point (m) and Q is
flowrate (m3 /s). Wheel efficiency, 100%
w
m
P
P . To convert the unit of ‘rpm’ to
‘radians per minute’ is given by, x rpm=( x revolution/min)=( x x2 radian)/min.
7/27/2019 PELTON & FRANCIS TURBINES
http://slidepdf.com/reader/full/pelton-francis-turbines 8/37
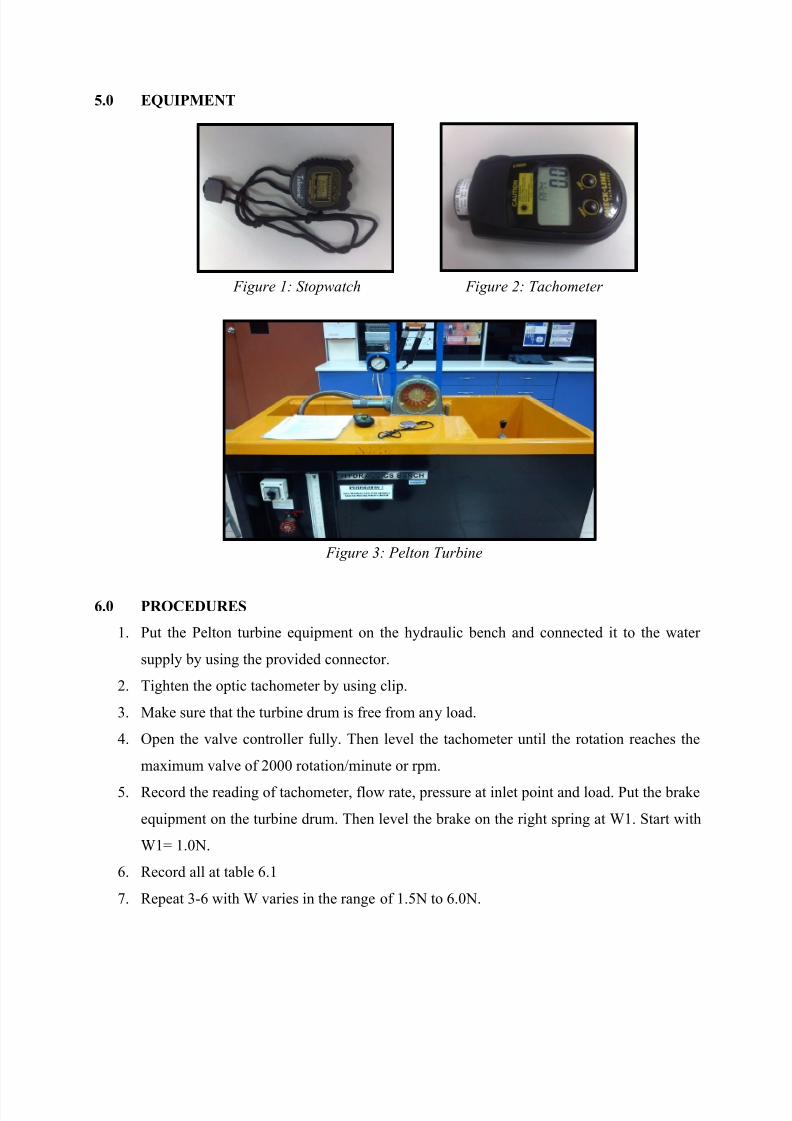
5.0 EQUIPMENT
Figure 1: Stopwatch Figure 2: Tachometer
Figure 3: Pelton Turbine
6.0 PROCEDURES
1. Put the Pelton turbine equipment on the hydraulic bench and connected it to the water
supply by using the provided connector.
2. Tighten the optic tachometer by using clip.
3. Make sure that the turbine drum is free from any load.
4. Open the valve controller fully. Then level the tachometer until the rotation reaches the
maximum valve of 2000 rotation/minute or rpm.
5. Record the reading of tachometer, flow rate, pressure at inlet point and load. Put the brake
equipment on the turbine drum. Then level the brake on the right spring at W1. Start with
W1= 1.0N.
6. Record all at table 6.1
7. Repeat 3-6 with W varies in the range of 1.5N to 6.0N.
7/27/2019 PELTON & FRANCIS TURBINES
http://slidepdf.com/reader/full/pelton-francis-turbines 9/37
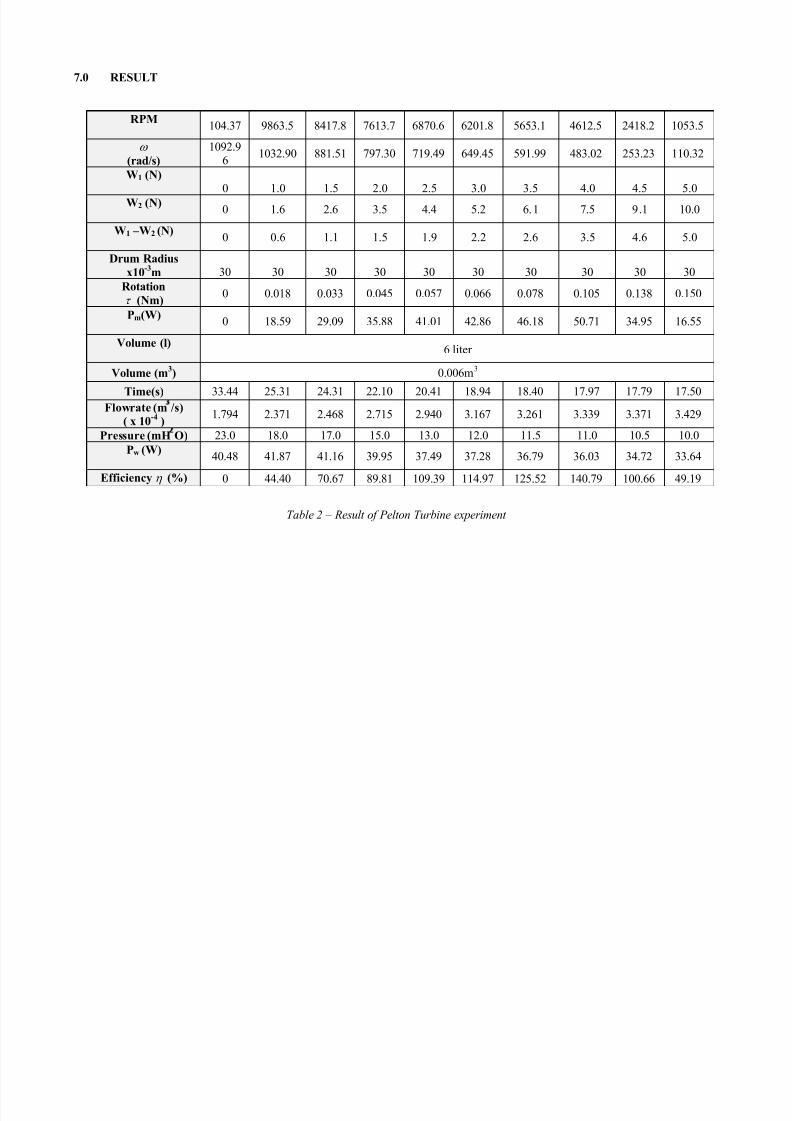
7.0 RESULT
RPM104.37 9863.5 8417.8 7613.7 6870.6 6201.8 5653.1 4612.5 2418.2 1053.5
(rad/s)
1092.96
1032.90 881.51 797.30 719.49 649.45 591.99 483.02 253.23 110.32
W1 (N)0 1.0 1.5 2.0 2.5 3.0 3.5 4.0 4.5 5.0
W2 (N)0 1.6 2.6 3.5 4.4 5.2 6.1 7.5 9.1 10.0
W1 – W2 (N)0 0.6 1.1 1.5 1.9 2.2 2.6 3.5 4.6 5.0
Drum Radius
x10-3
m 30 30 30 30 30 30 30 30 30 30
Rotation
(Nm)0 0.018 0.033 0.045 0.057 0.066 0.078 0.105 0.138 0.150
Pm(W)0 18.59 29.09 35.88 41.01 42.86 46.18 50.71 34.95 16.55
Volume (l)6 liter
Volume (m3) 0.006m
3
Time(s) 33.44 25.31 24.31 22.10 20.41 18.94 18.40 17.97 17.79 17.50Flowrate (m /s)
( x 10-4
)1.794 2.371 2.468 2.715 2.940 3.167 3.261 3.339 3.371 3.429
Pressure (mH O) 23.0 18.0 17.0 15.0 13.0 12.0 11.5 11.0 10.5 10.0
Pw (W)40.48 41.87 41.16 39.95 37.49 37.28 36.79 36.03 34.72 33.64
Efficiency (%) 0 44.40 70.67 89.81 109.39 114.97 125.52 140.79 100.66 49.19
Table 2 – Result of Pelton Turbine experiment
7/27/2019 PELTON & FRANCIS TURBINES
http://slidepdf.com/reader/full/pelton-francis-turbines 10/37
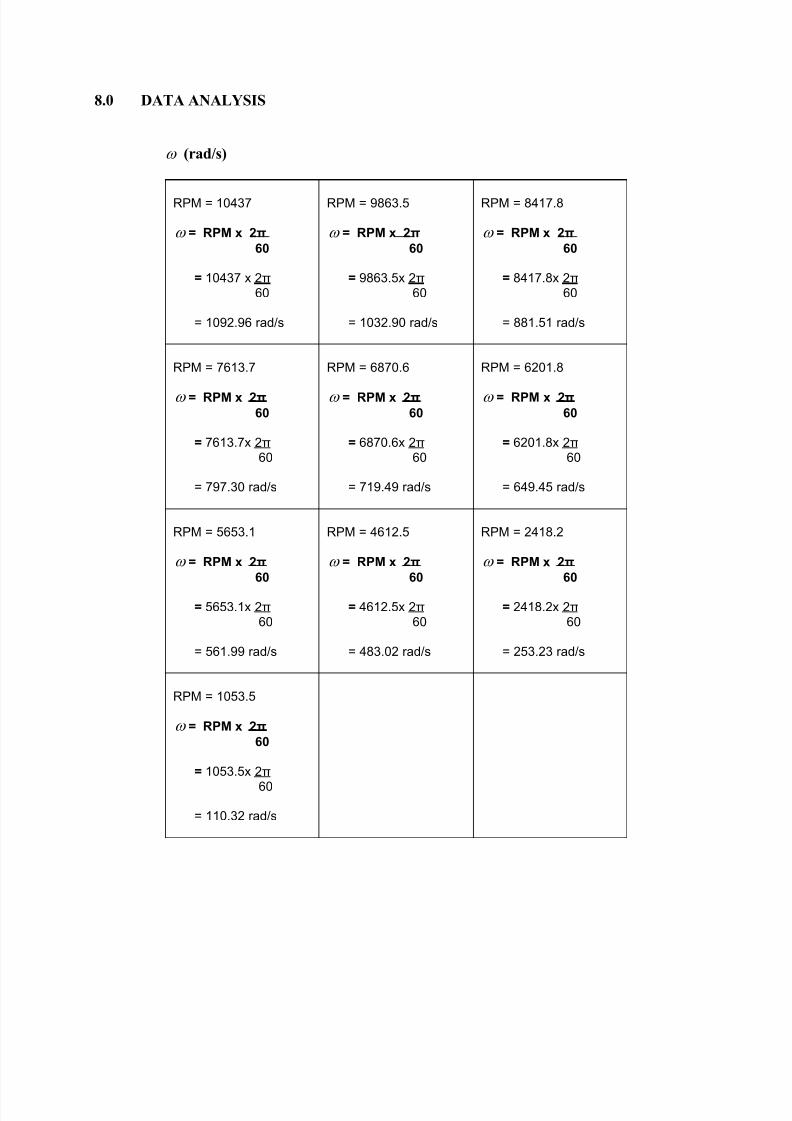
8.0 DATA ANALYSIS
(rad/s)
RPM = 10437
= RPM x 2π
60
= 10437 x 2π 60
= 1092.96 rad/s
RPM = 9863.5
= RPM x 2π
60
= 9863.5x 2π 60
= 1032.90 rad/s
RPM = 8417.8
= RPM x 2π
60
= 8417.8x 2π 60
= 881.51 rad/s
RPM = 7613.7
= RPM x 2π
60
= 7613.7x 2π 60
= 797.30 rad/s
RPM = 6870.6
= RPM x 2π
60
= 6870.6x 2π 60
= 719.49 rad/s
RPM = 6201.8
= RPM x 2π
60
= 6201.8x 2π 60
= 649.45 rad/s
RPM = 5653.1
= RPM x 2π
60
= 5653.1x 2π 60
= 561.99 rad/s
RPM = 4612.5
= RPM x 2π
60
= 4612.5x 2π 60
= 483.02 rad/s
RPM = 2418.2
= RPM x 2π
60
= 2418.2x 2π 60
= 253.23 rad/s
RPM = 1053.5
= RPM x 2π
60
= 1053.5x 2π
60
= 110.32 rad/s
7/27/2019 PELTON & FRANCIS TURBINES
http://slidepdf.com/reader/full/pelton-francis-turbines 11/37
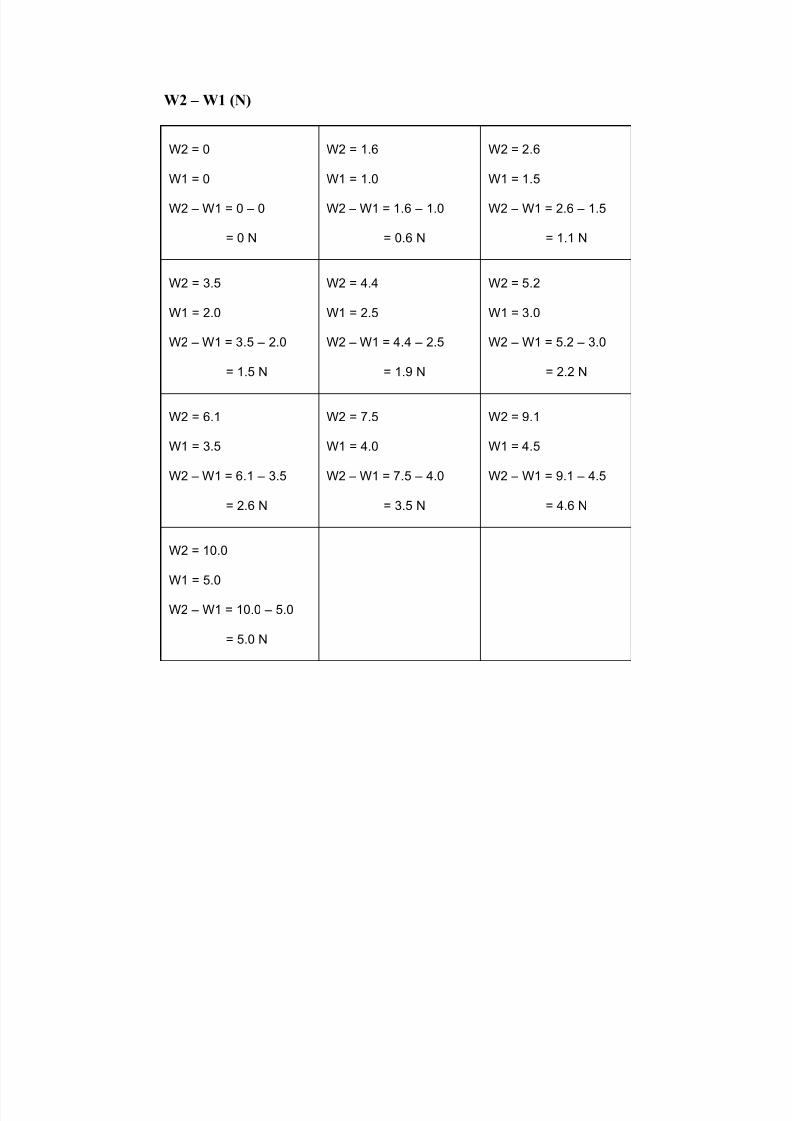
W2 – W1 (N)
W2 = 0
W1 = 0
W2 – W1 = 0 – 0
= 0 N
W2 = 1.6
W1 = 1.0
W2 – W1 = 1.6 – 1.0
= 0.6 N
W2 = 2.6
W1 = 1.5
W2 – W1 = 2.6 – 1.5
= 1.1 N
W2 = 3.5
W1 = 2.0
W2 – W1 = 3.5 – 2.0
= 1.5 N
W2 = 4.4
W1 = 2.5
W2 – W1 = 4.4 – 2.5
= 1.9 N
W2 = 5.2
W1 = 3.0
W2 – W1 = 5.2 – 3.0
= 2.2 N
W2 = 6.1
W1 = 3.5
W2 – W1 = 6.1 – 3.5
= 2.6 N
W2 = 7.5
W1 = 4.0
W2 – W1 = 7.5 – 4.0
= 3.5 N
W2 = 9.1
W1 = 4.5
W2 – W1 = 9.1 – 4.5
= 4.6 N
W2 = 10.0
W1 = 5.0
W2 – W1 = 10.0 – 5.0
= 5.0 N
7/27/2019 PELTON & FRANCIS TURBINES
http://slidepdf.com/reader/full/pelton-francis-turbines 12/37
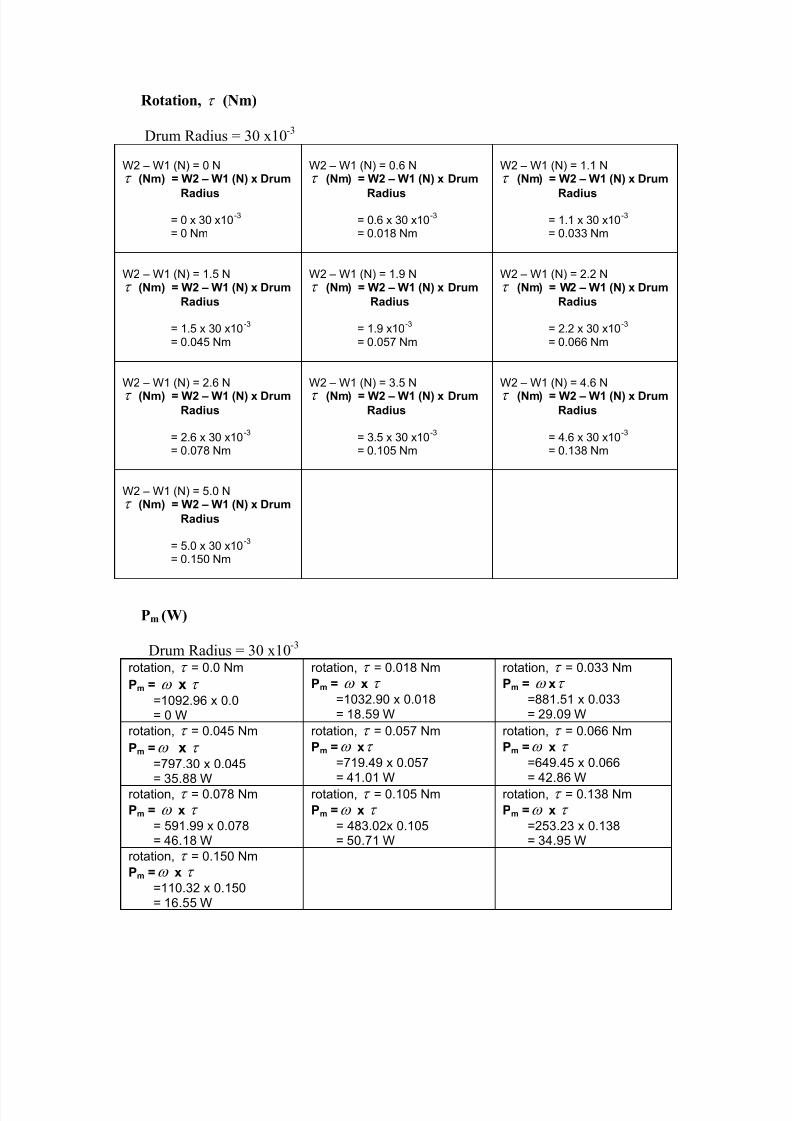
Rotation, (Nm)
Drum Radius = 30 x10-3
W2 – W1 (N) = 0 N (Nm) = W2 – W1 (N) x Drum
Radius
= 0 x 30 x10-3
= 0 Nm
W2 – W1 (N) = 0.6 N (Nm) = W2 – W1 (N) x Drum
Radius
= 0.6 x 30 x10-3
= 0.018 Nm
W2 – W1 (N) = 1.1 N (Nm) = W2 – W1 (N) x Drum
Radius
= 1.1 x 30 x10-3
= 0.033 Nm
W2 – W1 (N) = 1.5 N (Nm) = W2 – W1 (N) x Drum
Radius
= 1.5 x 30 x10-3
= 0.045 Nm
W2 – W1 (N) = 1.9 N (Nm) = W2 – W1 (N) x Drum
Radius
= 1.9 x10-3
= 0.057 Nm
W2 – W1 (N) = 2.2 N (Nm) = W2 – W1 (N) x Drum
Radius
= 2.2 x 30 x10-3
= 0.066 Nm
W2 – W1 (N) = 2.6 N (Nm) = W2 – W1 (N) x Drum
Radius
= 2.6 x 30 x10-3
= 0.078 Nm
W2 – W1 (N) = 3.5 N (Nm) = W2 – W1 (N) x Drum
Radius
= 3.5 x 30 x10-3
= 0.105 Nm
W2 – W1 (N) = 4.6 N (Nm) = W2 – W1 (N) x Drum
Radius
= 4.6 x 30 x10-3
= 0.138 Nm
W2 – W1 (N) = 5.0 N (Nm) = W2 – W1 (N) x Drum
Radius
= 5.0 x 30 x10-3
= 0.150 Nm
Pm (W)
Drum Radius = 30 x10-3
rotation, = 0.0 Nm
Pm = x
=1092.96 x 0.0= 0 W
rotation, = 0.018 Nm
Pm = x
=1032.90 x 0.018= 18.59 W
rotation, = 0.033 Nm
Pm = x
=881.51 x 0.033= 29.09 W
rotation, = 0.045 Nm
Pm = x
=797.30 x 0.045= 35.88 W
rotation, = 0.057 Nm
Pm = x
=719.49 x 0.057= 41.01 W
rotation, = 0.066 Nm
Pm = x
=649.45 x 0.066= 42.86 W
rotation, = 0.078 Nm
Pm = x
= 591.99 x 0.078= 46.18 W
rotation, = 0.105 Nm
Pm = x
= 483.02x 0.105= 50.71 W
rotation, = 0.138 Nm
Pm = x
=253.23 x 0.138= 34.95 W
rotation, = 0.150 Nm
Pm = x
=110.32 x 0.150= 16.55 W
7/27/2019 PELTON & FRANCIS TURBINES
http://slidepdf.com/reader/full/pelton-francis-turbines 13/37
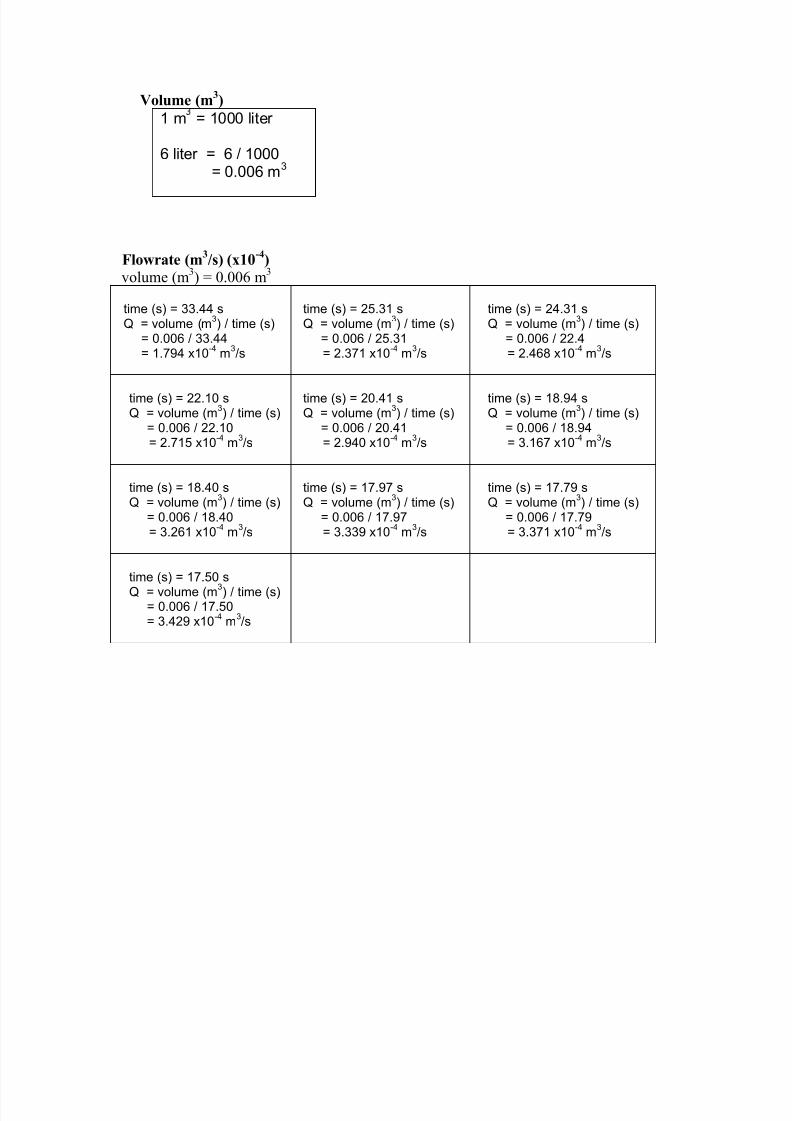
Volume (m3)
1 m = 1000 liter
6 liter = 6 / 1000= 0.006 m
3
Flowrate (m3/s) (x10
-4)
volume (m3) = 0.006 m
3
time (s) = 33.44 sQ = volume (m
3) / time (s)
= 0.006 / 33.44= 1.794 x10
-4m
3/s
time (s) = 25.31 sQ = volume (m
3) / time (s)
= 0.006 / 25.31= 2.371 x10
-4m
3/s
time (s) = 24.31 sQ = volume (m
3) / time (s)
= 0.006 / 22.4= 2.468 x10
-4m
3/s
time (s) = 22.10 sQ = volume (m
3) / time (s)
= 0.006 / 22.10= 2.715 x10
-4m
3/s
time (s) = 20.41 sQ = volume (m
3) / time (s)
= 0.006 / 20.41= 2.940 x10
-4m
3/s
time (s) = 18.94 sQ = volume (m
3) / time (s)
= 0.006 / 18.94= 3.167 x10
-4m
3/s
time (s) = 18.40 sQ = volume (m
3) / time (s)
= 0.006 / 18.40= 3.261 x10
-4m
3/s
time (s) = 17.97 sQ = volume (m
3) / time (s)
= 0.006 / 17.97= 3.339 x10
-4m
3/s
time (s) = 17.79 sQ = volume (m
3) / time (s)
= 0.006 / 17.79= 3.371 x10
-4m
3/s
time (s) = 17.50 s
Q = volume (m3) / time (s)= 0.006 / 17.50= 3.429 x10
-4m
3/s
7/27/2019 PELTON & FRANCIS TURBINES
http://slidepdf.com/reader/full/pelton-francis-turbines 14/37
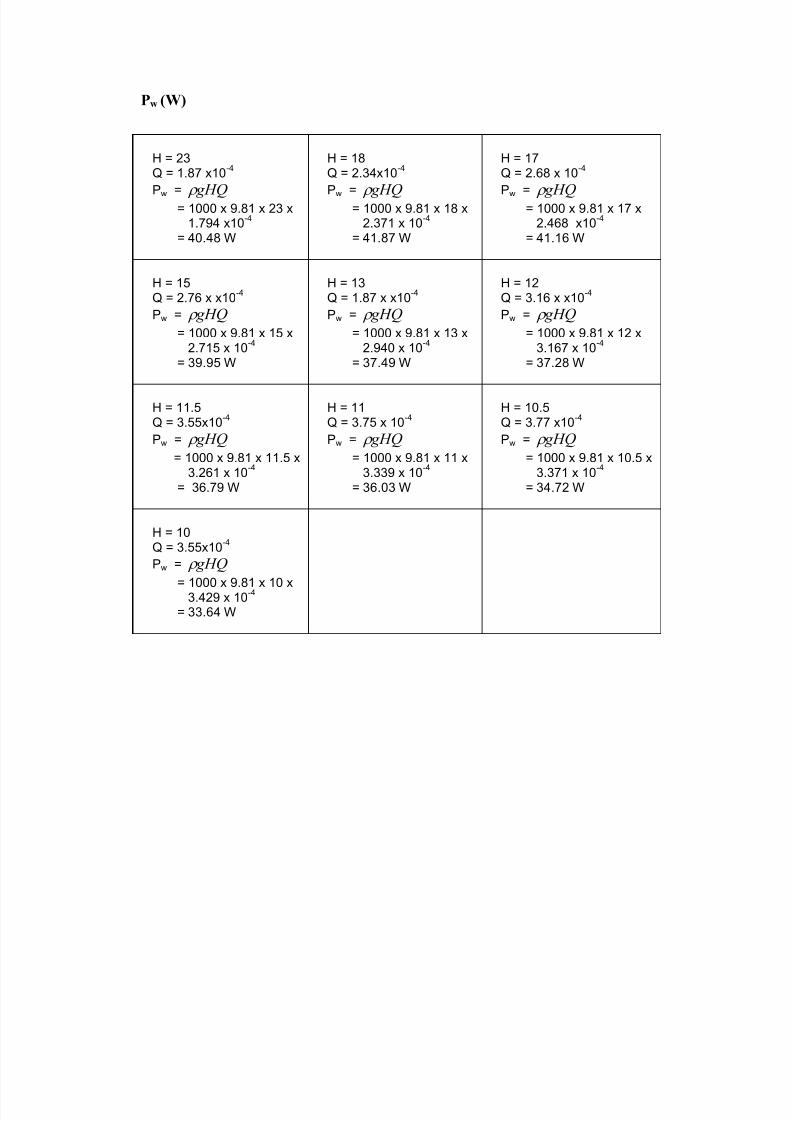
Pw (W)
H = 23Q = 1.87 x10
-4
Pw = gHQ = 1000 x 9.81 x 23 x
1.794 x10-4
= 40.48 W
H = 18Q = 2.34x10
-4
Pw = gHQ = 1000 x 9.81 x 18 x
2.371 x 10-4
= 41.87 W
H = 17Q = 2.68 x 10
-4
Pw = gHQ = 1000 x 9.81 x 17 x
2.468 x10-4
= 41.16 W
H = 15Q = 2.76 x x10
-4
Pw = gHQ
= 1000 x 9.81 x 15 x2.715 x 10
-4
= 39.95 W
H = 13Q = 1.87 x x10
-4
Pw = gHQ
= 1000 x 9.81 x 13 x2.940 x 10
-4
= 37.49 W
H = 12Q = 3.16 x x10
-4
Pw = gHQ
= 1000 x 9.81 x 12 x3.167 x 10
-4
= 37.28 W
H = 11.5Q = 3.55x10
-4
Pw = gHQ
= 1000 x 9.81 x 11.5 x3.261 x 10
-4
= 36.79 W
H = 11Q = 3.75 x 10
-4
Pw = gHQ
= 1000 x 9.81 x 11 x3.339 x 10
-4
= 36.03 W
H = 10.5Q = 3.77 x10
-4
Pw = gHQ
= 1000 x 9.81 x 10.5 x3.371 x 10
-4
= 34.72 W
H = 10Q = 3.55x10
-4
Pw = gHQ
= 1000 x 9.81 x 10 x3.429 x 10-4
= 33.64 W
7/27/2019 PELTON & FRANCIS TURBINES
http://slidepdf.com/reader/full/pelton-francis-turbines 15/37
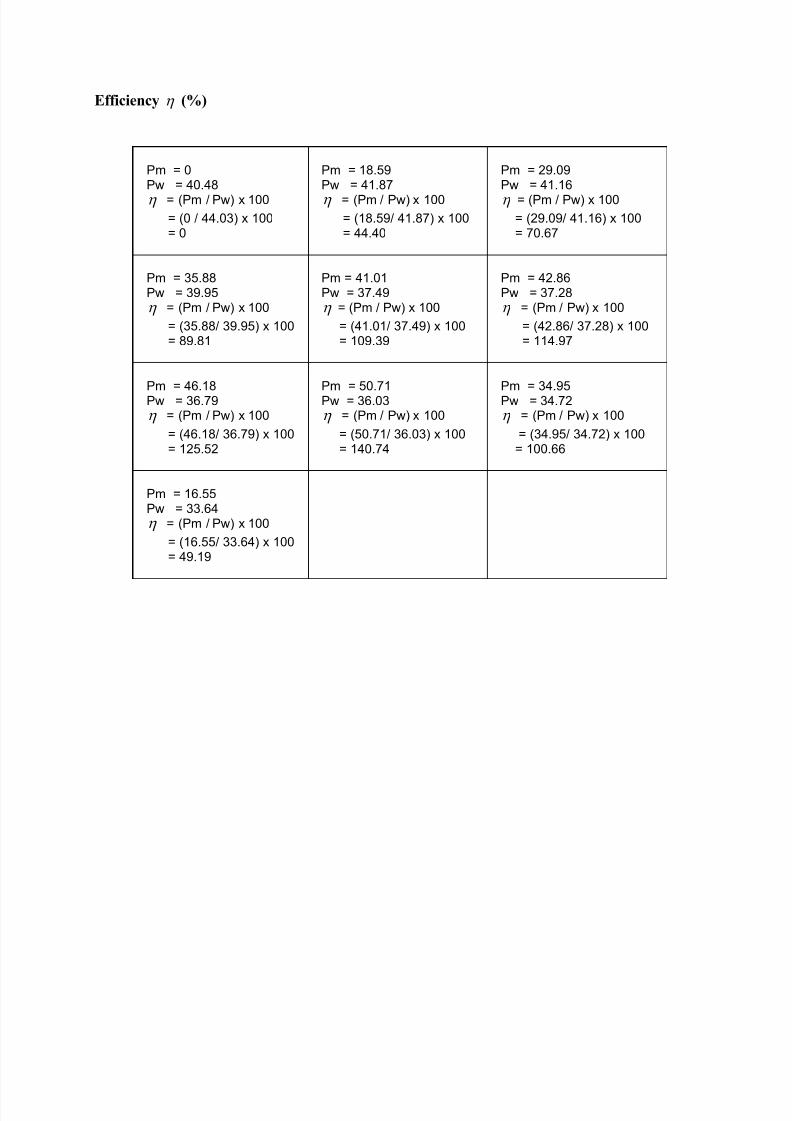
Efficiency (%)
Pm = 0Pw = 40.48 = (Pm / Pw) x 100
= (0 / 44.03) x 100= 0
Pm = 18.59Pw = 41.87 = (Pm / Pw) x 100
= (18.59/ 41.87) x 100= 44.40
Pm = 29.09Pw = 41.16 = (Pm / Pw) x 100
= (29.09/ 41.16) x 100= 70.67
Pm = 35.88Pw = 39.95 = (Pm / Pw) x 100
= (35.88/ 39.95) x 100= 89.81
Pm = 41.01Pw = 37.49 = (Pm / Pw) x 100
= (41.01/ 37.49) x 100= 109.39
Pm = 42.86Pw = 37.28 = (Pm / Pw) x 100
= (42.86/ 37.28) x 100= 114.97
Pm = 46.18Pw = 36.79 = (Pm / Pw) x 100
= (46.18/ 36.79) x 100= 125.52
Pm = 50.71Pw = 36.03 = (Pm / Pw) x 100
= (50.71/ 36.03) x 100= 140.74
Pm = 34.95Pw = 34.72 = (Pm / Pw) x 100
= (34.95/ 34.72) x 100= 100.66
Pm = 16.55Pw = 33.64 = (Pm / Pw) x 100
= (16.55/ 33.64) x 100= 49.19
7/27/2019 PELTON & FRANCIS TURBINES
http://slidepdf.com/reader/full/pelton-francis-turbines 16/37
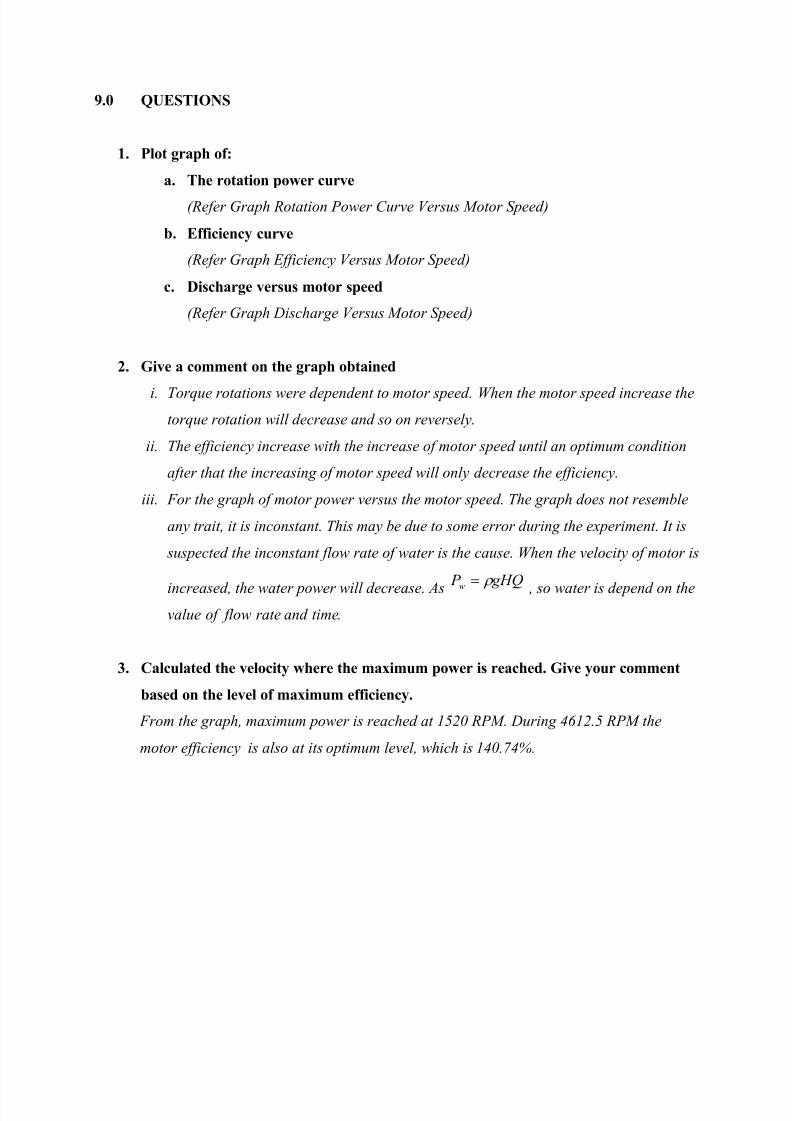
9.0 QUESTIONS
1. Plot graph of:
a. The rotation power curve
(Refer Graph Rotation Power Curve Versus Motor Speed)
b. Efficiency curve
(Refer Graph Efficiency Versus Motor Speed)
c. Discharge versus motor speed
(Refer Graph Discharge Versus Motor Speed)
2. Give a comment on the graph obtained
i.
Torque rotations were dependent to motor speed. When the motor speed increase the
torque rotation will decrease and so on reversely.
ii. The efficiency increase with the increase of motor speed until an optimum condition
after that the increasing of motor speed will only decrease the efficiency.
iii. For the graph of motor power versus the motor speed. The graph does not resemble
any trait, it is inconstant. This may be due to some error during the experiment. It is
suspected the inconstant flow rate of water is the cause. When the velocity of motor is
increased, the water power will decrease. As gHQ P
w
, so water is depend on the
value of flow rate and time.
3. Calculated the velocity where the maximum power is reached. Give your comment
based on the level of maximum efficiency.
From the graph, maximum power is reached at 1520 RPM. During 4612.5 RPM the
motor efficiency is also at its optimum level, which is 140.74%.
7/27/2019 PELTON & FRANCIS TURBINES
http://slidepdf.com/reader/full/pelton-francis-turbines 17/37
4. State five (5) safety factors that have been taken in the experiment?
Five safety factors have been taken in the experiment:
a) Avoid taking parallax reading
b) Make sure all the equipments (e.g. stopwatch, Pelton machine, and tachometer) are in
good condition before starting the experiment.
c) Make sure there is enough water in reserve tank so that the flow rate is constant.
d) When using tachometer to take read of the rotation, the tachometer is hold until a
stabled range of reading could be seen and the average value is taken.
e) It is the best if the reading is taken by the same person.
f) Replace the brake if it is ineffective.
10.0 DISCUSSION
The water flows along the tangent to the path of the runner. Nozzles direct forceful
streams of water against a series of spoon-shaped buckets mounted around the edge of a
wheel. As water flows into the bucket, the direction of the water velocity changes to
follow the contour of the bucket. When the water-jet contacts the bucket, the water exerts
pressure on the bucket and the water is decelerated as it does a "u-turn" and flows out the
other side of the bucket at low velocity. In the process, the water's momentum is
transferred to the turbine. This "impulse" does work on the turbine. For maximum power
and efficiency, the turbine system is designed such that the water-jet velocity is twice the
velocity of the bucket.
A very small percentage of the water's original kinetic energy will still remain in
the water; however, this allows the bucket to be emptied at the same rate it is filled, (see
conservation of mass), thus allowing the water flow to continue uninterrupted. Often two
buckets are mounted side-by-side, thus splitting the water jet in half (see photo). This
balances the side-load forces on the wheel, and helps to ensure smooth, efficient
momentum transfer of the fluid jet to the turbine wheel. Because water and most liquids
are nearly incompressible, almost all of the available energy is extracted in the first stage
of the hydraulic turbine. Therefore, Pelton wheels have only one turbine stage, unlike gas
turbines that operate with compressible fluid.
7/27/2019 PELTON & FRANCIS TURBINES
http://slidepdf.com/reader/full/pelton-francis-turbines 18/37
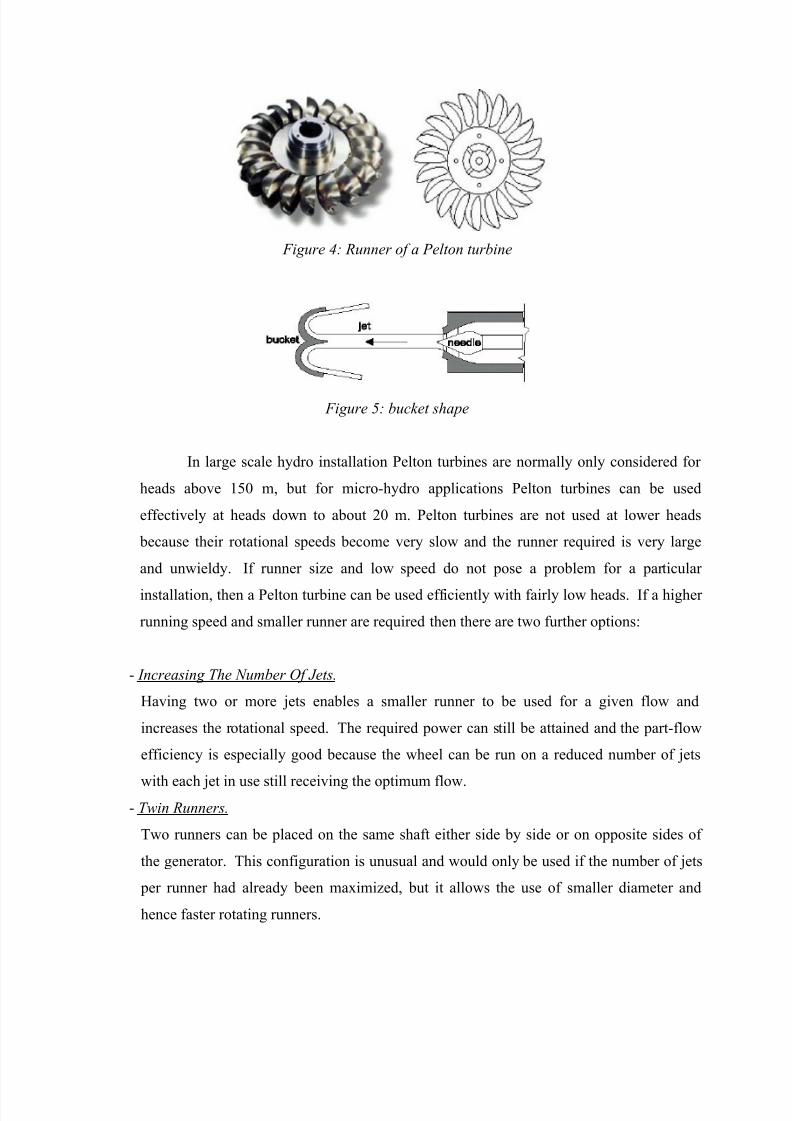
Figure 4: Runner of a Pelton turbine
Figure 5: bucket shape
In large scale hydro installation Pelton turbines are normally only considered for
heads above 150 m, but for micro-hydro applications Pelton turbines can be used
effectively at heads down to about 20 m. Pelton turbines are not used at lower heads
because their rotational speeds become very slow and the runner required is very large
and unwieldy. If runner size and low speed do not pose a problem for a particular
installation, then a Pelton turbine can be used efficiently with fairly low heads. If a higher
running speed and smaller runner are required then there are two further options:
- Increasing The Number Of Jets.
Having two or more jets enables a smaller runner to be used for a given flow and
increases the rotational speed. The required power can still be attained and the part-flow
efficiency is especially good because the wheel can be run on a reduced number of jets
with each jet in use still receiving the optimum flow.- Twin Runners.
Two runners can be placed on the same shaft either side by side or on opposite sides of
the generator. This configuration is unusual and would only be used if the number of jets
per runner had already been maximized, but it allows the use of smaller diameter and
hence faster rotating runners.
7/27/2019 PELTON & FRANCIS TURBINES
http://slidepdf.com/reader/full/pelton-francis-turbines 19/37
11.0 CONCLUSION
As a conclusion, the characteristics of Pelton Turbine operation by using several
speed. There are several speeds that influence the characteristics of Pelton Turbine
besides the power of turbine, rotation and the flow rate. It is also influence the efficiency
of turbine. From the graph, value of the maximum power is reached at 1520 RPM. During
4612.5 RPM the motor efficiency is also at its optimum level, which is 140.74%.
12.0 REFFERENCE
i. www.jfccivilengineer.com/turbines.htm. Accessed on 27 November 2011
ii. Mifflin, Boston, MA.White, F.M. (1994). Fluid Mechanics, 3rd edition, McGraw-Hill,
Inc., New York, NY.
iii. R. E. Featherstone, C. Naluri. (1995.) Civil Engineering Hydraulics. Bodmin, Cornwall:
Blackwell Science
7/27/2019 PELTON & FRANCIS TURBINES
http://slidepdf.com/reader/full/pelton-francis-turbines 20/37
PART B: FRANCIS TURBINE
1.0 INTRODUCTION
In Francis Turbine water flow is radial into the turbine and exits the Turbineaxially. Water pressure decreases as it passes through the turbine imparting reaction on
the turbine blades making the turbine rotate. Read more about design and working
principle of Francis Turbine in this article.
Francis Turbine is the first hydraulic turbine with radial inflow. It was designed by
American scientist James Francis. Francis Turbine is a reaction turbine. Reaction
Turbines have some primary features which differentiate them from Impulse Turbines.
The major part of pressure drop occurs in the turbine itself, unlike the impulse turbine
where complete pressure drop takes place up to the entry point and the turbine passage is
completely filled by the water flow during the operation.
For power generation using Francis Turbine the turbine is supplied with high
pressure water which enters the turbine with radial inflow and leaves the turbine axially
through the draft tube. The energy from water flow is transferred to the shaft of the
turbine in form of torque and rotation. The turbine shaft is coupled with dynamos or
alternators for power generation. For quality power generation speed of turbine should be
maintained constant despite the changing loads. To maintain the runner speed constant
even in reduced load condition the water flow rate is reduced by changing the guide
vanes angle.
2.0 OBJECTIVE
To determine the relationship between the head, flow rate, velocity, power and efficiency
of Francis Turbine
3.0 LEARNING OUTCOMES
i. Understand the basic operating system of the Francis Turbine.
ii. Understand on the factors which influence the efficiency of turbine.
7/27/2019 PELTON & FRANCIS TURBINES
http://slidepdf.com/reader/full/pelton-francis-turbines 21/37
4.0 THEORY
Hydraulic power can be obtain at the turbine inlet (usually known in watt unit) and
can be calculated as, Phyd = Htot Q, and Q as the volume discharge that can be read from
the measuring equipment (m3/s) and is a water per unit of volume (9820 N/m
3). Htot is a
total head (m) which can be calculated (using theorem Bernoulli method) in a circuit
section flow just before the turbine in a location of pressure as total of three parameter,
Htot = Hman + Hkin + H pres which is Hman is a the differences of pressure head position
which measured the pressure and the turbine shaft bar. As using the experiment table,
Hman ~ 0.35 m (if the pressure decreasing at the turbine point out which cause by the mixer
which count as an available head, Hman can be calculated as the height differences between
the pressure gauging point position and the point of water level at the outflow of
reservoir) is a kinetic parameter which cause by water velocity, Vm (in m/s), at the
pressure gauging location, where the pipe section is Sm (this value is not S and v value at
the inlet section). Hkin = g
vm
2
2
, where as g is the gravity constant (9.81 m/s2) and vm =
mS
Q.
H pres =
mis a resultant parameter from water pressure, m (in unit N/m
2) as measured by
pressure gauging. In calculation table, the readable gauging value which has been read by
four gauging, all the readable value from the calculation can be added by the relatedvalues, vm, Hman, Hkin, H pres, Htot, Phd, which has been described first.
This following relationship, has been used to calculated the value of mechanical
power out Pmec (usually in watt), Pmec = c = 2nC / 60, where as , is the turbine angular
velocity (in rad/s), n is a turbine average velocity obtain by reader equipment (RPM) and
c is a braking torque velocity at the turbine shaft as obtain by reader equipment (Nm).
Lastly, the turbine overall efficiency,
hyd
mec
P P is calculated as the ratio of power at
outlet point compared to the generated power. Last table arrangement for the experimental
value and the calculation value (for each z) can be explained in a provided table.
7/27/2019 PELTON & FRANCIS TURBINES
http://slidepdf.com/reader/full/pelton-francis-turbines 22/37
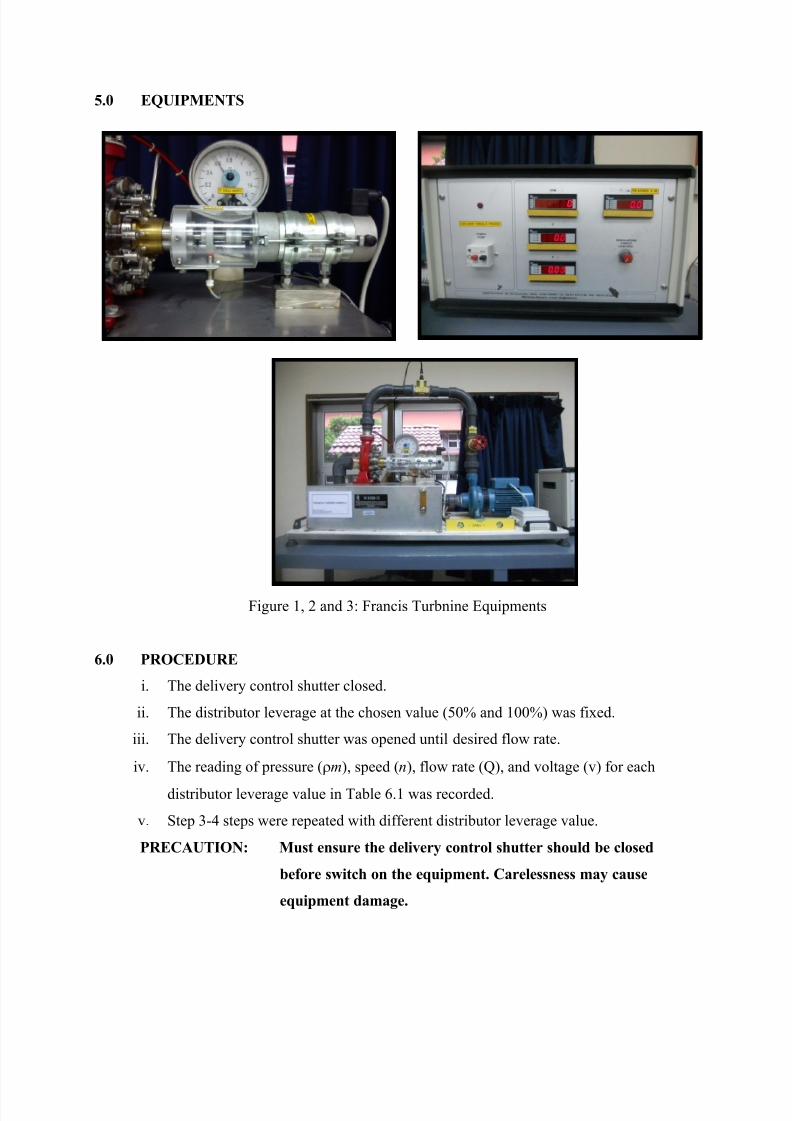
5.0 EQUIPMENTS
Figure 1, 2 and 3: Francis Turbnine Equipments
6.0 PROCEDURE
i. The delivery control shutter closed.
ii. The distributor leverage at the chosen value (50% and 100%) was fixed.
iii. The delivery control shutter was opened until desired flow rate.
iv. The reading of pressure (m), speed (n), flow rate (Q), and voltage (v) for each
distributor leverage value in Table 6.1 was recorded.
v. Step 3-4 steps were repeated with different distributor leverage value.
PRECAUTION: Must ensure the delivery control shutter should be closed
before switch on the equipment. Carelessness may cause
equipment damage.
7/27/2019 PELTON & FRANCIS TURBINES
http://slidepdf.com/reader/full/pelton-francis-turbines 23/37
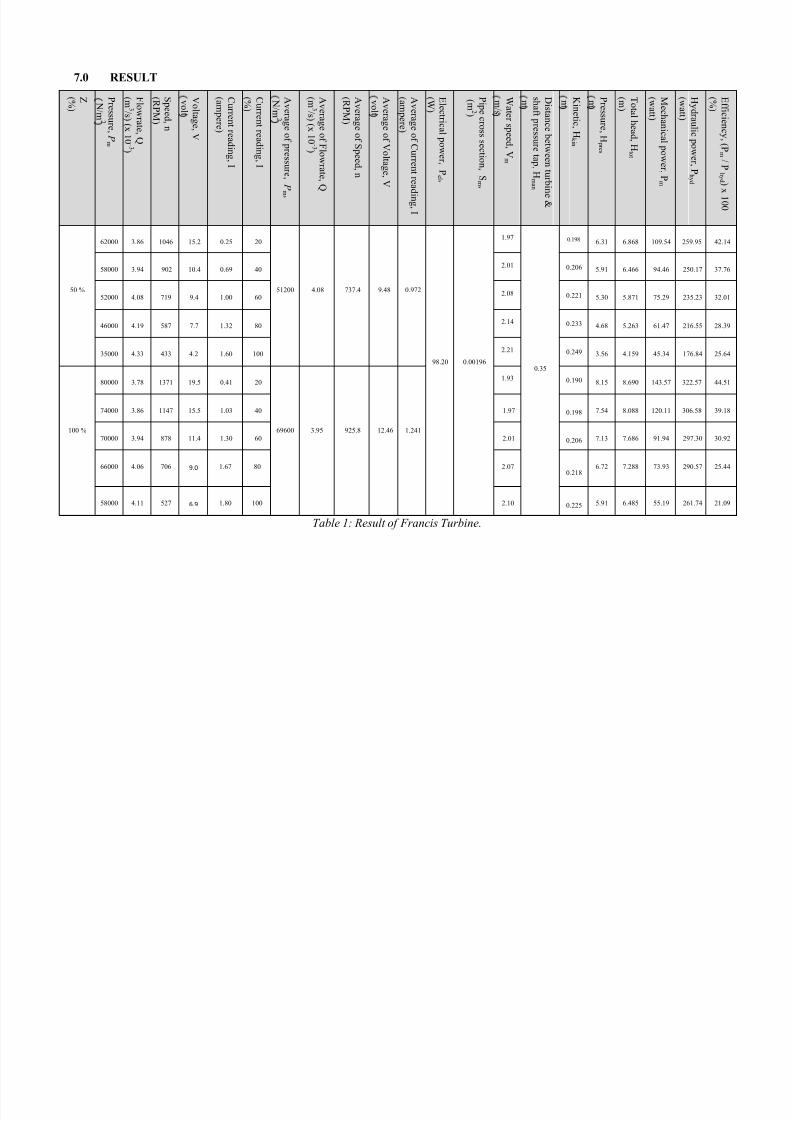
7.0 RESULT
Z(%)
Pressure,P m
N/m2
Flowrate,Q
(m3/s)(x10-3)
Speed,n
(RPM)
Voltage,V
volt
Currentreading,I
(ampere)
Currentreading,I
(%)
Averageofpressure,P
m ,
N/m2
AverageofFlowrate,Q
(m3/s)(x10-3)
AverageofSpeed,n
(RPM)
AverageofVoltage,V
volt
AverageofCurrentreading,I
(ampere)
Electricalpower,Pel ,
(W)
Pipecrosssection,Sm,
(m2)
Waterspeed,Vm
m/s
Distancebetweenturbine&
shaftpressuretap,Hman
m Kinetic,Hkin
m Pressure,Hpres
m Totalhead,Htot
(m)
Mechanicalpower,Pm
(watt)
Hydraulicpower,Phyd
(watt)
Efficiency,(Pm/Phyd )
x100
(%)
50 %
62000 3.86 1046 15.2 0.25 20
51200 4.08 737.4 9.48 0.972
98.20 0.00196
1.97
0.35
0.198 6.31 6.868 109.54 259.95 42.14
58000 3.94 902 10.4 0.69 402.01 0.206 5.91 6.466 94.46 250.17 37.76
52000 4.08 719 9.4 1.00 602.08 0.221 5.30 5.871 75.29 235.23 32.01
46000 4.19 587 7.7 1.32 802.14 0.233 4.68 5.263 61.47 216.55 28.39
35000 4.33 433 4.2 1.60 1002.21 0.249 3.56 4.159 45.34 176.84 25.64
100 %
80000 3.78 1371 19.5 0.41 20
69600 3.95 925.8 12.46 1.241
1.93 0.190 8.15 8.690 143.57 322.57 44.51
74000 3.86 1147 15.5 1.03 40 1.97 0.198 7.54 8.088 120.11 306.58 39.18
70000 3.94 878 11.4 1.30 60 2.01 0.206 7.13 7.686 91.94 297.30 30.92
66000 4.06 706 9.0 1.67 80 2.070.218
6.72 7.288 73.93 290.57 25.44
58000 4.11 527 6.9 1.80 100 2.10 0.225 5.91 6.485 55.19 261.74 21.09
Table 1: Result of Francis Turbine.
7/27/2019 PELTON & FRANCIS TURBINES
http://slidepdf.com/reader/full/pelton-francis-turbines 24/37
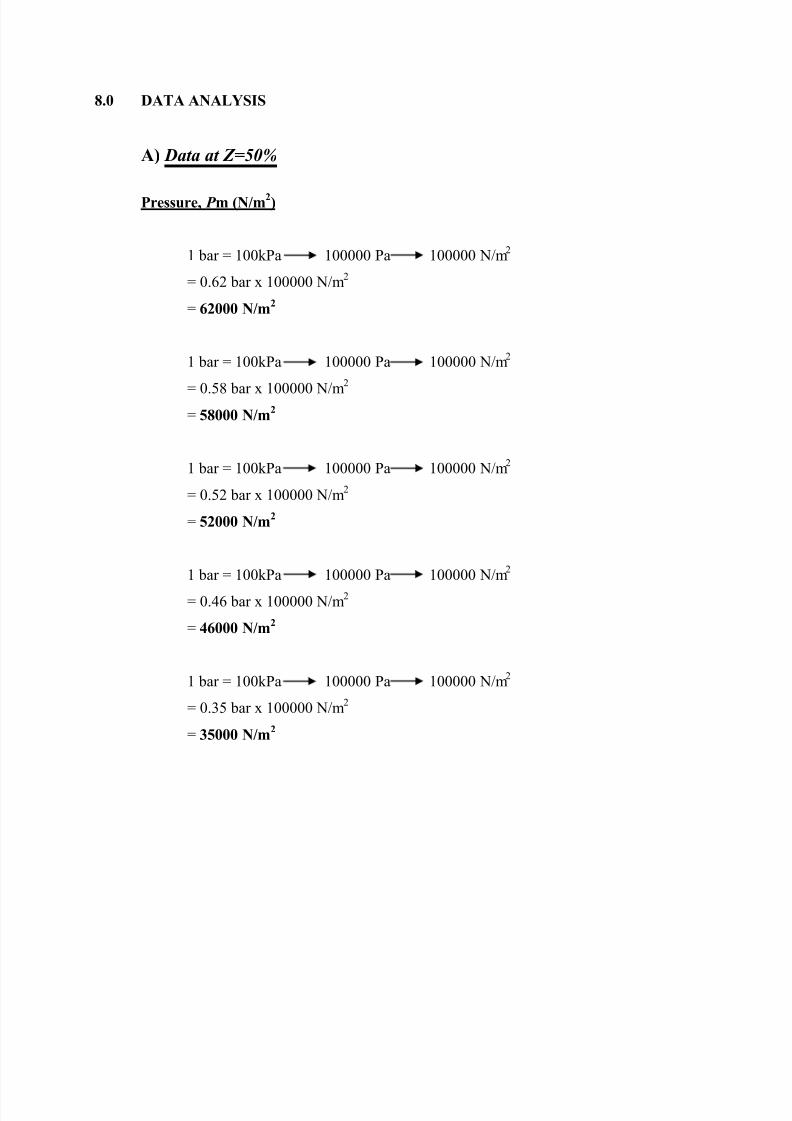
8.0 DATA ANALYSIS
A) Data at Z=50%
Pressure, P m (N/m2)
1 bar = 100kPa 100000 Pa 100000 N/m2
= 0.62 bar x 100000 N/m2
= 62000 N/m2
1 bar = 100kPa 100000 Pa 100000 N/m2
= 0.58 bar x 100000 N/m2
= 58000 N/m
2
1 bar = 100kPa 100000 Pa 100000 N/m2
= 0.52 bar x 100000 N/m2
= 52000 N/m2
1 bar = 100kPa 100000 Pa 100000 N/m2
= 0.46 bar x 100000 N/m2
= 46000 N/m2
1 bar = 100kPa 100000 Pa 100000 N/m2
= 0.35 bar x 100000 N/m2
= 35000 N/m2

7/27/2019 PELTON & FRANCIS TURBINES
http://slidepdf.com/reader/full/pelton-francis-turbines 25/37
Flowrate, Q (m3/s)
13.9 x103 l x 1m
3x 1h = 3.86 x 10
-3m
3/s
h 1000l 3600s
14.2 x103 l x 1m
3x 1h = 3.94 x 10
-3m
3/s
h 1000l 3600s
14.7 x103 l x 1m
3x 1h = 4.08 x 10
-3m
3/s
h 1000l 3600s
15.1 x103 l x 1m
3x 1h = 4.19 x 10
-3m
3/s
h 1000l 3600s
15.6 x103 l x 1m3 x 1h = 4.33 x 10⁻³
m3/s
h 1000l 3600s
Water Speed, Vm (m/s)
mV = mS/Q = 00196.0/1086.3 3 x = 1.97 m/s
mV = mS/Q = 00196.0/1094.3 3 x = 2.01 m/s
mV = mS/Q = 00196.0/1008.4 3 x = 2.08 m/s
mV = mS/Q = 00196.0/1019.4 3 x = 2.14 m/s
mV = mS/Q = 00196.0/1033.4 3 x = 2.21 m/s
7/27/2019 PELTON & FRANCIS TURBINES
http://slidepdf.com/reader/full/pelton-francis-turbines 26/37
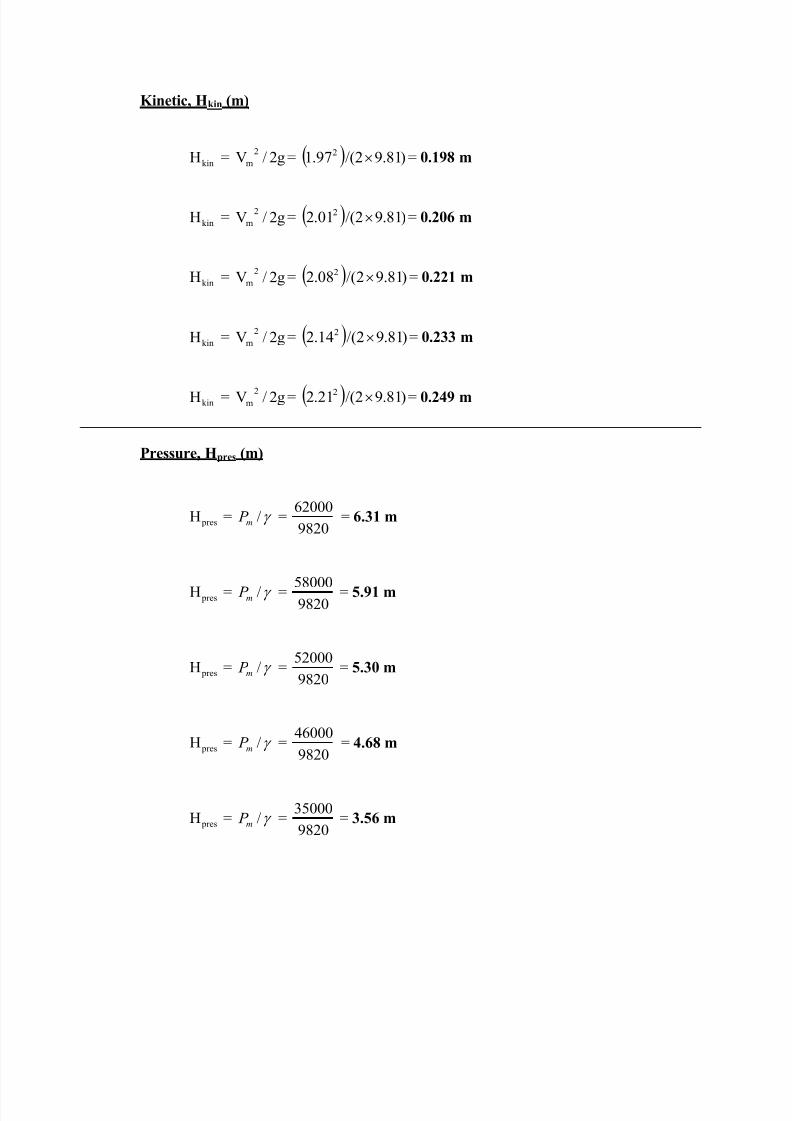
Kinetic, Hkin (m)
kinH = g2/V2
m = )81.92/(97.1 2 = 0.198 m
kinH = g2/V2
m = )81.92/(01.2 2 = 0.206 m
kinH = g2/V2
m = )81.92/(08.2 2 = 0.221 m
kinH = g2/V2
m = )81.92/(14.2 2 = 0.233 m
kinH = g2/V 2m = )81.92/(21.2 2 = 0.249 m
Pressure, Hpres (m)
presH = /m P =9820
62000= 6.31 m
presH = /m P =982058000 = 5.91 m
presH = /m P =9820
52000= 5.30 m
presH = /m P =9820
46000= 4.68 m
presH = /m P =9820
35000= 3.56 m

7/27/2019 PELTON & FRANCIS TURBINES
http://slidepdf.com/reader/full/pelton-francis-turbines 27/37
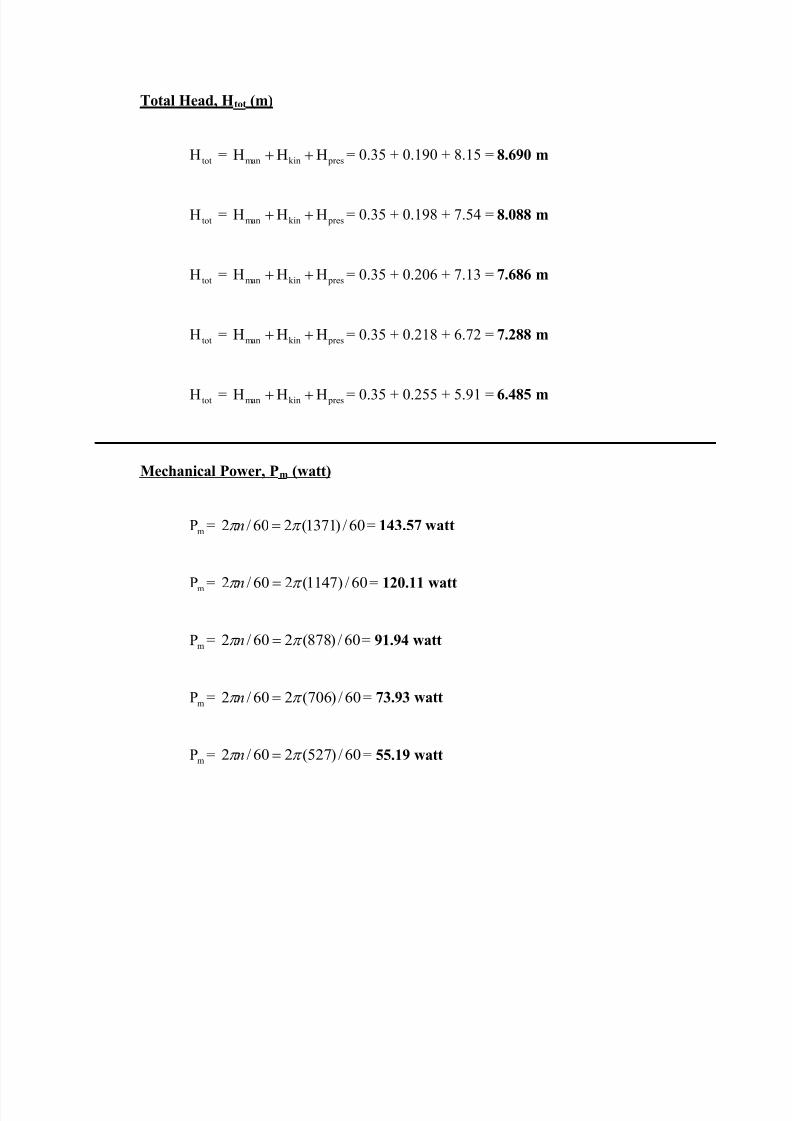
Total Head, Htot (m)
totH = preskinman HHH = 0.35 + 0.198 + 6.31 = 6.858 m
totH = preskinman HHH = 0.35 + 0.206 + 5.91 = 6.466 m
totH = preskinman HHH = 0.35 + 0.221 + 5.30 = 5.871 m
totH = preskinman HHH = 0.35 + 0.233 + 4.68 = 5.263 m
totH = preskinman HHH = 0.35 + 0.249 + 3.56 = 4.159 m
Mechanical Power, Pm (watt)
mP = 60/)1046(260/2 n = 109.54 watt
mP
= 60/)902(260/2 n = 94.46 watt
mP = 60/)719(260/2 n = 75.29 watt
mP = 60/)587(260/2 n = 61.47 watt
mP = 60/)433(260/2 n = 45.34 watt
7/27/2019 PELTON & FRANCIS TURBINES
http://slidepdf.com/reader/full/pelton-francis-turbines 28/37
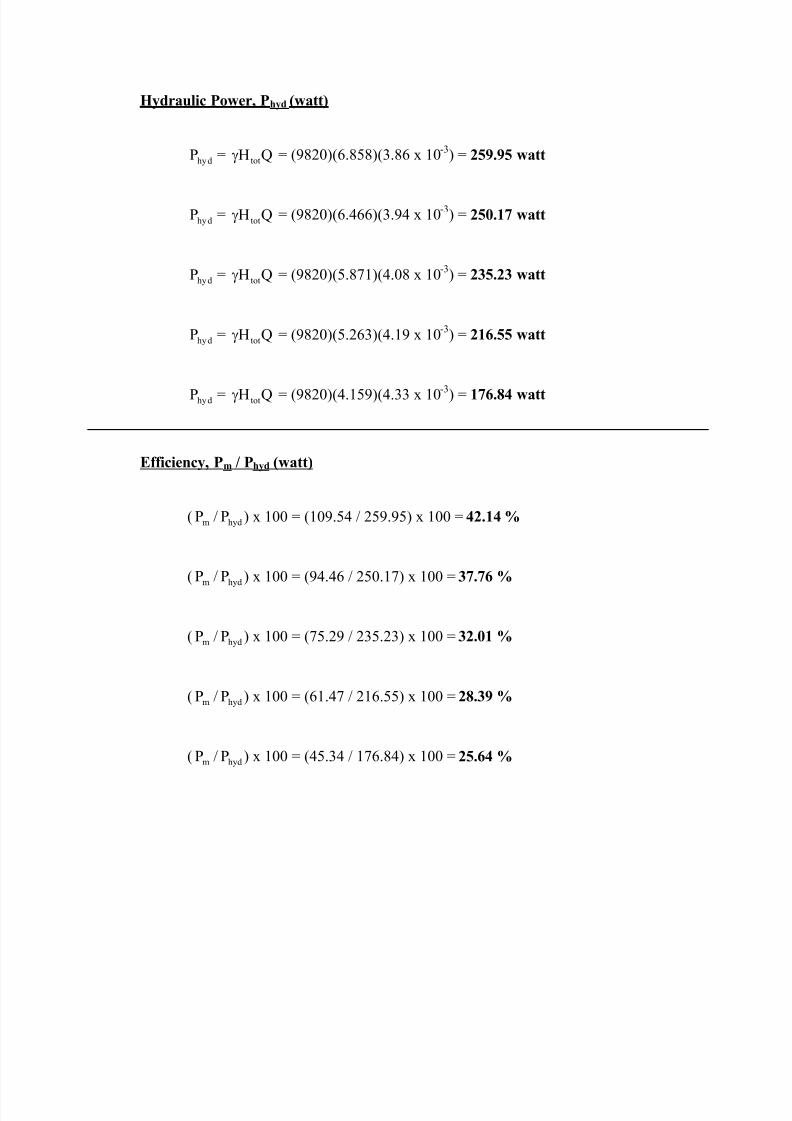
Hydraulic Power, Phyd (watt)
hydP = QH tot = (9820)(6.858)(3.86 x 10⁻³
) = 259.95 watt
hydP = QH tot = (9820)(6.466)(3.94 x 10⁻³
) = 250.17 watt
hydP = QH tot = (9820)(5.871)(4.08 x 10⁻³
) = 235.23 watt
hydP = QH tot = (9820)(5.263)(4.19 x 10⁻³
) = 216.55 watt
hydP = QH tot = (9820)(4.159)(4.33 x 10⁻³) = 176.84 watt
Efficiency, Pm / Phyd (watt)
( hydm P/P ) x 100 = (109.54 / 259.95) x 100 = 42.14 %
( hydm P/P ) x 100 = (94.46 / 250.17) x 100 = 37.76 %
( hydm P/P ) x 100 = (75.29 / 235.23) x 100 = 32.01 %
( hydm P/P ) x 100 = (61.47 / 216.55) x 100 = 28.39 %
( hydm P/P ) x 100 = (45.34 / 176.84) x 100 = 25.64 %
7/27/2019 PELTON & FRANCIS TURBINES
http://slidepdf.com/reader/full/pelton-francis-turbines 29/37
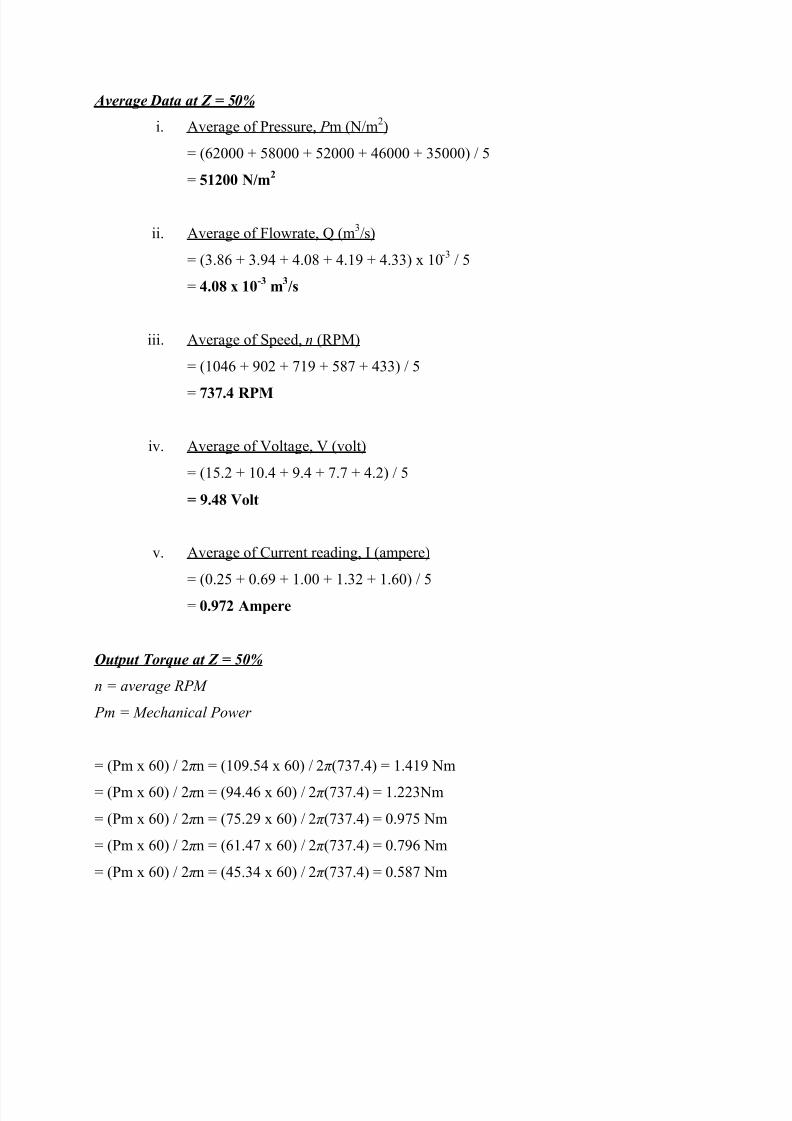
Average Data at Z = 50%
i. Average of Pressure, P m (N/m2)
= (62000 + 58000 + 52000 + 46000 + 35000) / 5
= 51200 N/m2
ii. Average of Flowrate, Q (m3/s)
= (3.86 + 3.94 + 4.08 + 4.19 + 4.33) x 10-3
/ 5
= 4.08 x 10⁻³
m3/s
iii. Average of Speed, n (RPM)
= (1046 + 902 + 719 + 587 + 433) / 5
= 737.4 RPM
iv. Average of Voltage, V (volt)
= (15.2 + 10.4 + 9.4 + 7.7 + 4.2) / 5
= 9.48 Volt
v. Average of Current reading, I (ampere)
= (0.25 + 0.69 + 1.00 + 1.32 + 1.60) / 5
= 0.972 Ampere
Output Torque at Z = 50%
n = average RPM
Pm = Mechanical Power
= (Pm x 60) / 2π n = (109.54 x 60) / 2π (737.4) = 1.419 Nm
= (Pm x 60) / 2π n = (94.46 x 60) / 2π (737.4) = 1.223Nm
= (Pm x 60) / 2π n = (75.29 x 60) / 2π (737.4) = 0.975 Nm
= (Pm x 60) / 2π n = (61.47 x 60) / 2π (737.4) = 0.796 Nm
= (Pm x 60) / 2π n = (45.34 x 60) / 2π (737.4) = 0.587 Nm
7/27/2019 PELTON & FRANCIS TURBINES
http://slidepdf.com/reader/full/pelton-francis-turbines 30/37
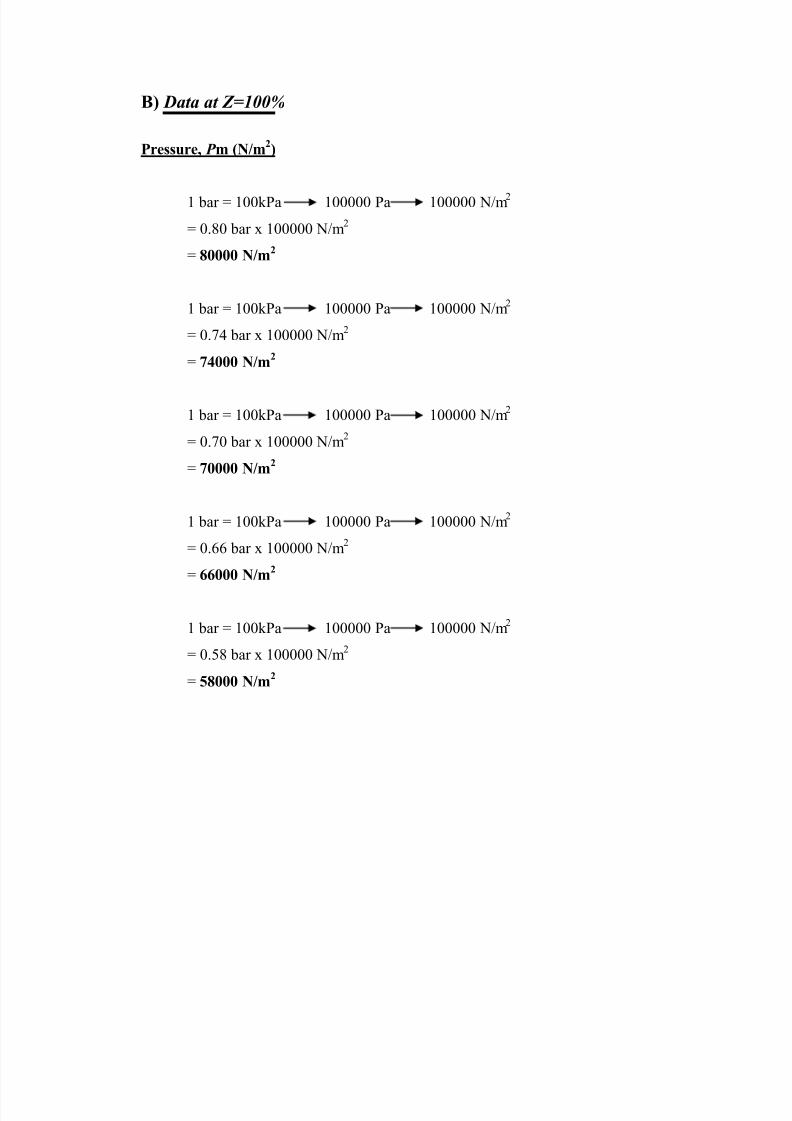
B) Data at Z=100%
Pressure, P m (N/m2)
1 bar = 100kPa 100000 Pa 100000 N/m2
= 0.80 bar x 100000 N/m2
= 80000 N/m2
1 bar = 100kPa 100000 Pa 100000 N/m2
= 0.74 bar x 100000 N/m2
= 74000 N/m2
1 bar = 100kPa 100000 Pa 100000 N/m2
= 0.70 bar x 100000 N/m2
= 70000 N/m2
1 bar = 100kPa 100000 Pa 100000 N/m2
= 0.66 bar x 100000 N/m2
= 66000 N/m2
1 bar = 100kPa 100000 Pa 100000 N/m2
= 0.58 bar x 100000 N/m2
= 58000 N/m2
7/27/2019 PELTON & FRANCIS TURBINES
http://slidepdf.com/reader/full/pelton-francis-turbines 31/37
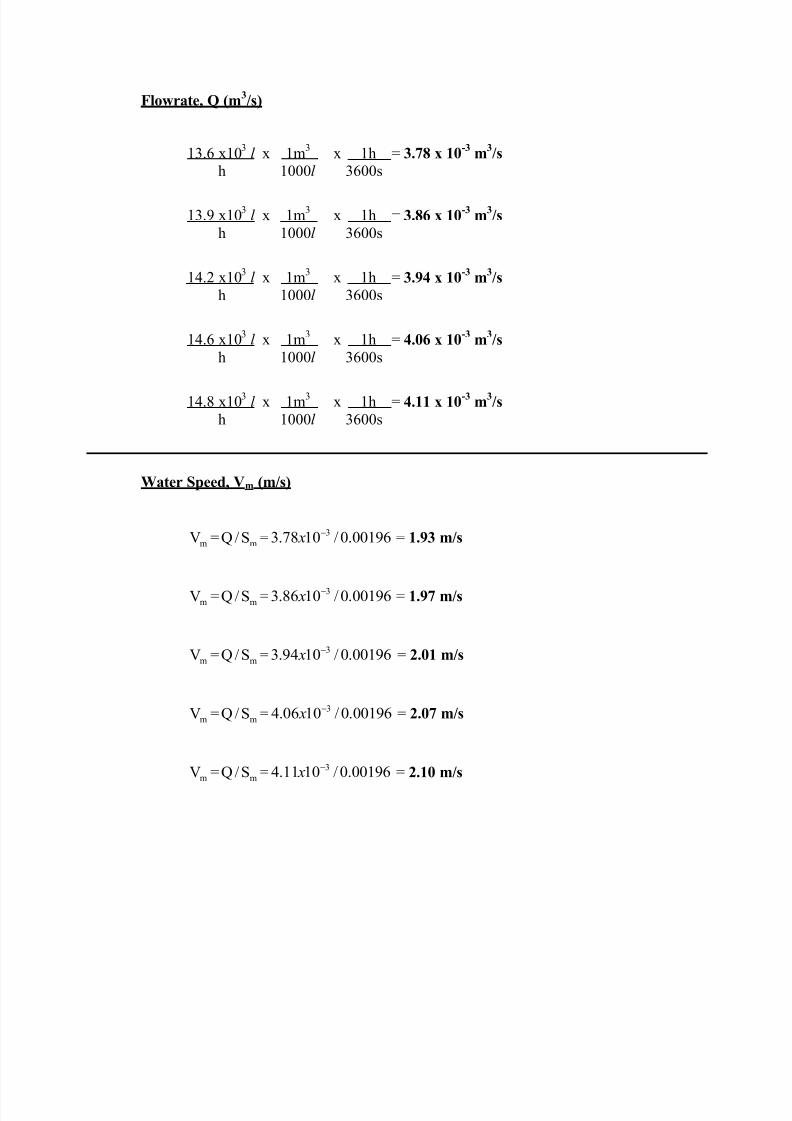
Flowrate, Q (m3/s)
13.6 x103 l x 1m
3x 1h = 3.78 x 10
-3m
3/s
h 1000l 3600s
13.9 x103 l x 1m
3x 1h = 3.86 x 10
-3m
3/s
h 1000l 3600s
14.2 x103 l x 1m
3x 1h = 3.94 x 10
-3m
3/s
h 1000l 3600s
14.6 x103 l x 1m
3x 1h = 4.06 x 10
-3m
3/s
h 1000l 3600s
14.8 x103 l x 1m3 x 1h = 4.11 x 10⁻³
m3/s
h 1000l 3600s
Water Speed, Vm (m/s)
mV = mS/Q = 00196.0/1078.3 3 x = 1.93 m/s
mV = mS/Q = 00196.0/1086.3 3 x = 1.97 m/s
mV = mS/Q = 00196.0/1094.3 3 x = 2.01 m/s
mV = mS/Q = 00196.0/1006.4 3 x = 2.07 m/s
mV = mS/Q = 00196.0/1011.4 3 x = 2.10 m/s
7/27/2019 PELTON & FRANCIS TURBINES
http://slidepdf.com/reader/full/pelton-francis-turbines 32/37
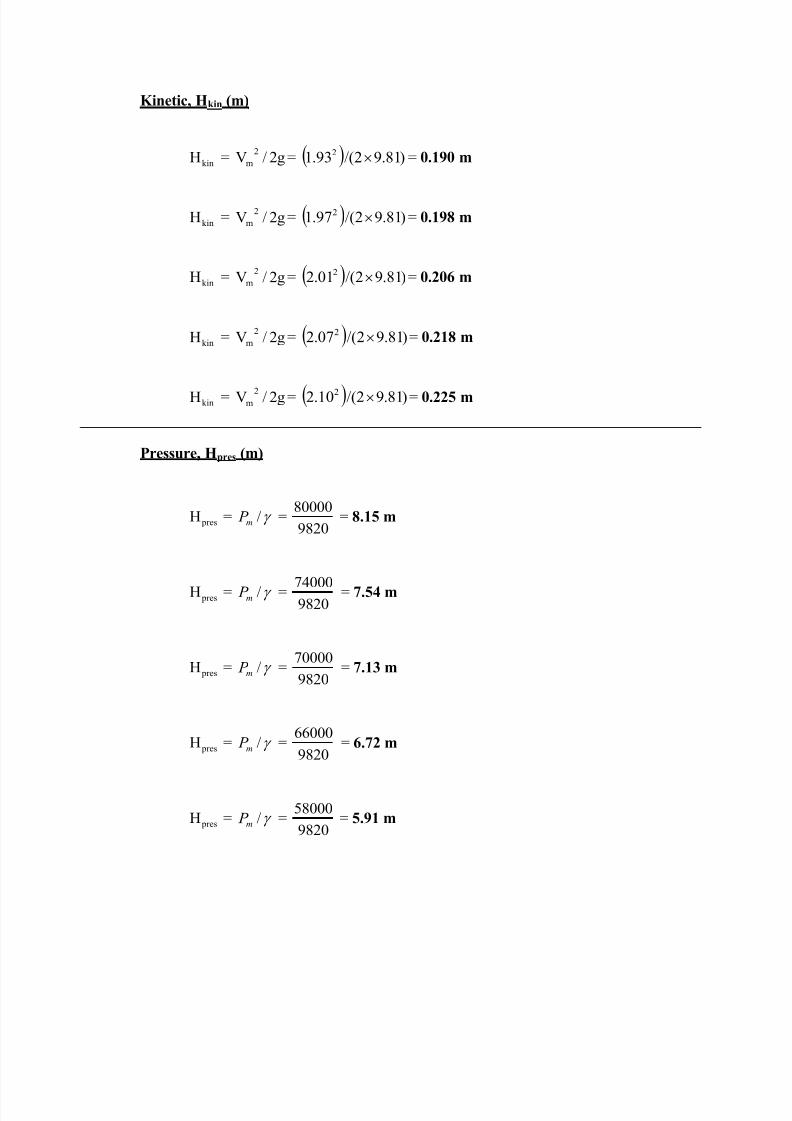
Kinetic, Hkin (m)
kinH = g2/V2
m = )81.92/(93.1 2 = 0.190 m
kinH = g2/V2
m = )81.92/(97.1 2 = 0.198 m
kinH = g2/V2
m = )81.92/(01.2 2 = 0.206 m
kinH = g2/V2
m = )81.92/(07.2 2 = 0.218 m
kinH = g2/V 2m = )81.92/(10.2 2 = 0.225 m
Pressure, Hpres (m)
presH = /m P =9820
80000= 8.15 m
presH = /m P =982074000 = 7.54 m
presH = /m P =9820
70000= 7.13 m
presH = /m P =9820
66000= 6.72 m
presH = /m P =9820
58000= 5.91 m
7/27/2019 PELTON & FRANCIS TURBINES
http://slidepdf.com/reader/full/pelton-francis-turbines 33/37
Total Head, Htot (m)
totH = preskinman HHH = 0.35 + 0.190 + 8.15 = 8.690 m
totH = preskinman HHH = 0.35 + 0.198 + 7.54 = 8.088 m
totH = preskinman HHH = 0.35 + 0.206 + 7.13 = 7.686 m
totH = preskinman HHH = 0.35 + 0.218 + 6.72 = 7.288 m
totH = preskinman HHH = 0.35 + 0.255 + 5.91 = 6.485 m
Mechanical Power, Pm (watt)
mP = 60/)1371(260/2 n = 143.57 watt
mP
= 60/)1147(260/2 n = 120.11 watt
mP = 60/)878(260/2 n = 91.94 watt
mP = 60/)706(260/2 n = 73.93 watt
mP = 60/)527(260/2 n = 55.19 watt
7/27/2019 PELTON & FRANCIS TURBINES
http://slidepdf.com/reader/full/pelton-francis-turbines 34/37
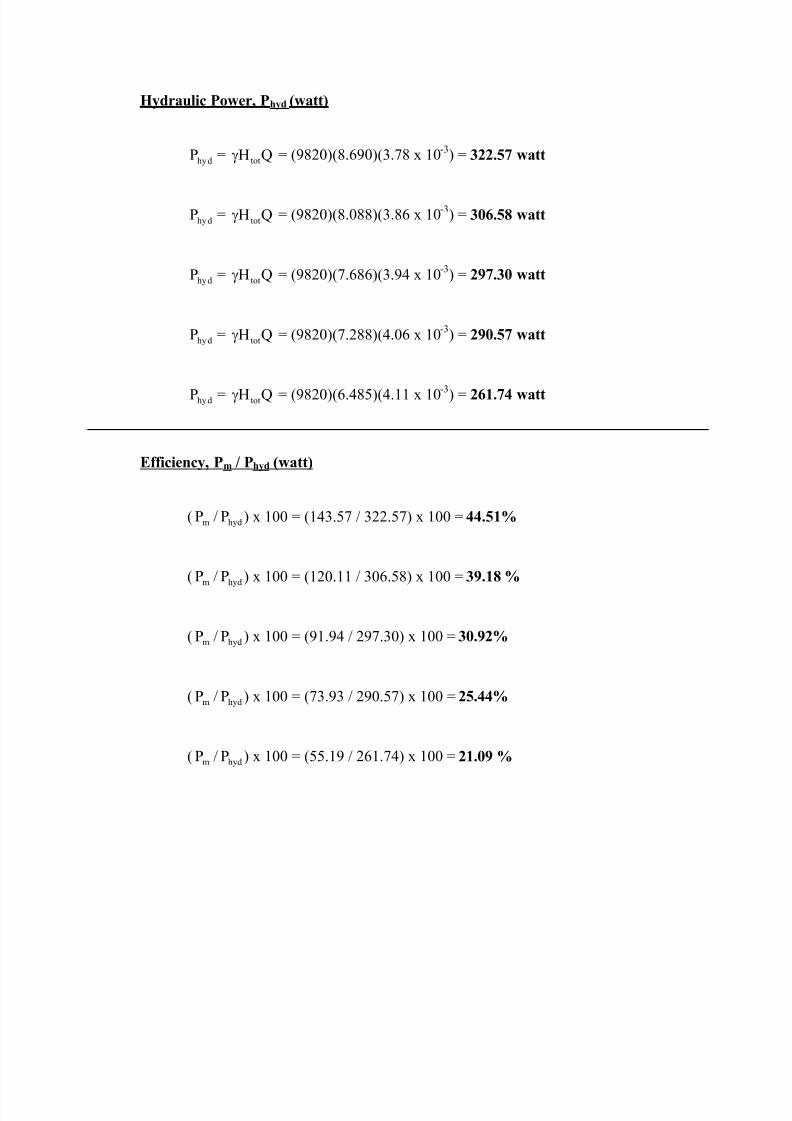
Hydraulic Power, Phyd (watt)
hydP = QH tot = (9820)(8.690)(3.78 x 10⁻³
) = 322.57 watt
hydP = QH tot = (9820)(8.088)(3.86 x 10⁻³
) = 306.58 watt
hydP = QH tot = (9820)(7.686)(3.94 x 10⁻³
) = 297.30 watt
hydP = QH tot = (9820)(7.288)(4.06 x 10⁻³
) = 290.57 watt
hydP = QH tot = (9820)(6.485)(4.11 x 10⁻³) = 261.74 watt
Efficiency, Pm / Phyd (watt)
( hydm P/P ) x 100 = (143.57 / 322.57) x 100 = 44.51%
( hydm P/P ) x 100 = (120.11 / 306.58) x 100 = 39.18 %
( hydm P/P ) x 100 = (91.94 / 297.30) x 100 = 30.92%
( hydm P/P ) x 100 = (73.93 / 290.57) x 100 = 25.44%
( hydm P/P ) x 100 = (55.19 / 261.74) x 100 = 21.09 %

7/27/2019 PELTON & FRANCIS TURBINES
http://slidepdf.com/reader/full/pelton-francis-turbines 35/37
Average Data at Z = 100%
vi. Average of Pressure, P m (N/m2)
= (80000 + 74000 + 70000 + 66000 + 58000) / 5
= 69600 N/m2
vii. Average of Flowrate, Q (m3/s)
= (3.78 + 3.86 + 3.94 + 4.06 + 4.11) x 10-3
/ 5
= 3.95 x 10⁻³
m3/s
viii. Average of Speed, n (RPM)
= (1371 + 1147 + 878 + 706 + 527) / 5
= 925.8 RPM
ix. Average of Voltage, V (volt)
= (19.5 + 15.5 + 11.4 + 9.0 + 6.9) / 5
= 12.46 Volt
x. Average of Current reading, I (ampere)
= (0.41 + 1.03 + 1.03 + 1.30 + 1.67 + 1.80) / 5
= 1.241 Ampere
Output Torque at Z = 100%
n = average RPM
Pm = Mechanical Power
= (Pm x 60) / 2π n = (143.57 x 60) / 2π (925.8) = 1.481 Nm
= (Pm x 60) / 2π n = (120.11 x 60) / 2π (925.8) = 1.239 Nm
= (Pm x 60) / 2π n = (91.94 x 60) / 2π (925.8) = 0.948 Nm
= (Pm x 60) / 2π n = (73.93 x 60) / 2π (925.8) = 0.763 Nm
= (Pm x 60) / 2π n = (55.19 x 60) / 2π (925.8) = 0.569 Nm
7/27/2019 PELTON & FRANCIS TURBINES
http://slidepdf.com/reader/full/pelton-francis-turbines 36/37
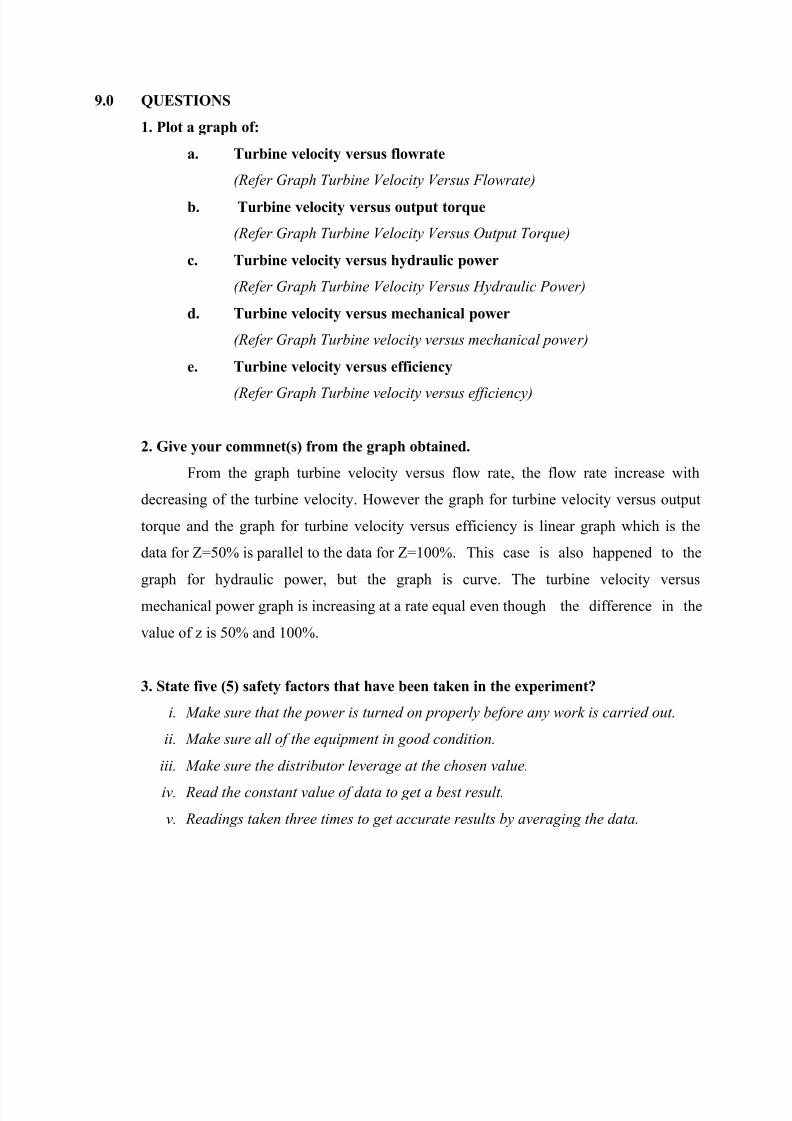
9.0 QUESTIONS
1. Plot a graph of:
a. Turbine velocity versus flowrate
(Refer Graph Turbine Velocity Versus Flowrate)
b. Turbine velocity versus output torque
(Refer Graph Turbine Velocity Versus Output Torque)
c. Turbine velocity versus hydraulic power
(Refer Graph Turbine Velocity Versus Hydraulic Power)
d. Turbine velocity versus mechanical power
(Refer Graph Turbine velocity versus mechanical power)
e. Turbine velocity versus efficiency
(Refer Graph Turbine velocity versus efficiency)
2. Give your commnet(s) from the graph obtained.
From the graph turbine velocity versus flow rate, the flow rate increase with
decreasing of the turbine velocity. However the graph for turbine velocity versus output
torque and the graph for turbine velocity versus efficiency is linear graph which is the
data for Z=50% is parallel to the data for Z=100%. This case is also happened to the
graph for hydraulic power, but the graph is curve. The turbine velocity versus
mechanical power graph is increasing at a rate equal even though the difference in the
value of z is 50% and 100%.
3. State five (5) safety factors that have been taken in the experiment?
i. Make sure that the power is turned on properly before any work is carried out.
ii. Make sure all of the equipment in good condition.
iii. Make sure the distributor leverage at the chosen value.
iv.
Read the constant value of data to get a best result.
v. Readings taken three times to get accurate results by averaging the data.
7/27/2019 PELTON & FRANCIS TURBINES
http://slidepdf.com/reader/full/pelton-francis-turbines 37/37
10.0 DISCUSSION
From these experiments, we can see the relationship between the flow rate (Q),
velocity (v), speed (n), power and efficiency of a Francis turbine. Generally, the function
of turbines is to get electricity converted from natural hydraulic power. Francis turbine
may also be used for pumped storage, where a reservoir is filled by the turbine (acting as a
pump) during low power demand, and then reversed and used to generate power during
peak demand.
11.0 CONCLUSION
The experimental objective is achieved. In producing the highest power through
turbines, all factors must be taken. The same flow rate produces a different velocity.
While the velocity of water will produce a different power and efficiency according to the
different capabilities of the turbine. Factors such as the flow rate, velocity, power and
efficiency of this interaction and should be taken into account. Results of experiments
carried out showed the relationship between the head, flow rate, velocity, power and
efficiency were produce the desired energy. Aperture-opening in these experiments
showed differences and advantages between an aperture with the aperture so that we can
to reflect the actual operating situation of a Francis turbine.
12.0 REFERENCE
i. http://www.brighthub.com/engineering/mechanical/articles/27407.aspx
(Accessed on 27 November 2011
ii. Mifflin, Boston, MA.White, F.M. (1994). Fluid Mechanics, 3rd edition, McGraw-Hill,
Inc., New York, NY.
iii. R. E. Featherstone, C. Naluri. (1995.) Civil Engineering Hydraulics. Bodmin, Cornwall:
Blackwell Science