Embed Size (px)
Citation preview
Propagation and localization of electromagnetic waves in quasiperiodic serial loop structures
H. Aynaou,1 E. H. El Boudouti,1 Y. El Hassouani,1 A. Akjouj,2,* B. Djafari-Rouhani,2 J. Vasseur,2
A. Benomar,2 and V. R. Velasco3
1Laboratoire de Dynamique et d’Optique des Matériaux, Département de Physique, Faculté des Sciences,Université Mohamed Premier, 60000 Oujda, Morocco
2Laboratoire de Dynamique et Structure des Matériaux Moléculaires, UMR CNRS 8024, UFR de Physique, Université de Lille 1,F-59655 Villeneuve d’Ascq, France
3Instituto de Ciencia de Materiales de Madrid, CSIC, Sor Juana Inés de la Cruz 3, 28049 Madrid, Spain�Received 14 March 2005; revised manuscript received 9 August 2005; published 3 November 2005�
We study the propagation of electromagnetic waves in one-dimensional quasiperiodic photonic band gapstructures made of serial loop structures separated by segments. Different quasiperiodic structures such asFibonacci, Thue-Morse, Rudin-Shapiro, and double period are investigated with special focus on the Fibonaccistructure. Depending on the lengths of the two arms constituting the loops, one can distinguish two particularcases. �i� There are symmetric loop structures, which are shown to be equivalent to impedance-modulatedmediums. In this case, it is found that besides the existence of extended and forbidden modes, some narrowfrequency bands appear as defect modes in the transmission spectrum inside the gaps. These modes are shownto be localized within only one of the two types of blocks constituting the structure. An analysis of thetransmission phase time enables us to derive the group velocity as well as the density of states in thesestructures. In particular, the stop bands �localized modes� may give rise to unusual �strong normal� dispersionin the gaps, yielding fast �slow� group velocities above �below� the velocity of light. �ii� There are alsoasymmetric loop structures, where the loops play the role of resonators that may introduce transmission zerosand hence additional gaps unnoticed in the case of simple impedance-modulated mediums. A comparison of thetransmission amplitude and phase time of Fibonacci systems with those of other quasiperiodic systems is alsooutlined. In particular, it was shown that these structures present similar behaviors in the transmission spectrainside the regions of extended modes, whereas they present different localized modes inside the gaps. Experi-ments and numerical calculations are in very good agreement.
DOI: 10.1103/PhysRevE.72.056601 PACS number�s�: 41.20.Jb, 77.84.Lf
I. INTRODUCTION
The study of elementary excitations in multilayered struc-tures with constituents arranged in quasiperiodic sequenceshas been an active field of research during the last decade�1�. Among them, optical waves in quasiperiodic photoniccrystals have received a great deal of attention so as to showthe localization of light incident on dielectric multilayers�2–14�. These structures have been proposed to design opti-cal microcavities �15� and omnidirectional reflectors �16� ofpractical interest. Recently, it was shown �7� experimentallythat Fibonacci and aperiodic dielectric multilayers with inter-nal symmetry may have potential applications in multiwave-length narrow band optical filters and wavelength divisionmultiplexing systems. Also, it was demonstrated �8� thatthese systems can provide an interesting alternative to regu-lar photonic crystals for the realization of photonic devices,such as optical filters with a self-similar spectrum and a highwavelength selectivity in the band edge region. Because oftheir noninteracting nature, electromagnetic waves providean excellent tool for probing the localization phenomena�3,4� in comparison with other excitations such as electronicwaves. Until now, as far as we know, mainly electromagnetic
wave propagation in one-dimensional �1D� quasiperiodicsystems has been studied in 1D Fibonacci lossless multilay-ered media �3–8�.
In the present paper, we consider a different quasiperiodicphotonic crystal made of segments and loops �Fig. 1�, calleda Fibonacci loop structure �FLS�. Such a structure maypresent similar results to those of layered media for sym-metrical loops. However, the results are quite different forasymmetrical loops as the latter may introduce transmission
*Corresponding author. Electronic address:[email protected]
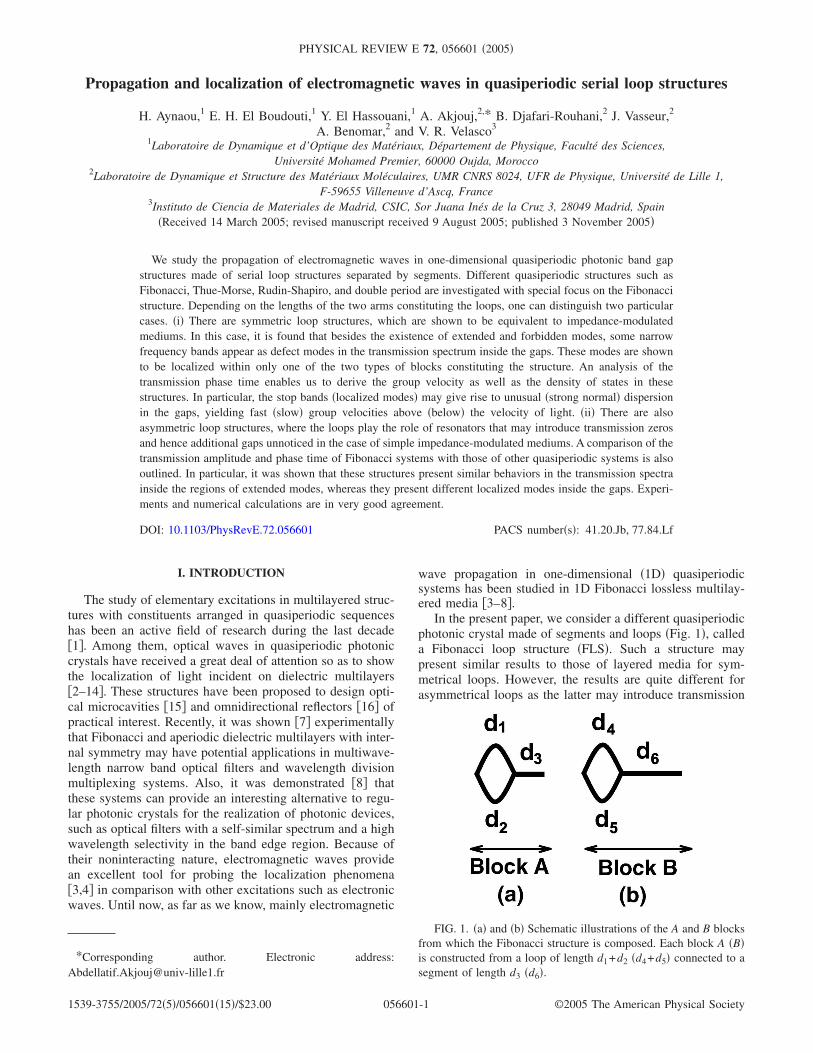
FIG. 1. �a� and �b� Schematic illustrations of the A and B blocksfrom which the Fibonacci structure is composed. Each block A �B�is constructed from a loop of length d1+d2 �d4+d5� connected to asegment of length d3 �d6�.
PHYSICAL REVIEW E 72, 056601 �2005�
1539-3755/2005/72�5�/056601�15�/$23.00 ©2005 The American Physical Society056601-1
zeros and hence new gaps in the transmission spectrum un-noticed in layered media. Also, when the media constitutingthe FLS are made of standard coaxial cables of the order of1 m with small cross sections, the propagation becomesmonomode and one can obtain very accurate experimentalresults that may be fitted with a simple 1D theoretical model.In two recent papers �17,18�, we have presented these resultsin the case of periodic loop structures �PLSs� made of co-axial cables. In particular, we have shown that these struc-tures may present large stop bands and are good candidatesfor photonic band gap �PBG� materials �19�. In addition,measurements of the amplitude and the phase of the trans-mission enabled us to deduce several properties of the wavepropagation through such structures, such as dispersioncurves, phase times, or equivalently density of states, as wellas group velocities. We have also shown that the introductionof a single defect in the PLS gives rise to well-defined defectmodes inside the band gaps in the transmission spectra.Based on the above knowledge in periodic loop structures,the object of this paper is to put emphasis on similar phe-nomena in quasiperiodic loop structures which have not beeninvestigated before. The results are also compared with thoseof the periodic structures obtained before. In particular, weshow that besides to extended modes that characterize peri-odic structures, quasiperiodic systems may exhibit newmodes showing self-similarities in the amplitude and thephase of the transmission spectrum. These modes are relatedto the quasiperiodicity of the system and are without analogin periodic systems.
In a recent work �20�, Zhang et al. studied theoreticallyand experimentally three-dimensional PBG systems formedby segments and symmetrical loops made of coaxial cablesarranged in a diamond structure. In addition to the Andersonlocalized state observed in random structures, defect modesare introduced in the gap by changing the length of one loopin an ordered network. However, the peak associated withthe defect mode is not well defined because of the dissipationin the cables. In this article, we show that a 1D structuremade of segments and loops may clearly show the origin ofthe band gap of Fibonacci structures as a function of thedifferent lengths of segments and loops. In addition, weshow that in addition to the transmission amplitude, ananalysis of the transmission phase time enables us to deter-mine the density of states as well as the group velocities inthese structures. The quasiperiodic structures are generallyformed as substitutional sequences built of two differentbuilding blocks A and B. One of the well-known examples isthe Fibonacci sequence Sj+1=SjSj−1 with the initial condi-tions S1=A, S2=AB, where j is the generation number. Forexample S3=ABA, S4=ABAAB, S5=ABAABABA , . . . and thenumber of building blocks A and B in the infinite order se-quence is equal to the golden mean number �= �1+�5� /2 forlarge j. In this work, we consider that the block A �B� isconstructed of a loop of length d1+d2 �d4+d5� connected to asegment of length d3 �d6� �all the six lengths are consideredto be different from each other; see Fig. 1�. Let us notice thatsome preliminary results of this work are presented else-where �21�.
The theoretical system developed here falls within theframework of the Green’s function method, which we recall
briefly in Sec. II. Section III is devoted to a numerical dis-cussion of the theoretical results and the comparison to theexperimental measurements of the electromagnetic transmis-sion spectra through a finite FLS composed of standard co-axial cables. A comparison of the Fibonacci transmission am-plitude and phase time with those obtained in otherquasiperiodic structures is illustrated in Sec. IV. Finally someconclusions are drawn in Sec. V.
II. METHOD OF THEORETICAL AND NUMERICALCALCULATION
A. Interface response theory of continuous media
Our theoretical analysis is performed with the help of theinterface response theory of continuous media �22�, whichallows calculating the Green’s function of any compositematerial. In what follows, we present the basic concept andthe fundamental equations of this theory �22�. Let us con-sider any composite material contained in its space of defi-nition D and formed out of N different homogeneous pieceslocated in their domains Di. Each piece is bounded by aninterface Mi, adjacent in general to j �1� j�J� other piecesthrough subinterface domains Mij. The ensemble of all theseinterface spaces Mi will be called the interface space M ofthe composite material. The elements of the Green’s functiong�DD� of any composite material can be obtained from �22�
g�DD� = G�DD� − G�DM�G−1�MM�G�MD�
+ G�DM�G−1�MM�g�MM�G−1�MM�G�MD� ,
�1�
where G�DD� is the reference Green’s function formed outof truncated pieces in Di of the bulk Green’s functions of theinfinite continuous media and g�MM� is the interface ele-ment of the Green’s function of the composite system. Theinverse of g�MM� is obtained as a superposition of the dif-ferent �gi�Mi ,Mi��−1, where gi�Mi ,Mi� is the interfaceGreen’s function for each constituent i of the composite sys-tem �22�. Knowledge of the inverse of g�MM� is sufficient tocalculate the interface states of a composite system throughthe relation �22�
det�g−1�MM�� = 0. �2�
Moreover if U�D� represents an eigenvector of the refer-ence system, Eq. �1� enables the calculation of the eigenvec-tors u�D� of the composite material and
u�D� = U�D� − U�M�G−1�MM�G�MD�
+ U�M�G−1�MM�g�MM�G−1�MM�G�MD� . �3�
In Eq. �3�, U�D�, U�M�, and u�D� are row vectors. Equa-tion �3� provides a description of all the waves reflected andtransmitted by the interfaces, as well as the reflection andtransmission coefficients of the composite system. ln thiscase, U�D� is a bulk wave launched in one homogeneouspiece of the composite material �23�.
AYNAOU et al. PHYSICAL REVIEW E 72, 056601 �2005�
056601-2
B. Inverse surface Green’s functions of the elementaryconstituents
We consider an infinite homogeneous isotropic dielectricwire i characterized by its characteristic impedance Zi. TheFourier transformed Green’s function between two points xand x� of this wire is
Gi�x,x�� =jZi
2e−�i�x−x��, �4�
with
�i = − j�
c��i, �5�
where �i is the relative permittivity, � the angular frequencyof the wave, c the speed of light in vacuum, and j=�−1.
Before addressing the problem of a FLS, it is helpful toknow the surface elements of its elementary constituents,namely, the Green’s function of a finite segment of length di,of a loop �k , l� made of two wires k and l of lengths dk and dl,respectively, and of a semi-infinite wire s. The finite segmentis bounded by two free surfaces located at x=−di /2 and x= +di /2. These surface elements can be written in the formof a �2�2� matrix gi�MM�, within the interface space Mi
= �−di /2 , +di /2�. The inverse of this matrix takes the follow-ing form �23�:
�gi�MM��−1 =Ci
ZiSi−
1
ZiSi
−1
ZiSi
Ci
ZiSi
, �6�
for the segments i=3 in the block A and i=6 in the block B�Fig. 1�.
In the same way, the inverse of the Green’s function of theloop �k , l� is obtained as �23�
�gk,l�MM��−1 =Ck
ZkSk+
Cl
ZlSl−
1
ZkSk−
1
ZlSl
−1
ZkSk−
1
ZlSl
Ck
ZkSk+
Cl
ZlSl
, �7�
where �k , l�= �1,2� in the block A and �4,5� in the block B�Fig. 1�. Ci=cos��� /c���idi� and Si=sin��� /c���idi� in Eqs.
�6� and �7�. The inverse of the surface element of a semi-infinite waveguide s characterized by its impedance Zs isgiven by
�gs�0,0��−1 = −j
Zs. �8�
From Eq. �7� one can deduce that a symmetric loop madeof identical wires of lengths dk=dl and impedances Zk=Zl isequivalent to a single segment of length dk and characterizedby the impedance Zk /2. Therefore, each block �Fig. 1� be-comes equivalent to two different segments connected to-gether �bisegment�. Experimental evidence of the existenceof band gaps and defect modes in 1D periodic photonic sys-tems constructed by two alternative coaxial cables of differ-ent characteristic impedances was presented recently �24,25�.However, the advantage of the symmetric loop structure liesin the fact that it is not necessary to have two segments ofdifferent nature to realize the contrast between the two con-stituent media of each block. This property could be of po-tential interest in optical waveguide structures.
C. Transmission coefficient
The 1D FLS waveguide can be considered as a finitenumber of blocks A and B pasted together according to theFibonacci sequence. The interface domain is made of all theconnection points between finite segments and loops. Withinthe total interface space of the finite FLS, the inverse of thematrix giving all the interface elements of the Green’s func-tion g is a finite tridiagonal matrix formed by linear super-position of the elements �gi�MM��−1 �Eqs. �6� and �7��. Theexplicit expression of the Green’s function elements of thefinite FLS may be written as
gf−1�MM� = �gf
−1��,�� gf−1��,r�
gf−1�r,�� gf
−1�r,r�� �9�
where the labels � �left� and r �right� refer to the two inter-faces bounding the FLS. The four matrix elements are realquantities, functions of the different elements of the constitu-ent’s elements gi�MM� �Eqs. �6� and �7��. If the finite com-posite system is connected on both sides to two homoge-neous waveguides labeled s, then an incident plane wavelaunched from the left waveguide gives rise to the transmis-sion function in the right waveguide as
CT =− 2jgf
−1�l,r�/Zs
gf−1��,��gf
−1�r,r� − �gf−1�l,r��2 − �1/Zs�2 − j�gf
−1��,�� + gf−1�r,r��/Zs
. �10�
The transmission function can be written in an explicitcomplex form as CT=a+ jb=�Tej� where T is the transmis-sion coefficient, �=arctan�b /a�±m� is the phase associatedwith the transmission field, and m is an integer. The firstderivative of � with respect to the frequency is related to the
delay time taken by the wave to traverse the structure. Thisquantity, called phase time, is defined by �26,27�
�� =d�
d�. �11�
PROPAGATION AND LOCALIZATION OF… PHYSICAL REVIEW E 72, 056601 �2005�
056601-3
From Eqs. �10� and �11�, one can deduce that the phasetime can be written as
�� =d
d�arg�gf
−1��,��gf−1�r,r� − �gf
−1��,r��2 − �1/Zs�2
− j�gf−1��,�� + gf
−1�r,r��/Zs�−1 +d
d�arg�gf
−1��,r�� .
�12�
Furthermore, the density of states �DOS� of the presentcomposite system from which we have subtracted the DOSof the same volumes of the semi-infinite waveguides s isgiven by �22,27�
n��� =1
�
d
d�arg�gf
−1��,��gf−1�r,r� − �gf
−1��,r��2 − �1/Zs�2
− j�gf−1��,�� + gf
−1�r,r��/Zs�−1. �13�
From Eqs. �12� and �13� one can deduce two cases, asfollows.
�i� The case of symmetrical loop structures that do notpresent transmission zeros �i.e., gf
−1�� ,r��0 in Eq. �10��.Then arg�gf
−1�� ,r��=0 and ��=�n���.�ii� The case of asymmetrical loop structures, where trans-
mission zeros occur at some frequencies we denote by �n�i.e., gf
−1�� ,r�=0 in Eq. �10�, n=1,2 , . . .�. Then the transmis-sion coefficient changes sign at �n and its phase exhibits ajump of �. In other words, the second term at the right-handside of Eq. �12� becomes �28�
d
d�arg�gf
−1��,r�� = � n
sgn� d
d��gf
−1��,r���=�n��� − �n�
�14�
where sgn means the sign function. This result means that����n��� as �� �Eq. �12�� may exhibit functions at thetransmission zeros that do not exist in the variation of theDOS �Eq. �13��. Both of these cases �i� and �ii� will be illus-trated below in relation to symmetric and asymmetric FLSs,respectively.
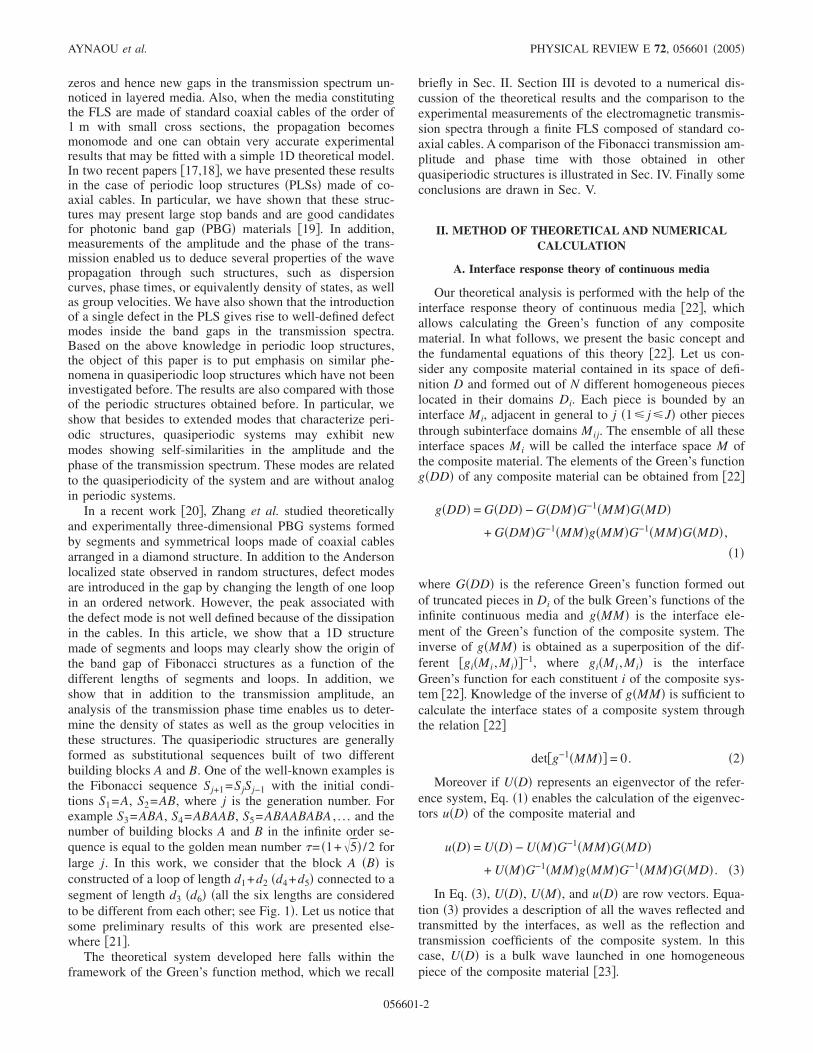
FIG. 2. Theoretical �solid curves� and experi-mental �dotted curves� variations of the transmis-sion coefficient as a function of the frequency fordifferent generations Sj �j=3–7� of the Fibonacciloop structure. The lengths of the different co-axial cables are d1=d2=d3=d4=d5=1 m, d6
=2 m.
AYNAOU et al. PHYSICAL REVIEW E 72, 056601 �2005�
056601-4
III. NUMERICAL AND EXPERIMENTAL RESULTS
For the sake of simplicity, we have limited ourselves tothe case of media constituting a FLS made of standardcoaxial cables �i.e., Zi=Z=50 � and �i=�=2.3 �i=1,2 , . . . ,6��. Also in order to understand the effect of seg-ments and loops in the FLS, we shall emphasize two particu-lar cases.
�1� The case where the loops in each block are symmetri-cal and identical �i.e., d1=d2=d4=d5=d=1 m� while the seg-ments are supposed to be different �we labeled d3=dA in theblock A and d6=dB in the block B� �see Fig. 1�. This struc-ture is equivalent to the one studied in Ref. �29� where eachblock is composed of a bilayer �see also Sec. II B�.
�2� The case where the segments are considered to beidentical �i.e., d3=d6=d=1 m� whereas the loops are sup-posed to be different. We have kept a symmetrical loop in theA block �i.e., d1=d2=d=1 m� and chosen an asymmetricalloop in the B block �i.e., d4�d5�1 m, without changing thetotal length of the loop d4+d5=2 m� �see Fig. 1�.
A. Case of symmetrical and identical loops in A and B blocks
As mentioned in Sec. II B, the symmetrical loops in A andB blocks are equivalent to segments of the same length d=1 m but with half impedance Z /2=25 �, while the seg-ments in A and B blocks have different lengths, dA=1 m inblock A and dB=2 m in block B, and are characterized by thesame impedance Z=50 �. Figures 2�a�–2�e� show the trans-mission coefficient for the generations S3 �three blocks�, S4�five blocks�, S5 �eight blocks�, S6 �13 blocks�, and S7 �21blocks�, respectively. The solid curves represent the theoret-ical results whereas the dotted curves correspond to the ex-perimental ones. The experiments were performed usingstandard coaxial cables assembled together with metallicT-shaped connectors. The cross section of the cables beingnegligible compared to their length and to the propagationwavelength, the assumption of monomode propagation isthen satisfied. The transmission measurements have been re-alized by using the tracking generator coupled to a spectrumanalyzer in the frequency range of 10–300 MHz. The attenu-ation inside the coaxial cables was simulated by introducinga complex relative dielectric permittivity ��=��− j���. Theattenuation coefficient �� can be expressed as ��=��� /c. Onthe other hand, the attenuation specification data supplied bythe manufacturer of the coaxial cables in the frequency rangeof 10–300 MHz can be approximately fitted with the expres-sion ln����=a+b ln���, where a and b are two constants.From this fitting procedure, a useful expression for �� as afunction of frequency can be obtained under the form ��=0.017f−0.5 where the frequency f is expressed in hertz. Theexperimental results are very well fitted by the 1D modelusing the Green’s function method. One can notice in Fig. 2that for a given generation the attenuation inside the cablesinduces transmission depletion especially at high frequen-cies. Two regions of frequencies may be distinguished inFigs. 2�a�–2�e�: the regions where the transmission fallsdown rapidly to zero as the generation number increases�these regions correspond to the forbidden modes �gaps�� andthe regions where the transmission is more noticeable around
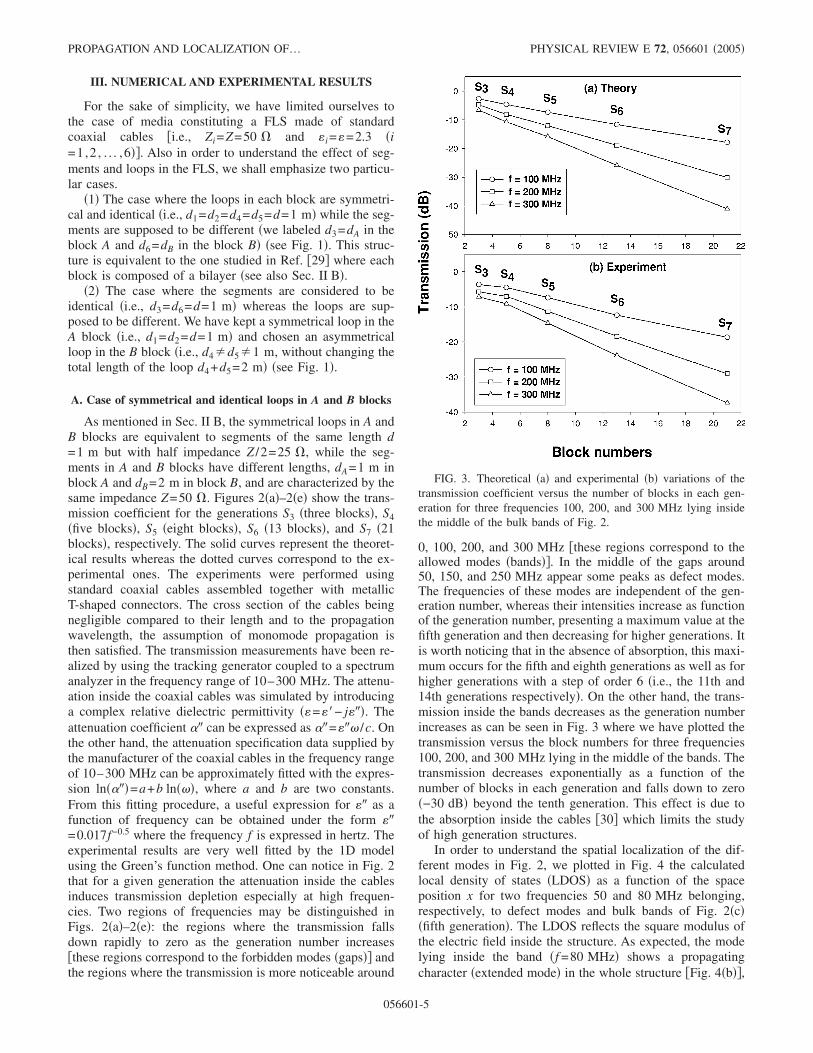
0, 100, 200, and 300 MHz �these regions correspond to theallowed modes �bands��. In the middle of the gaps around50, 150, and 250 MHz appear some peaks as defect modes.The frequencies of these modes are independent of the gen-eration number, whereas their intensities increase as functionof the generation number, presenting a maximum value at thefifth generation and then decreasing for higher generations. Itis worth noticing that in the absence of absorption, this maxi-mum occurs for the fifth and eighth generations as well as forhigher generations with a step of order 6 �i.e., the 11th and14th generations respectively�. On the other hand, the trans-mission inside the bands decreases as the generation numberincreases as can be seen in Fig. 3 where we have plotted thetransmission versus the block numbers for three frequencies100, 200, and 300 MHz lying in the middle of the bands. Thetransmission decreases exponentially as a function of thenumber of blocks in each generation and falls down to zero�−30 dB� beyond the tenth generation. This effect is due tothe absorption inside the cables �30� which limits the studyof high generation structures.
In order to understand the spatial localization of the dif-ferent modes in Fig. 2, we plotted in Fig. 4 the calculatedlocal density of states �LDOS� as a function of the spaceposition x for two frequencies 50 and 80 MHz belonging,respectively, to defect modes and bulk bands of Fig. 2�c��fifth generation�. The LDOS reflects the square modulus ofthe electric field inside the structure. As expected, the modelying inside the band �f =80 MHz� shows a propagatingcharacter �extended mode� in the whole structure �Fig. 4�b��,
FIG. 3. Theoretical �a� and experimental �b� variations of thetransmission coefficient versus the number of blocks in each gen-eration for three frequencies 100, 200, and 300 MHz lying insidethe middle of the bulk bands of Fig. 2.
PROPAGATION AND LOCALIZATION OF… PHYSICAL REVIEW E 72, 056601 �2005�
056601-5
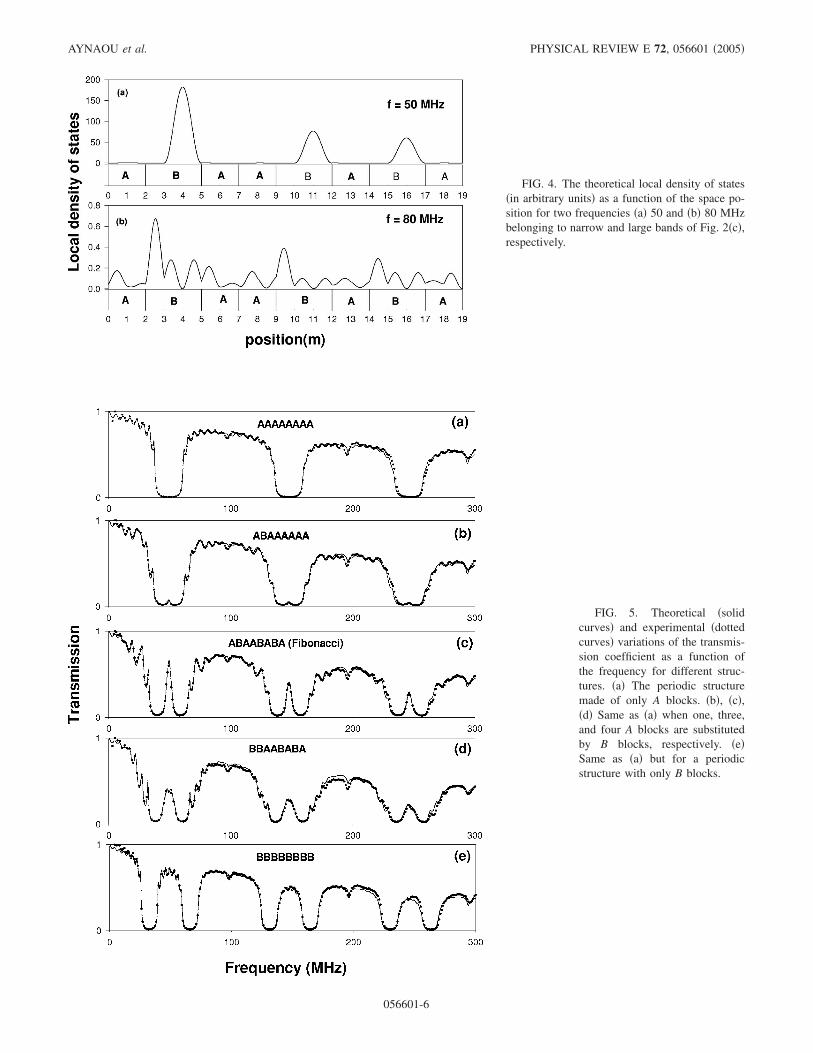
FIG. 4. The theoretical local density of states�in arbitrary units� as a function of the space po-sition for two frequencies �a� 50 and �b� 80 MHzbelonging to narrow and large bands of Fig. 2�c�,respectively.
FIG. 5. Theoretical �solidcurves� and experimental �dottedcurves� variations of the transmis-sion coefficient as a function ofthe frequency for different struc-tures. �a� The periodic structuremade of only A blocks. �b�, �c�,�d� Same as �a� when one, three,and four A blocks are substitutedby B blocks, respectively. �e�Same as �a� but for a periodicstructure with only B blocks.
AYNAOU et al. PHYSICAL REVIEW E 72, 056601 �2005�
056601-6
whereas the mode associated with the peak inside the firstgap �f =50 MHz� shows a strong localization in the B blocksand in particular in the segment regions of length dB=2 m�Fig. 4�a��. The same results are obtained for the other gen-erations. These results clearly show that the modes inside thegaps are localized modes induced by the different segmentsinside the B blocks �see also the discussion of Fig. 7 below�.The experimental verification of the nature of the defectmodes inside the gaps is presented in Fig. 5. Figure 5�a�presents the transmission coefficient of a periodic structuremade of only A blocks �8A�. It can be seen that the band gapstructure does not show any features inside the gaps. Now,by substituting one A block in the structure by one B block�Fig. 5�b��, small defect peaks appear in the middle of thegaps. By increasing the number of B blocks substituted in theperiodic 8A blocks �Figs. 5�c� and 5�d��, other modes detachfrom the allowed bands and fall inside the gaps, giving riseto new ordered bulk bands when all the A blocks are replacedby the B blocks �Fig. 5�e��. These results show that the trans-mission coefficient of the Fibonacci structure �Fig. 5�c��composed of binary A and B blocks may be considered as anintermediate one between those associated with finite peri-odic systems formed by A blocks and by B blocks, respec-tively.
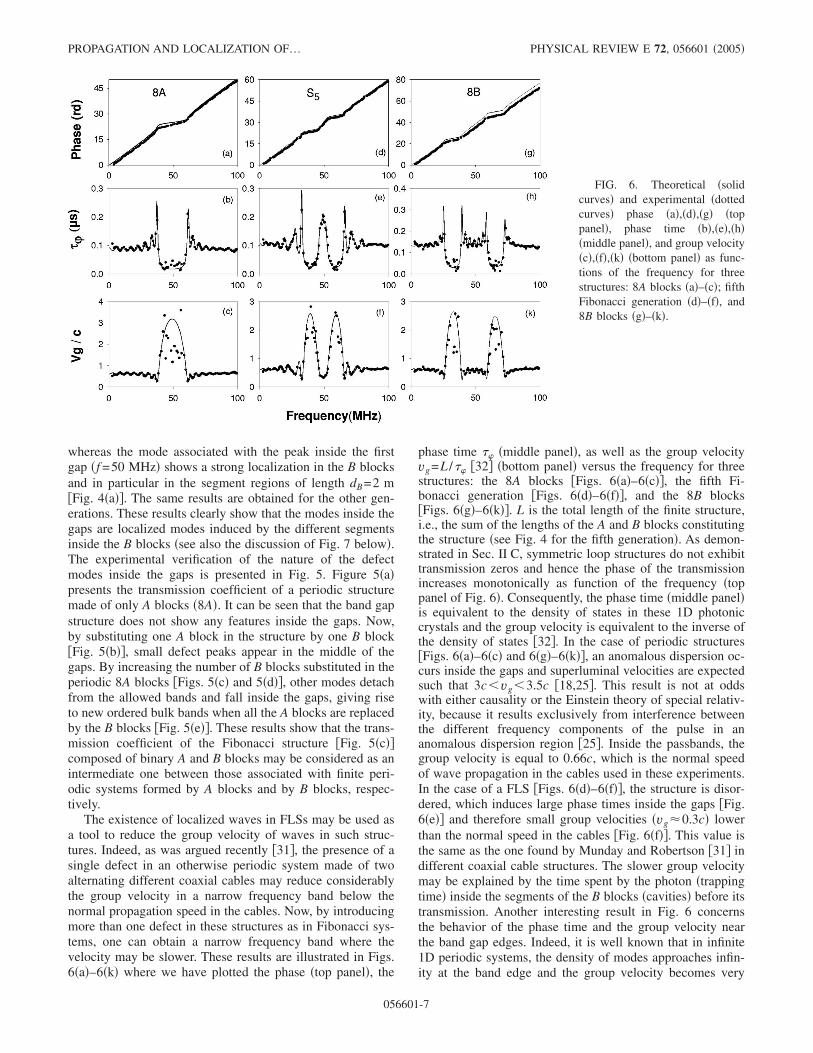
The existence of localized waves in FLSs may be used asa tool to reduce the group velocity of waves in such struc-tures. Indeed, as was argued recently �31�, the presence of asingle defect in an otherwise periodic system made of twoalternating different coaxial cables may reduce considerablythe group velocity in a narrow frequency band below thenormal propagation speed in the cables. Now, by introducingmore than one defect in these structures as in Fibonacci sys-tems, one can obtain a narrow frequency band where thevelocity may be slower. These results are illustrated in Figs.6�a�–6�k� where we have plotted the phase �top panel�, the
phase time �� �middle panel�, as well as the group velocityvg=L /�� �32� �bottom panel� versus the frequency for threestructures: the 8A blocks �Figs. 6�a�–6�c��, the fifth Fi-bonacci generation �Figs. 6�d�–6�f��, and the 8B blocks�Figs. 6�g�–6�k��. L is the total length of the finite structure,i.e., the sum of the lengths of the A and B blocks constitutingthe structure �see Fig. 4 for the fifth generation�. As demon-strated in Sec. II C, symmetric loop structures do not exhibittransmission zeros and hence the phase of the transmissionincreases monotonically as function of the frequency �toppanel of Fig. 6�. Consequently, the phase time �middle panel�is equivalent to the density of states in these 1D photoniccrystals and the group velocity is equivalent to the inverse ofthe density of states �32�. In the case of periodic structures�Figs. 6�a�–6�c� and 6�g�–6�k��, an anomalous dispersion oc-curs inside the gaps and superluminal velocities are expectedsuch that 3c�vg�3.5c �18,25�. This result is not at oddswith either causality or the Einstein theory of special relativ-ity, because it results exclusively from interference betweenthe different frequency components of the pulse in ananomalous dispersion region �25�. Inside the passbands, thegroup velocity is equal to 0.66c, which is the normal speedof wave propagation in the cables used in these experiments.In the case of a FLS �Figs. 6�d�–6�f��, the structure is disor-dered, which induces large phase times inside the gaps �Fig.6�e�� and therefore small group velocities �vg�0.3c� lowerthan the normal speed in the cables �Fig. 6�f��. This value isthe same as the one found by Munday and Robertson �31� indifferent coaxial cable structures. The slower group velocitymay be explained by the time spent by the photon �trappingtime� inside the segments of the B blocks �cavities� before itstransmission. Another interesting result in Fig. 6 concernsthe behavior of the phase time and the group velocity nearthe band gap edges. Indeed, it is well known that in infinite1D periodic systems, the density of modes approaches infin-ity at the band edge and the group velocity becomes very
FIG. 6. Theoretical �solidcurves� and experimental �dottedcurves� phase �a�,�d�,�g� �toppanel�, phase time �b�,�e�,�h��middle panel�, and group velocity�c�,�f�,�k� �bottom panel� as func-tions of the frequency for threestructures: 8A blocks �a�–�c�; fifthFibonacci generation �d�–�f�, and8B blocks �g�–�k�.
PROPAGATION AND LOCALIZATION OF… PHYSICAL REVIEW E 72, 056601 �2005�
056601-7
small. In a finite system, however, the electromagnetic modedensity is an oscillating function rather than a monotonicfunction �Figs. 6�b� and 6�h��. The enhancement of the phasetime �density of states� at the band edges induces a smallgroup velocity �vg�0.2c� �Figs. 6�c� and 6�k�� which hasbeen shown to be of potential interest in application to bandedge loss and optical delay lines �33�. In the case of a FLS�Figs. 6�e� and 6�f�� the phase time and the group velocitypresent similar behaviors at the band edges. However, it wasshown recently �8� that the band edge resonances in periodicphotonic systems are not localized states since their exten-sion scales linearly with the system size and they do notdecay to zero. In contrast, the Fibonacci band edge reso-nances will decay via a power law due to their criticallylocalized nature.
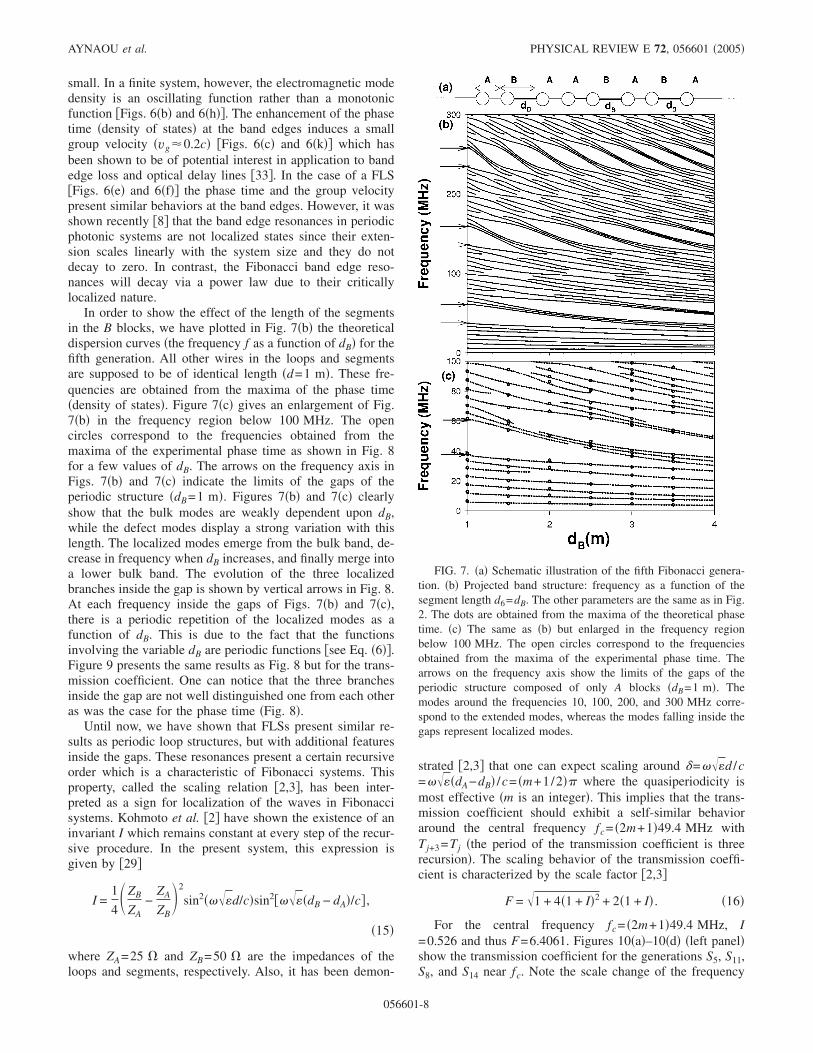
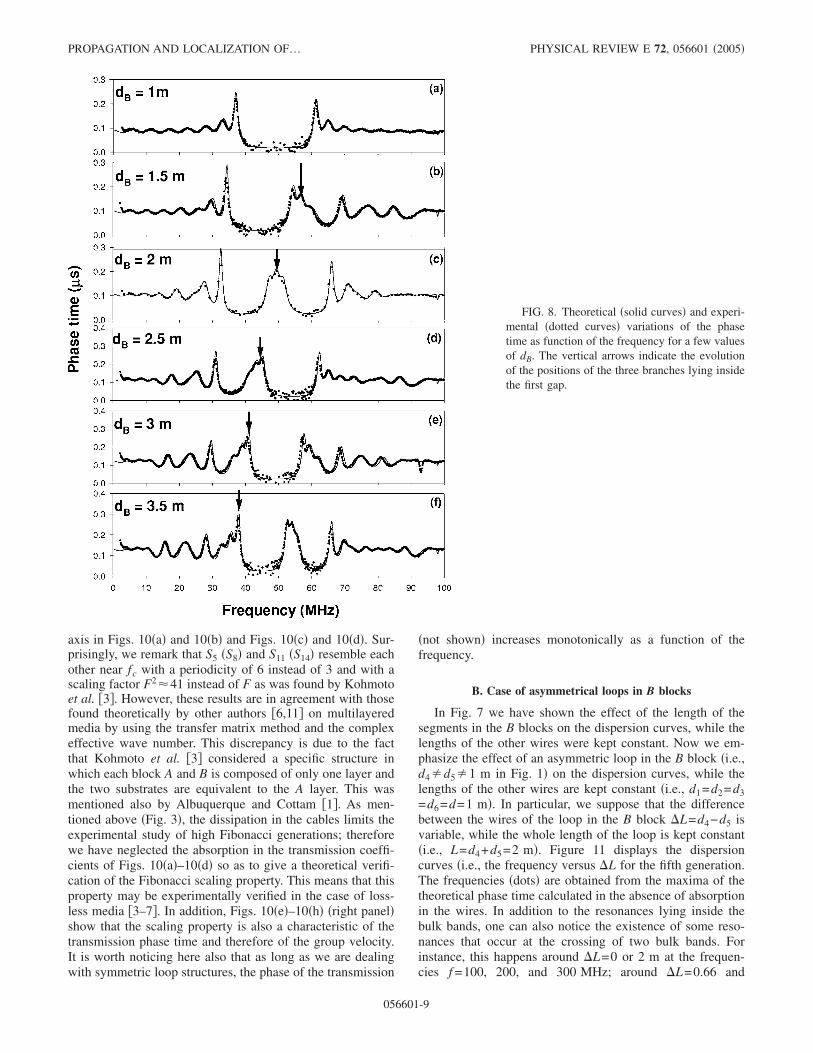
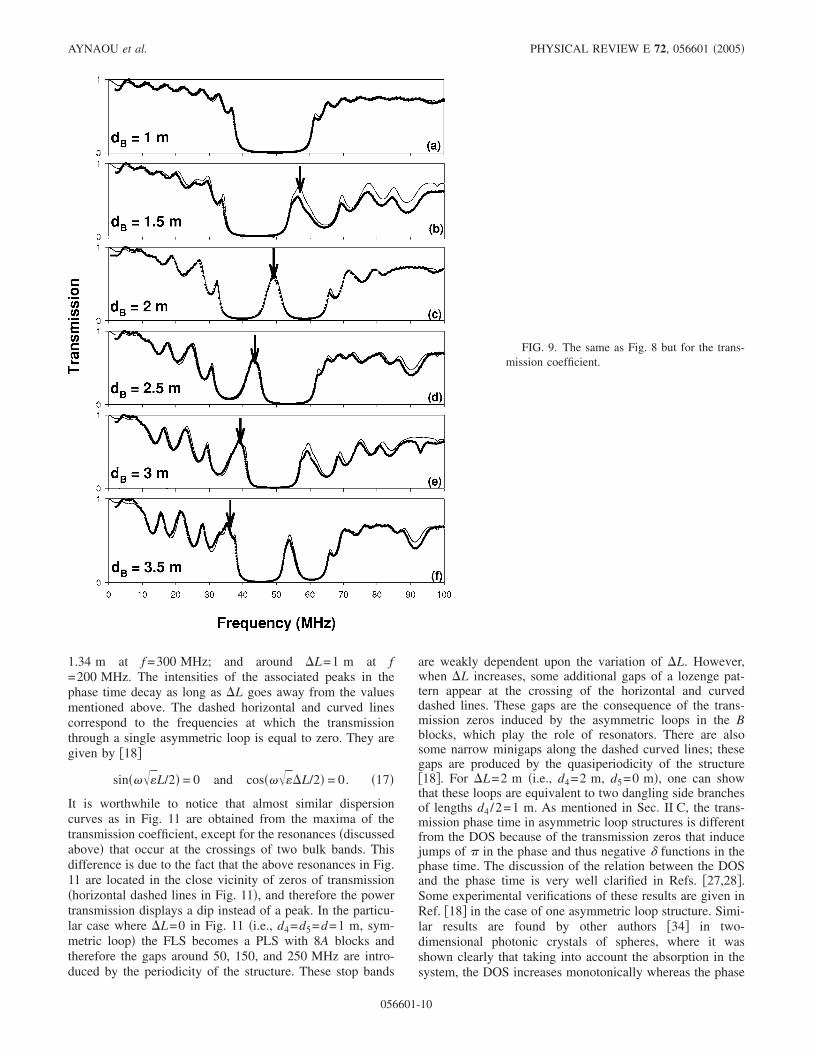
In order to show the effect of the length of the segmentsin the B blocks, we have plotted in Fig. 7�b� the theoreticaldispersion curves �the frequency f as a function of dB� for thefifth generation. All other wires in the loops and segmentsare supposed to be of identical length �d=1 m�. These fre-quencies are obtained from the maxima of the phase time�density of states�. Figure 7�c� gives an enlargement of Fig.7�b� in the frequency region below 100 MHz. The opencircles correspond to the frequencies obtained from themaxima of the experimental phase time as shown in Fig. 8for a few values of dB. The arrows on the frequency axis inFigs. 7�b� and 7�c� indicate the limits of the gaps of theperiodic structure �dB=1 m�. Figures 7�b� and 7�c� clearlyshow that the bulk modes are weakly dependent upon dB,while the defect modes display a strong variation with thislength. The localized modes emerge from the bulk band, de-crease in frequency when dB increases, and finally merge intoa lower bulk band. The evolution of the three localizedbranches inside the gap is shown by vertical arrows in Fig. 8.At each frequency inside the gaps of Figs. 7�b� and 7�c�,there is a periodic repetition of the localized modes as afunction of dB. This is due to the fact that the functionsinvolving the variable dB are periodic functions �see Eq. �6��.Figure 9 presents the same results as Fig. 8 but for the trans-mission coefficient. One can notice that the three branchesinside the gap are not well distinguished one from each otheras was the case for the phase time �Fig. 8�.
Until now, we have shown that FLSs present similar re-sults as periodic loop structures, but with additional featuresinside the gaps. These resonances present a certain recursiveorder which is a characteristic of Fibonacci systems. Thisproperty, called the scaling relation �2,3�, has been inter-preted as a sign for localization of the waves in Fibonaccisystems. Kohmoto et al. �2� have shown the existence of aninvariant I which remains constant at every step of the recur-sive procedure. In the present system, this expression isgiven by �29�
I =1
4�ZB
ZA−
ZA
ZB�2
sin2����d/c�sin2�����dB − dA�/c� ,
�15�
where ZA=25 � and ZB=50 � are the impedances of theloops and segments, respectively. Also, it has been demon-
strated �2,3� that one can expect scaling around =���d /c=����dA−dB� /c= �m+1/2�� where the quasiperiodicity ismost effective �m is an integer�. This implies that the trans-mission coefficient should exhibit a self-similar behavioraround the central frequency fc= �2m+1�49.4 MHz withTj+3=Tj �the period of the transmission coefficient is threerecursion�. The scaling behavior of the transmission coeffi-cient is characterized by the scale factor �2,3�
F = �1 + 4�1 + I�2 + 2�1 + I� . �16�
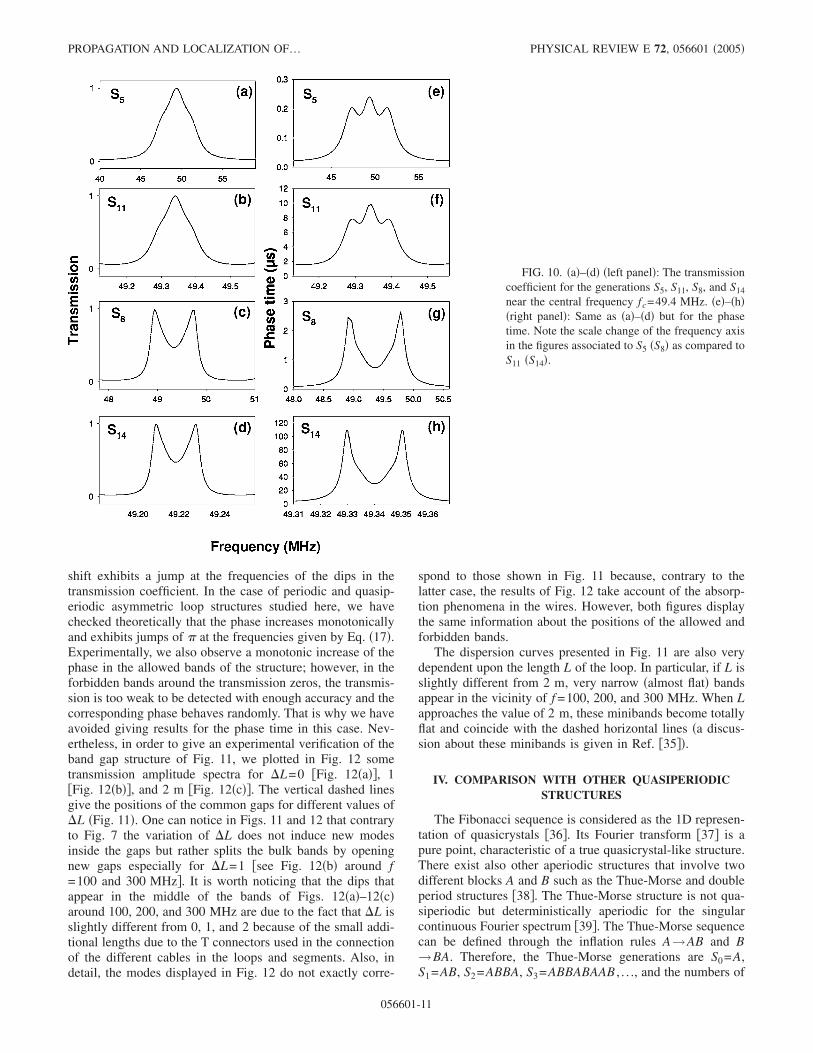
For the central frequency fc= �2m+1�49.4 MHz, I=0.526 and thus F=6.4061. Figures 10�a�–10�d� �left panel�show the transmission coefficient for the generations S5, S11,S8, and S14 near fc. Note the scale change of the frequency
FIG. 7. �a� Schematic illustration of the fifth Fibonacci genera-tion. �b� Projected band structure: frequency as a function of thesegment length d6=dB. The other parameters are the same as in Fig.2. The dots are obtained from the maxima of the theoretical phasetime. �c� The same as �b� but enlarged in the frequency regionbelow 100 MHz. The open circles correspond to the frequenciesobtained from the maxima of the experimental phase time. Thearrows on the frequency axis show the limits of the gaps of theperiodic structure composed of only A blocks �dB=1 m�. Themodes around the frequencies 10, 100, 200, and 300 MHz corre-spond to the extended modes, whereas the modes falling inside thegaps represent localized modes.
AYNAOU et al. PHYSICAL REVIEW E 72, 056601 �2005�
056601-8
axis in Figs. 10�a� and 10�b� and Figs. 10�c� and 10�d�. Sur-prisingly, we remark that S5 �S8� and S11 �S14� resemble eachother near fc with a periodicity of 6 instead of 3 and with ascaling factor F2�41 instead of F as was found by Kohmotoet al. �3�. However, these results are in agreement with thosefound theoretically by other authors �6,11� on multilayeredmedia by using the transfer matrix method and the complexeffective wave number. This discrepancy is due to the factthat Kohmoto et al. �3� considered a specific structure inwhich each block A and B is composed of only one layer andthe two substrates are equivalent to the A layer. This wasmentioned also by Albuquerque and Cottam �1�. As men-tioned above �Fig. 3�, the dissipation in the cables limits theexperimental study of high Fibonacci generations; thereforewe have neglected the absorption in the transmission coeffi-cients of Figs. 10�a�–10�d� so as to give a theoretical verifi-cation of the Fibonacci scaling property. This means that thisproperty may be experimentally verified in the case of loss-less media �3–7�. In addition, Figs. 10�e�–10�h� �right panel�show that the scaling property is also a characteristic of thetransmission phase time and therefore of the group velocity.It is worth noticing here also that as long as we are dealingwith symmetric loop structures, the phase of the transmission
�not shown� increases monotonically as a function of thefrequency.
B. Case of asymmetrical loops in B blocks
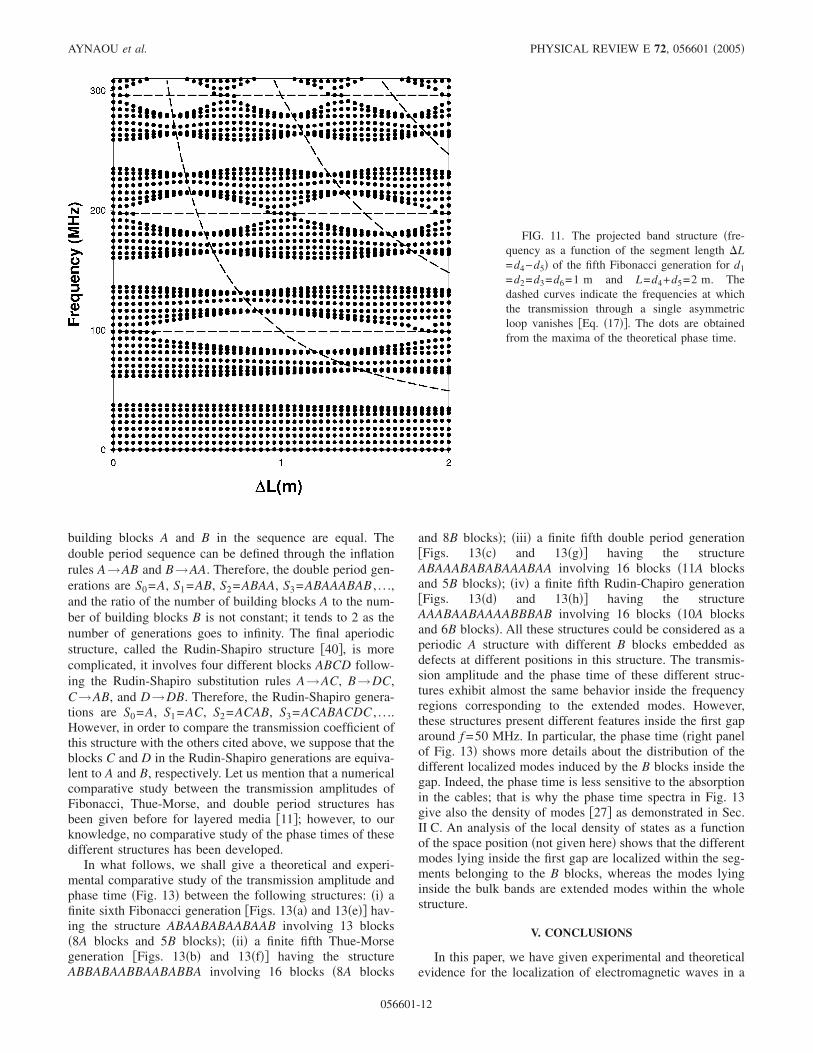
In Fig. 7 we have shown the effect of the length of thesegments in the B blocks on the dispersion curves, while thelengths of the other wires were kept constant. Now we em-phasize the effect of an asymmetric loop in the B block �i.e.,d4�d5�1 m in Fig. 1� on the dispersion curves, while thelengths of the other wires are kept constant �i.e., d1=d2=d3=d6=d=1 m�. In particular, we suppose that the differencebetween the wires of the loop in the B block L=d4−d5 isvariable, while the whole length of the loop is kept constant�i.e., L=d4+d5=2 m�. Figure 11 displays the dispersioncurves �i.e., the frequency versus L for the fifth generation.The frequencies �dots� are obtained from the maxima of thetheoretical phase time calculated in the absence of absorptionin the wires. In addition to the resonances lying inside thebulk bands, one can also notice the existence of some reso-nances that occur at the crossing of two bulk bands. Forinstance, this happens around L=0 or 2 m at the frequen-cies f =100, 200, and 300 MHz; around L=0.66 and
FIG. 8. Theoretical �solid curves� and experi-mental �dotted curves� variations of the phasetime as function of the frequency for a few valuesof dB. The vertical arrows indicate the evolutionof the positions of the three branches lying insidethe first gap.
PROPAGATION AND LOCALIZATION OF… PHYSICAL REVIEW E 72, 056601 �2005�
056601-9
1.34 m at f =300 MHz; and around L=1 m at f=200 MHz. The intensities of the associated peaks in thephase time decay as long as L goes away from the valuesmentioned above. The dashed horizontal and curved linescorrespond to the frequencies at which the transmissionthrough a single asymmetric loop is equal to zero. They aregiven by �18�
sin����L/2� = 0 and cos����L/2� = 0. �17�
It is worthwhile to notice that almost similar dispersioncurves as in Fig. 11 are obtained from the maxima of thetransmission coefficient, except for the resonances �discussedabove� that occur at the crossings of two bulk bands. Thisdifference is due to the fact that the above resonances in Fig.11 are located in the close vicinity of zeros of transmission�horizontal dashed lines in Fig. 11�, and therefore the powertransmission displays a dip instead of a peak. In the particu-lar case where L=0 in Fig. 11 �i.e., d4=d5=d=1 m, sym-metric loop� the FLS becomes a PLS with 8A blocks andtherefore the gaps around 50, 150, and 250 MHz are intro-duced by the periodicity of the structure. These stop bands
are weakly dependent upon the variation of L. However,when L increases, some additional gaps of a lozenge pat-tern appear at the crossing of the horizontal and curveddashed lines. These gaps are the consequence of the trans-mission zeros induced by the asymmetric loops in the Bblocks, which play the role of resonators. There are alsosome narrow minigaps along the dashed curved lines; thesegaps are produced by the quasiperiodicity of the structure�18�. For L=2 m �i.e., d4=2 m, d5=0 m�, one can showthat these loops are equivalent to two dangling side branchesof lengths d4 /2=1 m. As mentioned in Sec. II C, the trans-mission phase time in asymmetric loop structures is differentfrom the DOS because of the transmission zeros that inducejumps of � in the phase and thus negative functions in thephase time. The discussion of the relation between the DOSand the phase time is very well clarified in Refs. �27,28�.Some experimental verifications of these results are given inRef. �18� in the case of one asymmetric loop structure. Simi-lar results are found by other authors �34� in two-dimensional photonic crystals of spheres, where it wasshown clearly that taking into account the absorption in thesystem, the DOS increases monotonically whereas the phase
FIG. 9. The same as Fig. 8 but for the trans-mission coefficient.
AYNAOU et al. PHYSICAL REVIEW E 72, 056601 �2005�
056601-10
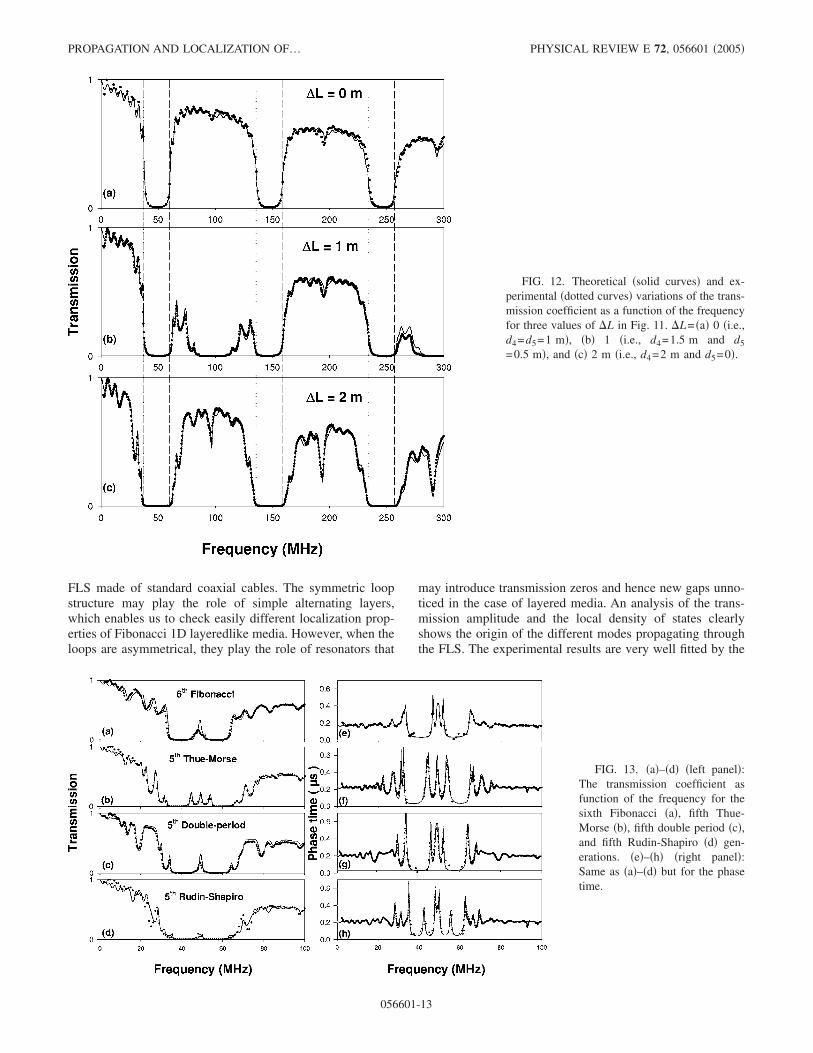
shift exhibits a jump at the frequencies of the dips in thetransmission coefficient. In the case of periodic and quasip-eriodic asymmetric loop structures studied here, we havechecked theoretically that the phase increases monotonicallyand exhibits jumps of � at the frequencies given by Eq. �17�.Experimentally, we also observe a monotonic increase of thephase in the allowed bands of the structure; however, in theforbidden bands around the transmission zeros, the transmis-sion is too weak to be detected with enough accuracy and thecorresponding phase behaves randomly. That is why we haveavoided giving results for the phase time in this case. Nev-ertheless, in order to give an experimental verification of theband gap structure of Fig. 11, we plotted in Fig. 12 sometransmission amplitude spectra for L=0 �Fig. 12�a��, 1�Fig. 12�b��, and 2 m �Fig. 12�c��. The vertical dashed linesgive the positions of the common gaps for different values ofL �Fig. 11�. One can notice in Figs. 11 and 12 that contraryto Fig. 7 the variation of L does not induce new modesinside the gaps but rather splits the bulk bands by openingnew gaps especially for L=1 �see Fig. 12�b� around f=100 and 300 MHz�. It is worth noticing that the dips thatappear in the middle of the bands of Figs. 12�a�–12�c�around 100, 200, and 300 MHz are due to the fact that L isslightly different from 0, 1, and 2 because of the small addi-tional lengths due to the T connectors used in the connectionof the different cables in the loops and segments. Also, indetail, the modes displayed in Fig. 12 do not exactly corre-
spond to those shown in Fig. 11 because, contrary to thelatter case, the results of Fig. 12 take account of the absorp-tion phenomena in the wires. However, both figures displaythe same information about the positions of the allowed andforbidden bands.
The dispersion curves presented in Fig. 11 are also verydependent upon the length L of the loop. In particular, if L isslightly different from 2 m, very narrow �almost flat� bandsappear in the vicinity of f =100, 200, and 300 MHz. When Lapproaches the value of 2 m, these minibands become totallyflat and coincide with the dashed horizontal lines �a discus-sion about these minibands is given in Ref. �35��.
IV. COMPARISON WITH OTHER QUASIPERIODICSTRUCTURES
The Fibonacci sequence is considered as the 1D represen-tation of quasicrystals �36�. Its Fourier transform �37� is apure point, characteristic of a true quasicrystal-like structure.There exist also other aperiodic structures that involve twodifferent blocks A and B such as the Thue-Morse and doubleperiod structures �38�. The Thue-Morse structure is not qua-siperiodic but deterministically aperiodic for the singularcontinuous Fourier spectrum �39�. The Thue-Morse sequencecan be defined through the inflation rules A→AB and B→BA. Therefore, the Thue-Morse generations are S0=A,S1=AB, S2=ABBA, S3=ABBABAAB , . . ., and the numbers of
FIG. 10. �a�–�d� �left panel�: The transmissioncoefficient for the generations S5, S11, S8, and S14
near the central frequency fc=49.4 MHz. �e�–�h��right panel�: Same as �a�–�d� but for the phasetime. Note the scale change of the frequency axisin the figures associated to S5 �S8� as compared toS11 �S14�.
PROPAGATION AND LOCALIZATION OF… PHYSICAL REVIEW E 72, 056601 �2005�
056601-11
building blocks A and B in the sequence are equal. Thedouble period sequence can be defined through the inflationrules A→AB and B→AA. Therefore, the double period gen-erations are S0=A, S1=AB, S2=ABAA, S3=ABAAABAB , . . .,and the ratio of the number of building blocks A to the num-ber of building blocks B is not constant; it tends to 2 as thenumber of generations goes to infinity. The final aperiodicstructure, called the Rudin-Shapiro structure �40�, is morecomplicated, it involves four different blocks ABCD follow-ing the Rudin-Shapiro substitution rules A→AC, B→DC,C→AB, and D→DB. Therefore, the Rudin-Shapiro genera-tions are S0=A, S1=AC, S2=ACAB, S3=ACABACDC , . . ..However, in order to compare the transmission coefficient ofthis structure with the others cited above, we suppose that theblocks C and D in the Rudin-Shapiro generations are equiva-lent to A and B, respectively. Let us mention that a numericalcomparative study between the transmission amplitudes ofFibonacci, Thue-Morse, and double period structures hasbeen given before for layered media �11�; however, to ourknowledge, no comparative study of the phase times of thesedifferent structures has been developed.
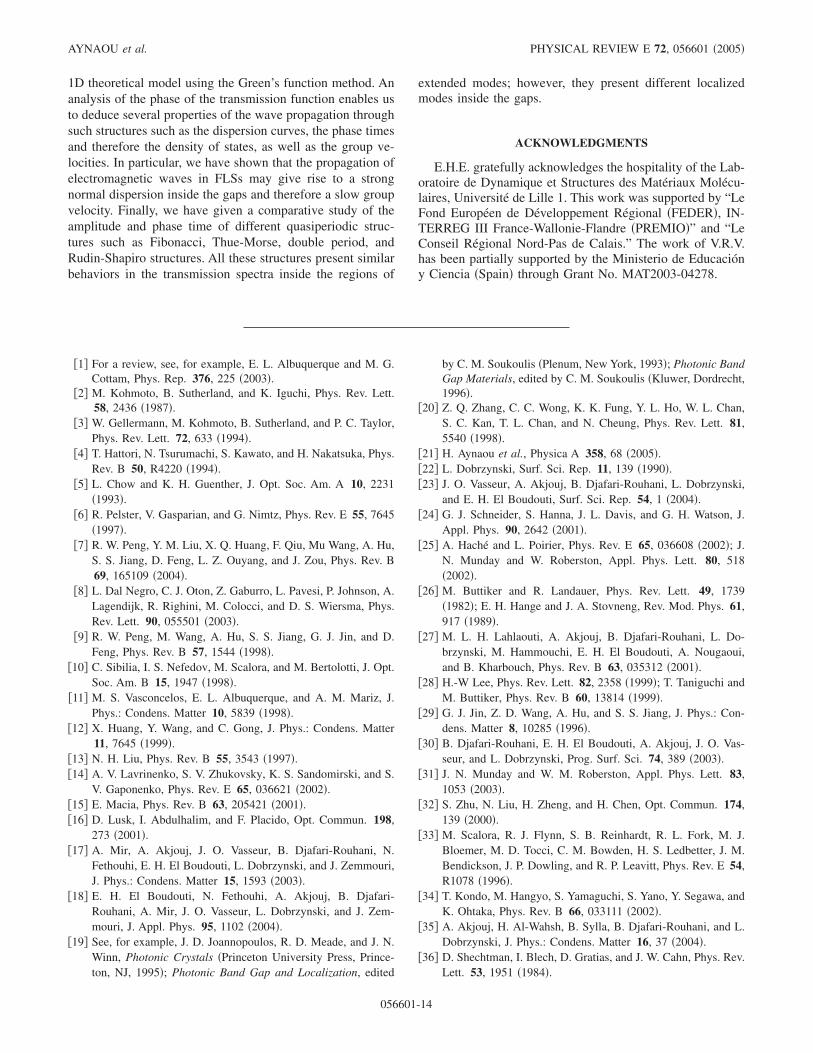
In what follows, we shall give a theoretical and experi-mental comparative study of the transmission amplitude andphase time �Fig. 13� between the following structures: �i� afinite sixth Fibonacci generation �Figs. 13�a� and 13�e�� hav-ing the structure ABAABABAABAAB involving 13 blocks�8A blocks and 5B blocks�; �ii� a finite fifth Thue-Morsegeneration �Figs. 13�b� and 13�f�� having the structureABBABAABBAABABBA involving 16 blocks �8A blocks
and 8B blocks�; �iii� a finite fifth double period generation�Figs. 13�c� and 13�g�� having the structureABAAABABABAAABAA involving 16 blocks �11A blocksand 5B blocks�; �iv� a finite fifth Rudin-Chapiro generation�Figs. 13�d� and 13�h�� having the structureAAABAABAAAABBBAB involving 16 blocks �10A blocksand 6B blocks�. All these structures could be considered as aperiodic A structure with different B blocks embedded asdefects at different positions in this structure. The transmis-sion amplitude and the phase time of these different struc-tures exhibit almost the same behavior inside the frequencyregions corresponding to the extended modes. However,these structures present different features inside the first gaparound f =50 MHz. In particular, the phase time �right panelof Fig. 13� shows more details about the distribution of thedifferent localized modes induced by the B blocks inside thegap. Indeed, the phase time is less sensitive to the absorptionin the cables; that is why the phase time spectra in Fig. 13give also the density of modes �27� as demonstrated in Sec.II C. An analysis of the local density of states as a functionof the space position �not given here� shows that the differentmodes lying inside the first gap are localized within the seg-ments belonging to the B blocks, whereas the modes lyinginside the bulk bands are extended modes within the wholestructure.
V. CONCLUSIONS
In this paper, we have given experimental and theoreticalevidence for the localization of electromagnetic waves in a
FIG. 11. The projected band structure �fre-quency as a function of the segment length L=d4−d5� of the fifth Fibonacci generation for d1
=d2=d3=d6=1 m and L=d4+d5=2 m. Thedashed curves indicate the frequencies at whichthe transmission through a single asymmetricloop vanishes �Eq. �17��. The dots are obtainedfrom the maxima of the theoretical phase time.
AYNAOU et al. PHYSICAL REVIEW E 72, 056601 �2005�
056601-12
FLS made of standard coaxial cables. The symmetric loopstructure may play the role of simple alternating layers,which enables us to check easily different localization prop-erties of Fibonacci 1D layeredlike media. However, when theloops are asymmetrical, they play the role of resonators that
may introduce transmission zeros and hence new gaps unno-ticed in the case of layered media. An analysis of the trans-mission amplitude and the local density of states clearlyshows the origin of the different modes propagating throughthe FLS. The experimental results are very well fitted by the
FIG. 12. Theoretical �solid curves� and ex-perimental �dotted curves� variations of the trans-mission coefficient as a function of the frequencyfor three values of L in Fig. 11. L= �a� 0 �i.e.,d4=d5=1 m�, �b� 1 �i.e., d4=1.5 m and d5
=0.5 m�, and �c� 2 m �i.e., d4=2 m and d5=0�.
FIG. 13. �a�–�d� �left panel�:The transmission coefficient asfunction of the frequency for thesixth Fibonacci �a�, fifth Thue-Morse �b�, fifth double period �c�,and fifth Rudin-Shapiro �d� gen-erations. �e�–�h� �right panel�:Same as �a�–�d� but for the phasetime.
PROPAGATION AND LOCALIZATION OF… PHYSICAL REVIEW E 72, 056601 �2005�
056601-13
1D theoretical model using the Green’s function method. Ananalysis of the phase of the transmission function enables usto deduce several properties of the wave propagation throughsuch structures such as the dispersion curves, the phase timesand therefore the density of states, as well as the group ve-locities. In particular, we have shown that the propagation ofelectromagnetic waves in FLSs may give rise to a strongnormal dispersion inside the gaps and therefore a slow groupvelocity. Finally, we have given a comparative study of theamplitude and phase time of different quasiperiodic struc-tures such as Fibonacci, Thue-Morse, double period, andRudin-Shapiro structures. All these structures present similarbehaviors in the transmission spectra inside the regions of
extended modes; however, they present different localizedmodes inside the gaps.
ACKNOWLEDGMENTS
E.H.E. gratefully acknowledges the hospitality of the Lab-oratoire de Dynamique et Structures des Matériaux Molécu-laires, Université de Lille 1. This work was supported by “LeFond Européen de Développement Régional �FEDER�, IN-TERREG III France-Wallonie-Flandre �PREMIO�” and “LeConseil Régional Nord-Pas de Calais.” The work of V.R.V.has been partially supported by the Ministerio de Educacióny Ciencia �Spain� through Grant No. MAT2003-04278.
�1� For a review, see, for example, E. L. Albuquerque and M. G.Cottam, Phys. Rep. 376, 225 �2003�.
�2� M. Kohmoto, B. Sutherland, and K. Iguchi, Phys. Rev. Lett.58, 2436 �1987�.
�3� W. Gellermann, M. Kohmoto, B. Sutherland, and P. C. Taylor,Phys. Rev. Lett. 72, 633 �1994�.
�4� T. Hattori, N. Tsurumachi, S. Kawato, and H. Nakatsuka, Phys.Rev. B 50, R4220 �1994�.
�5� L. Chow and K. H. Guenther, J. Opt. Soc. Am. A 10, 2231�1993�.
�6� R. Pelster, V. Gasparian, and G. Nimtz, Phys. Rev. E 55, 7645�1997�.
�7� R. W. Peng, Y. M. Liu, X. Q. Huang, F. Qiu, Mu Wang, A. Hu,S. S. Jiang, D. Feng, L. Z. Ouyang, and J. Zou, Phys. Rev. B69, 165109 �2004�.
�8� L. Dal Negro, C. J. Oton, Z. Gaburro, L. Pavesi, P. Johnson, A.Lagendijk, R. Righini, M. Colocci, and D. S. Wiersma, Phys.Rev. Lett. 90, 055501 �2003�.
�9� R. W. Peng, M. Wang, A. Hu, S. S. Jiang, G. J. Jin, and D.Feng, Phys. Rev. B 57, 1544 �1998�.
�10� C. Sibilia, I. S. Nefedov, M. Scalora, and M. Bertolotti, J. Opt.Soc. Am. B 15, 1947 �1998�.
�11� M. S. Vasconcelos, E. L. Albuquerque, and A. M. Mariz, J.Phys.: Condens. Matter 10, 5839 �1998�.
�12� X. Huang, Y. Wang, and C. Gong, J. Phys.: Condens. Matter11, 7645 �1999�.
�13� N. H. Liu, Phys. Rev. B 55, 3543 �1997�.�14� A. V. Lavrinenko, S. V. Zhukovsky, K. S. Sandomirski, and S.
V. Gaponenko, Phys. Rev. E 65, 036621 �2002�.�15� E. Macia, Phys. Rev. B 63, 205421 �2001�.�16� D. Lusk, I. Abdulhalim, and F. Placido, Opt. Commun. 198,
273 �2001�.�17� A. Mir, A. Akjouj, J. O. Vasseur, B. Djafari-Rouhani, N.
Fethouhi, E. H. El Boudouti, L. Dobrzynski, and J. Zemmouri,J. Phys.: Condens. Matter 15, 1593 �2003�.
�18� E. H. El Boudouti, N. Fethouhi, A. Akjouj, B. Djafari-Rouhani, A. Mir, J. O. Vasseur, L. Dobrzynski, and J. Zem-mouri, J. Appl. Phys. 95, 1102 �2004�.
�19� See, for example, J. D. Joannopoulos, R. D. Meade, and J. N.Winn, Photonic Crystals �Princeton University Press, Prince-ton, NJ, 1995�; Photonic Band Gap and Localization, edited
by C. M. Soukoulis �Plenum, New York, 1993�; Photonic BandGap Materials, edited by C. M. Soukoulis �Kluwer, Dordrecht,1996�.
�20� Z. Q. Zhang, C. C. Wong, K. K. Fung, Y. L. Ho, W. L. Chan,S. C. Kan, T. L. Chan, and N. Cheung, Phys. Rev. Lett. 81,5540 �1998�.
�21� H. Aynaou et al., Physica A 358, 68 �2005�.�22� L. Dobrzynski, Surf. Sci. Rep. 11, 139 �1990�.�23� J. O. Vasseur, A. Akjouj, B. Djafari-Rouhani, L. Dobrzynski,
and E. H. El Boudouti, Surf. Sci. Rep. 54, 1 �2004�.�24� G. J. Schneider, S. Hanna, J. L. Davis, and G. H. Watson, J.
Appl. Phys. 90, 2642 �2001�.�25� A. Haché and L. Poirier, Phys. Rev. E 65, 036608 �2002�; J.
N. Munday and W. Roberston, Appl. Phys. Lett. 80, 518�2002�.
�26� M. Buttiker and R. Landauer, Phys. Rev. Lett. 49, 1739�1982�; E. H. Hange and J. A. Stovneng, Rev. Mod. Phys. 61,917 �1989�.
�27� M. L. H. Lahlaouti, A. Akjouj, B. Djafari-Rouhani, L. Do-brzynski, M. Hammouchi, E. H. El Boudouti, A. Nougaoui,and B. Kharbouch, Phys. Rev. B 63, 035312 �2001�.
�28� H.-W Lee, Phys. Rev. Lett. 82, 2358 �1999�; T. Taniguchi andM. Buttiker, Phys. Rev. B 60, 13814 �1999�.
�29� G. J. Jin, Z. D. Wang, A. Hu, and S. S. Jiang, J. Phys.: Con-dens. Matter 8, 10285 �1996�.
�30� B. Djafari-Rouhani, E. H. El Boudouti, A. Akjouj, J. O. Vas-seur, and L. Dobrzynski, Prog. Surf. Sci. 74, 389 �2003�.
�31� J. N. Munday and W. M. Roberston, Appl. Phys. Lett. 83,1053 �2003�.
�32� S. Zhu, N. Liu, H. Zheng, and H. Chen, Opt. Commun. 174,139 �2000�.
�33� M. Scalora, R. J. Flynn, S. B. Reinhardt, R. L. Fork, M. J.Bloemer, M. D. Tocci, C. M. Bowden, H. S. Ledbetter, J. M.Bendickson, J. P. Dowling, and R. P. Leavitt, Phys. Rev. E 54,R1078 �1996�.
�34� T. Kondo, M. Hangyo, S. Yamaguchi, S. Yano, Y. Segawa, andK. Ohtaka, Phys. Rev. B 66, 033111 �2002�.
�35� A. Akjouj, H. Al-Wahsh, B. Sylla, B. Djafari-Rouhani, and L.Dobrzynski, J. Phys.: Condens. Matter 16, 37 �2004�.
�36� D. Shechtman, I. Blech, D. Gratias, and J. W. Cahn, Phys. Rev.Lett. 53, 1951 �1984�.
AYNAOU et al. PHYSICAL REVIEW E 72, 056601 �2005�
056601-14
�37� E. Bombieri and J. E. Taylor, J. Phys. �Paris�, Colloq. 47,C3–19 �1986�.
�38� A. Thue, Skr. Nor. Vidensk.-Akad., [Kl.] 1: Mat.-Naturvidensk. Kl. 7, 1 �1906�; M. Morse, Trans. Am. Math.Soc. 22, 84 �1921�.
�39� Z. Cheng, R. Savit, and R. Merlin, Phys. Rev. B 37, 4375�1988�.
�40� W. Rudin, Proc. Am. Math. Soc. 10, 855 �1959�; H. S.Shapiro, MS thesis, MIT, Cambridge, MA, 1951 �unpub-lished�.
PROPAGATION AND LOCALIZATION OF… PHYSICAL REVIEW E 72, 056601 �2005�
056601-15