Embed Size (px)
Citation preview
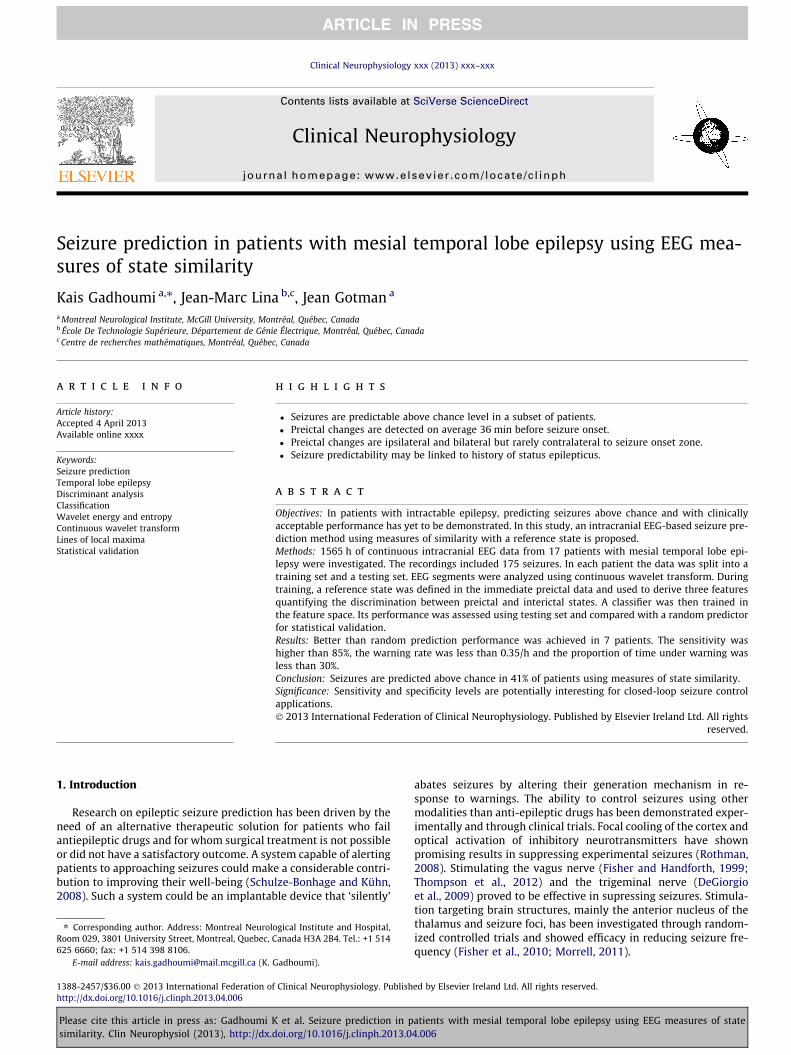
Clinical Neurophysiology xxx (2013) xxx–xxx
Contents lists available at SciVerse ScienceDirect
Clinical Neurophysiology
journal homepage: www.elsevier .com/locate /c l inph
Seizure prediction in patients with mesial temporal lobe epilepsy using EEG mea-sures of state similarity
Kais Gadhoumi a,⇑, Jean-Marc Lina b,c, Jean Gotman a
a Montreal Neurological Institute, McGill University, Montréal, Québec, Canadab École De Technologie Supérieure, Département de Génie Électrique, Montréal, Québec, Canadac Centre de recherches mathématiques, Montréal, Québec, Canada
a r t i c l e i n f o h i g h l i g h t s
Article history:Accepted 4 April 2013Available online xxxx
Keywords:Seizure predictionTemporal lobe epilepsyDiscriminant analysisClassificationWavelet energy and entropyContinuous wavelet transformLines of local maximaStatistical validation
1388-2457/$36.00 � 2013 International Federation ohttp://dx.doi.org/10.1016/j.clinph.2013.04.006
⇑ Corresponding author. Address: Montreal NeurolRoom 029, 3801 University Street, Montreal, Quebec,625 6660; fax: +1 514 398 8106.
E-mail address: [email protected] (K.
Please cite this article in press as: Gadhoumisimilarity. Clin Neurophysiol (2013), http://dx.
� Seizures are predictable above chance level in a subset of patients.� Preictal changes are detected on average 36 min before seizure onset.� Preictal changes are ipsilateral and bilateral but rarely contralateral to seizure onset zone.� Seizure predictability may be linked to history of status epilepticus.
a b s t r a c t
Objectives: In patients with intractable epilepsy, predicting seizures above chance and with clinicallyacceptable performance has yet to be demonstrated. In this study, an intracranial EEG-based seizure pre-diction method using measures of similarity with a reference state is proposed.Methods: 1565 h of continuous intracranial EEG data from 17 patients with mesial temporal lobe epi-lepsy were investigated. The recordings included 175 seizures. In each patient the data was split into atraining set and a testing set. EEG segments were analyzed using continuous wavelet transform. Duringtraining, a reference state was defined in the immediate preictal data and used to derive three featuresquantifying the discrimination between preictal and interictal states. A classifier was then trained inthe feature space. Its performance was assessed using testing set and compared with a random predictorfor statistical validation.Results: Better than random prediction performance was achieved in 7 patients. The sensitivity washigher than 85%, the warning rate was less than 0.35/h and the proportion of time under warning wasless than 30%.Conclusion: Seizures are predicted above chance in 41% of patients using measures of state similarity.Significance: Sensitivity and specificity levels are potentially interesting for closed-loop seizure controlapplications.� 2013 International Federation of Clinical Neurophysiology. Published by Elsevier Ireland Ltd. All rights
reserved.
1. Introduction
Research on epileptic seizure prediction has been driven by theneed of an alternative therapeutic solution for patients who failantiepileptic drugs and for whom surgical treatment is not possibleor did not have a satisfactory outcome. A system capable of alertingpatients to approaching seizures could make a considerable contri-bution to improving their well-being (Schulze-Bonhage and Kühn,2008). Such a system could be an implantable device that ‘silently’
f Clinical Neurophysiology. Publish
ogical Institute and Hospital,Canada H3A 2B4. Tel.: +1 514
Gadhoumi).
K et al. Seizure prediction in pdoi.org/10.1016/j.clinph.2013.0
abates seizures by altering their generation mechanism in re-sponse to warnings. The ability to control seizures using othermodalities than anti-epileptic drugs has been demonstrated exper-imentally and through clinical trials. Focal cooling of the cortex andoptical activation of inhibitory neurotransmitters have shownpromising results in suppressing experimental seizures (Rothman,2008). Stimulating the vagus nerve (Fisher and Handforth, 1999;Thompson et al., 2012) and the trigeminal nerve (DeGiorgioet al., 2009) proved to be effective in supressing seizures. Stimula-tion targeting brain structures, mainly the anterior nucleus of thethalamus and seizure foci, has been investigated through random-ized controlled trials and showed efficacy in reducing seizure fre-quency (Fisher et al., 2010; Morrell, 2011).
ed by Elsevier Ireland Ltd. All rights reserved.
atients with mesial temporal lobe epilepsy using EEG measures of state4.006
2 K. Gadhoumi et al. / Clinical Neurophysiology xxx (2013) xxx–xxx
The majority of the aforementioned modalities have been inves-tigated in an open-loop protocol. However, responsively control-ling seizures is appealing: a closed-loop system has theadvantage of requiring less power than open-loop systems (Kriegerand Litt, 2008). Also, dose-dependent side effects of antiepilepticdrugs (Gomer et al., 2007) are expected to be alleviated in systemsusing closed-loop drug delivery, as treatment becomes only inter-ventional rather than continuous.
A seizure prediction method driving a closed-loop seizure con-trol device has to demonstrate a clinically acceptable performance.The levels of acceptable sensitivity and specificity along with therequired intervention time are generally patient and applicationdependant and they are unknown during development of the sei-zure prediction method. It was therefore recommended that a sei-zure prediction method be assessed for a range of interventionperiods (Maiwald et al., 2004). As a minimum requirement, predic-tion performance needs to be above chance (Andrzejak et al.,2009).
For a long time, statistical validation was overlooked in seizureprediction. Most early studies did not investigate whether theperformance was statistically significant. It is only in recent stud-ies that rigorous statistical validation were included (Mormannet al., 2007). Such a validation is generally based on Monte Carlosimulations (Andrzejak et al., 2003; Kreuz et al., 2004) or naïveprediction schemes (Winterhalder et al., 2003; Schelter et al.,2006). Translating statistical evaluation into clinical utility for sei-zure warning or seizure control devices has been a subject of de-bate. Snyder et al. (2008) proposed a statistical approach topractically evaluate seizure prediction algorithms. Addressingthe question of variability in temporal relationship between algo-rithm warnings and seizure onset, their approach is based on anew seizure warning protocol and a model for chance predictorwith new performance metrics and methods for hypothesistesting.
An EEG based prediction method performs above chance when(1) there exists a preictal change in cortical dynamics, (2) the EEGmeasure is sensitive to this change and (3) electrode contacts areplaced in areas where the preictal change is detectable. If themechanisms underlying the preictal state in focal seizures engen-der spatially localized activity in the brain, then electrode locationbecomes of crucial importance. With ictogenesis yet to be fullyunderstood, defining cortical areas where best prediction perfor-mance could be achieved remains hypothetic. In a recent study(Gadhoumi et al., 2012), we demonstrated that preictal and inter-ictal states could be distinguished in EEG recordings from depthelectrode contacts in the seizure onset zone. Other studies claimedthat sites remote to the seizure onset zone also carried predictivepower (Mormann et al., 2003; D’Alessandro et al., 2005; Kuhlmannet al., 2010).
In this study, we present and evaluate an intracerebral EEGbased seizure prediction method for patients with mesial temporallobe epilepsy. We use measures of similarity between the brainstate underlying an EEG epoch and a reference state to identifyEEG changes leading to seizures in a classification based approach.The premise of the method relies on our study of the discrimina-tion between preictal and interictal epochs using high frequencycontent of intracerebral EEG (Gadhoumi et al., 2012). Because ofthe variability across patients in preictal and interictal EEG pat-terns, the method is patient-specific: in-sample optimization iscarried out during training for each patient. Special care was takennot to use test data set during training. We assume that seizuresare stereotypical within patients. Such an assumption is essentialfor a good generalization of the training performance over testdata.
The method performance and its superiority to chance are eval-uated using the statistical framework proposed by Snyder et al.
Please cite this article in press as: Gadhoumi K et al. Seizure prediction in psimilarity. Clin Neurophysiol (2013), http://dx.doi.org/10.1016/j.clinph.2013.0
(2008). The ultimate goal is to design a reliable seizure predictionmethod that proves utility in clinical applications. For this, we testthe method in quasi-prospective setting using long-lasting multi-day raw EEG recordings and report the results of sensitivity andspecificity suggested in the statistical framework.
2. Materials and methods
2.1. Materials
Seventeen consecutive patients admitted in the MontrealNeurological Institute between 2004 and 2011 for presurgicalintracerebral depth electrodes investigation, were evaluated.The patients responded to two inclusion criteria: a diagnosis ofmesial temporal lobe epilepsy and a minimum number of 5 sei-zures (2 for training and 3 for testing) recorded at 2000 Hz. Intotal, 1565 h of intracerebral EEG recorded using a 128-channelHarmonie monitoring system (Stellate Systems Inc.) filtered at500 Hz and sampled at 2000 Hz were analyzed. Of this data,1446 h were continuous long-lasting EEG recordings that wereused in testing. The remaining 119 h were used for training.Up to three preictal epochs, lasting up to 22 min each, were se-lected for each patient in the training procedure. The 22 minmaximum duration of a training preictal epoch was chosenbased on our earlier study (Gadhoumi et al., 2012). The actualtraining preictal epoch duration varied depending on the avail-ability of continuous uninterrupted preictal EEG recordings. Itranged between 6.3 and 22 min. Five interictal epochs lastingapproximately 1 h each and separated by at least 1 h were se-lected for each patient for training. These epochs were at least4 h from any seizure.
Out of 214 seizures, 39 were rejected from the analysis as theywere not separated by at least 2 h. This criterion was used to min-imize the impact of postictal dynamics on the EEG analysis. Seizureelectrographic onsets were determined by an experienced neurol-ogist. Only bipolar channels from the 4 deepest contacts of bilater-ally implanted electrodes in the amygdala, hippocampus andparahippocampus were analyzed. The total number of analyzedchannels per patient ranged between 9 and 18 depending on thenumber of electrodes implanted in the mesial structures. Tables1 and 2 summarize the details of seizures and EEG data.
2.2. Concepts
The seizure prediction method is based on the study by Gadho-umi et al. (2012). In the following sections we first summarize theconcepts and the methodology of that study: we briefly review thefeature definitions and how preictal and interictal epochs are dis-criminated using those features. We then describe in detail theprocessing blocks of the proposed method.
2.2.1. The reference state and similarity measure featuresPreictal and interictal epochs are analyzed using continuous
wavelet transform by calculating in different frequency bands thewavelet energy and entropy in a 2 s non-overlapping sliding win-dow. These two measures are extracted from lines of local maximain the wavelet domain to characterize singularities (Mallat andHwang, 1992). Each epoch is represented by its distribution of (en-ergy, entropy) points in a 2-dimentional space (this distribution ishereafter referred to as energy and entropy profile). The stateunderlying an epoch is characterized by its relative similarity witha reference state defined from preictal epochs of a training subset.To quantify this similarity, the reference state is represented in the2-dimentional space with a disk in which the center and the radiusare learned from the training preictal epochs subset. Then three
atients with mesial temporal lobe epilepsy using EEG measures of state4.006
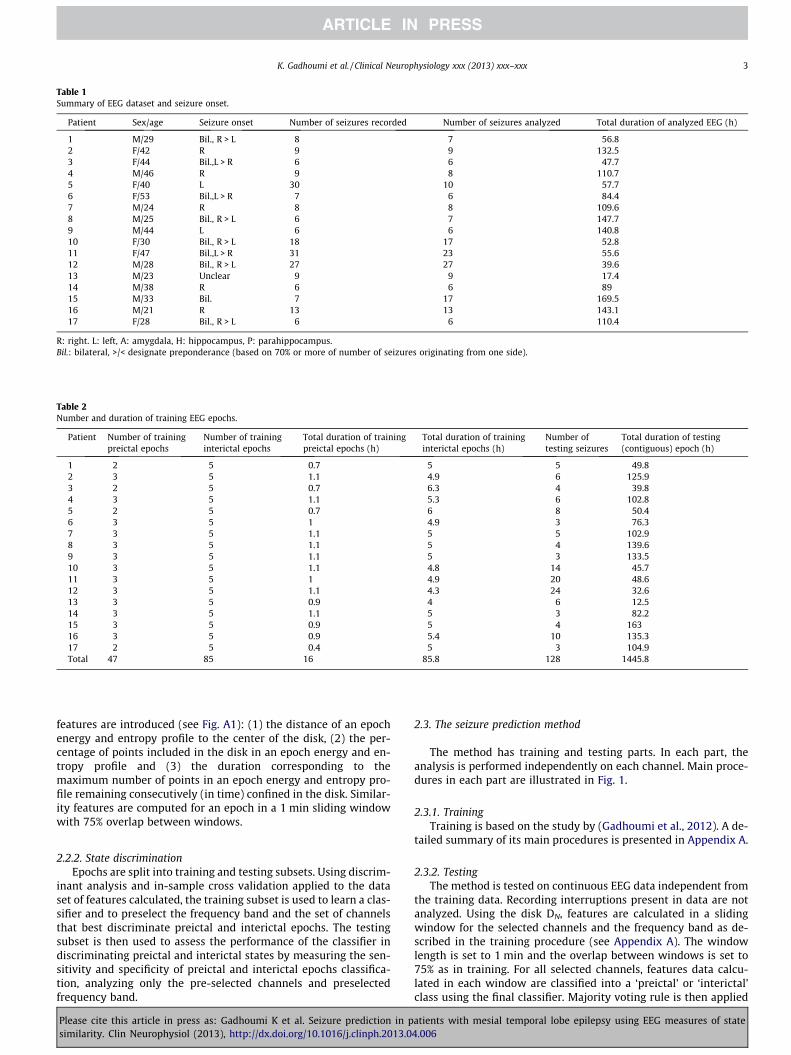
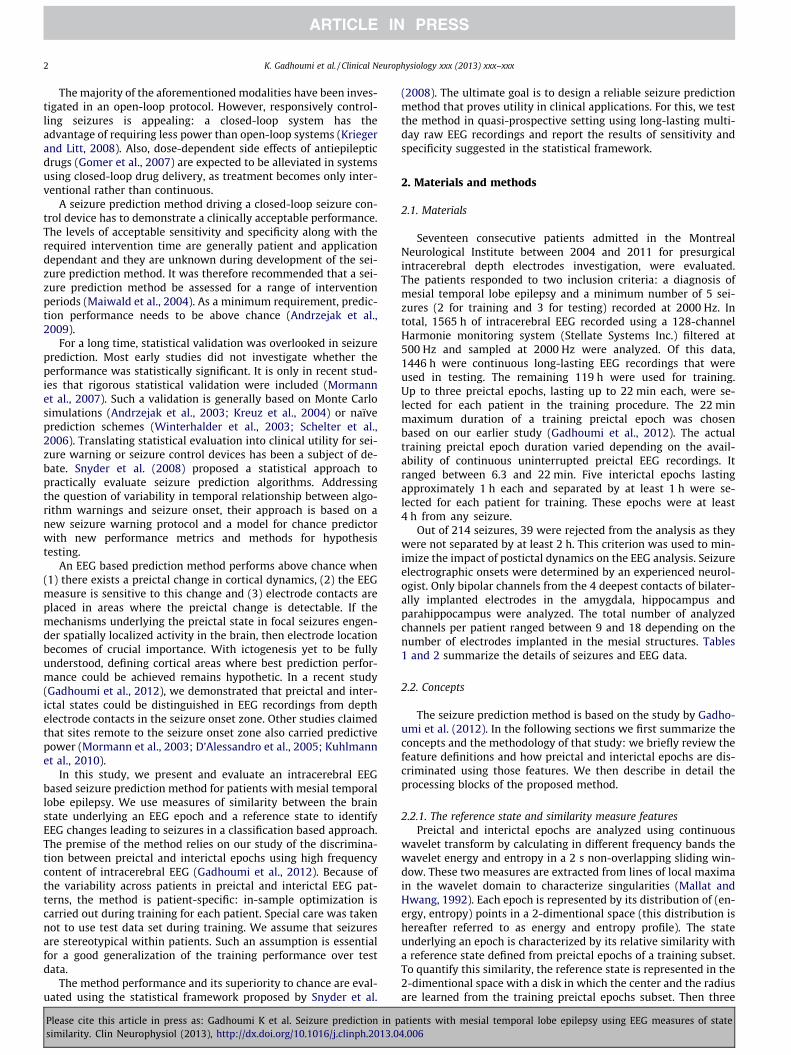
Table 1Summary of EEG dataset and seizure onset.
Patient Sex/age Seizure onset Number of seizures recorded Number of seizures analyzed Total duration of analyzed EEG (h)
1 M/29 Bil., R > L 8 7 56.82 F/42 R 9 9 132.53 F/44 Bil.,L > R 6 6 47.74 M/46 R 9 8 110.75 F/40 L 30 10 57.76 F/53 Bil.,L > R 7 6 84.47 M/24 R 8 8 109.68 M/25 Bil., R > L 6 7 147.79 M/44 L 6 6 140.810 F/30 Bil., R > L 18 17 52.811 F/47 Bil.,L > R 31 23 55.612 M/28 Bil., R > L 27 27 39.613 M/23 Unclear 9 9 17.414 M/38 R 6 6 8915 M/33 Bil. 7 17 169.516 M/21 R 13 13 143.117 F/28 Bil., R > L 6 6 110.4
R: right. L: left, A: amygdala, H: hippocampus, P: parahippocampus.Bil.: bilateral, >/< designate preponderance (based on 70% or more of number of seizures originating from one side).
Table 2Number and duration of training EEG epochs.
Patient Number of trainingpreictal epochs
Number of traininginterictal epochs
Total duration of trainingpreictal epochs (h)
Total duration of traininginterictal epochs (h)
Number oftesting seizures
Total duration of testing(contiguous) epoch (h)
1 2 5 0.7 5 5 49.82 3 5 1.1 4.9 6 125.93 2 5 0.7 6.3 4 39.84 3 5 1.1 5.3 6 102.85 2 5 0.7 6 8 50.46 3 5 1 4.9 3 76.37 3 5 1.1 5 5 102.98 3 5 1.1 5 4 139.69 3 5 1.1 5 3 133.510 3 5 1.1 4.8 14 45.711 3 5 1 4.9 20 48.612 3 5 1.1 4.3 24 32.613 3 5 0.9 4 6 12.514 3 5 1.1 5 3 82.215 3 5 0.9 5 4 16316 3 5 0.9 5.4 10 135.317 2 5 0.4 5 3 104.9Total 47 85 16 85.8 128 1445.8
K. Gadhoumi et al. / Clinical Neurophysiology xxx (2013) xxx–xxx 3
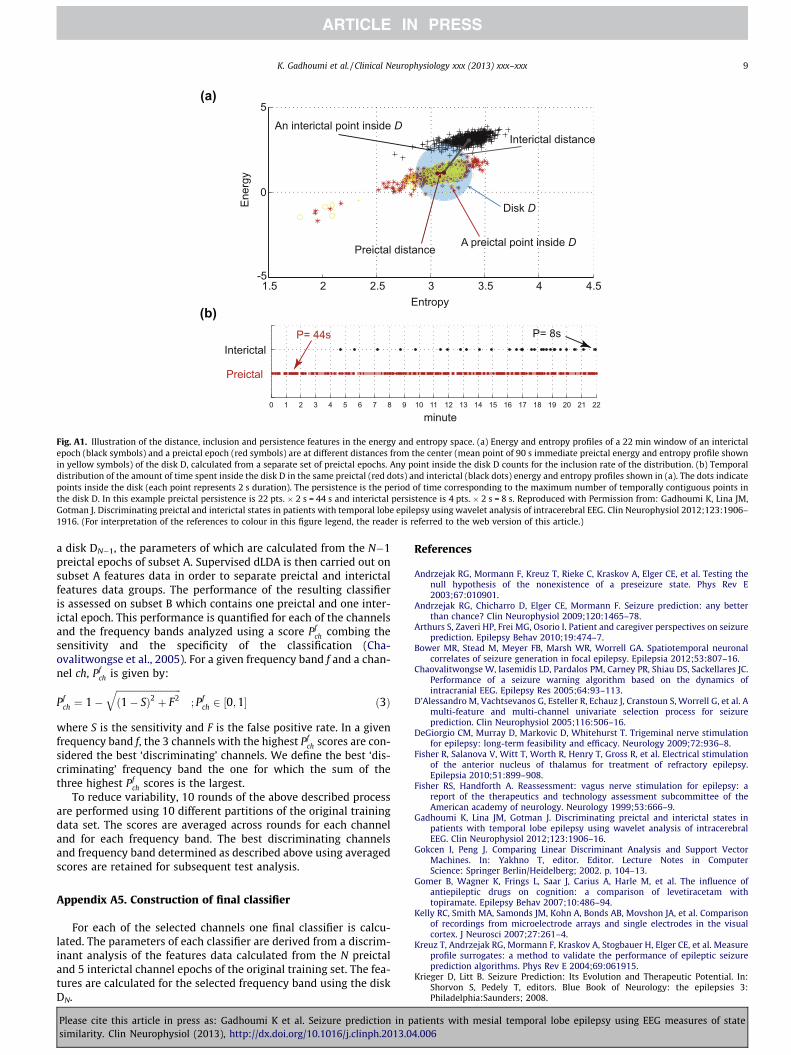
features are introduced (see Fig. A1): (1) the distance of an epochenergy and entropy profile to the center of the disk, (2) the per-centage of points included in the disk in an epoch energy and en-tropy profile and (3) the duration corresponding to themaximum number of points in an epoch energy and entropy pro-file remaining consecutively (in time) confined in the disk. Similar-ity features are computed for an epoch in a 1 min sliding windowwith 75% overlap between windows.
2.2.2. State discriminationEpochs are split into training and testing subsets. Using discrim-
inant analysis and in-sample cross validation applied to the dataset of features calculated, the training subset is used to learn a clas-sifier and to preselect the frequency band and the set of channelsthat best discriminate preictal and interictal epochs. The testingsubset is then used to assess the performance of the classifier indiscriminating preictal and interictal states by measuring the sen-sitivity and specificity of preictal and interictal epochs classifica-tion, analyzing only the pre-selected channels and preselectedfrequency band.
Please cite this article in press as: Gadhoumi K et al. Seizure prediction in psimilarity. Clin Neurophysiol (2013), http://dx.doi.org/10.1016/j.clinph.2013.0
2.3. The seizure prediction method
The method has training and testing parts. In each part, theanalysis is performed independently on each channel. Main proce-dures in each part are illustrated in Fig. 1.
2.3.1. TrainingTraining is based on the study by (Gadhoumi et al., 2012). A de-
tailed summary of its main procedures is presented in Appendix A.
2.3.2. TestingThe method is tested on continuous EEG data independent from
the training data. Recording interruptions present in data are notanalyzed. Using the disk DN, features are calculated in a slidingwindow for the selected channels and the frequency band as de-scribed in the training procedure (see Appendix A). The windowlength is set to 1 min and the overlap between windows is set to75% as in training. For all selected channels, features data calcu-lated in each window are classified into a ‘preictal’ or ‘interictal’class using the final classifier. Majority voting rule is then applied
atients with mesial temporal lobe epilepsy using EEG measures of state4.006
Wavelet energy
and entropy
Calculation of reference
state parameters
Classificationand
performance assessment
Features computation
Preictal state detection and
warning protocol
Prediction performance evaluation
Statistical validation
Channels and
frequency band
selection
A
B C
Fig. 1. Block diagram of the method training (A), testing (B) and validation (C).
4 K. Gadhoumi et al. / Clinical Neurophysiology xxx (2013) xxx–xxx
to window classification results of each channel and the class ofthe window is determined.
Consecutive preictal classifications are interpreted as seizurewarnings. We set the consecutive number of preictal classifica-tions needed to raise a warning to 5. This means that a warningis raised whenever 2 min of EEG is continuously classified as‘preictal’. Warnings are raised according to persistence of warn-ing lights protocol (Snyder et al., 2008) whereby a warning re-mains active (illuminated light) for as long as five newconsecutive preictal classifications are detected within a giventime horizon, in which condition, the original warning light is ex-tended for another duration s. Uninterrupted illumination of thewarning light is considered a single warning, regardless of itsduration. The period s, originally referred to as persistenceparameter in the study by Snyder et al. (2008), is referred to asthe persistence-s to avoid confusion with the terminology usedin our study. The persistence-s corresponds to sum of the seizureoccurrence period (the period during which the seizure is to beexpected) and the seizure prediction horizon (a minimum win-dow of time between warning and the beginning of the seizureoccurrence period) as defined by Winterhalder et al. (2003) andSchelter et al. (2006).
Since the information on the state of patients (ictal or inter-ictal) during interruption of EEG recording is missing, warningsare discarded if they are followed, within the period of the lightillumination, by an interruption that lasts more than the dura-tion of a seizure. In temporal lobe epilepsy, a typical seizurelasts up to 2 min. We discarded warnings followed by interrup-tions of 3 min or more. The epoch between the light illumina-tion and the beginning of interruption is removed from theanalysis.
To assess the performance of the prediction method, we evalu-ate its sensitivity and specificity. The sensitivity is defined as theprobability of correctly predicting a seizure within a time horizon.We measure the sensitivity by calculating the proportion of sei-zures within the light illumination. One measure of specificity isthe rate of false predictions per hour. In the chosen warning proto-col, this measure is not suitable as it does not provide informationon the amount of time spent in warning therefore it could poten-tially lead to misinterpreted results. We adopt instead the propor-tion of time under warning q and the warning rate r as specificity-related measures. These measures provide more practical informa-tion from patient and closed-loop intervention system perspec-tives since they assess the frequency and duration of theinconvenience caused by warnings.
Please cite this article in press as: Gadhoumi K et al. Seizure prediction in psimilarity. Clin Neurophysiol (2013), http://dx.doi.org/10.1016/j.clinph.2013.0
2.3.3. Comparison of classifier performance in training and testingTo compare the performance of the final classifier in separating
preictal and interictal epochs of training dataset and its perfor-mance in testing dataset, we compare the average score �pf �
ch ofthe three selected channels in training with a score Ptest that com-bines the sensitivity and the specificity of the method as measuredby predicting seizures of testing dataset using selected channels.We define the score Ptest by using the sensitivity S and the propor-tion of time under warning q:
Ptest ¼ 1�ffiffiffiffiffiffiffiffiffiffiffiffiffiffiffiffiffiffiffiffiffiffiffiffiffiffiffiffið1� SÞ2 þ q2
q; P 2 ½0;1� ð1Þ
2.4. Statistical validation
The performance of the proposed method is tested for it superi-ority to chance level. A naïve prediction scheme based on a Poissonprocess is chosen as the chance predictor. A Poisson process usesno information from the EEG signal and generates preictal classifi-cation according to uniformly distributed probability. One way tomeasure the improvement-over-chance is to evaluate the differ-ence between the sensitivity of the proposed method and that ofthe chance predictor (Snyder et al., 2008). In fact, it is demon-strated that the sensitivity of the chance predictor is approxi-mately equal to the proportion of time under warning q. Thepredictive ability of the proposed method is therefore measuredby the difference between sensitivity and the proportion of timeunder warning. Only if the sensitivity significantly exceeds the pro-portion of time under warning can the method claim to demon-strate predictive power above chance.
Given that n of N seizures are correctly predicted by the pro-posed method and Snc is the sensitivity of the chance predictor,the one-sided p-value estimation of the significance of theimprovement over chance is:
p ¼XN�1
k¼0
ðNK ÞSkncð1� SncÞN�k
; fornN
P Snc ð2Þ
using Eq. (2), we assess the statistical significance of the improve-ment over chance in the proposed method at the 5% level.
2.5. Predictors of method performance
Assuming seizures are predictable above chance level in a sub-group of patients, we statistically analyze a set of patient charac-teristics for a possible association with seizures predictability.
atients with mesial temporal lobe epilepsy using EEG measures of state4.006
0.00
0.13
0.25
0.38
0.50
0.63
0.75
0.88
1.00
1.13
1.25
1.38
0
10
20
30
40
50
60
70
80
90
100
60 55 50 45 40 35 30 25 20 15 10 5
N= 17 patients(128 sez)
0.00
0.13
0.25
0.38
0.50
0.63
0.75
0.88
1.00
1.13
1.25
1.38
0
10
20
30
40
50
60
70
80
90
100
60 55 50 45 40 35 30 25 20 15 10 5
Mea
n, S
EM (1
/h)
Mea
n, S
EM (%
)
Persistence -τ (min)
Sensitivity Proportion of time under warning Warning rate
p < 0.05
N= 7 patients(56 sez)
(a)
(b)
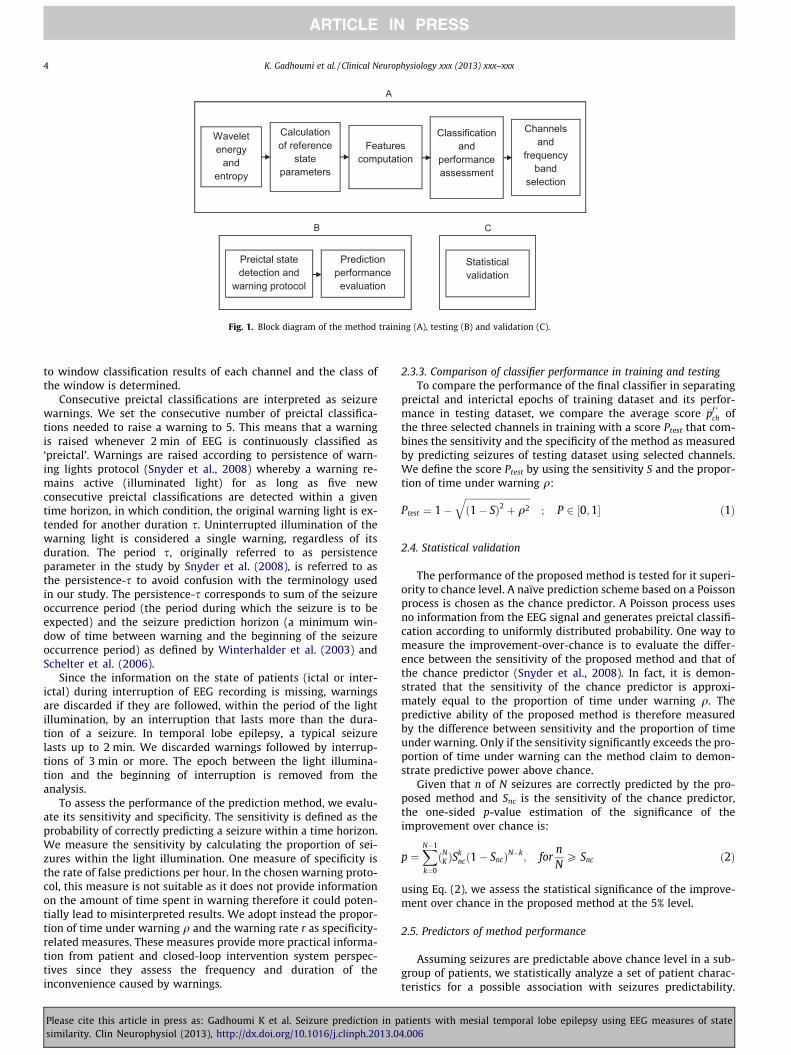
Fig. 2. Mean values (with standard errors of the mean) of sensitivity, proportion oftime under warning and warning rate for a range of persistence-s across all patients(a) and across the 7 patients in whom seizures are predicted above chance for a sub-range of persistence-s (greyed area) (b).
K. Gadhoumi et al. / Clinical Neurophysiology xxx (2013) xxx–xxx 5
Patient characteristics included age, sex and history of neurobio-logical (duration of epilepsy, generalized tonic clonic seizures, sta-tus epilepticus, febrile seizures at childhood, bilateral independentepileptic foci) and neuroimaging investigations (mesial temporalatrophy detected at MRI).
0
50
100
150
200
250
300
5 1 0 1 5 2 0 2 5 3 0 3 5 4 0 4 5 5 0 5 5 6 0
W
arni
ng ti
me
(min
)
Persistence-τ (min)
N = 49N = 47N = 44N = 40
p < 0.05
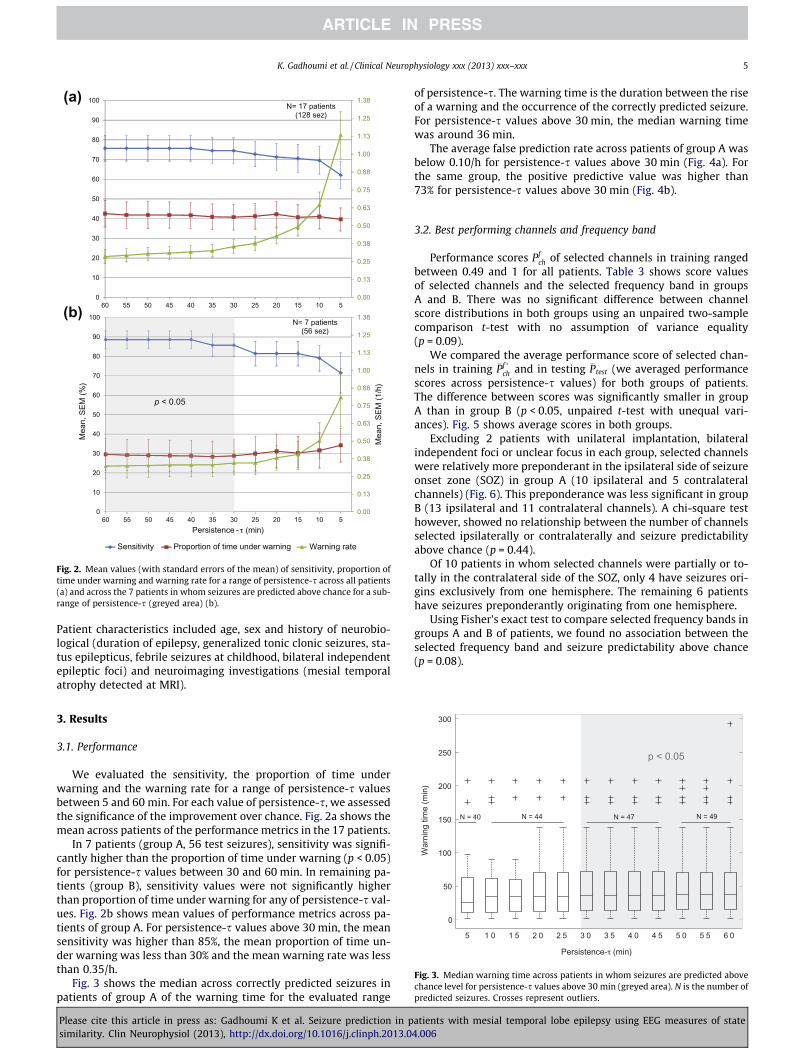
Fig. 3. Median warning time across patients in whom seizures are predicted abovechance level for persistence-s values above 30 min (greyed area). N is the number ofpredicted seizures. Crosses represent outliers.
3. Results
3.1. Performance
We evaluated the sensitivity, the proportion of time underwarning and the warning rate for a range of persistence-s valuesbetween 5 and 60 min. For each value of persistence-s, we assessedthe significance of the improvement over chance. Fig. 2a shows themean across patients of the performance metrics in the 17 patients.
In 7 patients (group A, 56 test seizures), sensitivity was signifi-cantly higher than the proportion of time under warning (p < 0.05)for persistence-s values between 30 and 60 min. In remaining pa-tients (group B), sensitivity values were not significantly higherthan proportion of time under warning for any of persistence-s val-ues. Fig. 2b shows mean values of performance metrics across pa-tients of group A. For persistence-s values above 30 min, the meansensitivity was higher than 85%, the mean proportion of time un-der warning was less than 30% and the mean warning rate was lessthan 0.35/h.
Fig. 3 shows the median across correctly predicted seizures inpatients of group A of the warning time for the evaluated range
Please cite this article in press as: Gadhoumi K et al. Seizure prediction in psimilarity. Clin Neurophysiol (2013), http://dx.doi.org/10.1016/j.clinph.2013.0
of persistence-s. The warning time is the duration between the riseof a warning and the occurrence of the correctly predicted seizure.For persistence-s values above 30 min, the median warning timewas around 36 min.
The average false prediction rate across patients of group A wasbelow 0.10/h for persistence-s values above 30 min (Fig. 4a). Forthe same group, the positive predictive value was higher than73% for persistence-s values above 30 min (Fig. 4b).
3.2. Best performing channels and frequency band
Performance scores Pfch of selected channels in training ranged
between 0.49 and 1 for all patients. Table 3 shows score valuesof selected channels and the selected frequency band in groupsA and B. There was no significant difference between channelscore distributions in both groups using an unpaired two-samplecomparison t-test with no assumption of variance equality(p = 0.09).
We compared the average performance score of selected chan-nels in training �Pf �
ch and in testing �Ptest (we averaged performancescores across persistence-s values) for both groups of patients.The difference between scores was significantly smaller in groupA than in group B (p < 0.05, unpaired t-test with unequal vari-ances). Fig. 5 shows average scores in both groups.
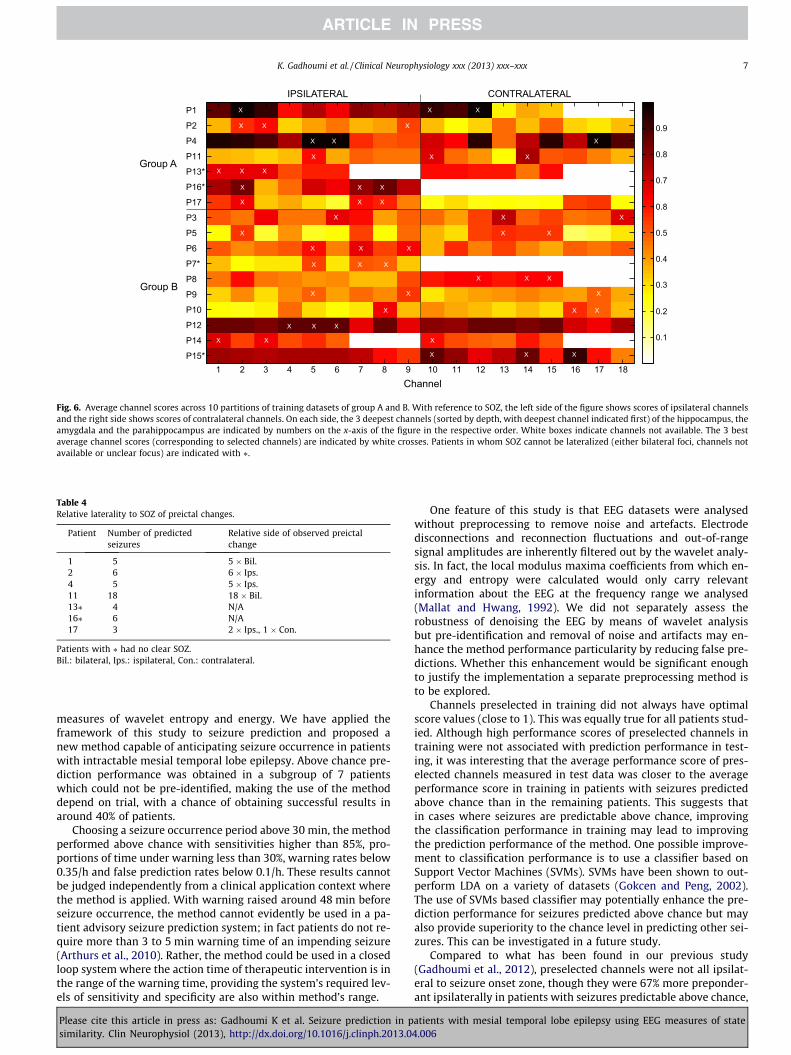
Excluding 2 patients with unilateral implantation, bilateralindependent foci or unclear focus in each group, selected channelswere relatively more preponderant in the ipsilateral side of seizureonset zone (SOZ) in group A (10 ipsilateral and 5 contralateralchannels) (Fig. 6). This preponderance was less significant in groupB (13 ipsilateral and 11 contralateral channels). A chi-square testhowever, showed no relationship between the number of channelsselected ipsilaterally or contralaterally and seizure predictabilityabove chance (p = 0.44).
Of 10 patients in whom selected channels were partially or to-tally in the contralateral side of the SOZ, only 4 have seizures ori-gins exclusively from one hemisphere. The remaining 6 patientshave seizures preponderantly originating from one hemisphere.
Using Fisher’s exact test to compare selected frequency bands ingroups A and B of patients, we found no association between theselected frequency band and seizure predictability above chance(p = 0.08).
atients with mesial temporal lobe epilepsy using EEG measures of state4.006
0.0
0.1
0.2
0.3
0.4
0.5
0.6
0.7
0.8
0.9
1.0
60 55 50 45 40 35 30 25 20 15 10 5
FPR
, SEM
(1/h
)
Persistence-τ (min)
p < 0.05
0
10
20
30
40
50
60
70
80
90
100
60 55 50 45 40 35 30 25 20 15 10 5
PPV,
SEM
(%)
N= 7 patients(56 sez)
p < 0.05
(a) (b)
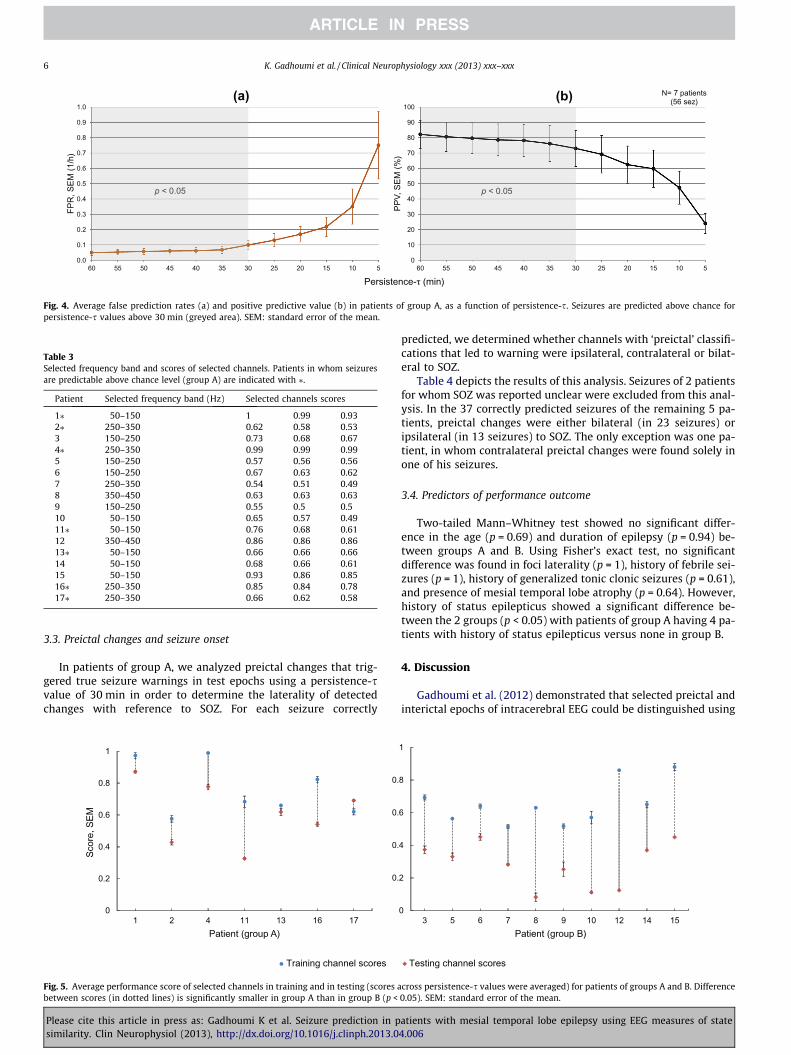
Fig. 4. Average false prediction rates (a) and positive predictive value (b) in patients of group A, as a function of persistence-s. Seizures are predicted above chance forpersistence-s values above 30 min (greyed area). SEM: standard error of the mean.
Table 3Selected frequency band and scores of selected channels. Patients in whom seizuresare predictable above chance level (group A) are indicated with ⁄.
Patient Selected frequency band (Hz) Selected channels scores
1⁄ 50–150 1 0.99 0.932⁄ 250–350 0.62 0.58 0.533 150–250 0.73 0.68 0.674⁄ 250–350 0.99 0.99 0.995 150–250 0.57 0.56 0.566 150–250 0.67 0.63 0.627 250–350 0.54 0.51 0.498 350–450 0.63 0.63 0.639 150–250 0.55 0.5 0.510 50–150 0.65 0.57 0.4911⁄ 50–150 0.76 0.68 0.6112 350–450 0.86 0.86 0.8613⁄ 50–150 0.66 0.66 0.6614 50–150 0.68 0.66 0.6115 50–150 0.93 0.86 0.8516⁄ 250–350 0.85 0.84 0.7817⁄ 250–350 0.66 0.62 0.58
6 K. Gadhoumi et al. / Clinical Neurophysiology xxx (2013) xxx–xxx
3.3. Preictal changes and seizure onset
In patients of group A, we analyzed preictal changes that trig-gered true seizure warnings in test epochs using a persistence-svalue of 30 min in order to determine the laterality of detectedchanges with reference to SOZ. For each seizure correctly
0
0.2
0.4
0.6
0.8
1
1 2 4 11 13 16 17
Scor
e, S
EM
Patient (group A)
Training channel scores
0.
0.
0.
0.
Fig. 5. Average performance score of selected channels in training and in testing (scores abetween scores (in dotted lines) is significantly smaller in group A than in group B (p <
Please cite this article in press as: Gadhoumi K et al. Seizure prediction in psimilarity. Clin Neurophysiol (2013), http://dx.doi.org/10.1016/j.clinph.2013.0
predicted, we determined whether channels with ‘preictal’ classifi-cations that led to warning were ipsilateral, contralateral or bilat-eral to SOZ.
Table 4 depicts the results of this analysis. Seizures of 2 patientsfor whom SOZ was reported unclear were excluded from this anal-ysis. In the 37 correctly predicted seizures of the remaining 5 pa-tients, preictal changes were either bilateral (in 23 seizures) oripsilateral (in 13 seizures) to SOZ. The only exception was one pa-tient, in whom contralateral preictal changes were found solely inone of his seizures.
3.4. Predictors of performance outcome
Two-tailed Mann–Whitney test showed no significant differ-ence in the age (p = 0.69) and duration of epilepsy (p = 0.94) be-tween groups A and B. Using Fisher’s exact test, no significantdifference was found in foci laterality (p = 1), history of febrile sei-zures (p = 1), history of generalized tonic clonic seizures (p = 0.61),and presence of mesial temporal lobe atrophy (p = 0.64). However,history of status epilepticus showed a significant difference be-tween the 2 groups (p < 0.05) with patients of group A having 4 pa-tients with history of status epilepticus versus none in group B.
4. Discussion
Gadhoumi et al. (2012) demonstrated that selected preictal andinterictal epochs of intracerebral EEG could be distinguished using
Testing channel scores
0
2
4
6
8
1
3 5 6 7 8 9 10 12 14 15Patient (group B)
cross persistence-s values were averaged) for patients of groups A and B. Difference0.05). SEM: standard error of the mean.
atients with mesial temporal lobe epilepsy using EEG measures of state4.006
1 2 3 4 5 6 7 8 9 10 11 12 13 14 15 16 17 18
P1
P2
P4
P11
P13*
P16*
P17
P3
P5
P6
P7*
P8
P9
P10
P12
P14
P15*
0.3
0.4
0.5
0.7
0.8
IPSILATERAL CONTRALATERAL
Group A
Group B
X X X
X X X
X X X
X X X
X X X
X X X
X X X
X X X
X X X
X X X
X X X
X X X
X X X
X X X
X X X
X X X
X X X
Channel
0.8
0.9
0.2
0.1
Fig. 6. Average channel scores across 10 partitions of training datasets of group A and B. With reference to SOZ, the left side of the figure shows scores of ipsilateral channelsand the right side shows scores of contralateral channels. On each side, the 3 deepest channels (sorted by depth, with deepest channel indicated first) of the hippocampus, theamygdala and the parahippocampus are indicated by numbers on the x-axis of the figure in the respective order. White boxes indicate channels not available. The 3 bestaverage channel scores (corresponding to selected channels) are indicated by white crosses. Patients in whom SOZ cannot be lateralized (either bilateral foci, channels notavailable or unclear focus) are indicated with ⁄.
Table 4Relative laterality to SOZ of preictal changes.
Patient Number of predictedseizures
Relative side of observed preictalchange
1 5 5 � Bil.2 6 6 � Ips.4 5 5 � Ips.11 18 18 � Bil.13⁄ 4 N/A16⁄ 6 N/A17 3 2 � Ips., 1 � Con.
Patients with ⁄ had no clear SOZ.Bil.: bilateral, Ips.: ispilateral, Con.: contralateral.
K. Gadhoumi et al. / Clinical Neurophysiology xxx (2013) xxx–xxx 7
measures of wavelet entropy and energy. We have applied theframework of this study to seizure prediction and proposed anew method capable of anticipating seizure occurrence in patientswith intractable mesial temporal lobe epilepsy. Above chance pre-diction performance was obtained in a subgroup of 7 patientswhich could not be pre-identified, making the use of the methoddepend on trial, with a chance of obtaining successful results inaround 40% of patients.
Choosing a seizure occurrence period above 30 min, the methodperformed above chance with sensitivities higher than 85%, pro-portions of time under warning less than 30%, warning rates below0.35/h and false prediction rates below 0.1/h. These results cannotbe judged independently from a clinical application context wherethe method is applied. With warning raised around 48 min beforeseizure occurrence, the method cannot evidently be used in a pa-tient advisory seizure prediction system; in fact patients do not re-quire more than 3 to 5 min warning time of an impending seizure(Arthurs et al., 2010). Rather, the method could be used in a closedloop system where the action time of therapeutic intervention is inthe range of the warning time, providing the system’s required lev-els of sensitivity and specificity are also within method’s range.
Please cite this article in press as: Gadhoumi K et al. Seizure prediction in psimilarity. Clin Neurophysiol (2013), http://dx.doi.org/10.1016/j.clinph.2013.0
One feature of this study is that EEG datasets were analysedwithout preprocessing to remove noise and artefacts. Electrodedisconnections and reconnection fluctuations and out-of-rangesignal amplitudes are inherently filtered out by the wavelet analy-sis. In fact, the local modulus maxima coefficients from which en-ergy and entropy were calculated would only carry relevantinformation about the EEG at the frequency range we analysed(Mallat and Hwang, 1992). We did not separately assess therobustness of denoising the EEG by means of wavelet analysisbut pre-identification and removal of noise and artifacts may en-hance the method performance particularity by reducing false pre-dictions. Whether this enhancement would be significant enoughto justify the implementation a separate preprocessing method isto be explored.
Channels preselected in training did not always have optimalscore values (close to 1). This was equally true for all patients stud-ied. Although high performance scores of preselected channels intraining were not associated with prediction performance in test-ing, it was interesting that the average performance score of pres-elected channels measured in test data was closer to the averageperformance score in training in patients with seizures predictedabove chance than in the remaining patients. This suggests thatin cases where seizures are predictable above chance, improvingthe classification performance in training may lead to improvingthe prediction performance of the method. One possible improve-ment to classification performance is to use a classifier based onSupport Vector Machines (SVMs). SVMs have been shown to out-perform LDA on a variety of datasets (Gokcen and Peng, 2002).The use of SVMs based classifier may potentially enhance the pre-diction performance for seizures predicted above chance but mayalso provide superiority to the chance level in predicting other sei-zures. This can be investigated in a future study.
Compared to what has been found in our previous study(Gadhoumi et al., 2012), preselected channels were not all ipsilat-eral to seizure onset zone, though they were 67% more preponder-ant ipsilaterally in patients with seizures predictable above chance,
atients with mesial temporal lobe epilepsy using EEG measures of state4.006
8 K. Gadhoumi et al. / Clinical Neurophysiology xxx (2013) xxx–xxx
compared to 54% in remaining patients. This discrepancy may beattributed to data sampling. In fact selected channels are sensitiveto a selection criterion where only the 3 top channel scorers arekept. If the 4th best channel has a score almost as high as the thirdit will still be rejected. A different sampling of training data maylead to selecting a new set of channels. This sensitivity was mini-mized in the previous study by using a bootstrapping approach,which could not be implemented in this study because of thequasiprospective design. Reducing the variability in training re-sults can always be addressed in a seizure prediction method ifmore data can be allocated to training and computational costcan be adequately handled.
Frequency bands preselected in training varied between pa-tients. This variability suggests that the predictive information ispatient-specific and could be spectrally limited. In order to detecta preictal state with high sensitivity and specificity using EEG, ananalysis of a broad spectrum and the identification of a frequencyband with the highest discrimination between preictal and interic-tal states may be important.
A noteworthy finding is that preictal changes were almost neverdetected exclusively contralateral to seizure onset. Preictal changeappears always to be detectable in the area where upcoming sei-zure will occur and in some cases also contralaterally. EEG studieson seizure prediction reported in general discordant findings aboutsites of first preictal change; These were found ipsilaterally (Mar-tinerie et al., 1998; Le Van Quyen et al., 2001) and contralaterally(Mormann et al., 2003; D’Alessandro et al., 2005; Kuhlmannet al., 2010). Recent studies using microelectrodes (Bower et al.,2012) have reported preictal changes in temporal lobe structureslocated within and outside the seizure onset zone, although thespecificity of these changes could not be assessed in the contextof seizure prediction. A recommendation on areas where to placesensing electrodes of a seizure prediction system however, is yetto be made. Based on our studies, we believe that preictal changescan be better detected in sites of preponderant seizure onset. A fur-ther support to this claim is the rather consistency of preictalchanges laterality within patient’s seizures.
In an attempt to unravel predictors of seizures predictability,retrospective analysis of demographic, neurobiological and neuro-imaging characteristics revealed in general no association withpredictability of seizures above chance. A history of status epilep-ticus could however be linked to patients in whom seizures werepredicted above chance. As important as this finding might be, itmust be interpreted with caution. Its statistical significance is lim-ited by the size of patient’s sample and needs to be confirmed on alarger sample.
While disease characteristics do not seem to help identify a pri-ori patients in whom seizures would be predicated above chance,other hypotheses need to be verified as they may provide more in-sight on seizure predictability. In particular, if ictogenesis is arather spatially local mechanism in the seizure onset zone, elec-trode contacts need to be abundant enough to cover a large volume(covering the seizure onset zone) and able to record from small en-ough volume in order to pick up any preictal change. Such elec-trode contacts do exist in the form of micro-contacts (Kelly et al.,2007; Stead et al., 2010) and studies on seizure prediction analys-ing data recorded with these electrodes are expected to provideanswers to important questions on seizure predictability.
Finally, the use of the proposed method in patients with otherforms of focal epilepsy (neocortical, extra-temporal) can be envis-aged. Its performance has to be revalidated, as different types ofepilepsy may exhibit different underlying mechanisms, whichmay lead to alteration of predictive performance. Preictal changesmay appear exclusively in areas remote from the seizure onsetzone and therefore it is recommended that large numbers of chan-nels be analysed for an initial investigation.
Please cite this article in press as: Gadhoumi K et al. Seizure prediction in psimilarity. Clin Neurophysiol (2013), http://dx.doi.org/10.1016/j.clinph.2013.0
Acknowledgements
We would like to thank Dr. Piero Perucca and Dr. FedericoMelani for their help on reviewing EEG data, and Ms NataljaZazubovits for her technical assistance. This work was supportedby the Canadian Institutes of Health Research (CIHR) grantsMOP-10189/102710 and by the Royal Society of Canada and theNatural Sciences and Engineering Research Council of Canada(NSERC) grant CHRPJ 323490-06 and by the joint NSERC/CIHRgrant CHRP-CPG-80098.
Appendix A. Training
The training procedure consists of determining: (1) a classifier,(2) a set of three channels and (3) a frequency band by which sep-aration of preictal and interictal training epochs in the inclusion,persistence and distance features plane is possible and optimal.Based on the earlier study by Gadhoumi et al. (2012), the best dis-crimination results were obtained with diagonal linear discrimi-nant analysis (dLDA). We therefore adopted dLDA approach todetermine the parameters of the classifier.
Training is performed in 6 main stages: (1) Calculation of en-ergy and entropy measures, (2) Calculation of the reference stateparameters, (3) Feature computation, (4) Channel and frequencyband selection, and (5) Construction of the final classifier. We here-after describe the data set and the analysis used in each stage.
Appendix A1. Calculation of energy and entropy measures
For all training preictal and interictal epochs, continuous wave-let transform using Morse wavelet (Lilly and Olhede, 2010) is per-formed in a 2 s sliding window with 2 s gap between windows.Wavelet energy and entropy are calculated from lines of local max-ima in 4 frequency bands: 50–150 Hz, 150–250 Hz, 250–350 Hzand 350–450 Hz.
Appendix A2. Calculation of the reference state parameters
Using N training preictal epochs with time interval [0 ti] each,(i = 1:N), the center CN of a disk DN representing the reference stateis defined as the mean point of the N 90 s immediate preictal en-ergy and entropy profiles. The radius RN of the disk DN is such85% of the average of energy and entropy profiles of the N preictalepochs [0 ti–90s], is included in the disk.
Appendix A3. Features computation
Distance, inclusion and persistence features are calculated forthe entire duration of each training interictal epoch and for timeinterval [0 ti–90s] of each training preictal epoch Fig. A1. The fea-tures are calculated in a 1 min sliding window with 75% overlapbetween windows. The distance is computed by measuring theEuclidian distance between the center CN and the average of allpoints of the energy and entropy profile of the epoch. The inclusionis the percentage of points of the energy and entropy profile con-fined within the disk DN. Finally the persistence is the total dura-tion corresponding to the maximum number of consecutive 2 spoints of the energy and entropy profile that remain confined in-side the disk DN.
Appendix A4. Channels and frequency band selection
The training set is partitioned into subsets A and B for each pa-tient. Subset A contains N�1 preictal epochs and 5�1 = 4 interictalepochs. Features are calculated for all epochs of both subsets using
atients with mesial temporal lobe epilepsy using EEG measures of state4.006
1.5 2 2.5 3 3.5 4 4.5-5
0
5
Entropy
Ener
gy
An interictal point inside D
A preictal point inside D
Disk D
Interictal distance
Preictal distance
0 1 2 3 4 5 6 7 8 9 10 11 12 13 14 15 16 17 18 19 20 21 22
Preictal
Interictal
minute
P= 8sP= 44s
(a)
(b)
Fig. A1. Illustration of the distance, inclusion and persistence features in the energy and entropy space. (a) Energy and entropy profiles of a 22 min window of an interictalepoch (black symbols) and a preictal epoch (red symbols) are at different distances from the center (mean point of 90 s immediate preictal energy and entropy profile shownin yellow symbols) of the disk D, calculated from a separate set of preictal epochs. Any point inside the disk D counts for the inclusion rate of the distribution. (b) Temporaldistribution of the amount of time spent inside the disk D in the same preictal (red dots) and interictal (black dots) energy and entropy profiles shown in (a). The dots indicatepoints inside the disk (each point represents 2 s duration). The persistence is the period of time corresponding to the maximum number of temporally contiguous points inthe disk D. In this example preictal persistence is 22 pts. � 2 s = 44 s and interictal persistence is 4 pts. � 2 s = 8 s. Reproduced with Permission from: Gadhoumi K, Lina JM,Gotman J. Discriminating preictal and interictal states in patients with temporal lobe epilepsy using wavelet analysis of intracerebral EEG. Clin Neurophysiol 2012;123:1906–1916. (For interpretation of the references to colour in this figure legend, the reader is referred to the web version of this article.)
K. Gadhoumi et al. / Clinical Neurophysiology xxx (2013) xxx–xxx 9
a disk DN�1, the parameters of which are calculated from the N�1preictal epochs of subset A. Supervised dLDA is then carried out onsubset A features data in order to separate preictal and interictalfeatures data groups. The performance of the resulting classifieris assessed on subset B which contains one preictal and one inter-ictal epoch. This performance is quantified for each of the channelsand the frequency bands analyzed using a score Pf
ch combing thesensitivity and the specificity of the classification (Cha-ovalitwongse et al., 2005). For a given frequency band f and a chan-nel ch, Pf
ch is given by:
Pfch ¼ 1�
ffiffiffiffiffiffiffiffiffiffiffiffiffiffiffiffiffiffiffiffiffiffiffiffiffiffiffiffið1� SÞ2 þ F2
q; Pf
ch 2 ½0;1� ð3Þ
where S is the sensitivity and F is the false positive rate. In a givenfrequency band f, the 3 channels with the highest Pf
ch scores are con-sidered the best ‘discriminating’ channels. We define the best ‘dis-criminating’ frequency band the one for which the sum of thethree highest Pf
ch scores is the largest.To reduce variability, 10 rounds of the above described process
are performed using 10 different partitions of the original trainingdata set. The scores are averaged across rounds for each channeland for each frequency band. The best discriminating channelsand frequency band determined as described above using averagedscores are retained for subsequent test analysis.
Appendix A5. Construction of final classifier
For each of the selected channels one final classifier is calcu-lated. The parameters of each classifier are derived from a discrim-inant analysis of the features data calculated from the N preictaland 5 interictal channel epochs of the original training set. The fea-tures are calculated for the selected frequency band using the diskDN.
Please cite this article in press as: Gadhoumi K et al. Seizure prediction in psimilarity. Clin Neurophysiol (2013), http://dx.doi.org/10.1016/j.clinph.2013.0
References
Andrzejak RG, Mormann F, Kreuz T, Rieke C, Kraskov A, Elger CE, et al. Testing thenull hypothesis of the nonexistence of a preseizure state. Phys Rev E2003;67:010901.
Andrzejak RG, Chicharro D, Elger CE, Mormann F. Seizure prediction: any betterthan chance? Clin Neurophysiol 2009;120:1465–78.
Arthurs S, Zaveri HP, Frei MG, Osorio I. Patient and caregiver perspectives on seizureprediction. Epilepsy Behav 2010;19:474–7.
Bower MR, Stead M, Meyer FB, Marsh WR, Worrell GA. Spatiotemporal neuronalcorrelates of seizure generation in focal epilepsy. Epilepsia 2012;53:807–16.
Chaovalitwongse W, Iasemidis LD, Pardalos PM, Carney PR, Shiau DS, Sackellares JC.Performance of a seizure warning algorithm based on the dynamics ofintracranial EEG. Epilepsy Res 2005;64:93–113.
D’Alessandro M, Vachtsevanos G, Esteller R, Echauz J, Cranstoun S, Worrell G, et al. Amulti-feature and multi-channel univariate selection process for seizureprediction. Clin Neurophysiol 2005;116:506–16.
DeGiorgio CM, Murray D, Markovic D, Whitehurst T. Trigeminal nerve stimulationfor epilepsy: long-term feasibility and efficacy. Neurology 2009;72:936–8.
Fisher R, Salanova V, Witt T, Worth R, Henry T, Gross R, et al. Electrical stimulationof the anterior nucleus of thalamus for treatment of refractory epilepsy.Epilepsia 2010;51:899–908.
Fisher RS, Handforth A. Reassessment: vagus nerve stimulation for epilepsy: areport of the therapeutics and technology assessment subcommittee of theAmerican academy of neurology. Neurology 1999;53:666–9.
Gadhoumi K, Lina JM, Gotman J. Discriminating preictal and interictal states inpatients with temporal lobe epilepsy using wavelet analysis of intracerebralEEG. Clin Neurophysiol 2012;123:1906–16.
Gokcen I, Peng J. Comparing Linear Discriminant Analysis and Support VectorMachines. In: Yakhno T, editor. Editor. Lecture Notes in ComputerScience: Springer Berlin/Heidelberg; 2002. p. 104–13.
Gomer B, Wagner K, Frings L, Saar J, Carius A, Harle M, et al. The influence ofantiepileptic drugs on cognition: a comparison of levetiracetam withtopiramate. Epilepsy Behav 2007;10:486–94.
Kelly RC, Smith MA, Samonds JM, Kohn A, Bonds AB, Movshon JA, et al. Comparisonof recordings from microelectrode arrays and single electrodes in the visualcortex. J Neurosci 2007;27:261–4.
Kreuz T, Andrzejak RG, Mormann F, Kraskov A, Stogbauer H, Elger CE, et al. Measureprofile surrogates: a method to validate the performance of epileptic seizureprediction algorithms. Phys Rev E 2004;69:061915.
Krieger D, Litt B. Seizure Prediction: Its Evolution and Therapeutic Potential. In:Shorvon S, Pedely T, editors. Blue Book of Neurology: the epilepsies 3:Philadelphia:Saunders; 2008.
atients with mesial temporal lobe epilepsy using EEG measures of state4.006
10 K. Gadhoumi et al. / Clinical Neurophysiology xxx (2013) xxx–xxx
Kuhlmann L, Freestone D, Lai A, Burkitt AN, Fuller K, Grayden DB, et al. Patient-specific bivariate-synchrony-based seizure prediction for short predictionhorizons. Epilepsy Res 2010;91:214–31.
Le Van Quyen M, Martinerie J, Navarro V, Boon P, D’Have M, Adam C. Anticipation ofepileptic seizures from standard EEG recordings. Lancet 2001;357:183–8.
Lilly JM, Olhede SC. On the analytic wavelet transform. IEEE T Inform Theory2010;57:4135–56.
Maiwald T, Winterhalder M, Aschenbrenner-Scheibe R, Voss HU, Schulze-BonhageA, Timmer J. Comparison of three nonlinear seizure prediction methods bymeans of the seizure prediction characteristic. Physica D 2004;194:357–68.
Mallat S, Hwang WL. Singularity detection and processing with wavelets. IEEE TInform Theory 1992;38:617–43.
Martinerie J, Adam C, Le Van Quyen M, Baulac M, Clemenceau S, Renault B, et al.Epileptic seizures can be anticipated by non-linear analysis. Nat Med1998;4:1173–6.
Mormann F, Kreuz T, Andrzejak RG, David P, Lehnertz K, Elger CE. Epileptic seizuresare preceded by a decrease in synchronization. Epilepsy Res 2003;53:173–85.
Mormann F, Andrzejak RG, Elger CE, Lehnertz K. Seizure prediction: the long andwinding road. Brain 2007;130:314–33.
Morrell MJ. Responsive cortical stimulation for the treatment of medicallyintractable partial epilepsy. Neurology 2011;77:1295–304.
Please cite this article in press as: Gadhoumi K et al. Seizure prediction in psimilarity. Clin Neurophysiol (2013), http://dx.doi.org/10.1016/j.clinph.2013.0
Rothman SM. Beyond Prediction – Focal Cooling and Optical Activation toTerminate Focal Seizures. Seizure Prediction in Epilepsy: Wiley-VCH VerlagGmbH & Co. KGaA; 2008. p. 269–282.
Schelter B, Winterhalder M, Maiwald T, Brandt A, Schad A, Schulze-Bonhage A, et al.Testing statistical significance of multivariate time series analysis techniquesfor epileptic seizure prediction. Chaos 2006;16:013108.
Schulze-Bonhage A, Kühn A. Unpredictability of Seizures and the Burden ofEpilepsy. Seizure Prediction in Epilepsy: Wiley-VCH Verlag GmbH & Co.KGaA; 2008. p. 1–10.
Snyder DE, Echauz J, Grimes DB, Litt B. The statistics of a practical seizure warningsystem. J Neural Eng 2008;5:392–401.
Stead M, Bower M, Brinkmann BH, Lee K, Marsh WR, Meyer FB, et al. Microseizuresand the spatiotemporal scales of human partial epilepsy. Brain 2010;133:2789–97.
Thompson EM, Wozniak SE, Roberts CM, Kao A, Anderson VC, Selden NR. Vagusnerve stimulation for partial and generalized epilepsy from infancy toadolescence. J Neurosurg Pediatr 2012;10:200–5.
Winterhalder M, Maiwald T, Voss HU, Aschenbrenner-Scheibe R, Timmer J, Schulze-Bonhage A. The seizure prediction characteristic: a general framework to assessand compare seizure prediction methods. Epilepsy Behav 2003;4:318–25.
atients with mesial temporal lobe epilepsy using EEG measures of state4.006