Embed Size (px)
Citation preview
859
M E T H O D S I I
Separation of 20:4n-6 and 20:4n-7 by Capillary Gas-Liquid Chromatography ~ o b e d L. Wol f f a,*, J e a n - L o u i s S e b e d i o b a n d A n d r e G r a n d g J r a r d c
ISTAB-ITERG, Laboratoire de Lipochimie Alimentaire, Universite de Bordeaux I, 33405 Talence Cedex and bstation de Recherche sur ia Qualite des Aliments de l'Homme, Unite de Nutrition Lipidique, INRA, 21034 Dijon Cedex, France
The use of a capillary column coated with 100% cya- nopropyl polysiloxane (CpTMSil 88) allows the separa- tion of several fatty acids associated with fat defi- ciency. Starting with liver mitochondrial phospholipids of weanling rats fed a fat-free diet, an unusual fatty acid was isolated, along with 20:4n-6, by thin-layer chromatography on AgNO3-impregnated silica gel plates. After partial hydrazine reduction of these ac- ids, the resulting monoenes were isolated and subjected to ozonolys i s in BFs/methanol . The result ing monomethyl and dimethyl esters were identified by gas chromatography/mass spectrometry. Our data in- dicate that the unusual component corresponds to 20:4n- 7. Based on published biochemical and analytical stud- ies and on our own chromatographic retention data, some of the other unusual fatty acids were tentatively identified as 18:2n-7, 20:2n-7 and 20:3n-7. The CpTMSil 88 column appears to be a simple and useful tool for the separation of fatty acids of the palmitoleate series. Lipids 25, 859-862 (1990).
Several investigators (1-11) have observed that fat- deficient diets can lead to the appearance of polyun- saturated fatty acids of the n-7 series in phospholipids. These acids include 18:2A8,11 (4,5,7,8,11), 18:3A5,8,11 (2,8,11), 20:2A10,13 Ill), 20:3A7,10,13 (1,4-8,10,11) and 20:4A4,7,10,13 (3-9,11) acids. Unfortunately, these ac- ids are usually not well resolved from similar fatty acids by gas-liquid chromatography (GLC) on packed columns (6,7,9,12,13}. Complex procedures were thus needed to detect these components (1-10). On the other hand, n-7 acids are expected to be better separated on highly efficient capillary columns (14,15).
In our study of the fatty acid profile of liver mit~ chondrial phospholipids from rats fed a fat-free diet, several small peaks associated with fat-deficiency were noted on chromatograms obtained by GLC on different capillary columns. In this report, we demonstrate that one of these peaks corresponds to 20:4n-7 and that it can be separated easily by GLC on a CpTMSil 88 col" umn. We also give some chromatographic data indicat- ing that other members of the n-7 series are also well resolved on this column.
*To whom correspondence should be addressed at ISTAB, Labo- ratoire de Lipochimie Alimentaire, Universit6 de Bordeaux I, Al6e des Facult6s, 33405 Talence Cedex, France.
Abbreviations: AgNO3-TLC, thin-layer chromatography on sil- ica gel impregnated with AgNO3; DME, dimethyl esters; ECL, equivalent chain length; EFA, essential fatty acid; FAME, fatty acid methyl esters; FCL, fractional chain length; GC/MS, gas- liquid chromatography/mass spectrometry; GLC, gas-liquid chro- matography; MME, monomethyl esters; TLC, thin-layer chroma- tography.
MATERIALS AND METHODS
Isolation of tetraenes. Lipids were extracted with a mixture of chloroform and methanol (16) from liver mitochondria of four weanling rats fed a fat-free diet for 66 days {17}. Phospholipids were separated from neutral lipids by thin-layer chromatography (TLC} on silica gel H {Kieselgel H 60, Merck, Darmstadt, Ger- many) coated plates with diethyl ether/acetone {90:30, v/v) as developing solvent {18}. The fatty acids in the resulting phospholipid fraction were methylated with 14% boron trifluoride in methanol (19). Fat ty acid methyl esters (FAME) were then separated according to their number of double bonds by preparative TLC on plates coated with silica gel containing 5% AgNO3by weight. The solvent used was a mixture of hexane/diethyl ether/ acetic acid (94:4:2, v/v/v) (20). The bands were detected under ultraviolet light, after spraying with a 0.2% solu- tion of 2',T-dichlorofluorescein in ethanol, and scraped off into glass centrifuge tubes. The gel was suspended in a mixture of methanol/water/acetic acid (1:1:0.1, v/v/ v) and FAME were extracted with hexane (18). Each fraction was then analyzed by GLC and the tetraene fractions were pooled for further analyses.
Structure determination. Tetraenoic FAME were submitted to hydrazine reduction according to Con- way et aL {21}, except that the reaction was allowed to proceed for only 2 hr. The reaction products were sepa- ra ted by AgNO3-TLC on commercial plates (DC- Fertigplatten Kieselgel H, Merck) modified as described by Grandgirard et al. (22) and using a mixture of hexane/ diethyl ether/acetic acid (94:4:2, v/v/v) as developing solvent (20). FAME were then extracted from the silica gel as described above. The resulting monoene frac- tions were submitted to oxidative ozonolysis in BFJ methanol (23). The monomethyl and dimethyl esters (MME and DME) were analyzed first by GLC relative to authentic standards and further characterized by gas-liquid chromatography/mass spectrometry (GC/ MS}.
Gas-liquid chromatography (GLC). Most GLC analy- ses of FAME were done on a Carlo Erba 5160 chroma- tograph (Carlo Erba, Milano, Italy) equipped with a flame ionization detector. FAME were separated on a fused silica capillary column (50 m • 0.22 mm I.D.) coated with 100% cyanopropyl polysiloxane {0.22 ~rn film} (CpT~SIl 88, Chrompack, Middelburg, Holland). Analyses were performed at 185~ using hydrogen as carrier gas (inlet pressure: 1.3 kg/cm2). Injections were made through a split injector. A few analyses were also made using a cpTMWax 52 CB capillary column (50 m X 0.22 mm I.D.; Chrompack) operated at 195~ with a hydrogen pressure of 0.9 kg/cm 2. Equivalent chain lengths (ECL} were calculated (24} using the CpTMSIl 88 column. Standards were purchased from Sigma (St. Louis, MO).
Gas-liquid chromatography~mass spectrometry (GC/
LIPIDS, Vol. 25, No. 12 (1990)
A
B
860
METHODS
18:1(n-9}- t8:1(n-7}
j
*18:21n-61
8 n-
L �9 ?
18 I -
l -
I
2~3Ie-9}
o f
A 7 ~
I I1 . ' ~ - " - - - -
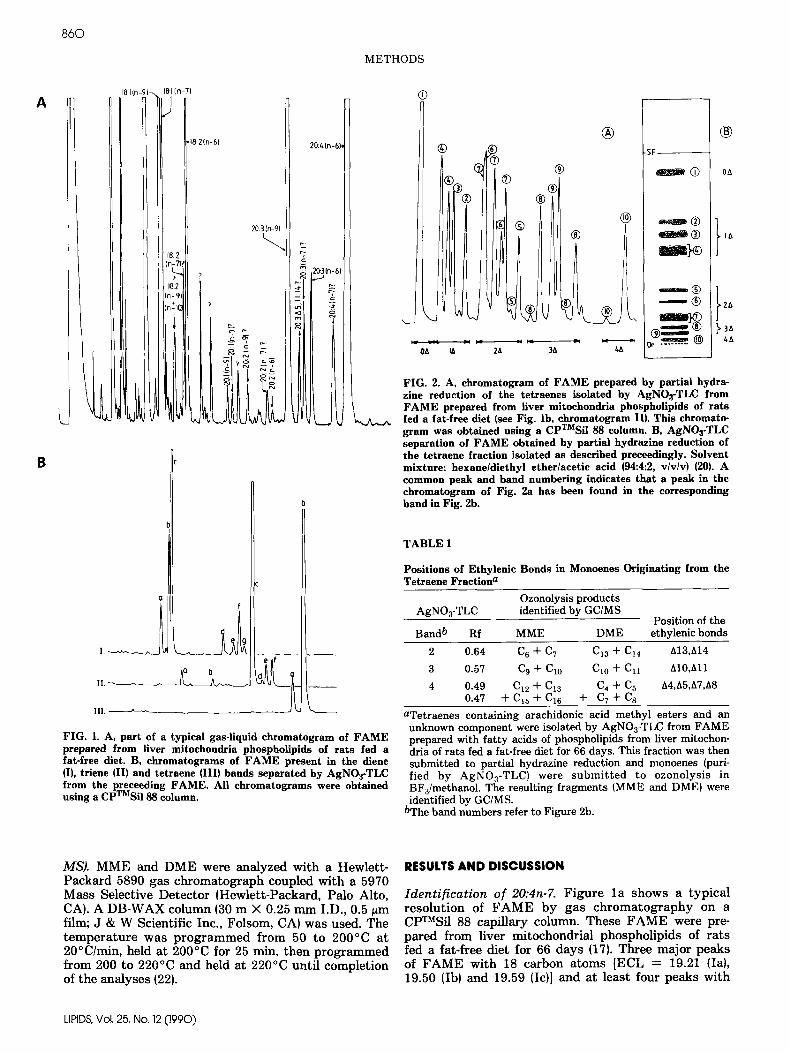
FIG. 1. A, part of a typical gas-liquid chromatogram of FAME prepared from fiver mitochondria phospholipids of rats fed a fat-free diet. B, chromatograms of FAME present in the diene (I), triene {II) and tetraene (III) bands separated by AgNO3-TLC from the preceeding FAME. All chromatograms were obtained using a cpTMsil 88 column.
|
| )
{' {
0 a IA 2A 3A
|
|
(
)
|
~A
- $ F
~ | ~ |
a | . . - - |
|
0 4
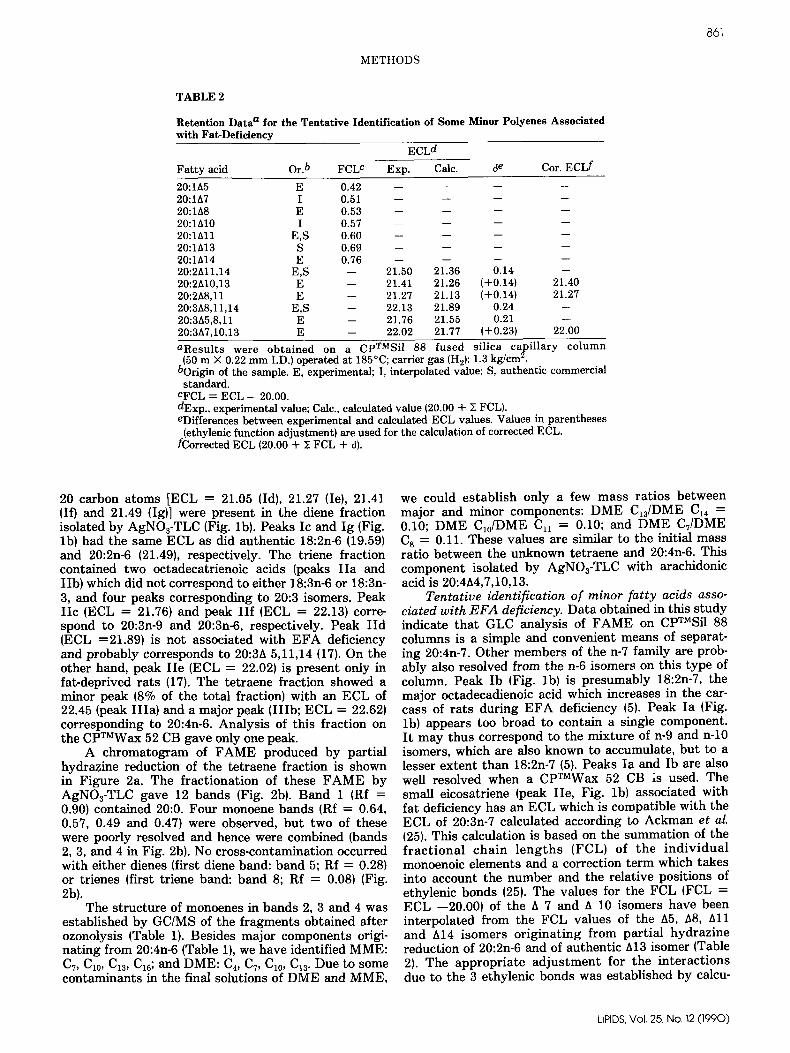
FIG. 2. A, chromatogram of FAME prepared by partial hydra- zine reduction of the tetraenes isolated by AgNO3-TLC from FAME prepared from liver mitochondria phospholipids of rats fed a fat-free diet {see Fig. lb, chromatogram II}. This chromato- gram was obtained using a cpTMSil 88 column. B, AgNO3-TLC separation of FAME obtained by partial hydrazine reduction of the tetraene fraction isolated as described preceedingly. Solvent mixture: hexane/diethyl ether/acetic acid {94:4:2, v/v/v) {20). A common peak and band numbering indicates that a peak in the chromatogram of Fig. 2a has been found in the corresponding band in Fig. 2b.
TABLE 1
Positions of Ethylenic Tetraene Fraction a
Bonds in Monoenes Originating from the
Ozonolysis products AgNOa-TLC identified by GC/MS
Position of the Band b Rf MME DME ethylenic bonds
2 0.64 C 6 + C 7 C13 + C14 A13,A14
3 0.57 C 9 + Clo C10 + C n A10,All 4 0.49 C12 + Cla C 4 + C 5 A4,A5,A7,A8
0.47 +C15+C16 + CT+Cs aTetraenes containing arachidonic acid methyl esters and an unknown component were isolated by AgNO3-TLC from FAME prepared with fatty acids of phospholipids from fiver mitochon- dria of rats fed a fat-free diet for 66 days. This fraction was then submitted to partial hydrazine reduction and monoenes {puri- fied by AgNO3-TLC) were submitted to ozonolysis in BF3/methanol. The resulting fragments (MME and DME} were identified by GC/MS.
bThe band numbers refer to Figure 2b.
MS). MME and DME were analyzed with a Hewlett- Packard 5890 gas chromatograph coupled with a 5970 Mass Selective Detector (Hewlett-Packard, Palo Alto, CA). A DB-WAX column (30 m • 0.25 mm I.D., 0.5 ~m film; J & W Scientific Inc., Folsom, CA) was used. The tempera ture was p rogrammed from 50 to 200~ at 20~ held at 200~ for 25 min, then programmed from 200 to 220~ and held at 220~ until completion of the analyses (22}.
RESULTS AND DISCUSSION
Identification of 20:4n-7. Figure l a shows a typical resolution of F A M E by gas ch romatography on a CpTMSil 88 capillary column. These F A M E were pre- pared from fiver mitochondrial phospholipids of rats fed a fat-free diet for 66 days {17). Three major peaks of FAME with 18 carbon atoms [ECL = 19.21 (Ia}, 19.50 (Ib} and 19.59 (Ic)] and at least four peaks with
LIPID& VoL 25, No. 12 (1990)
METHODS
861
TABLE 2
Retention Data a for the Tentative Identification of Some Minor Polyenes Associated with Fat-Deficiency
ECL d
Fatty acid Or.b FCL c Exp. Calc. d e Cor. ECLf
20:1A5 E 0 . 4 2 . . . . 20:1h7 I 0 .51 . . . . 20:1h8 E 0.53 . . . . 20:lh10 I 0 . 5 7 . . . . 20:lhll E,S 0.60 . . . . 20:1h13 S 0 . 6 9 . . . . 20:1A14 E 0 . 7 6 . . . . 20:2h11,14 E,S -- 21.50 21.36 0.14 -- 20:2h10,13 E -- 21.41 2 1 . 2 6 {+0.14} 21.40 20:2h8,11 E -- 21.27 2 1 . 1 3 {+0.14} 21.27 20:3A8,11,14 E,S -- 22.13 21.89 0.24 -- 20:3A5,8,11 E -- 21.76 21.55 0.21 -- 20:3A7,10,13 E -- 22.02 2 1 . 7 7 {+0.23} 22.00 aResults were obtained on a CP TMSil 88 fused silica ca2Pillary column b(50 m • 0.22 mm I.D.} operated at 185~ carrier gas (H2): 1.3 kg/cm . Origin of the sample. E, experimental; I, interpolated value; S, authentic commercial standard.
CFCL = ECL -- 20.00. dExp., experimental value; Calc., calculated value 120.00 + ~- FCL). eDifferences between experimental and calculated ECL values. Values in parentheses fc(ethylenic function adjustment} are used for the calculation of corrected ECL.
orrected ECL {20.00 + ~ FCL + d).
20 carbon a toms [ECL = 21.05 (Id), 21.27 (Ie), 21.41 (If} and 21.49 (Ig)] were present in the diene fraction isolated by AgNOs-TLC {Fig. lb), Peaks Ic and Ig {Fig. lb) had the same ECL as did authentic 18:2n-6 (19.59} and 20:2n-6 (21.49), respectively. The triene fraction contained two octadecatrienoic acids {peaks I I a and IIb) which did not correspond to either 18:3n-6 or 18:3n- 3, and four peaks corresponding to 20:3 isomers. Peak I I c (ECL = 21.76) and peak I I f (ECL = 22.13} corre- spond to 20:3n-9 and 20:3n-6, respectively. Peak I I d {ECL --21.89} is not associated with E F A deficiency and probably corresponds to 20:3A 5,11,14 (17). On the other hand, peak I I e {ECL = 22.02) is present only in fat-deprived ra ts {17}. The te t raene fraction showed a minor peak (8% of the to ta l fraction} with an ECL of 22.45 {peak I I Ia ) and a major peak ( I I Ib ; ECL = 22.62} corresponding to 20:4n-6. Analysis of this fraction on the CpTMWax 52 CB gave only one peak.
A ch romatogram of F A M E produced by part ial hydrazine reduction of the te t raene fraction is shown in Figure 2a. The f rac t ionat ion of these F A M E by AgNO3-TLC gave 12 bands {Fig. 2b). Band 1 (Rf = 0.90} contained 20:0. Four monoene bands {Rf -- 0.64, 0.57, 0.49 and 0.47) were observed, but two of these were poorly resolved and hence were combined {bands 2, 3, and 4 in Fig. 2b). No cross-contamination occurred with either dienes {first diene band: band 5; Rf = 0.28) or trienes {first triene band: band 8; Rf -- 0.08} {Fig. 2b).
The s t ruc ture of monoenes in bands 2, 3 and 4 was establ ished by GC/MS of the f ragments obtained after ozonolysis {Table 1). Besides major components origi- na t ing from 20:4n-6 {Table 1), we have identified MME: Cv, C10, C13, C1~; and DME: C4, C7, C10, C13. Due to some contaminants in the final solutions of DME and MME,
we could es tab l i sh only a few mass ra t ios be tween major and minor components: DME C1JDME C14 -- 0.10; DME C10/DME Cll = 0.10; and DME C7/DME C8 = 0.11. These values are similar to the initial mass rat io between the unknown te t raene and 20:4n-6. This component isolated by AgNO3-TLC with arachidonic acid is 20:4A4,7,10,13.
Tentative identification of minor fatty acids asso- ciated with E F A deficiency. D a t a obtained in this s tudy indicate tha t GLC analysis of F A M E on CpTMSil 88 columns is a simple and convenient means of separat- ing 20:4n-7. Other members of the n-7 family are prob- ably also resolved from the n-6 isomers on this type of column. Peak Ib {Fig. lb) is p resumably 18:2n-7, the major octadecadienoic acid which increases in the car- cass of ra ts during E F A deficiency (5). Peak Ia {Fig. lb) appears too broad to contain a single component. I t may thus correspond to the mixture of n-9 and n-10 isomers, which are also known to accumulate, bu t to a lesser extent than 18:2n-7 (5). Peaks Ia and Ib are also well resolved when a CpTMWax 52 CB ~s used. The small eicosatriene {peak IIe, Fig. lb) associated with fat deficiency has an ECL which is compatible with the ECL of 20:3n-7 calculated according to Ackman et al. {25}. This calculation is based on the summat ion of the f r a c t i o n a l cha in l e n g t h s (FCL} of the i n d i v i d u a l monoenoic elements and a correction t e rm which takes into account the number and the relative posit ions of ethylenic bonds {25}. The values for the FCL (FCL = ECL --20.00} of the A 7 and h 10 isomers have been interpolated from the FCL values of the A5, /~8, All and A14 i somers or ig ina t ing f rom par t ia l hydraz ine reduction of 20:2n-6 and of authentic A13 isomer (Table 2}. The appropr ia t e a d j u s t m e n t for the in te rac t ions due to the 3 ethylenic bonds was establ ished by calcu-
LIPIDS, Vol. 25, No. 12 (1990)
862
METHODS
lat ing the difference 6 between the experimental ECL (exp. ECL) and the calculated ECL of 20:3n-6 {6 = exp. E C L - - [ 2 0 . 0 0 + FCL(A8) + FCL(All) + FCL(A14)]) and of 20:3n-9. The ECL value of the unknown triene is quite close to the ECL value calculated for 20:3n-7 {22.00 vs 22.02; Table 2). Similar calculations indicate tha t peak I f (ECL -- 21.41} and peak Ie (ECL = 21.27} (Fig. l b and Table 2) could correspond to 20:2A10,13 and 20:2A8,11, respectively. Peak Id {Fig. lb) has the same ECL {21.05} as does 20:2A5,11 derived from 20:4n- 6 after part ial reduction with hydrazine {first peak of band 7, Fig. 2a and b). All these eicosadienoic acids were previously identified in the liver lipids of ra ts fed a fat-free diet (11).
F a t t y acids of the n-7 series account for a low percentage of liver mitochondrial phospholipid f a t ty acids at the end of the feeding period (about 3.3%}. However, it should be emphasized tha t this low level is nevertheless higher than the amount of n-3 acids which remains at this s tage {2.7%}. Consequently, n-7 acids cannot be considered as quant i ta t ively unimpor- t an t compounds, and this should be taken into account when f a t ty acid composit ions are tabulated.
REFERENCES 1. Fulco, A.J., and Mead, J.F. (1959) J. Biol. Chem. 234, 1411-
1416. 2. Fulco, A.J., and Mead, J.F. (1960) J. BioL Chem. 235, 3379-
3384. 3. Klenk, E., and Oette, K. {1960} Z. PhysioL Chem. 318, 86-99. 4. Privett, O.S., Blank, M.L., and Romanus, C. (1963} J. Lipid
Res. 4, 260-265. 5. Sand, D., Sen, N., and Schlenk, H. (1965) J. Am. Oil Chem.
Soc. 42, 511-516.
6. Mohrhauer, H., and Holman, R.T. {1965} J. Am. Oil Chem. Soc. 42, 639-643.
7. Klenk, E., and TschSpe, G. {1963} Hoppe-Seyler's Z. PhysioL Chem. 334, 193-200.
8. Lemarchal, P., and Munsch, N. {1965} C.R. Aca& Sci. 260, 714-716.
9. Sprecher, H. {1968} Biochim. Biophys. Acta 152, 519-530. 10. Spence, M.W. {1971} Lipids 6, 831-835. 11. Schmitz, B., Murawski, U., Pfltiger, M., and Egge, H. {1977}
Lipids 12, 307-313. 12. Gensler, W.J., and Bruno, J.J. {1963} J. Org. Chem. 28,
1254-1259. 13. Budny, J., and Sprecher, H. {1971} Biochim. Biophys. Acta
239, 190-207. 14. Pullarkat, R.K., and Reha, H. {1976} J. Chromatogr. Sci. 14,
25-28. 15. Karmiol, S., and Bettger, W.J. {1990} Lipids 25, 73-77. 16. Folch, J., Lees, M., and Sloane-Stanley, G,M. {1957} J. Biol.
Chem. 226, 497-509. 17. Wolff, R.L. (1988)Reprod~ Nutr. Develop. 28, 1489-1507. 18. Wolff, R.L., Combe, N.A., and Entressangles, B. {1985} Lip-
ids 20, 367-372. 19. Morrison, W.R., and Smith, L.M. {1964} J. Lipid Res. 5,
600-608. 20. Dudley, P.A., and Anderson, R.E. {1975} Lipids 10, 113-
114. 21. Conway, J., Ratnayake, W.M.N., and Ackman, R.G. {1985}
J. Am. Oil Chem. Soc. 62, 1340-1343. 22. Grandgirard, A., Piconneaux, A., S~b~dio, J-L., O'Keefe,
S.F., S~mon, E., and Le Qu~r~, J-L. {1989} Lipids 24, 799- 804.
23. Grandgirard, A., S~bedlo, J-L., and Fleury, J. {1984} J. Am. Oil Chem. Soc. 61, 1563-1568.
24. Ackman, R.G. (1972) Prog. Chem. Fats Other Lipids 12, 167-284.
25. Ackman, R.G., Manzer, A., and Joseph, J. {1974} Chromato- graphia 7, 107-114.
[Received October 19, 1989; Revision accepted September 29, 1990]
LIPIDS, Vol. 25, No. 12 (1990)


![Liquid Chromatography-Electrospray Linear Ion Trap Mass … · 2020. 4. 28. · endogenous pain inhibition [Machelska, 2007, Wahlert et al. 2013, Bali et al., 2014]. They are interacting](https://img.pdfslide.fr/doc/110x75/5fc77da35f3e03336154408d/liquid-chromatography-electrospray-linear-ion-trap-mass-2020-4-28-endogenous.jpg)