Embed Size (px)
Citation preview
Small-Angle Scattering Studies of Nafion Membranes
E. J. ROCHE, M. PINERI, R. DUPLESSIX,* and A. M. LEVELUT,? Departement de Recherche Fondamentale, Section de Physique du Solide,
Centre d'Etudes Nucle'aires de Grenoble, 85 X , 38041 Grenoble Ce'dex, France
Synopsis
The physical structure of Nafion membranes has been investigated by small-angle neutron scat- tering (SANS) and small-angle x-ray scattering (SAXS). Samples in the acid form may exhibit two scattering peaks. The first, observed by SANS at an angle corresponding to a Bragg spacing of 180 A, is shown to arise from structures in crystalline regions. A second peak at larger scattering angles is shown to arise from ion-containing regions which may be swollen with water. Salt-form samples made by soaking the acid form in an aqueous salt solution can also exhibit the same two scattering signals. But in amorphous salt-form samples produced by quenching from the melt the first peak is absent. This permits a more accurate study of the second peak by SAXS, which shows that the second scattering component is present as a maximum over a wide range of water contents but is absent in a sample dried at 200OC. The position of the peak shifts to lower scattering angles (or larger spacings) at higher water contents. Possible structural models that might give rise to the maximum are discussed. A calculation of the SAX invariant is made and results are consistent with a phase separation of a large fraction of the water.
INTRODUCTION
The physical structure of ion-containing polymers has been the subject of many recent investigations.1,2 Of particular interest are the structures resulting from phase separation or clustering of ionic side groups in polymers with nonpolar main chains. Nafion membranes recently developed by the DuPont Company as electrochemical separators represent an example of this type with a number of interesting properties.3>4 These polymers have a perfluoroethylene backbone and contain various amounts of the acid side-chain
-0-CF2- FF -0-CF2-CF2-S03-H CF3
The number of side-chains present can be indicated in terms of the equivalent weight or weight of acid polymer which will neutralize one equivalent of base. In this study membranes with an equivalent weight of 1200 have been used, which corresponds to a copolymer composition of about 15 mole %. Neutraiization of the acid form may be carried out by soaking a film in an aqueous salt solution. Both the acid and salt forms have very high diffusion coefficients for water of the order of 2 X cm2/sec and can absorb quantities of water as large as 60% by volume, as found in this study. The absorption of water occurs with a re- tention of high sample clarity suggesting that the water is dispersed in particles too small to scatter light. This observation along with the reported mechanical and dielectric properties4 suggest a microphase structure.
* Institut Laue Langevin, BP 156 - 38042 Grenoble, France. + Universit6 Paris Sud, Laboratoire de Physique des Solides-91405 Orsay, France.
Journal of Polymer Science: Polymer Physics Edition, Vol. 19,l-ll(l981) 0 1981 John Wiley & Sons, Inc. 0098-1273/81/0019-OOl$Ol.lO
2 ROCHE ET AL.
The initial morphological study was made by Gierke5 who found evidence for clustering of water molecules. Small-angle x-ray scattering (SAXS) intensities after multiplication by where 26 is the scattering angle, showed two max- ima. The first corresponding to a Bragg spacing of 120 A was observed to de- crease in intensity with increasing sulfonic acid content. No clear assignment of this peak was made. The second maximum, observed at a Bragg spacing of 50 A, increased in intensity with increasing water content. The 50 A peak was assigned to an average distance between hydrated clusters. This treatment of scattering results must be criticized on two grounds. First the multiplication of the curves by (20)2 has no justification in this case. Such a correction factor is correct only for comparing scattering from lamellar shaped particles with a one-dimensional theoretical model but has no general validity. Secondly, the interpretation of the 50 A peak as an average separation distance between clusters is questionable since such an assignment can only be made for system possessing long-range order," a criterion not established for ionomers. The assignment of scattering maximum in ionomers has been a matter of some controversy7 and can only generally be made after a thorough study of the effect of concentration or with the aid of stretching or swelling experiments.
EXPERIMENTAL
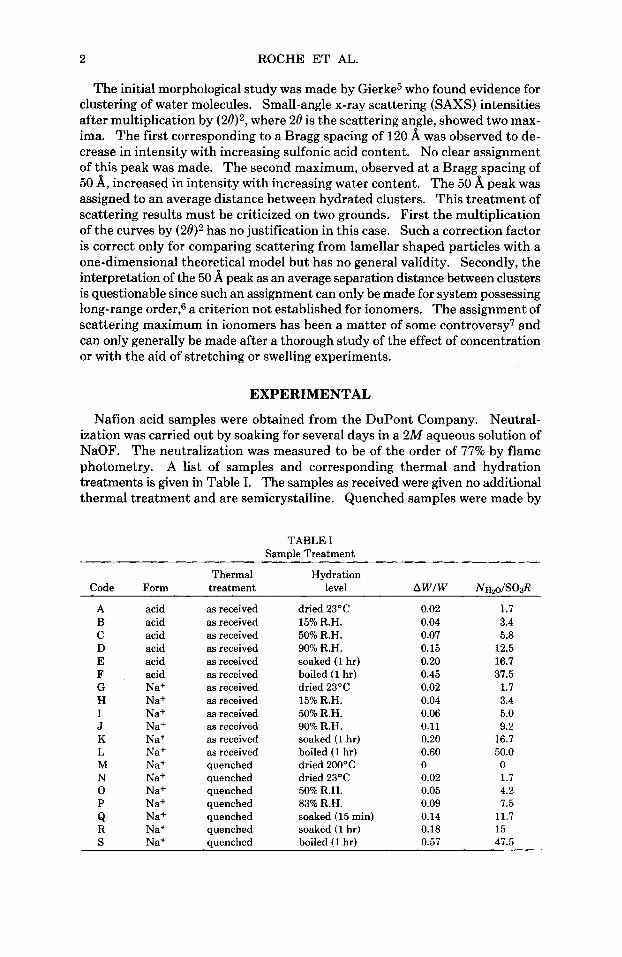
Nafion acid samples were obtained from the DuPont Company. Neutral- ization was carried out by soaking for several days in a 2M aqueous solution of NaOF. The neutralization was measured to be of the order of 77% by flame photometry. A list of samples and corresponding thermal and hydration treatments is given in Table I. The samples as received were given no additional thermal treatment and are semicrystalline. Quenched samples were made by
TABLE I Samule Treatment
Thermal Hydration Code Form treatment level A WIW NH,oISO~R
A acid as received dried 23°C 0.02 1.7 B acid as received 15% R.H. 0.04 3.4 C acid as received 50% R.H. 0.07 5.8 D acid as received 90% R.H. 0.15 12.5 E acid as received soaked (1 hr) 0.20 16.7 F acid as received boiled (1 hr) 0.45 37.5 G Na+ as received dried 23°C 0.02 1.7 H Na+ as received 15% R.H. 0.04 3.4 I Na+ as received 50% R.H. 0.06 5.0 J Na+ as received 90% R.H. 0.11 9.2 K Na+ as received soaked (1 hr) 0.20 16.7 L Na+ as received boiled (1 hr) 0.60 50.0
N Na+ quenched dried 23°C 0.02 1.7 0 Na+ quenched 50% R.H. 0.05 4.2
Q Na+ quenched soaked (15 min) 0.14 11.7 R Na+ quenched soaked (1 hr) 0.18 15
M Na+ quenched dried 200°C 0 0
P Na+ quenched 83% R.H. 0.09 7.5
S Na+ a uenched boiled (1 hr) 0.57 47.5
SMALL-ANGLE SCATTERING 3
heating samples to 330°C for 1 hr and then passing hydrogen gas over the film for quenching. Quenching speeds obtained by such a procedure are one or two orders of magnitude greater than is usual for quenching in liquids. Before hy- dration, samples were dried at 23OC under flowing nitrogen gas and then were hydrated at different humidity levels in a hydration cell. Different relative humidities (R.H.) were achieved by controlling the temperature of a water bath through which air was passed before entering the cell. Higher absorption was achieved by soaking or boiling samples for various times. Table I1 lists the weight of water absorbed relative to the dry weight A WlWo along with the corre- sponding number of water molecules per sulfonate group NH2@o&. The dry weight corresponds to that of a sample dried at 200°C. The SANS experiments were carried out on the D11 and D17 scattering apparatuses at the Laue Langevin Institute in Grenoble. SAXS studies were made with a camera using Co K a radiation (X = 1.79 A) and slit collimation. A correction for desmearing was made using the desmearing program of Dijkstra et aL8 The intensity of the in- cident beam used to calculate absolute SAXS intensities was measured with a set of standard attenuators.
RESULTS AND DISCUSSION
Information about the structure of a material is obtained from small angle scattering by analyzing the coherent scattered intensity which is given by
I(Q) = Z C did; exp[-iQ - (ri - rj)] i ;
where Q is the scattering vector whose magnitude is given by 27r sin(O/X), where 0 is half the scattering angle and X is the wavelength of the incident radiation. The vector ri is drawn from an arbitrary origin to a point i which possesses a scattering factor di. For a system with two scattering components eq. (1) can be simplified to give
(2) I(Q) = C(di - dd2S(Q)
where
where d l and d2 denote the scattering factors of region 1 and 2, C is a constant, and ( ) in eq. (3) denotes an average. For small-angle neutron scattering (SANS), the scattering factor is proportional to the coherent neutron scatter- ing-length density ,&H, giving the result that
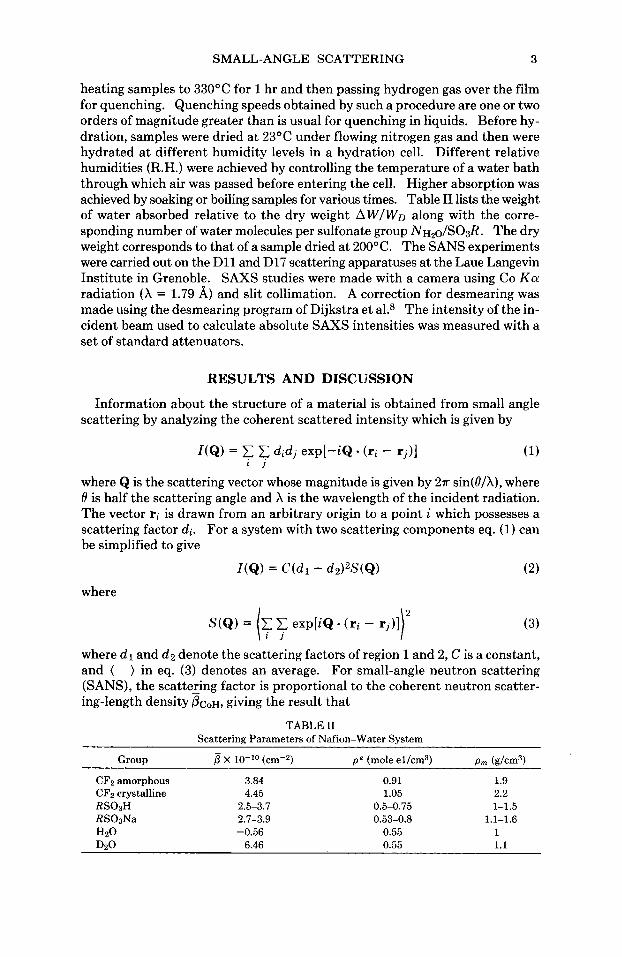
TABLE I1 Scattering Parameters of Nafion-Water System
Group x 10-*0 (cm-2) pe (mole el/cm3) pm (g/cm3)
CFP amorphous 3.84 CF2 crystalline 4.45 RS03H 2.5-3.7 RS03Na 2.7-3.9 HzO -0.56 Dz0 6.46
0.91 1.9 1.05 2.2
0.5-0.75 1-1.5 0.53-0.8 1.1-1.6
0.55 1 0.55 1.1
4 ROCHE ET AL.
The coherent scattering-length density is defined by
where p is the mass density, and n is the number of atoms with scattering length b and mass m. For SAXS the contrast is determined by the difference in electron density
(dl - d2)2 = (P? - P'2)2 (6) Values of coherent neutron scattering length densities and electron densitiek relevant to the Nafion-water system are given in Table 11. Values for CF2 are given corresponding to mass densities of 2.2 and 1.9 g/cm3 for crystalline and amorphous materials, respectively. An excellent SANS contrast exists between either amorphous or crystalline CF2 and H20. A difference of 4 X 1O1O cm-2 is generally considered good enough to give a reasonable signal. The difference between the side groups and the CF2 backbone is less well defined owing to uncertainties in the mass densities but is certainly much smaller. Thus the SANS technique is much less sensitive to aggregation of the ionic groups than it is to aggregation of water molecules. A similar situation exists for SAXS with relatively large electron density difference between CF2 and water and a smaller contrast between CF2 and the ionic side groups.
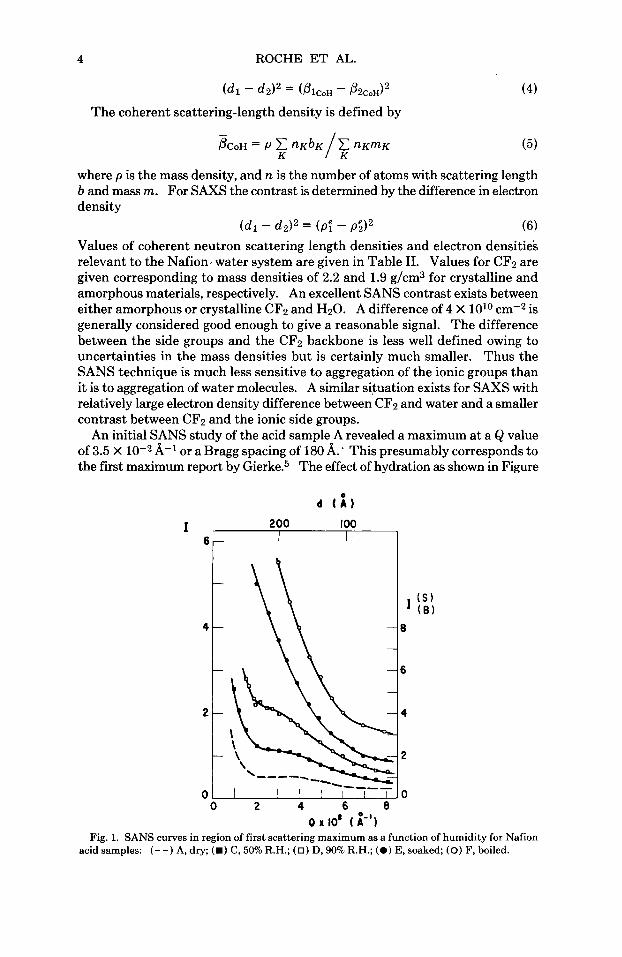
An initial SANS study of the acid sample A revealed a maximum at a Q value of 3.5 X A-1 or a Bragg spacing of 180 A. * This presumably corresponds to the first maximum report by Gierke.5 The effect of hydration as shown in Figure
d t i ) I 200 I00
I I
0 x 10' (2'1 Fig. 1. SANS curves in region of first scattering maximum as a function of humidity for Nafion
acid samples: ( - - ) A, dry; (m) C, 50% R.H.; (0) D, 90% R.H.; ( 0 ) E, soaked; (0) F, boiled.
SMALL-ANGLE SCATTERING 5
1 for samples A-F is to increase the intensity and to change the maximum into a shoulder. In a subsequent study films soaked in different mixtures of D20 and H20 were studied in the same Q range as shown in Figure 2. This kind of isotopic replacement experiment can give information about the number of phases or contrast regions present. If only two such regions are present the intensities for samples i and j with different isotopic constants can be superimposed ac- cording to the relation
(7)
where Iinc represents the constant incoherent scattering intensity resulting largely from the hydrogen atoms and K is a constant. It was determined that no rea- sonable values for Iinc and K could be found to superimpose the curves of Figure 2. Therefore there must be at least three different contrast regions present in the sample.
From wide-angle x-ray scattering (WAXS) studies it was found that the acid samples possess a degree of crystallinity of the order of 15-20% based on an analysis of the crystalline diffraction ring at 5.0 A and the amorphous halo at 4.9 A. These correspond to rings observed for polytetrafloroethylene. Electron microscope studies also show regions with dimensions of several hundred Ang- stroms that give rise to crystalline diffraction patterns. The results give evidence for the existence of two different contrast regions namely crystalline and amorphous CF2 regions. On the basis of the isotopic replacement experiment
[li - U i n J i I = K[lj - (1inc)jI
d t i ,
I w r
Q a 10' ( i-') Fig. 2. SANS curves in region of first scattering maximum for Nafion acid samples soaked in
various H20/D20 mixtures: (0) HzO, (m) 75 H20/25 DzO, ( 0 ) 50 H20/50 D20, (+) 25 H20/75 D20, (0 ) Dz0.
6 ROCHE ET AL.
a third phase presumably containing ionic groups and water must be postu- lated.
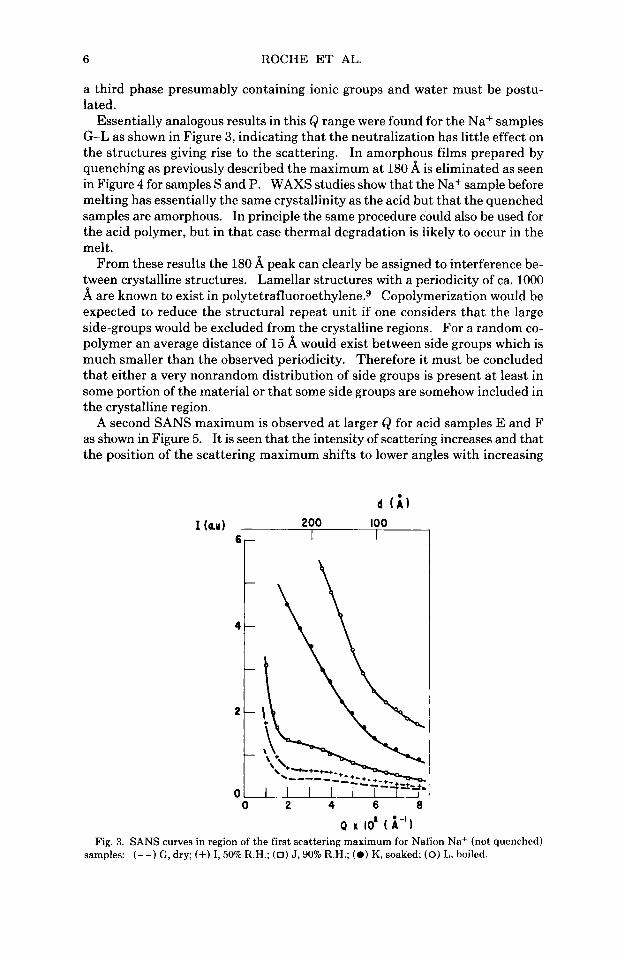
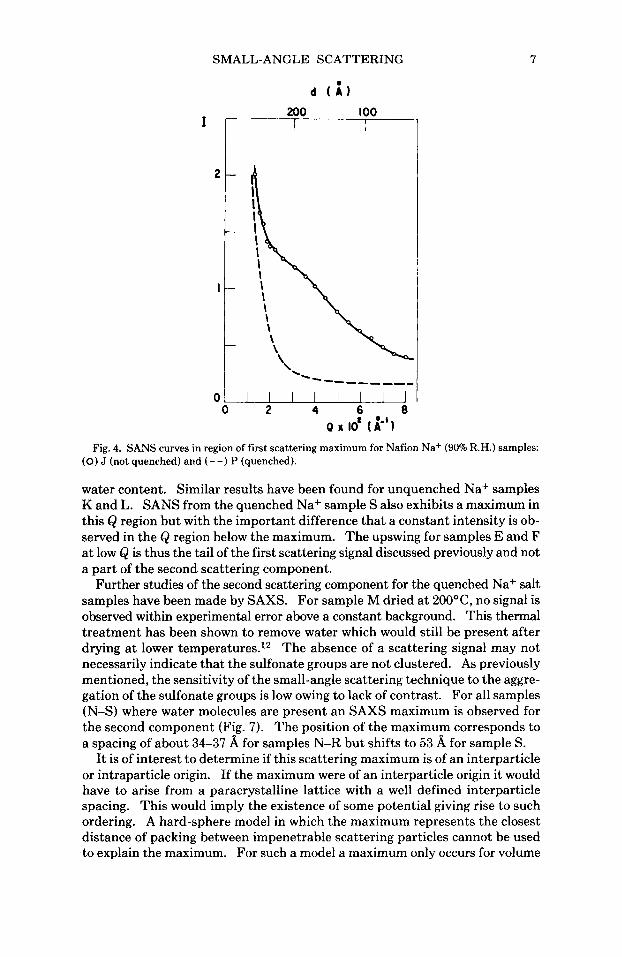
Essentially analogous results in this Q range were found for the Na+ samples G-L as shown in Figure 3, indicating that the neutralization has little effect on the structures giving rise to the scattering. In amorphous films prepared by quenching as previously described the maximum at 180 8, is eliminated as seen in Figure 4 for samples S and P. WAXS studies show that the Na+ sample before melting has essentially the same crystallinity as the acid but that the quenched samples are amorphous. In principle the same procedure could also be used for the acid polymer, but in that case thermal degradation is likely to occur in the melt.
From these results the 180 8, peak can clearly be assigned to interference be- tween crystalline structures. Lamellar structures with a periodicity of ca. 1000 8, are known to exist in polytetraflu~roethylene.~ Copolymerization would be expected to reduce the structural repeat unit if one considers that the large side-groups would be excluded from the crystalline regions. For a random co- polymer an average distance of 15 8, would exist between side groups which is much smaller than the observed periodicity. Therefore it must be concluded that either a very nonrandom distribution of side groups is present a t least in some portion of the material or that some side groups are somehow included in the crystalline region.
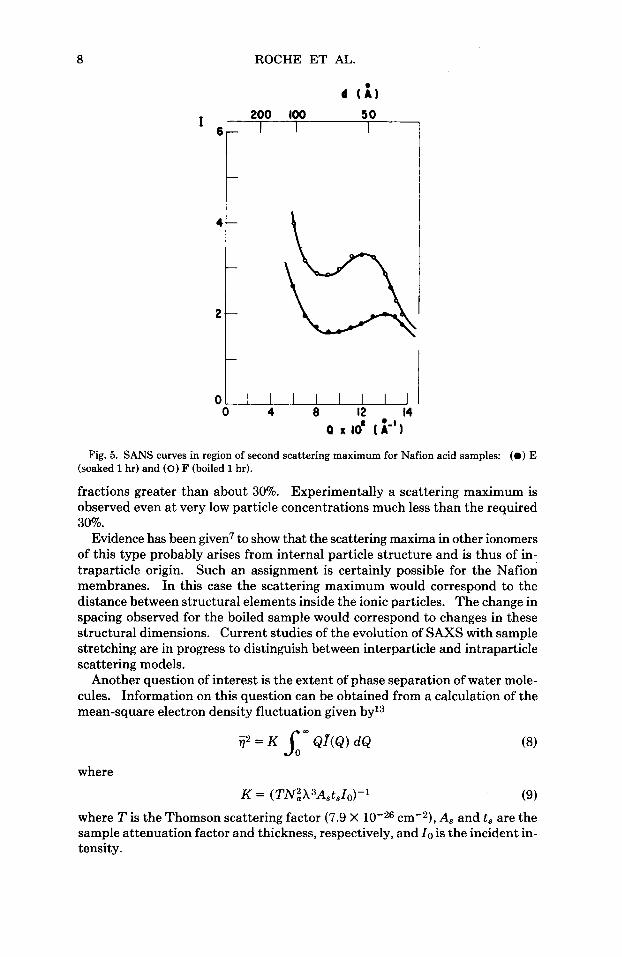
A second SANS maximum is observed at larger Q for acid samples E and F as shown in Figure 5. It is seen that the intensity of scattering increases and that the position of the scattering maximum shifts to lower angles with increasing
I (ad 200 100
7- I
0 2 4 6 8
Q x 10' ( i-') Fig. 3. SANS curves in region of the first scattering maximum for Nafion Na+ (not quenched)
samples: ( - - ) G, dry; (+) I, 50% R.H.; ( 0 ) J, 90% R.H.; ( 0 ) K, soaked; (0) L, boiled.
SMALL-ANGLE SCATTERING
d (i) 200 I00
I I
7
01 I I 1 I I I 0 2 4 6 8
0 x lo* ( 2' 1 Fig. 4. SANS curves in region of first scattering maximum for Nafion Na+ (90% R.H.) samples:
(0) J (not quenched) and ( - -) P (quenched).
water content. Similar results have been found for unquenched Na+ samples K and L. SANS from the quenched Na+ sample S also exhibits a maximum in this Q region but with the important difference that a constant intensity is ob- served in the Q region below the maximum. The upswing for samples E and F at low Q is thus the tail of the first scattering signal discussed previously and not a part of the second scattering component.
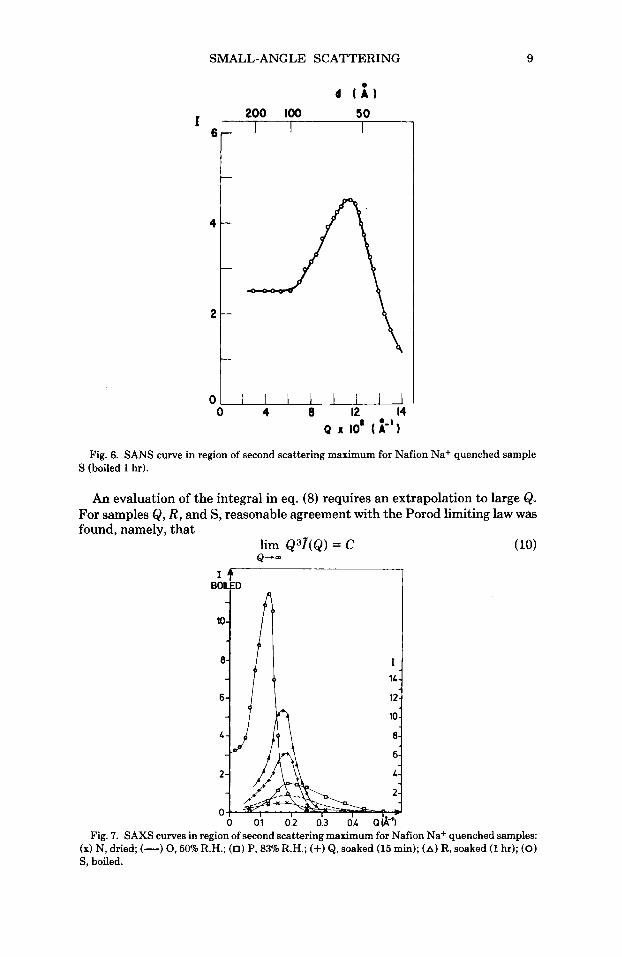
Further studies of the second scattering component for the quenched Na+ salt samples have been made by SAXS. For sample M dried at 200°C, no signal is observed within experimental error above a constant background. This thermal treatment has been shown to remove water which would still be present after drying a t lower ternperatures.l2 The absence of a scattering signal may not necessarily indicate that the sulfonate groups are not clustered. As previously mentioned, the sensitivity of the small-angle scattering technique to the aggre- gation of the sulfonate groups is low owing to lack of contrast. For all samples (N-S) where water molecules are present an SAXS maximum is observed for the second component (Fig. 7). The position of the maximum corresponds to a spacing of about 34-37 for samples N-R but shifts to 53 A for sample S.
It is of interest to determine if this scattering maximum is of an interparticle or intraparticle origin. If the maximum were of an interparticle origin it would have to arise from a paracrystalline lattice with a well defined interparticle spacing. This would imply the existence of some potential giving rise to such ordering. A hard-sphere model in which the maximum represents the closest distance of packing between impenetrable scattering particles cannot be used to explain the maximum. For such a model a maximum only occurs for volume
8 ROCHE ET AL.
t
t 0
0 4 8 12 14 Q 1 10' ( i-' 1
Fig. 5. SANS curves in region of second scattering maximum for Nafion acid samples: (0 ) E (soaked 1 hr) and (0) F (boiled 1 hr).
fractions greater than about 30%. Experimentally a scattering maximum is observed even at very low particle concentrations much less than the required 30%.
Evidence has been given7 to show that the scattering maxima in other ionomers of this type probably arises from internal particle structure and is thus of in- traparticle origin. Such an assignment is certainly possible for the Nafion membranes. In this case the scattering maximum would correspond to the distance between structural elements inside the ionic particles. The change in spacing observed for the boiled sample would correspond to changes in these structural dimensions. Current studies of the evolution of SAXS with sample stretching are in progress to distinguish between interparticle and intraparticle scattering models.
Another question of interest is the extent of phase separation of water mole- cules. Information on this question can be obtained from a calculation of the mean-square electron density fluctuation given byls
where
K = (TN~X3AstsIo)-1 (9)
where T is the Thomson scattering factor (7.9 X cm-2), A, and t, are the sample attenuation factor and thickness, respectively, and I0 is the incident in- tensity.
SMALL-ANGLE SCATTERING 9
200 loo 50
'6- r c
t
O U U
Q x 10' ( 2') 0 4 8 12 14
Fig. 6. SANS curve in region of second scattering maximum for Nafion Na+ quenched sample S (boiled 1 hr).
An evaluation of the integral in eq. (8) requires an extrapolation to large Q . For samples Q , R , and S, reasonable agreement with the Porod limiting law was found, namely, that - .
lim Q31(Q) = C 4--..
Fig. 7. SAXS curves in region of second scattering maximum for Nafion Na+ quenched samples: (x) N, dried; (-) 0,50% R.H.; ( 0 ) P, 83% R.H.; (+) Q, soaked (15 min); (A) R, soaked (1 hr); (0) S, boiled.
10 ROCHE ET AL.
4-
3-
2-
1-
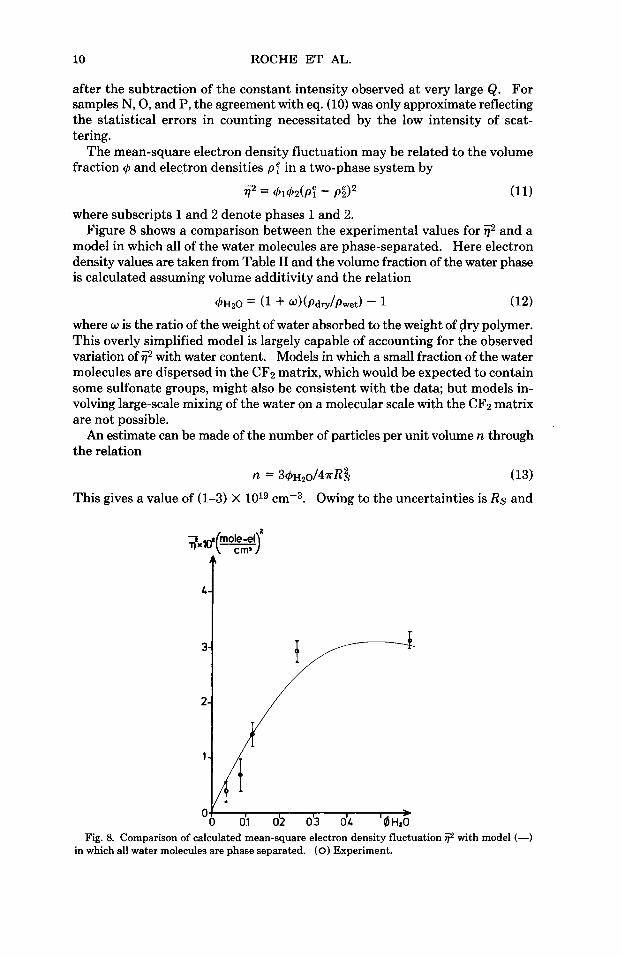
after the subtraction of the constant intensity observed at very large Q. For samples N, 0, and P, the agreement with eq. (10) was only approximate reflecting the statistical errors in counting necessitated by the low intensity of scat- tering.
The mean-square electron density fluctuation may be related to the volume fraction 6 and electron densities p! in a two-phase system by
(11)
where subscripts 1 and 2 denote phases 1 and 2. Figure 8 shows a comparison between the experimental values for f 2 and a
model in which all of the water molecules are phase-separated. Here electron density values are taken from Table I1 and the volume fraction of the water phase is calculated assuming volume additivity and the relation
(12)
where w is the ratio of the weight of water absorbed to the weight of dry polymer. This overly simplified model is largely capable of accounting for the observed variation of with water content. Models in which a small fraction of the water molecules are dispersed in the CF2 matrix, which would be expected to contain some sulfonate groups, might also be consistent with the data; but models in- volving large-scale mixing of the water on a molecular scale with the CF2 matrix are not possible.
An estimate can be made of the number of particles per unit volume n through the relation
n = 36~~0/47rRi (13)
This gives a value of (1-3) X 1019 ~ m - ~ . Owing to the uncertainties is R s and
G2 = 6162(PY - PSI2
6H20 = (1 -k w)(Pdry/Pwet) - 1
A
0 li' 0 01 02 0.3 OL BHz0
Fig. 8. Comparison of calculated mean-square electron density fluctuation with model (-) in which all water molecules are phase separated. (0) Experiment.
SMALL-ANGLE SCATTERING 11
4 ~ ~ 0 it is not possible to define n accurately as a function of water content. An initial c a l ~ u l a t i o n ~ ~ indicated a possible decrease in n at high water content, perhaps implying particle coalescence. In fact a more accurate subsequent analysis taking into account experimental error shows that n may remain con- stant.
CONCLUSIONS
(i) The perfluorinated backbone of Nafion polymers may crystallize forming superstructures which give rise to a scattering maximum at 180 A. Amorphous films prepared by quenching do not show this scattering maximum.
(ii) The structure of acid and salt forms of the membrane is very similar in terms of the size and structure of particles containing clustered water mole- cules.
(iii) The scattering signal arising from the ionic regions exhibits a maximum over a wide range of water concentrations. A hard-sphere model cannot be used to explain the maximum since the maximum is present even at very low water concentrations. Models involving an internal ionic aggregate structure or a paracrystalline ordering of the aggregates may be possible. The latter is deemed less likely in view of the absence of any known long-range ordering potential.
(iv) A large majority of the water molecules are phase separated as indicated by an analysis of the mean-square electron-density fluctuation.
References
1. A. Eisenberg and M. King, Zon Containing Polymers, Academic, New York, 1977. 2. L. Holliday, Ionic Polymers, Applied Science, New York, 1975. 3. F. B. Leitz, M. A. Accomazzo, and S. A. Michalek, papers presented a t 141st Meeting of
4. S. C. Yeo and A. Eisenberg, J. Appl. Polym. Sci., 2,875 (1977). 5. T. Gierke, paper presented a t Electrochemical Society Meeting, Atlanta, 1977. 6. A. Guinier and G. Fournet, Small Angle Scattering of X-Rays, Wiley, New York, 1955, p.
I. E. Roche, R. S. Stein, T. P. Russell, and W. J. MacKnight, to J. Polym. Sci. Polym. Phys. Ed.,
8. A. Dijkstra, G. Kortleve, and C. Vonk, Colloid Polym. Sci., 210,127 (1966). 9. D. C. Bassett and R. Davitt, Polymer, 16 (1975).
10. T. Takamatsu and A. Eisenberg, to be published. 11. A. Guinier and G. Fournet, Small Angle Scattering of X-Rays, Wiley, New York, 1955, pp.
12. B. Rodmacq, J. M. Coey, M. Escoubez, E. Roche, R. Duplessix, A. Eisenberg, and M. Pineri,
13. D. S. Brown, F. P. Warner, and R. E. Wetton, Polymer, 13,575 (1972). 14. B. Rodmacq, J. M. Coey, M. Escoubez, E. Roche, R. Duplessix, A. Eisenberg, and M. Pineri,
Electrochemical Society, Houston, TX, 1972.
141.
submitted.
41-52.
Am. Chem. SOC. Adu. Chem. Ser., to appear.
Am. Chem. Soc. Adu. Chem. Ser., toappear.
Received January 28,1980 Accepted May 23,1980


![Asymptotique des pôles de la matrice de scattering …PÔLES DE LA MATRICE DE SCATTERING 3 qui sont disposés sur des lignes Im z = este et appelles pseudopôles par CB.G.R]. Pour](https://img.pdfslide.fr/doc/110x75/5f090dcb7e708231d425028d/asymptotique-des-ples-de-la-matrice-de-scattering-ples-de-la-matrice-de-scattering.jpg)