Embed Size (px)
Citation preview
Submicronic Raman and Transverse Dynamic Force Microscopy Spectroscopies toInvestigate the Physical Chemistry of Surface Nanoheterogeneities
Bernard Humbert,* ,† Jerome Grausem,† and Daniel Courjon‡
Laboratoire de Chimie Physique et Microbiologie pour l’EnVironnement, UHP Nancy I-CNRS, UMR 7564,405 rue de VandoeuVre, 54 600 Villers-le`s-Nancy, France, and Laboratoire d’Optique P.M. Duffieux,UniVersitede Franche-Comte´-CNRS, UMR 6603, route de Gray, 25030 Besanc¸on Cedex, France
ReceiVed: August 29, 2003; In Final Form: July 11, 2004
On the basis of an experimental example, this paper demonstrates the intrinsic complementary nature betweenthe subwavelength Raman spectroscopy and the tip-sample interaction measurements, in a scanning nearfield optical microscope device. This paper displays a good illustration of possibilities given by this kind ofdevice to study the interfaces in physical chemistry. The Raman spectra of the optical near field obtained ona lead sulfate sample shows that the surface of this sample is polluted by nanophases of copper sulfate. Theseimpurities, which are not displayed by the usual backscattered far field Raman spectrum recorded in confocalRaman microspectroscopy, are localized at a subwavelength scale and are revealed by a particular behaviorin transverse dynamic force (usually noted as shear force) measurements too, in comparison with those obtainedover the surface of the lead sulfate sample free from impurities. These differences in probe-sample adhesionthroughout a sample are caused by an inhomogeneous distribution of surface water, which is clearly explainedby the chemical identification of the nanophases by Raman spectroscopy of the optical near field. Theheterogeneous water adsorption at the sample/air interface under a reduced relative humidity is displayed byboth the near field optical spectroscopy and the shear force microscopy measurements.
Introduction
Predicting how solids grow and dissolve in aqueous mediumunder various conditions requires a thorough understanding ofthe fundamental surface reaction mechanisms. Surface hetero-geneities of either compositional or morphological origin areknown to drastically affect interface phenomena. Depending ontheir chemical and topological pattern, these surface heteroge-neities often generate a wide variety of singularities when theyare involved in interfacial phenomena. Scanning probe micros-copy (SPM) may be used to investigate the superficial mech-anisms that control dissolution, precipitation, or growth ofminerals. Sulfate anions are often cited in such mechanisms inenvironmental studies. Sulfate strongly adsorbs to many mineralssurfaces and competes with other adsorbing compounds forsurface sites. Questions about the mechanism of sulfate adsorp-tion and the structure of sulfate surface complexes remain. Forexample, the following issues are not resolved:
(i) is sulfate adsorbed as an innersphere or an outerspherecomplex? (Inner sphere in this context refers to the situationwhere sulfate replaces one or several surface hydroxyl groups,resulting in the coordination of at least one sulfate oxygen atomwith a surface metal site.)
(ii) Is the structure mono or bidentate?(iii) Is the structure mono or binuclear, chelating or bridging?(iv) Is the spatial distribution of the adsorption sites homo-
geneous at the interface or is it heterogeneous?To answer this nonexhaustive listing of questions, one must
use an experimental approach able to combine both localizationand structural-chemical identification. For example, the surfacecomplexation of sulfate by hematite has been studied by
vibrationnal infrared absorption spectroscopy and scanningtunneling microscopy on the same sample by Eggleston et al.1,2
However, in their work, both experiments are carried outseparately, one after another. Therefore, we have developed anexperimental method combining submicronic localization andRaman spectroscopy.3,4-7 Indeed, Jancke et al. demonstratedthe feasibility of the Raman spectroscopy of the optical nearfield with a lateral resolution smaller than 100 nm.8,9 In thispaper, we report our experiments of near field Raman spec-troscopy (NFRS) obtained without exaltation effect on metallicsulfate samples. Initially, our experimental goal was to know ifthe sulfate groups may be a molecular probe that is activeenough in NFRS experiments to localize and characterizesubmicronic spatial heterogeneous areas. Consequently, a firststep was to show that the NFRS was able to separate two kindsof sulfate complexes. This experimental step drove us toconsider some synthetic samples with a controlled mixture ofseveral metallic sulfate phases. These mixtures display experi-mentally also a large difference in their tip-sample adhesionbehaviors. Indeed, our optical device using a distance controlmechanism that measures the amplitude of the interactionsbetween the optical tip and the sample has shown that thevibrating behavior of the tip differs from a sulfate sample toanother. In this paper, we consider one of our samples that hasbeen accidentally obtained but that illustrated the complemen-tarities of the NFRS and of the force microscopy.
For a long time, diffraction inherent in all magnifying lenseshas limited the resolution of classical optical microscope to one-half of the wavelength of the light (typically 250 nm for visiblelight). In 1928, E. H. Synge proposed a novel optical microscopethat could overcome the diffraction barrier.10,11 In 1982, mostof the mechanical problems were solved by the invention ofthe scanning tunneling microscope (STM),12 and the first
* Corresponding author. E-mail: [email protected].† Laboratoire de Chimie Physique pour l’Environnement.‡ Universitede Franche-Comte´-CNRS.
15714 J. Phys. Chem. B2004,108,15714-15720
10.1021/jp036570d CCC: $27.50 © 2004 American Chemical SocietyPublished on Web 09/14/2004
scanning near field optical microscope (SNOM or NSOM) hadbeen demonstrated in 1984 by D. Pohl.13 At present, SNOM isoften combined with shear force feedback to maintain the tipto sample distance and uses high optical throughput fiber opticetched probes.14,15 Super resolved transmission or reflectionimages providing both topographical and optical properties (i.e.,local refractive index) are obtained now commonly with aresolution ofλ/10. Resolutions ofλ/20 have been achieved.16
One of the most powerful applications of SNOM should besubwavelength spectroscopy, providing spectral contrasts atsubwavelength resolution. An ambitious application was todevelop a Raman near field microscope. Rather than obtaininga better spatial lateral resolution than those obtained with aconfocal far field device, one of the aims in developing NFRSwould be the spectroscopic study of submicronic heterogeneitiesat the interfaces. Indeed, since the near field decreases stronglyversus the distance, the optical near field in the solid phasecollected by a nanodetector or generated by a nanosource isdominated by the signals coming from the volume close to theinterface (signals coming from a depth beyond 100 nm are fourtimes weaker than the ones coming from the surface).7,17
With both the developments of lasers and detectors (CCD),but also with the elaboration of high throughput probes withresearch concerning the geometry of the tip, the inelastic Ramaneffect, even with its poor quantum efficiency, is detectable inthe near field.3-7 Recently, NFRS has been used to study silicon,polydiacetylene, diamond, Rd-doped KTP, rhodamine 6G,3-hydroxykynurenine, cobalt phthalocyanine, benzoic acid, CCl4,polyphenylenevinylene, and CuSO4‚5H2O.3-9,17-34 In our previ-ous works, the Raman spectra of the CuSO4 sample werecollected in the optical near field, without assigning the spectraldifferences between near field and far field spectra.6 In this work,we have driven an experiment on a PbSO4 sample under arelative humidity of 5-10% at 24°C. We will discuss therecorded NFR spectra in relation to the local water adsorptiondisplayed by the tip-sample shear force measurements.
Experimental Procedures
The Raman excitation source is a Spectra-Physics laserStabilite 2017 (wavelength used:λ ) 514.5 nm). The spec-trometer is a Jobin-Yvon Raman T64000, with a liquid nitrogencooled CCD multichannel detector. A holographic NOTCH filteror a double subtractive stage with 1800 grooves mm-1 gratingsmay be used to remove the Rayleigh scattering. A singledispersion stage with an 1800 grooves mm-1 grating is placedin front of the detector. The spectral resolution with an excitationat 514.5 nm is 2.7 cm-1. The confocal Raman microprobe isconstituted by an Olympus microscope, equipped with amotorizedXY stage with a step of 80 nm. The lateral Ramanresolution has been estimated on a sample built with siliconlines of 3µm in a width separated by 3µm on a gold substrate.7
To estimate the spatial resolution, we will consider the lateralresolution definition as the minimal distance to separate twodifferent points of a test sample that is constituted by differentchemical species. However, it is very difficult to prepare suchsamples at scales of 100 nm. Therefore, we estimate the lateralresolution only at the boundaries of an object: the lateralresolution value will be the necessary displacement betweenmaximum to minimum collected signal.7 This definition maybe, of course, questionable, since for instance, it depends onthe signal/noise ratio, but in practice for our experiments at thesubwavelength scales, it is the only definition that can beapplied. To be coherent in this paper, we have applied thisdefinition to estimate the resolution of our conventional confocaldevice: the measured value is 700 nm.
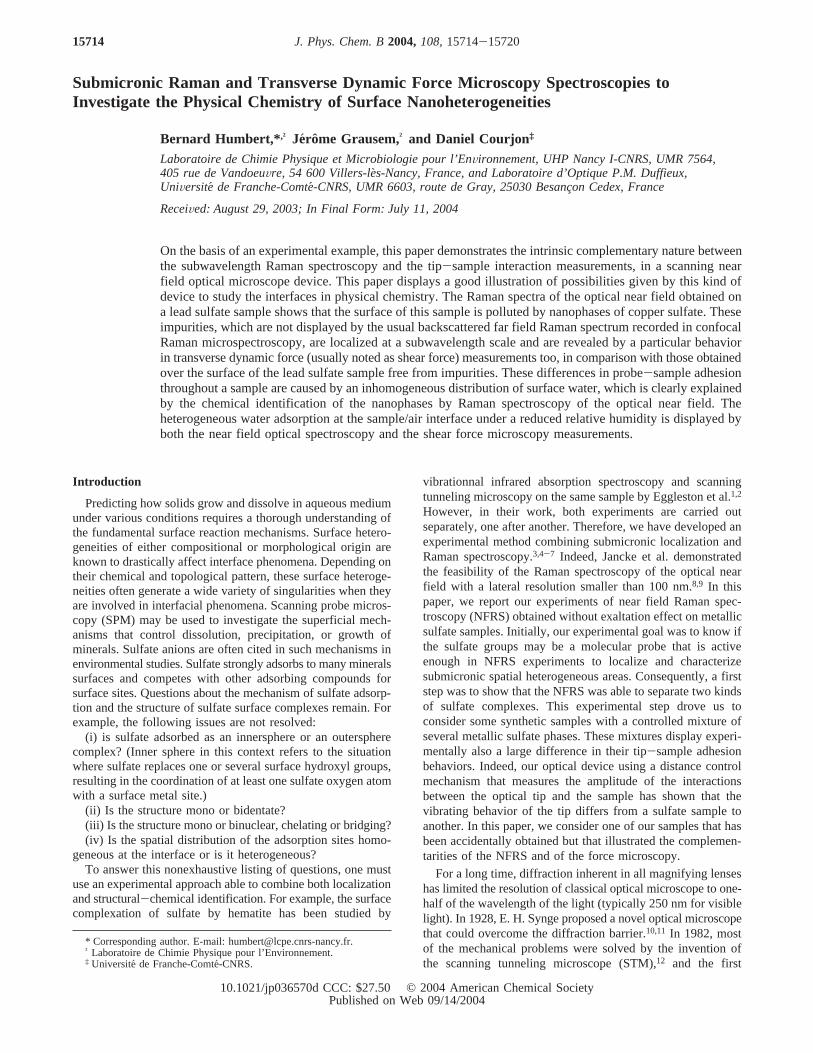
The homemade near field microscope is schemed in Figure1. Its principle is based on a shear force scanning near fieldoptical microscope developed previously by Courjon et al. (areview on the usual near field optics and their applications isgiven in the book of M. A. Paesler et al.).35,36To simplify Figure1, the optical near field is schematically obtained by a totalinternal reflection. For our samples, the near field is generatedby an oblique far field illumination and collected by the tip.This mode, rarely used in the literature, will be justified by ourexperimental results.
As for other experiments in optical near field, the fiberopticprobe can be used in three different ways to record a near fieldRaman spectrum:
(i) as a nanolight source,(ii) as a detector that frustrates the evanescent waves in total
internal reflection experiments or that is polarized by an opticalnear-field, or
(iii) as both nanolight source and detector; in this configu-ration, the tip produces the evanescent waves that are collectedby the same aperture for reflection experiments, a method thatshould give the best spatial resolution.37
In NFRS, one of the most important problems is the strongsilica Raman spectrum of the fiberoptic or glass probe whenused as both emitter and collector. This spectrum covers allother Raman signals in a range of 0-1300 cm-1. The onlysolution consists of using the probe only to excite (i) or to collect(ii) the Raman spectrum. Jahncke et al. have reported the firstnear field Raman images, using the probe as a nanolightsource.8,9 But today, the small Raman signal levels and the longintegration times, often several hours for one image, limit theimaging possibilities of the method. Most of the time, a single
Figure 1. Schematic of the experimental configuration. The evanescentwaves generated by an internal reflection of the exciting laser arefrustrated by the probe, which is kept close to the surface by a feedbackloop that measures the damping of the lateral vibration amplitude ofthe tip. A small laser beam is focused before the fiber tip, and themodulation of its shadow is detected on the bicell photodiode. Thissignal, which is strongly damped near the surface, gives a measure forthe tip-sample interaction and is used as a reference for the feedbackloop that controls the vertical position of the sample via the piezoelectricceramic scanner (Z). The signals collected by the tip are driven to abeam splitter, which transmits about 25% of the whole intensity on aphotomultiplier and reflects 75% on the entrance slit of the spectrometerT64000. Thus, by collecting theZ values vs position (x, y), atopographic image is constituted, and by collecting the intensity of thePM, an optical image is obtained.
Raman and Transverse Dynamic Force Microscopy J. Phys. Chem. B, Vol. 108, No. 40, 200415715
dimensional transverse measurement is possible.5,7,17 Fortu-nately, besides the imaging of interfaces, the NFRS or the nearfield fluorescence spectroscopy with high spectral resolution isable to reach the detection and the study of single molecules.A classical SNOM experience gives the topography of thesample and locates an optical or topographical heterogeneity.Once localized, the near field Raman spectrum of a nanodomaincan be obtained with minimal perturbations, without averagingtheir physical properties in the space and without masking themby a statistical distribution, which is the case in usual propagatedfar field experiments.
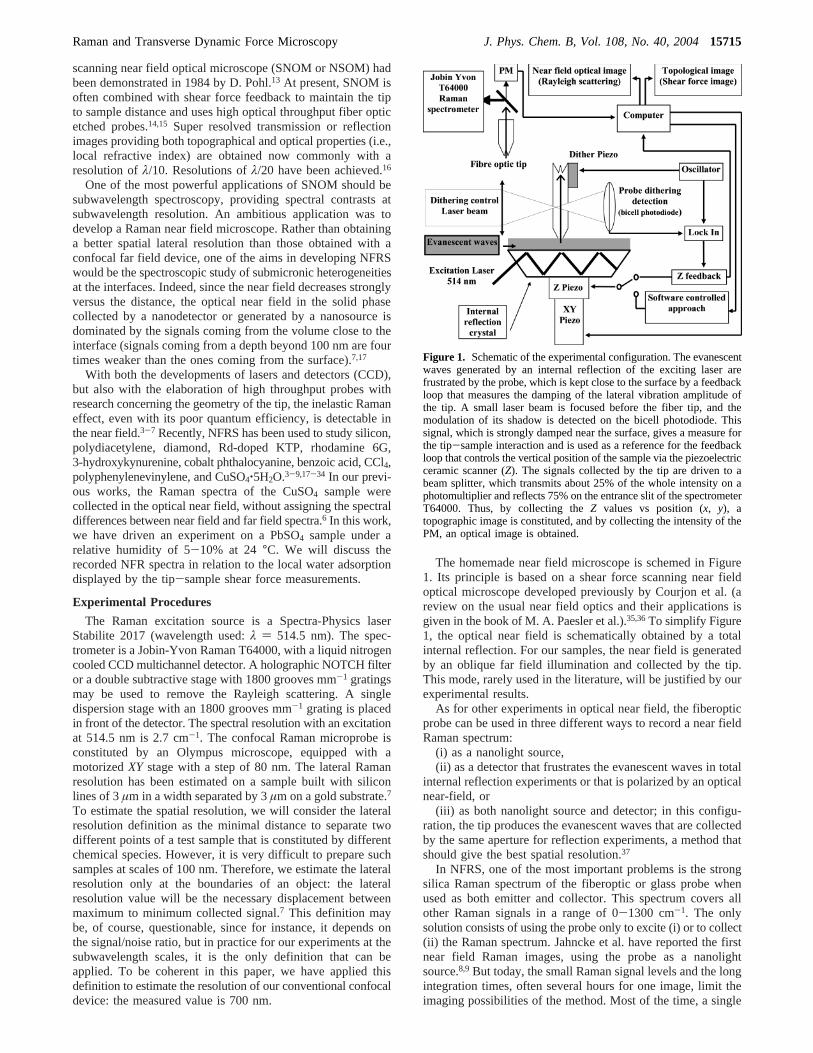
Figure 2 illustrates the device used here to collect simulta-neously both far and near inelastic fields of one spatial range.A far field optical device allows us to focus a laser beam on anarea of about 100µm2 around the tip. This device is based ona Cassegrainobjective (Tri-star, Jobin-Yvon) working abovethe near field probe (Figure 2). The lateral resolution of the farfield optical device equipped with thisCassegrainobjective isabout 10µm, while the axial resolution increases to 20µm.The distance feedback loop in our scanning near field opticalmicroscopy device is based on the measurement of the forcesperpendicular to the tip-sample axis. Thus, our device gives atransverse dynamic force image (TDFM).38 We prefer this lastdefinition rather than the usual shear force expression used inthe literature in the past few years. Indeed, the term shear forceis often not appropriate because the interactions between surfacesare not in all cases shear. The near field probe and thepiezoelectric transducer exciting the transverse-force vibrationare positioned in the cone of shadow of the far field objective.This far field objective allows us to collect also the backscatteredfar fields.
The near field probe is either a Topometrix metallic singlemode fiber optic, developed for the SNOM Aurora of Topo-metrix, with an aperture between 50 and 100 nm in diameter,or a homemade taper obtained by the commonly used heatingand pulling technique. This later probe is built with a commercialinstrument used for micropipet manufacture. An optical fiberis placed under tensile stress and locally heated with a CO2
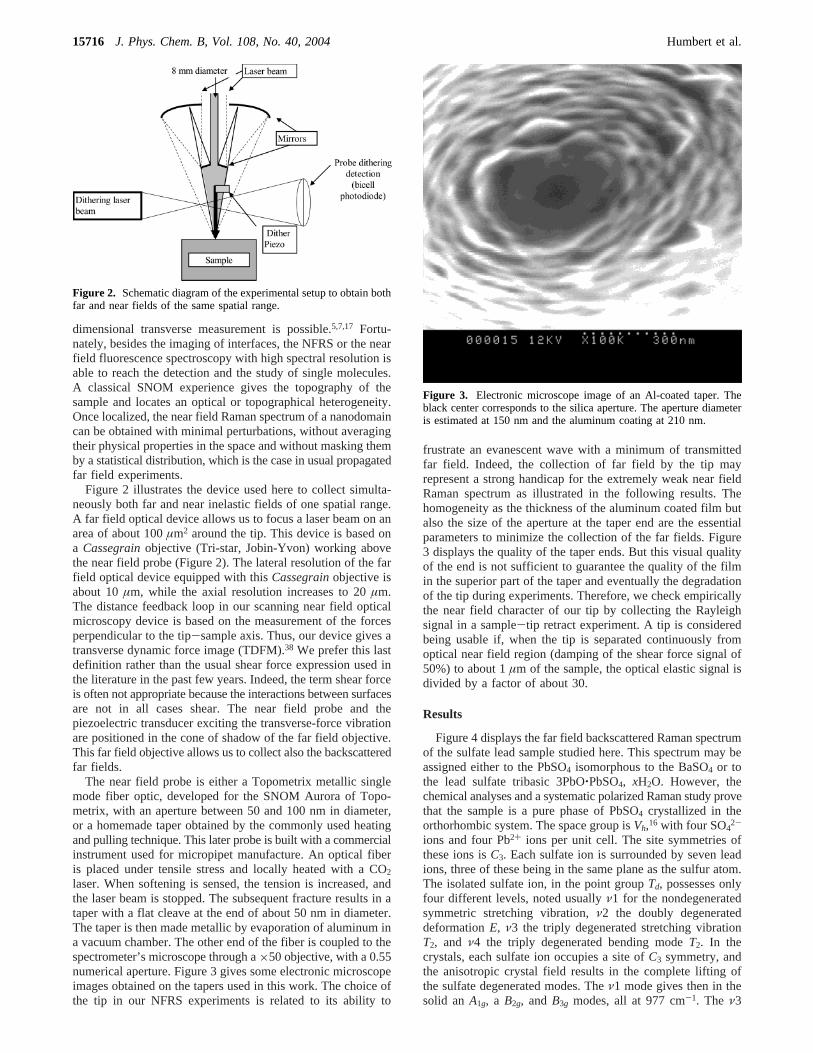
laser. When softening is sensed, the tension is increased, andthe laser beam is stopped. The subsequent fracture results in ataper with a flat cleave at the end of about 50 nm in diameter.The taper is then made metallic by evaporation of aluminum ina vacuum chamber. The other end of the fiber is coupled to thespectrometer’s microscope through a×50 objective, with a 0.55numerical aperture. Figure 3 gives some electronic microscopeimages obtained on the tapers used in this work. The choice ofthe tip in our NFRS experiments is related to its ability to
frustrate an evanescent wave with a minimum of transmittedfar field. Indeed, the collection of far field by the tip mayrepresent a strong handicap for the extremely weak near fieldRaman spectrum as illustrated in the following results. Thehomogeneity as the thickness of the aluminum coated film butalso the size of the aperture at the taper end are the essentialparameters to minimize the collection of the far fields. Figure3 displays the quality of the taper ends. But this visual qualityof the end is not sufficient to guarantee the quality of the filmin the superior part of the taper and eventually the degradationof the tip during experiments. Therefore, we check empiricallythe near field character of our tip by collecting the Rayleighsignal in a sample-tip retract experiment. A tip is consideredbeing usable if, when the tip is separated continuously fromoptical near field region (damping of the shear force signal of50%) to about 1µm of the sample, the optical elastic signal isdivided by a factor of about 30.
Results
Figure 4 displays the far field backscattered Raman spectrumof the sulfate lead sample studied here. This spectrum may beassigned either to the PbSO4 isomorphous to the BaSO4 or tothe lead sulfate tribasic 3PbO‚PbSO4, xH2O. However, thechemical analyses and a systematic polarized Raman study provethat the sample is a pure phase of PbSO4 crystallized in theorthorhombic system. The space group isVh,16 with four SO4
2-
ions and four Pb2+ ions per unit cell. The site symmetries ofthese ions isC3. Each sulfate ion is surrounded by seven leadions, three of these being in the same plane as the sulfur atom.The isolated sulfate ion, in the point groupTd, possesses onlyfour different levels, noted usuallyν1 for the nondegeneratedsymmetric stretching vibration,ν2 the doubly degenerateddeformationE, ν3 the triply degenerated stretching vibrationT2, and ν4 the triply degenerated bending modeT2. In thecrystals, each sulfate ion occupies a site ofC3 symmetry, andthe anisotropic crystal field results in the complete lifting ofthe sulfate degenerated modes. Theν1 mode gives then in thesolid anA1g, a B2g, and B3g modes, all at 977 cm-1. The ν3
Figure 2. Schematic diagram of the experimental setup to obtain bothfar and near fields of the same spatial range.
Figure 3. Electronic microscope image of an Al-coated taper. Theblack center corresponds to the silica aperture. The aperture diameteris estimated at 150 nm and the aluminum coating at 210 nm.
15716 J. Phys. Chem. B, Vol. 108, No. 40, 2004 Humbert et al.
mode gives twoA1g modes, twoB2g modes, and oneB3g mode,respectively, at 1060, 115, 1054, 1157, and 1152 cm-1. Theν4gives two A1g modes, twoB2g modes, and oneB3g modes,respectively, at 605, 618, 610, 641, and 609 cm-1. At last, theν2 gives oneA1g mode, oneB1g mode, oneB2g mode, and oneB3g mode at 438, 449, 438, and 449 cm-1.
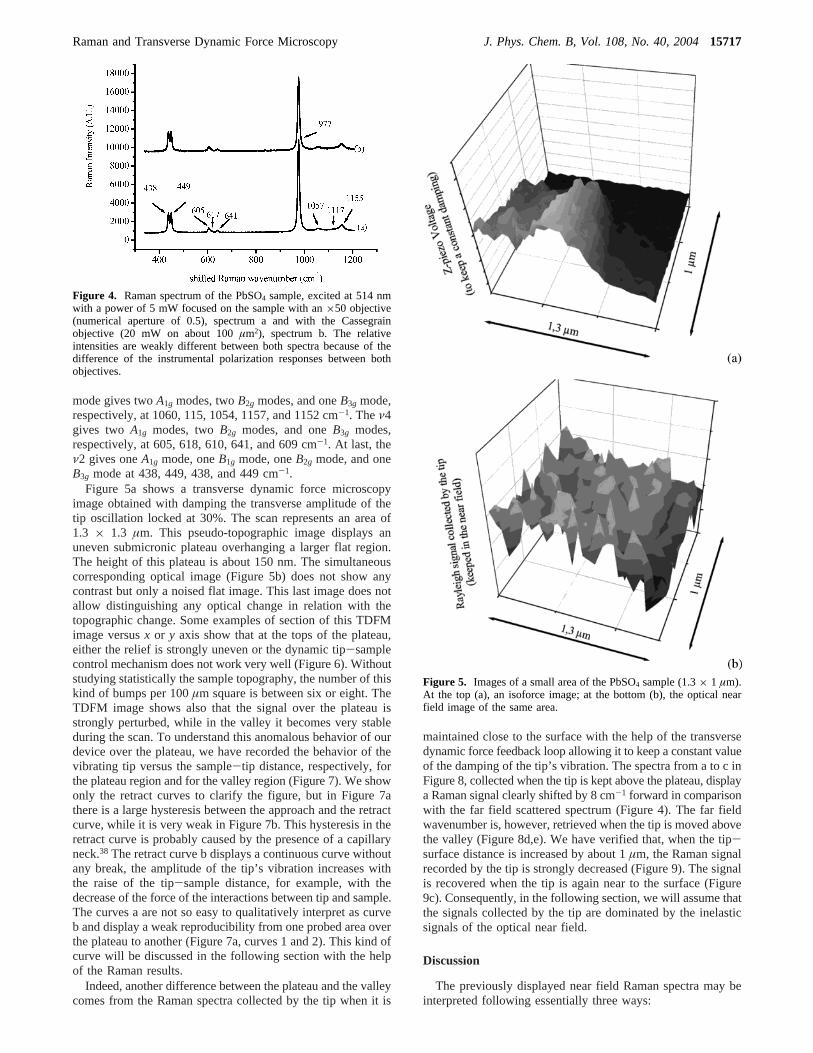
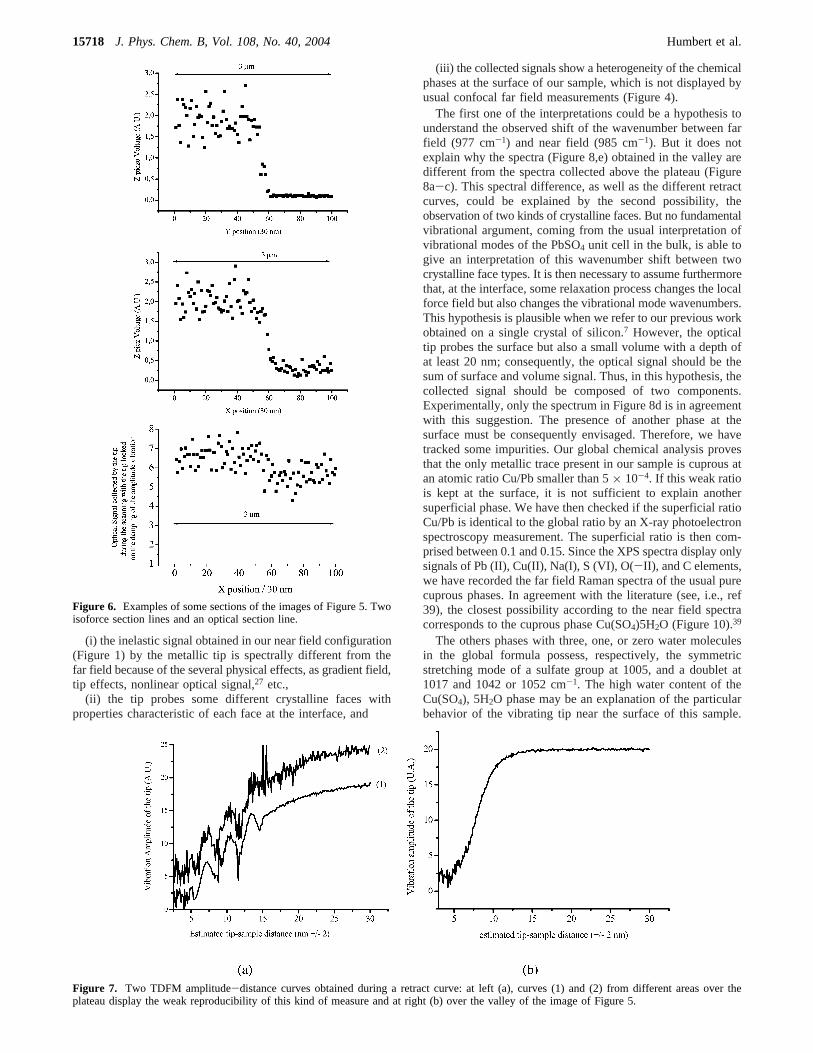
Figure 5a shows a transverse dynamic force microscopyimage obtained with damping the transverse amplitude of thetip oscillation locked at 30%. The scan represents an area of1.3 × 1.3 µm. This pseudo-topographic image displays anuneven submicronic plateau overhanging a larger flat region.The height of this plateau is about 150 nm. The simultaneouscorresponding optical image (Figure 5b) does not show anycontrast but only a noised flat image. This last image does notallow distinguishing any optical change in relation with thetopographic change. Some examples of section of this TDFMimage versusx or y axis show that at the tops of the plateau,either the relief is strongly uneven or the dynamic tip-samplecontrol mechanism does not work very well (Figure 6). Withoutstudying statistically the sample topography, the number of thiskind of bumps per 100µm square is between six or eight. TheTDFM image shows also that the signal over the plateau isstrongly perturbed, while in the valley it becomes very stableduring the scan. To understand this anomalous behavior of ourdevice over the plateau, we have recorded the behavior of thevibrating tip versus the sample-tip distance, respectively, forthe plateau region and for the valley region (Figure 7). We showonly the retract curves to clarify the figure, but in Figure 7athere is a large hysteresis between the approach and the retractcurve, while it is very weak in Figure 7b. This hysteresis in theretract curve is probably caused by the presence of a capillaryneck.38 The retract curve b displays a continuous curve withoutany break, the amplitude of the tip’s vibration increases withthe raise of the tip-sample distance, for example, with thedecrease of the force of the interactions between tip and sample.The curves a are not so easy to qualitatively interpret as curveb and display a weak reproducibility from one probed area overthe plateau to another (Figure 7a, curves 1 and 2). This kind ofcurve will be discussed in the following section with the helpof the Raman results.
Indeed, another difference between the plateau and the valleycomes from the Raman spectra collected by the tip when it is
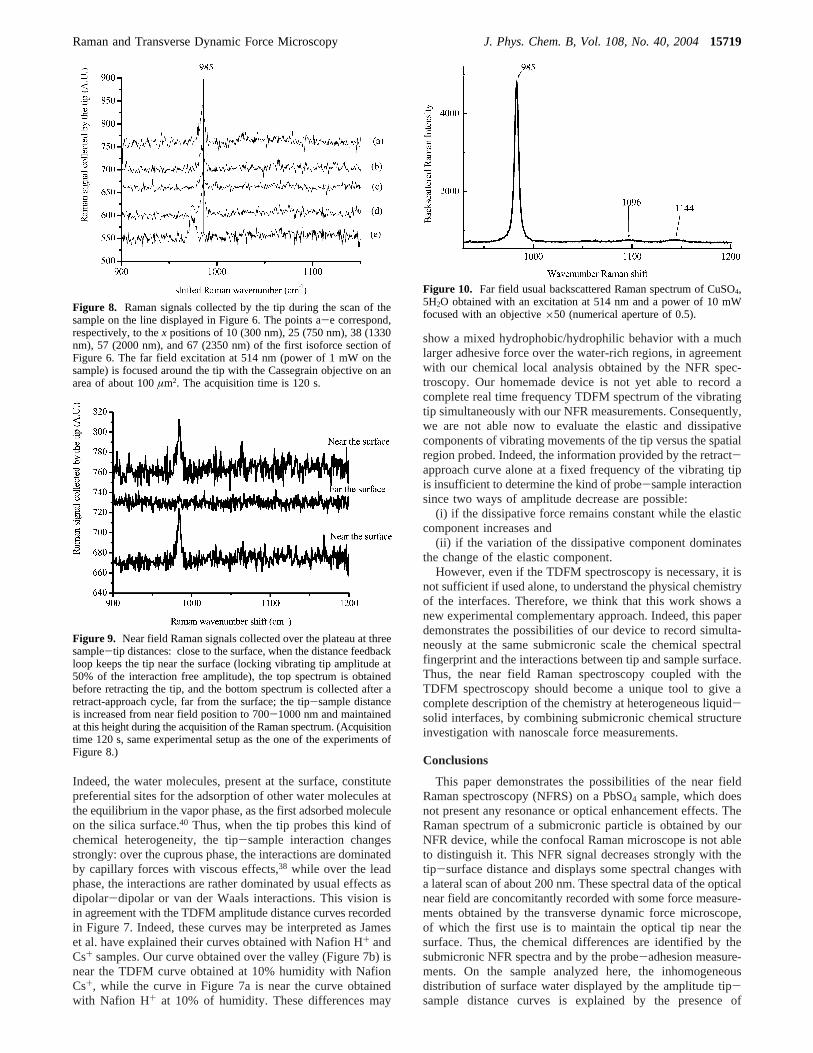
maintained close to the surface with the help of the transversedynamic force feedback loop allowing it to keep a constant valueof the damping of the tip’s vibration. The spectra from a to c inFigure 8, collected when the tip is kept above the plateau, displaya Raman signal clearly shifted by 8 cm-1 forward in comparisonwith the far field scattered spectrum (Figure 4). The far fieldwavenumber is, however, retrieved when the tip is moved abovethe valley (Figure 8d,e). We have verified that, when the tip-surface distance is increased by about 1µm, the Raman signalrecorded by the tip is strongly decreased (Figure 9). The signalis recovered when the tip is again near to the surface (Figure9c). Consequently, in the following section, we will assume thatthe signals collected by the tip are dominated by the inelasticsignals of the optical near field.
Discussion
The previously displayed near field Raman spectra may beinterpreted following essentially three ways:
Figure 4. Raman spectrum of the PbSO4 sample, excited at 514 nmwith a power of 5 mW focused on the sample with an×50 objective(numerical aperture of 0.5), spectrum a and with the Cassegrainobjective (20 mW on about 100µm2), spectrum b. The relativeintensities are weakly different between both spectra because of thedifference of the instrumental polarization responses between bothobjectives.
Figure 5. Images of a small area of the PbSO4 sample (1.3× 1 µm).At the top (a), an isoforce image; at the bottom (b), the optical nearfield image of the same area.
Raman and Transverse Dynamic Force Microscopy J. Phys. Chem. B, Vol. 108, No. 40, 200415717
(i) the inelastic signal obtained in our near field configuration(Figure 1) by the metallic tip is spectrally different from thefar field because of the several physical effects, as gradient field,tip effects, nonlinear optical signal,27 etc.,
(ii) the tip probes some different crystalline faces withproperties characteristic of each face at the interface, and
(iii) the collected signals show a heterogeneity of the chemicalphases at the surface of our sample, which is not displayed byusual confocal far field measurements (Figure 4).
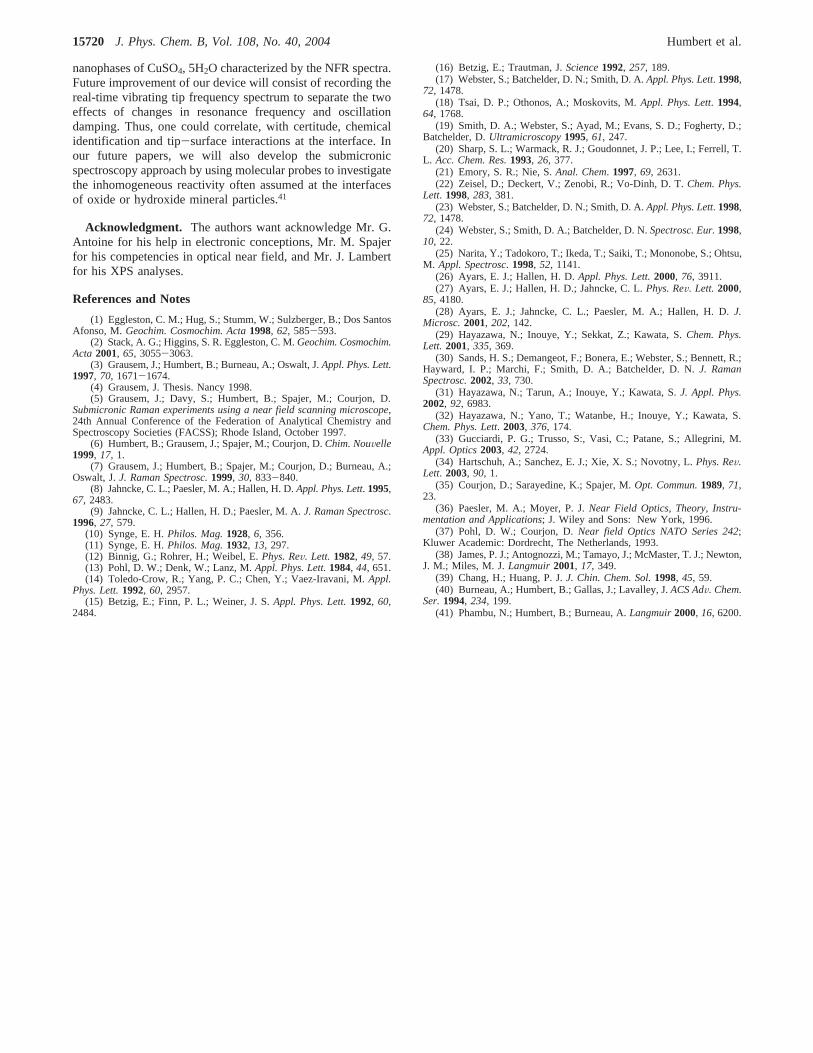
The first one of the interpretations could be a hypothesis tounderstand the observed shift of the wavenumber between farfield (977 cm-1) and near field (985 cm-1). But it does notexplain why the spectra (Figure 8,e) obtained in the valley aredifferent from the spectra collected above the plateau (Figure8a-c). This spectral difference, as well as the different retractcurves, could be explained by the second possibility, theobservation of two kinds of crystalline faces. But no fundamentalvibrational argument, coming from the usual interpretation ofvibrational modes of the PbSO4 unit cell in the bulk, is able togive an interpretation of this wavenumber shift between twocrystalline face types. It is then necessary to assume furthermorethat, at the interface, some relaxation process changes the localforce field but also changes the vibrational mode wavenumbers.This hypothesis is plausible when we refer to our previous workobtained on a single crystal of silicon.7 However, the opticaltip probes the surface but also a small volume with a depth ofat least 20 nm; consequently, the optical signal should be thesum of surface and volume signal. Thus, in this hypothesis, thecollected signal should be composed of two components.Experimentally, only the spectrum in Figure 8d is in agreementwith this suggestion. The presence of another phase at thesurface must be consequently envisaged. Therefore, we havetracked some impurities. Our global chemical analysis provesthat the only metallic trace present in our sample is cuprous atan atomic ratio Cu/Pb smaller than 5× 10⁻⁴. If this weak ratiois kept at the surface, it is not sufficient to explain anothersuperficial phase. We have then checked if the superficial ratioCu/Pb is identical to the global ratio by an X-ray photoelectronspectroscopy measurement. The superficial ratio is then com-prised between 0.1 and 0.15. Since the XPS spectra display onlysignals of Pb (II), Cu(II), Na(I), S (VI), O(-II), and C elements,we have recorded the far field Raman spectra of the usual purecuprous phases. In agreement with the literature (see, i.e., ref39), the closest possibility according to the near field spectracorresponds to the cuprous phase Cu(SO4)5H2O (Figure 10).39
The others phases with three, one, or zero water moleculesin the global formula possess, respectively, the symmetricstretching mode of a sulfate group at 1005, and a doublet at1017 and 1042 or 1052 cm-1. The high water content of theCu(SO4), 5H2O phase may be an explanation of the particularbehavior of the vibrating tip near the surface of this sample.
Figure 6. Examples of some sections of the images of Figure 5. Twoisoforce section lines and an optical section line.
Figure 7. Two TDFM amplitude-distance curves obtained during a retract curve: at left (a), curves (1) and (2) from different areas over theplateau display the weak reproducibility of this kind of measure and at right (b) over the valley of the image of Figure 5.
15718 J. Phys. Chem. B, Vol. 108, No. 40, 2004 Humbert et al.
Indeed, the water molecules, present at the surface, constitutepreferential sites for the adsorption of other water molecules atthe equilibrium in the vapor phase, as the first adsorbed moleculeon the silica surface.40 Thus, when the tip probes this kind ofchemical heterogeneity, the tip-sample interaction changesstrongly: over the cuprous phase, the interactions are dominatedby capillary forces with viscous effects,38 while over the leadphase, the interactions are rather dominated by usual effects asdipolar-dipolar or van der Waals interactions. This vision isin agreement with the TDFM amplitude distance curves recordedin Figure 7. Indeed, these curves may be interpreted as Jameset al. have explained their curves obtained with Nafion H+ andCs+ samples. Our curve obtained over the valley (Figure 7b) isnear the TDFM curve obtained at 10% humidity with NafionCs+, while the curve in Figure 7a is near the curve obtainedwith Nafion H+ at 10% of humidity. These differences may
show a mixed hydrophobic/hydrophilic behavior with a muchlarger adhesive force over the water-rich regions, in agreementwith our chemical local analysis obtained by the NFR spec-troscopy. Our homemade device is not yet able to record acomplete real time frequency TDFM spectrum of the vibratingtip simultaneously with our NFR measurements. Consequently,we are not able now to evaluate the elastic and dissipativecomponents of vibrating movements of the tip versus the spatialregion probed. Indeed, the information provided by the retract-approach curve alone at a fixed frequency of the vibrating tipis insufficient to determine the kind of probe-sample interactionsince two ways of amplitude decrease are possible:
(i) if the dissipative force remains constant while the elasticcomponent increases and
(ii) if the variation of the dissipative component dominatesthe change of the elastic component.
However, even if the TDFM spectroscopy is necessary, it isnot sufficient if used alone, to understand the physical chemistryof the interfaces. Therefore, we think that this work shows anew experimental complementary approach. Indeed, this paperdemonstrates the possibilities of our device to record simulta-neously at the same submicronic scale the chemical spectralfingerprint and the interactions between tip and sample surface.Thus, the near field Raman spectroscopy coupled with theTDFM spectroscopy should become a unique tool to give acomplete description of the chemistry at heterogeneous liquid-solid interfaces, by combining submicronic chemical structureinvestigation with nanoscale force measurements.
Conclusions
This paper demonstrates the possibilities of the near fieldRaman spectroscopy (NFRS) on a PbSO4 sample, which doesnot present any resonance or optical enhancement effects. TheRaman spectrum of a submicronic particle is obtained by ourNFR device, while the confocal Raman microscope is not ableto distinguish it. This NFR signal decreases strongly with thetip-surface distance and displays some spectral changes witha lateral scan of about 200 nm. These spectral data of the opticalnear field are concomitantly recorded with some force measure-ments obtained by the transverse dynamic force microscope,of which the first use is to maintain the optical tip near thesurface. Thus, the chemical differences are identified by thesubmicronic NFR spectra and by the probe-adhesion measure-ments. On the sample analyzed here, the inhomogeneousdistribution of surface water displayed by the amplitude tip-sample distance curves is explained by the presence of
Figure 8. Raman signals collected by the tip during the scan of thesample on the line displayed in Figure 6. The points a-e correspond,respectively, to thex positions of 10 (300 nm), 25 (750 nm), 38 (1330nm), 57 (2000 nm), and 67 (2350 nm) of the first isoforce section ofFigure 6. The far field excitation at 514 nm (power of 1 mW on thesample) is focused around the tip with the Cassegrain objective on anarea of about 100µm2. The acquisition time is 120 s.
Figure 9. Near field Raman signals collected over the plateau at threesample-tip distances: close to the surface, when the distance feedbackloop keeps the tip near the surface (locking vibrating tip amplitude at50% of the interaction free amplitude), the top spectrum is obtainedbefore retracting the tip, and the bottom spectrum is collected after aretract-approach cycle, far from the surface; the tip-sample distanceis increased from near field position to 700-1000 nm and maintainedat this height during the acquisition of the Raman spectrum. (Acquisitiontime 120 s, same experimental setup as the one of the experiments ofFigure 8.)
Figure 10. Far field usual backscattered Raman spectrum of CuSO4,5H2O obtained with an excitation at 514 nm and a power of 10 mWfocused with an objective×50 (numerical aperture of 0.5).
Raman and Transverse Dynamic Force Microscopy J. Phys. Chem. B, Vol. 108, No. 40, 200415719
nanophases of CuSO4, 5H2O characterized by the NFR spectra.Future improvement of our device will consist of recording thereal-time vibrating tip frequency spectrum to separate the twoeffects of changes in resonance frequency and oscillationdamping. Thus, one could correlate, with certitude, chemicalidentification and tip-surface interactions at the interface. Inour future papers, we will also develop the submicronicspectroscopy approach by using molecular probes to investigatethe inhomogeneous reactivity often assumed at the interfacesof oxide or hydroxide mineral particles.41
Acknowledgment. The authors want acknowledge Mr. G.Antoine for his help in electronic conceptions, Mr. M. Spajerfor his competencies in optical near field, and Mr. J. Lambertfor his XPS analyses.
References and Notes
(1) Eggleston, C. M.; Hug, S.; Stumm, W.; Sulzberger, B.; Dos SantosAfonso, M. Geochim. Cosmochim. Acta1998, 62, 585-593.
(2) Stack, A. G.; Higgins, S. R. Eggleston, C. M.Geochim. Cosmochim.Acta 2001, 65, 3055-3063.
(3) Grausem, J.; Humbert, B.; Burneau, A.; Oswalt, J.Appl. Phys. Lett.1997, 70, 1671-1674.
(4) Grausem, J. Thesis. Nancy 1998.(5) Grausem, J.; Davy, S.; Humbert, B.; Spajer, M.; Courjon, D.
Submicronic Raman experiments using a near field scanning microscope,24th Annual Conference of the Federation of Analytical Chemistry andSpectroscopy Societies (FACSS); Rhode Island, October 1997.
(6) Humbert, B.; Grausem, J.; Spajer, M.; Courjon, D.Chim. NouVelle1999, 17, 1.
(7) Grausem, J.; Humbert, B.; Spajer, M.; Courjon, D.; Burneau, A.;Oswalt, J.J. Raman Spectrosc.1999, 30, 833-840.
(8) Jahncke, C. L.; Paesler, M. A.; Hallen, H. D.Appl. Phys. Lett. 1995,67, 2483.
(9) Jahncke, C. L.; Hallen, H. D.; Paesler, M. A.J. Raman Spectrosc.1996, 27, 579.
(10) Synge, E. H.Philos. Mag.1928, 6, 356.(11) Synge, E. H.Philos. Mag.1932, 13, 297.(12) Binnig, G.; Rohrer, H.; Weibel, E.Phys. ReV. Lett. 1982, 49, 57.(13) Pohl, D. W.; Denk, W.; Lanz, M.Appl. Phys. Lett.1984, 44, 651.(14) Toledo-Crow, R.; Yang, P. C.; Chen, Y.; Vaez-Iravani, M.Appl.
Phys. Lett.1992, 60, 2957.(15) Betzig, E.; Finn, P. L.; Weiner, J. S.Appl. Phys. Lett.1992, 60,
2484.
(16) Betzig, E.; Trautman, J.Science1992, 257, 189.(17) Webster, S.; Batchelder, D. N.; Smith, D. A.Appl. Phys. Lett. 1998,
72, 1478.(18) Tsai, D. P.; Othonos, A.; Moskovits, M.Appl. Phys. Lett. 1994,
64, 1768.(19) Smith, D. A.; Webster, S.; Ayad, M.; Evans, S. D.; Fogherty, D.;
Batchelder, D.Ultramicroscopy1995, 61, 247.(20) Sharp, S. L.; Warmack, R. J.; Goudonnet, J. P.; Lee, I.; Ferrell, T.
L. Acc. Chem. Res.1993, 26, 377.(21) Emory, S. R.; Nie, S.Anal. Chem. 1997, 69, 2631.(22) Zeisel, D.; Deckert, V.; Zenobi, R.; Vo-Dinh, D. T.Chem. Phys.
Lett. 1998, 283, 381.(23) Webster, S.; Batchelder, D. N.; Smith, D. A.Appl. Phys. Lett. 1998,
72, 1478.(24) Webster, S.; Smith, D. A.; Batchelder, D. N.Spectrosc. Eur.1998,
10, 22.(25) Narita, Y.; Tadokoro, T.; Ikeda, T.; Saiki, T.; Mononobe, S.; Ohtsu,
M. Appl. Spectrosc. 1998, 52, 1141.(26) Ayars, E. J.; Hallen, H. D.Appl. Phys. Lett.2000, 76, 3911.(27) Ayars, E. J.; Hallen, H. D.; Jahncke, C. L.Phys. ReV. Lett. 2000,
85, 4180.(28) Ayars, E. J.; Jahncke, C. L.; Paesler, M. A.; Hallen, H. D.J.
Microsc.2001, 202, 142.(29) Hayazawa, N.; Inouye, Y.; Sekkat, Z.; Kawata, S.Chem. Phys.
Lett. 2001, 335, 369.(30) Sands, H. S.; Demangeot, F.; Bonera, E.; Webster, S.; Bennett, R.;
Hayward, I. P.; Marchi, F.; Smith, D. A.; Batchelder, D. N.J. RamanSpectrosc.2002, 33, 730.
(31) Hayazawa, N.; Tarun, A.; Inouye, Y.; Kawata, S.J. Appl. Phys.2002, 92, 6983.
(32) Hayazawa, N.; Yano, T.; Watanbe, H.; Inouye, Y.; Kawata, S.Chem. Phys. Lett. 2003, 376, 174.
(33) Gucciardi, P. G.; Trusso, S:, Vasi, C.; Patane, S.; Allegrini, M.Appl. Optics2003, 42, 2724.
(34) Hartschuh, A.; Sanchez, E. J.; Xie, X. S.; Novotny, L.Phys. ReV.Lett. 2003, 90, 1.
(35) Courjon, D.; Sarayedine, K.; Spajer, M.Opt. Commun.1989, 71,23.
(36) Paesler, M. A.; Moyer, P. J.Near Field Optics, Theory, Instru-mentation and Applications; J. Wiley and Sons: New York, 1996.
(37) Pohl, D. W.; Courjon, D.Near field Optics NATO Series 242;Kluwer Academic: Dordrecht, The Netherlands, 1993.
(38) James, P. J.; Antognozzi, M.; Tamayo, J.; McMaster, T. J.; Newton,J. M.; Miles, M. J.Langmuir2001, 17, 349.
(39) Chang, H.; Huang, P. J.J. Chin. Chem. Sol.1998, 45, 59.(40) Burneau, A.; Humbert, B.; Gallas, J.; Lavalley, J.ACS AdV. Chem.
Ser.1994, 234, 199.(41) Phambu, N.; Humbert, B.; Burneau, A.Langmuir2000, 16, 6200.
15720 J. Phys. Chem. B, Vol. 108, No. 40, 2004 Humbert et al.