Embed Size (px)
Citation preview
1
PROJET TANARIS
Rapport Final
1er mars 2016
T. Voituriez, E. Gaarder, Wang Xin, O. Sartor, Th. Spencer, H. Waisman
IDDRI
Projet financé par le
2
Résumé
Nous rendons compte dans ce rapport des résultats de nos recherches sur la course aux technologies
vertes ou green race entre l’Europe et la Chine dans trois secteurs ou « filières » d’énergie
renouvelable que sont l’énergie photovoltaïque, éolienne (terrestre et offshore), et les biocarburants
pour le secteur aéronautique ou jet fuels. A elles trois, ces filières couvrent des champs
technologique de maturité très différente. Les panneaux solaires échangés dans le monde sont
produits pour la plupart grâce à des technologies vieilles de 20 ou 30 ans, celles des éoliennes
terrestres et plus encore offshore sont en pleine mutation tandis que l’utilisation de biocarburants
pour l’aviation relèvent encore du pari technologique et commercial. Les biocarburants pour
l’aviation sont pour cette raison, en plus du fait qu’ils ne provoquent pas à ce jour de course entre
l’Europe et la Chine, traités de manière autonome dans le dernier chapitre de ce rapport.
Les questions que nous avons examinées sont simples. Nous nous sommes demandés si la stratégie
d’innovation et de leadership par l’exemple poursuivie par l’Union Européenne et ses Etats membres
apportait les résultats escomptés face à la concurrence des économies émergentes, et
singulièrement chinoise, en matière économique (valeur ajoutée et emploi), environnementale
(atténuation climatique) mais aussi politique (influence internationale). Notre intuition résidait dans
le fait que les technologies bas carbone, promues à un large déploiement si l’on en croit les
contributions des pays membres de la CNUCCC à la COP21, sont des nouveaux instruments de la
puissance par leurs possibles implications sur les modèles de croissance, la sécurité énergétique, et la
réduction ou l’aggravation des maux publics globaux.
Deux récits sont en concurrence pour expliquer et dessiner la hiérarchie de la puissance entre
nations, que la généralisation progressive des technologies bas-carbone dans nos systèmes de
production est susceptible de provoquer renforcer ou au contraire de bouleverser à l’horizon de 15
ou 20 ans.
Le premier récit est conservateur en ce sens qu’il n’annonce pas de bouleversement dans l’ordre des
puissances, au premier motif que ces technologies sont aujourd’hui uniformément réparties entre
pays riches et pays en développement et ne confèrent pas un avantage particulier aux uns ou aux
autres. Selon ce récit, de surcroît, puissance réside dans la capacité d’investir, d’innover, de contrôler
les chaînes de valeur et d’en capter la part la plus élevée. Cela est vrai des trains à grande vitesse, des
automobiles, des téléphones portables, des écrans plats ou de n’importe quel équipement à fort
contenu technologique. Celui qui investit, qu’il s’agisse d’une firme ou d’une nation, celui qui innove,
contrôle la chaîne de valeur, capture la valeur ajoutée, s’approprie la puissance. Les technologies
bas-carbone ne font pas exception. Le commerce désentravé, la protection de la propriété
intellectuelle, la libre concurrence, en somme, le jeu du marché alloue valeurs et profits au regard
3
des risques pris, des investissements consentis. Rien de nouveau depuis R icardo et son traité
d’économie politique en 1817. La mondialisation ne rétribue pas davantage le leader ou le suiveur
technologique : elle accroît et répartit les gains sur la base des avantages comparatifs. Celui -ci peut
résider, en Chine, dans l’assemblage à partir de chaînes de montage clef en main ; et il peut résider
en Europe dans l’exportation de ces dernières, plus intensives en main d’œuvre hautement qualifiée,
pour un gain mutuel positif et un gain relatif favorable à « l’innovant ».
Un autre récit met en avant les risques, pour « l’innovant », liés au rattrapage entre nations par le
truchement de l’échange international. Contre les enseignements de l’économie, les nations seraient
dans ce second récit en concurrence entre elles – pour jouir des attributs de la puissance,
précisément, qui ne se partagent pas. Cette entaille dans le marbre de la concurrence sur lequel
repose l’architecture du commerce international depuis la création du GATT en 1947, est motivée
par plusieurs observations ou énoncés. Le premier est qu’il est théoriquement possible qu’en raison
d’imitations peu scrupuleuses et de rattrapage technologique, survenant pour un quelconque autre
motif, une nation voit sa richesse – et donc sa puissance – s’accroître alors que celle de son pays
partenaire commercial, leader technologique, elle, se réduit. Autrement dit, lorsque les avantages
comparatifs changent dans un pays – sans changer dans les autres – la course en tête peut s’avérer
une stratégie perdante, sauf à encadrer plus strictement le jeu de la concurrence et prévenir
rigoureusement tout rattrapage technologique « injuste » ou « indu » chez le pays poursuivant
(encadré 1). C’est le sens des mesures anti-dumping mises en place par l’Union Européenne contre
les importations de panneaux solaires chinois au premier semestre 2013.
Encadré 1 : Une mondialisation gagnant-perdant en raison du rattrapage technologique chinois ?
Dans un article paru en 2004 et qui allait faire grand bruit, le prix Nobel Paul Samuelson évoque à
grands traits les conséquences possibles du rattrapage des États-Unis par la Chine dans les secteurs
où les Etats-Unis bénéficient d’un avantage comparatif – autrement dit, dans un secteur où les Etats-
Unis font la course en tête de la green race. Samuelson (2004) pose comme hypothèse que ce
rattrapage est le résultat de l’innovation technique (« par imitation ou du fait de son génie propre »)
et de la sous-traitance. Ses conclusions contredisent la version souriante de la mondialisation. « Que
nous disent [les] chiffres sur les effets réalistes à long terme pour les États-Unis de cette sous-
traitance ? Les nouveaux […] niveaux de productivité impliquent que cette invention étrangère qui
octroie à la Chine une partie de l’avantage comparatif auparavant détenu par les États-Unis peut
induire pour ces derniers une baisse inéluctable du revenu réel par habitant ».
Les prévisions sur les futurs investissements dans les technologies énergétiques propres et les
anticipations tendancielles des capacités installées d’énergies renouvelables entre l’UE, la Chine et
les États-Unis pourraient apporter une nouvelle illustration de ce syndrome : si la Chine devait
poursuivre son rattrapage sur le front des technologies vertes et s’octroyer une part encore plus
grande de la valeur ajoutée le long de la chaîne logistique, cela aurait un impact sur les revenus réels
Européens.
Le problème réside pour résumé dans le fait que la Chine et l’Inde tendent à se spécialiser dans les
secteurs et les tâches où, historiquement, les pays de la Quadrilatérale (Canada, UE, Japon et États-
Unis) bénéficiaient d’avantages comparatifs indiscutables dans leurs relations commerciales
réciproques.
4
Ce second récit met également en avant la nature particulière des biens considérés. Ceux -ci sont
singuliers sous plusieurs aspects. La production des technologies « vertes » reste très intensive en
politique publique – leur viabilité commerciale étant très largement conditionnée par celles-ci. Les
règles de la concurrence ne garantissant plus le gain mutuel entre nations, s’y soustraire ou y déroger
peut être justifié. En second lieu, et en lien avec le point précédent, les technologies vertes ont
l’autre particularité de servir plusieurs finalités. Leur utilité sociale réside dans la contribution
qu’elles apportent à la lutte contre le réchauffement climatique. Mais au-delà, par la transformation
radicale des économies qu’elles sont censées accompagner sinon provoquer, elles acquièrent dans le
discours politique une portée révolutionnaire : la nouvelle révolution industrielle les réclame, et
justifie l’annonce de nouvelles richesse et de gisements d’emploi. Ces biens ne sont pas comme les
autres et doivent rester à portée de main des gouvernements et non remis à celle invisible du
marché.
Ces deux histoires dessinent des perspectives différentes pour la France et l’Europe dans leurs
relations avec la Chine. La première met en avant les gains de l’échange et le nécessaire
approfondissement de la libéralisation commerciale, dans la perspective d’une conquête réciproque
des marchés sur des segments spécifiques des filières – la Chine dans les activités d’assemblage et de
production à grande échelle et faible marge, l’Europe dans les parties amont et aval (conceptions et
marketing) et les activités d’assemblage et de production à haute valeur ajoutée. La seconde est plus
sélective dans l’ouverture à la concurrence et conditionne celle -ci à l’accroissement de la valeur
ajoutée et de l’emploi industriels sur le territoire européen.
Questions
A l’aune des trois objectifs politiques que sont l’atténuation des émissions de gaz à effet de serre, la
contribution à la richesse nationale et l’emploi industriel, que valent ces deux histoires? Quels
risques comportent-elles ? Quelles opportunités pour l’Europe « first mover » ?
Pour répondre à ces interrogations, nous nous sommes appuyés sur une littérature académique et
technique grandissant en nombre, en détail et en qualité. Nous avons également eu recours à des
entretiens à Paris, Chambéry, Bruxelles, Copenhague et Pékin auprès de 25 institutions ou personnes
afin d’obtenir des informations qualitatives de première main. La plupart des cadres d’entreprises
contactés ont accepté de nous recevoir – mais certaines ont manifesté un goût du secret supérieur et
n’ont pas donné suite. A notre surprise, les syndicats européens d’énergies renouvelables (EPIA,
EWEA) se montrent assez peu diserts lorsqu’il s’agit de fournir les données ayant servi à établir les
graphiques qu’ils ont pu produire sur la répartition de la valeur ajoutée.
5
Hypothèses et scenarios
La problématique générale organisant nos lectures, nos entretiens et nos analyses a été celle des
effets de la mondialisation sur la production de l’innovation et la localisation de la valeur ajoutée.
Nous avons testé qualitativement deux scenarios ou hypothèses : celle d’une mondialisation
concentrant la valeur ajoutée dans les parties extrêmes de la filière (amont et aval) au détriment de
l’assemblage et de ce que l’on appelle en anglais le manufacturing, et celle d’une mondialisation
favorisant l’imitation et donnant l’avantage au « dernier arrivé » (late comer ou follower) dont une
stratégie gagnante consisterait à monter en gamme à partir d’un segment à basse valeur ajoutée – le
manufacturing, précisément – au détriment des leaders piégé dans une spécialisation ruineuse aux
extrémités de la chaîne de valeur. Laquelle de ces hypothèses se vérifie-t-elle aujourd’hui dans les
filières considérées, et à quelles conditions l’une plus que l’autre pourrait-elle se vérifier à l’horizon
2030 qui est celui de nombreuses contributions nationales à l’Accord de Paris sur le climat ( intended
nationally determined contributions – INDCs) – dont celle de l’Union Européenne ?
Nous avons identifé 4 instruments de la puissance : la mobilisation de politiques publiques et de
l’investissement, l’exploitation des économies d’échelle et des effets d’apprentissage, le transfert de
technologies par le commerce international, enfin la création d’un écosystème d’innovation
performant. Nous avons évalué les mobilisations relatives par l’Europe et la Chine de ces 4
instruments sur deux périodes. La période dite de « green race » (2000-2015) et l’autre plus
prospective de décarbonisation profondonde (2015-2050) en vue d’atteindre l’objectif de 2°c de
hausse maximale de température par rapport à l’ère pré-industrielle.
Résultats
1. Contre les prévisions de déclin de la puissance européenne, annoncées sur la base des valeurs
anticipées des investissements « verts » dans différents pays du monde, notre enquête montre que
dans la course à la valeur ajoutée, à l’emploi, et à la puissance considérée comme une maîtrise
technologique supérieure, l’Europe dispose aujourd’hui d’atouts que n’érode pas la mondialisation
face aux entreprises concurrentes chinoises.
2. Tel est particulièrement le cas en matière d’éoliennes, et singulièrement d’éolienne offshore. Mais
tel est aussi le cas dans le domaine de l’énergie photo-électrique où l’antécédent d’exportations
massives et brutales de panneaux au silicium par la Chine ne modifie en rien l’avantage comparatif
de l’Europe dans les technologies plus avancées, non plus que la nécessité de poursuivre
l’investissement technologique et en capital humain aux extrémités de la chaîne de valeur où
résident les plus grands profits.
3. « La guerre du soleil » entre l’Europe et la Chine était un conflit symbolique et politique entre
puissances aux intérêts commerciaux complémentaires ; elle n’était pas une guerre technologique de
conquête de la puissance, la technologie du silicium cristallin ayant vu ses brevets expirés depuis
plusieurs années. La méprise autour de la performance technologique de la Chine, sous-jacente à son
émergence comme premier pays exportateurs de panneaux au silicium, a fait passer ce pays pour
une puissance capable d’innovation et de rattrapage technologique sur des produits haut de gamme
quand il poursuivait en réalité une stratégique d’insertion dans le commerce international par une
6
spécialisation dans des activités d’assemblage, sur la base de lignes clef en main et d’automates de
montage importées depuis l’Europe.
4. En prolongeant les tendances d’investissement actuels entre régions, et en gardant en tête
l’incertitude autour de la mise en œuvre de stratégies nationales des pays membres de l’UE pour
atteindre l’objectif non contraignant d’une part de 27% d’énergie renouvelable en 2030 dans la
consommation d’énergie, la Chine ressort comme puissance dominante à l’aune de l’usage du
premier instrument de la puissance considérée dans l’étude : la mobilisation de politiques publiques
et de l’investissement.
5. La mobilisation des effets d’échelle et d’apprentissage conduit à des résultats plus équilibrés. La
Chine est arrivée au bout du solaire, si l’expression a un sens – les effets d’échelle et d’apprentissage
y sont aujourd’hui limités. Les firmes européennes en revanche, à l’instar de Siemens, recherche nt
un fractionnement des filières, une modularisation plus poussée qu’elle ne l’est actuellement, afin de
satisfaire à la demande de masse d’éoliennes devenues des commodities grâce à l’exploitation
d’économies d’échelle. Les effets d’apprentissage qui en découleraient profiteraient à la Chine, selon
l’exemple du solaire durant la dernière décennie.
6. L’écosystème de l’innovation en Chine ne paraît pas en mesure de satisfaire aux besoins de R&D,
et RDD&D induits à l’avenir par la décarbonisation profonde, alors que cet écosystème convenait
pour la phase de rattrapage durant la green race de ces quinze dernières années. Ce que la Chine a
réussi de son fait sur des technologies datées - la production de masse d’une commodité, le panneau
solaire silicium, avec effets d’apprentissage fournisseurs-clients – ne pourra être reproduit à
l’identique dans l’exemple de l’éolien on shore ou off -shore au regard des progrès technologiques
attendus et du rythme de ceux-ci. Les activités de production de module dans le secteur de l’éolien
ne devraient pas lui permettre de pouvoir livrer clef en main les éoliennes conçues en Europe, ni de
capturer la majorité de la valeur ajoutée.
7. L’échange international, dans la green race comme dans la décarbonisation, profonde profite au
« late mover » - le transfert de technologie se fait toujours par définition depuis le vendeur vers
l’acheteur. En important les produits intermédiaires européens, en acquérant des licences, en
apprenant-en-faisant par les relations fournisseurs-clients, la Chine profite du commerce sans doute
davantage que n’en profite l’Europe à l’aune du transfert de technologie.
8. Tout cela valide-t-il davantage le premier récit, ou au contraire le second plus critique à l’égard du
rattrapage technologique par un pays tel que la Chine? Jusqu’à aujourd’hui, la green race a profité au
climat, d’abord, en s’inscrivant dans une perspective inéluctable ; ensuite, elle a conféré davantage
de puissance relative à la Chine qu’à l’Europe, par l’étendue des instruments mobilisés (tableau 10).
9. Pour autant rien dans nos entretiens ne justifie des mesures de relocalisation de la valeur ajoutée
industrielle par des instruments tels que le droit douane, les avantages comparatifs de l’Europe dans
la R&D et la RDD&D justifiant de consacrer à celles-ci des moyens croissants et plus élevés que ceux
consentis actuellement. Les gains de puissance, dans notre tableau, restent relatifs, e t conditionnés
par la capacité de l’Europe à mobiliser sur son territoire les instruments plus pacifiques et plus
efficaces que sont les rendements d’échelle et des politiques énergétiques claires, ambitieuses, et
coordonnées. Le concurrent de l’Europe à l ’horizon 2030 semble bien moins être la Chine que
l’Europe elle-même.

7
Tableau 7: la mobilisation des instruments de la puissance, de la green race à la décarbonisation profonde Instruments de la
puissance
Mobilisation observée
dans la green race
(2000-2015)
Gain relatif de
puissance
Mobilisation dans la
décarbonisation (DDP)
(2015-2050)
Gain relatif de
puissance
Commentaires
Politiques publiques
et investissements
Oui Chine Oui Chine
L’incertitude européenne sur
les modalités 2030
Les tendances
d’investissement observées
Effets d’échelle et
d’apprentissage
Oui Chine Oui Neutre Les effets d’apprentissage sur
le PV limités.
Effets d’échelle sur l’éolien
(modulation) recherchées par
les firmes européennes
Effet d’apprentissage possible
en conséquence pour les
firmes chinoises
Transferts de
technologie par le
commerce
Oui Chine Non mentionné Chine Le commerce profite au late-
mover
Ecosystème
d’innovation
Oui Chine Oui Europe Ecosystème chinois inadapté
aux besoins de R&D et RDD&D
8
10. La localisation géographique détaillée de la valeur ajoutée, de même que les emplois attachés à
chaque maillon de la filière, sont des données requises dans le débat public – or elles font défaut
dans les appareils statistiques nationaux. La green race, comme la décarbonisation, créent des
gagnants et des perdants. La mobilisation des premiers et la compensation des seconds sont
nécessaires au bon déroulement du processus d’ajustement rapide vers la décarbon isation. Une
connaissance approfondie de l’état de l’innovation – qualité des brevets, innovation hors brevet –est
requise pour anticiper le sort et l’identité des perdants à l’avenir. A l’identique, la connaissance de la
répartition de la valeur et de l’emploi est cruciale pour instruire le débat public et faciliter la
transition. L’intelligence économique, telle que rassemblée par la D2IE, sans être inutile, nous paraît
moins nécessaire qu’une veille sur la répartition de la valeur et de l’emploi au sein de filières
« stratégiques » de la décarbonisation.
Organisation du rapport
Les trois premiers chapitres – les manifestations de la puissance (chapitre 1), les instruments de la puissance (chapitre 2) et les effets de la puissance (chapitre 3) – synthétisent les résultats documentés par nos entretiens et la littérature disponibles sur les énergies solaires et éoliennes. Le chapitre 4 détaille ces résultats dans le cas de l’éolien, le chapitre 5 dans le cas du solaire. Le chapitre 6 est un chapitre plus prospectif portant sur les biocarburants pour l’aviation.
9
TABLE DES MATIERES
Chapitre 1 ...............................................................................................................................11
La course aux technologies vertes : définitions et faits stylisés..................................11 1. Investissements dans les énergies renouvelables : la Chine première puissance ...........................12 2. Innovation dans les énergies renouvelables : la puissance de l’OCDE contestée ...........................15 3. Partage de la valeur : une spécialisation Européenne vers des activités non délocalisables ...........19 4. La puissance politique: l’émergence d’un soft power chinois.......................................................24
Chapitre 2 ...............................................................................................................................29
Les instruments de la puissance........................................................................................29 1. La mobilisation de politiques publiques volontaristes .................................................................30 2. L’exploitation des rendements d’échelle et de l’automation .......................................................33 3. Le transfert de technologies par le commerce international........................................................37 4. Coordination horizontale et intégration verticale : les leçons du rattrapage chinois......................40 5. L’écosystème de l’innovation ....................................................................................................44
Chapitre 3 ...............................................................................................................................48
A qui profite la « green race »?...........................................................................................48 1. La contribution à la lutte contre le changement climatique .........................................................49 2. Croissance et emploi.................................................................................................................51 3. Les avantages de la course en tête ............................................................................................56 4. Implications pour 2030 ............................................................................................................57
4.1. Leçons des scenarios de décarbonisation profonde ..............................................................60 4.2. De la green race à la décarbonisation profonde : quelles conséquences sur la puissance ? ......63
Conclusion ...................................................................................................................................66 Références des chapitres 1 à 3 ......................................................................................................68
Chapitre 4 ...............................................................................................................................71
La course aux technologies vertes dans le secteur des énergies éoliennes .............71 Introduction ................................................................................................................................72 Section I - Historical background ...................................................................................................74 Section II – Defining the objectives ................................................................................................77 Section III – International Trade in Wind Turbine Components: Risks and Opportunities ...................79
Opportunity: Exploiting natural barriers to trade: a low-risk, light-touch industrial policy .............81 Opportunity: Domestic markets.................................................................................................82
Section IV – Policy Recommendations ...........................................................................................87
Chapitre 5 ...............................................................................................................................94
La course aux technologies vertes dans le secteur des énergies solaires.................94 1. Introduction .............................................................................................................................96 2. PV market outlook....................................................................................................................96
2.1 EU and China in the global PV market ..................................................................................96 2.2 Projections for 2018-19 PV market: a Chinese leadership ......................................................98 2.3 PV system cost evolution ................................................................................................... 101 2.4 PV system components ..................................................................................................... 101
3. PV value chain ........................................................................................................................ 101 3.1 General trend ................................................................................................................... 101 3.2 Value chain in Europe........................................................................................................ 107
10
3.3 Value chain evolution in China ........................................................................................... 107 4. PV trade................................................................................................................................. 111
4.1 EU-China PV trade through value chain .............................................................................. 111 4.2 China PV export structure.................................................................................................. 111 4.3 China's PV export: processing trade dominated. ................................................................. 112 4.4 The role of free trade ........................................................................................................ 112
5. Domestic supportive policy ..................................................................................................... 114 5.1 Supporting production during early phases......................................................................... 114 5.2 Insufficient demand side supportive policies in early phase.................................................. 115 5.3 Increasing efforts to stimulate domestic demand in recent years ......................................... 115 5.4 Particular focus on distributed PV power installation .......................................................... 116 5.5 Ambition to build competitive solar power industry ............................................................ 116
6. Future PV market development............................................................................................... 117 6.1 Current challenges ............................................................................................................ 117 6.2 Strategies......................................................................................................................... 118
Chapitre 6 ............................................................................................................................ 121
La course aux technologies vertes dans le secteur des biocarburants pour l’aviation .............................................................................................................................. 121
Executive Summary ........................................................................................................... 123 1. Introduction ................................................................................................................... 124 2. Background .................................................................................................................... 124 3. Sustainable alternative jet fuel......................................................................................... 126 4. Cost................................................................................................................................ 129 5. Drivers of innovation ....................................................................................................... 135
6. Support policies ...................................................................................................... 137 7. Recommendations .......................................................................................................... 140
Conclusion ........................................................................................................................... 143
Bibliographie du chapitre 6............................................................................................. 145
ANNEXE ................................................................................................................................ 147
Liste des personnes interrogées..................................................................................... 147 En Chine .................................................................................................................................... 148 En Europe .................................................................................................................................. 148
11
Chapitre 1
La course aux technologies vertes : définitions et faits stylisés
Les “technologies vertes” désignent ici les technologies employées dans la production de biens et
services conçus pour la réduction des émissions de gaz à effet de serre (GES). Ces technologies sont
au cœur de la production et la consommation des énergies renouvelables (énergies solaires,
éoliennes, hydrauliques, géothermiques, marée-motrice, agrocarburants). On les rencontre
également dans ce que l’on dénomme les « réseaux intelligents » (smart grids), le stockage de
l’électricité, les transports dit « avancés » (i.e. non émetteurs de GES), la capture et le stockage du
carbone et l’efficacité énergétique au sens large (incluant en particulier l’isolation des bâtiments). A
lire les brèves et rapports publiés par le Programme des Nations unies pour l’environnement (PNUE),
l’agence Bloomberg, le Pew Center1, ces technologies font aujourd’hui l’objet d’une course entre
pays du G20 (green race), quand bien même la science économique récuse toute idée de compétition
entre pays.
Différents indicateurs de la puissance d’une nation ou d’une entreprise existent dans la littérature,
selon l’acception que choisit pour celle-ci. La puissance est une capacité. Capacité d’influence
permettant à un Etat d’aligner les objectifs et actions des autres acteurs dans le sens de ses p ropres
intérêts, la puissance est dans l’histoire de la pensée l’apanage de l’Etat, conçu de manière
anthropomorphique comme égoïste rationnel, doué de volonté. La puissance est « toute chance de
faire triompher, au sein d’une relation sociale, sa propre volonté contre la résistance d’autrui » selon
Max Weber2. « Capacité d’une unité politique d’imposer sa volonté aux autres unités. En bref, la
puissance n’est pas un absolu, mais une relation humaine » selon Raymond Aron3. Dans l’école
réaliste des relations internationales, l’individu recherche le pouvoir pour assouvir ses intérêts ; la
1 Voir en particulier PewCenter (2013), « Who’s winning the clean energy race », Pew Charitable Trust, et UNEP (2013) “Global trends in renewable energy investment 2013”, Frankfurt School of Management and
Investment, a report commissioned by UNEP’s Division of Technology, Industry and Economics (DTIE) in cooperation with Frankfurt School -UNEP Collaborating Centre for Climate & Sustainabl e Energy Finance and produced in collaboration with Bloomberg New Energy Finance..
2 Max Weber, Économie et société, chap. I, § 16.
3 Raymond Aron, Paix et Guerre entre les nations, Calmann-Lévy, Paris, 1962, p. 58
12
transposition à l’Etat transforme simplement « pouvoir » en « puissance » en français - la langue
anglaise ne s’embarrasse pas d’une telle subtilité et emploie un seul et même mot - power.
Dans l’école libérale et institutionnaliste, la puissance s’incarne dans la norme et le droit – elle est
alors la capacité d’un Etat à énoncer et faire appliquer les règles d’action collective indispensables à
la survie des Etats eux-mêmes qui, sans elles, seraient plongés dans une guerre perpétuelle, la seule
alternative étant d’être placés sous l’autorité toute puissante d’un hegemon. La modification des
actions et des comportements des Etats dans le sens de l’intérêt général mais aussi dans le sens de
l’intérêt de certains survient par l’entremise des règles, des normes et du droit. C’est le soft power de
Joseph Nye, tombé dans le langage commun aujourd’hui. Enonçant d’abord la puissance comme « la
capacité d’obtenir un résultat recherché et d’altérer les comportements des autres protagonistes dans
ce sens, et ce pour un coût acceptable » Nye définit le soft power comme la « capacité d’un pays à
structurer une situation de telle manière que d’autres pays développent des préférences ou
définissent leurs intérêts en harmonie avec les siens » ou, plus simplement, à « façonner ce que les
autres désirent »4.
Si la puissance est volonté, comment la mesurer ? Ce sont les moyens mobilisés pour son expression
que l’on trouve dans la littérature empirique – davantage que la mesure de la volonté elle-même
dont on perçoit immédiatement l’impossibilité ou les limites. L’école réaliste, pour faire court,
s’intéresse aux indicateurs de la puissance matérielle : revenus et patrimoines, accumulation de
ressources naturelles, dépense énergétique et alimentaire, budget militaire ; c’est dans l’économie et
la finance que s’atteste la puissance. Les libéraux (au sens de la philosophie politique) et
institutionnalistes ornent cette liste des attributs du pouvoir soft : standards et brevets, issues des
différents commerciaux, traduction dans les textes internationaux des principes, règles et des choix
collectifs nationaux.
Nous puisons dans ces deux registres pour dresser dans ce chapitre un état des lieux de la puissance
et de ses plus récents changements. Nous mesurons la capacité financière (investissements), la
capacité technologique (production et déploiement d’ innovations), la capacité économique (part de
la valeur ajoutée) et enfin la capacité politique au sens soft (fréquence et issues des différents
commerciaux).
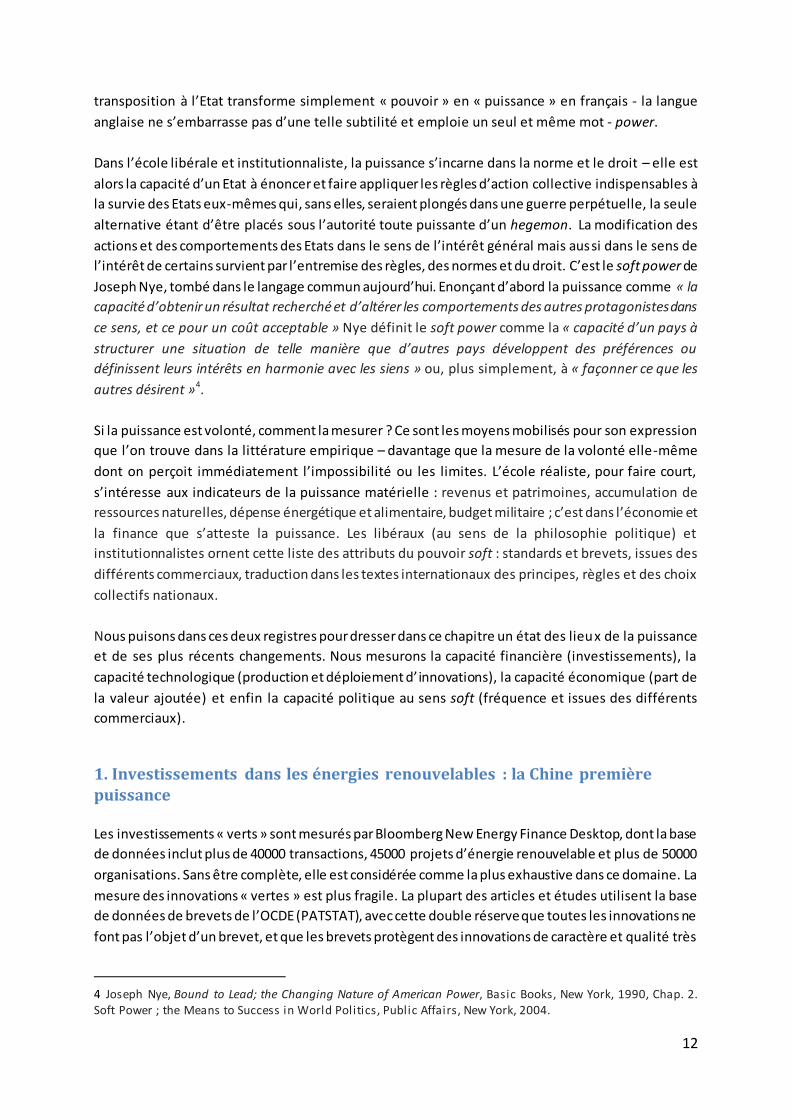
1. Investissements dans les énergies renouvelables : la Chine première puissance
Les investissements « verts » sont mesurés par Bloomberg New Energy Finance Desktop, dont la base
de données inclut plus de 40000 transactions, 45000 projets d’énergie renouvelable et plus de 50000
organisations. Sans être complète, elle est considérée comme la plus exhaustive dans ce domaine. La
mesure des innovations « vertes » est plus fragile. La plupart des articles et études utilisent la base
de données de brevets de l’OCDE (PATSTAT), avec cette double réserve que toutes les innovations ne
font pas l’objet d’un brevet, et que les brevets protègent des innovations de caractère et qualité très
4 Joseph Nye, Bound to Lead; the Changing Nature of American Power, Basic Books, New York, 1990, Chap. 2. Soft Power ; the Means to Success in World Politics, Public Affairs, New York, 2004.
13
différentes (Johnstone, Haščič, Watson, 2011). Des éléments qualitatifs, sous formes d’entretiens, et
des monographies d’entreprise, complètent l’information statistique fournie par PATSTAT. Nous y
aurons recours, en première ou deuxième main. Enfin les parts de marché (production, puissance
installée) et la répartition de la valeur ajoutées sont accessibles auprès des associations des
différentes énergies renouvelables qui nous intéressent ici (European Wind Energy Association
EWEA, European Photovoltaic Industry Association EPIA, Global Wind Energy Council GWEC), et le
cas échéant pour certains pays (en particulier la Chine) auprès de bureaux d’étude (GTM Consult) et
de chercheurs (Joanna l. Lewis, Georgetown University).
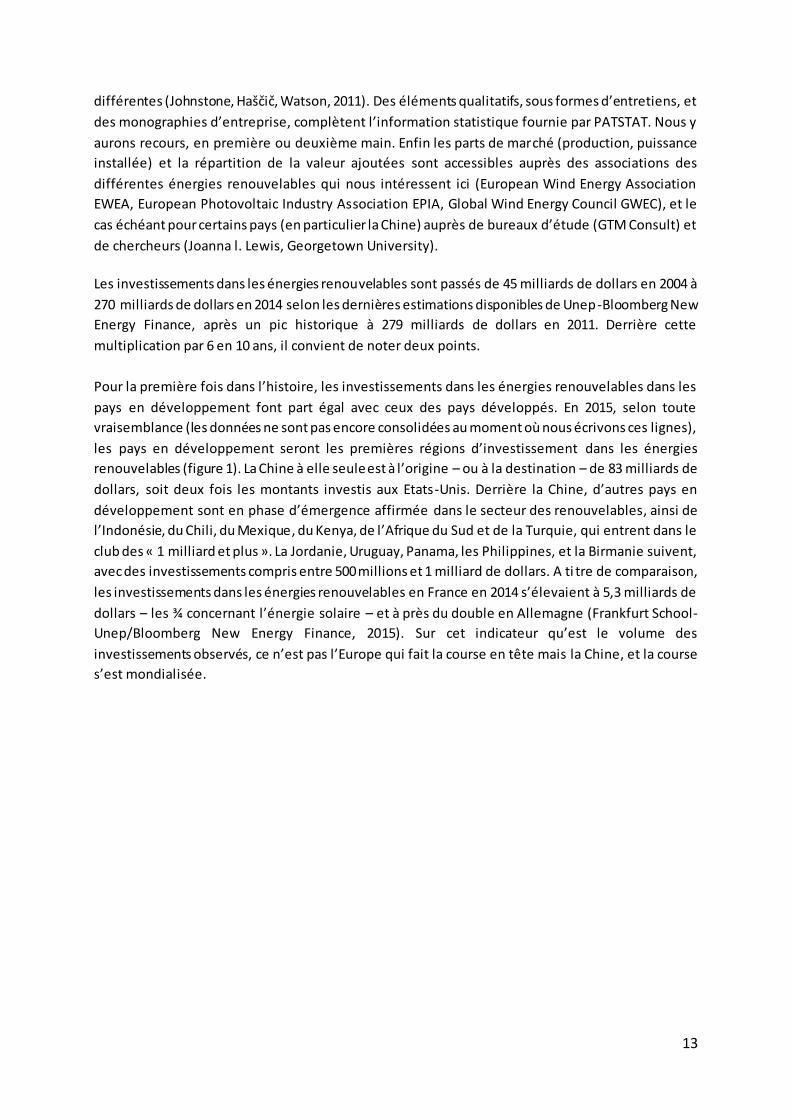
Les investissements dans les énergies renouvelables sont passés de 45 milliards de dollars en 2004 à
270 milliards de dollars en 2014 selon les dernières estimations disponibles de Unep-Bloomberg New
Energy Finance, après un pic historique à 279 milliards de dollars en 2011. Derrière cette
multiplication par 6 en 10 ans, il convient de noter deux points.
Pour la première fois dans l’histoire, les investissements dans les énergies renouvelables dans les
pays en développement font part égal avec ceux des pays développés. En 2015, selon toute
vraisemblance (les données ne sont pas encore consolidées au moment où nous écrivons ces lignes),
les pays en développement seront les premières régions d’investissement dans les énergies
renouvelables (figure 1). La Chine à elle seule est à l’origine – ou à la destination – de 83 milliards de
dollars, soit deux fois les montants investis aux Etats-Unis. Derrière la Chine, d’autres pays en
développement sont en phase d’émergence affirmée dans le secteur des renouvelables, ainsi de
l’Indonésie, du Chili, du Mexique, du Kenya, de l’Afrique du Sud et de la Turquie, qui entrent dans le
club des « 1 milliard et plus ». La Jordanie, Uruguay, Panama, les Philippines, et la Birmanie suivent,
avec des investissements compris entre 500 millions et 1 milliard de dollars. A ti tre de comparaison,
les investissements dans les énergies renouvelables en France en 2014 s’élevaient à 5,3 milliards de
dollars – les ¾ concernant l’énergie solaire – et à près du double en Allemagne (Frankfurt School-
Unep/Bloomberg New Energy Finance, 2015). Sur cet indicateur qu’est le volume des
investissements observés, ce n’est pas l’Europe qui fait la course en tête mais la Chine, et la course
s’est mondialisée.
14
Figure 1 : Nouveaux investissements par classe d’actifs, 2004-2014
Source : Unep-Bloomberg Energy Finance
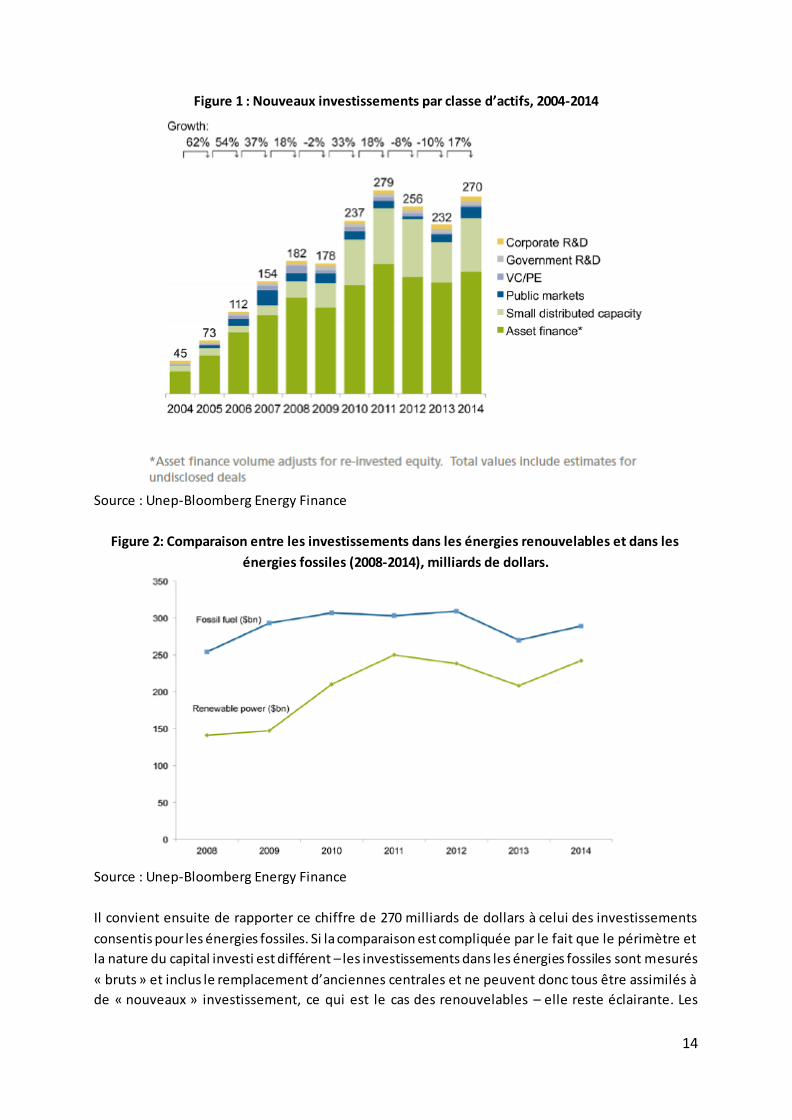
Figure 2: Comparaison entre les investissements dans les énergies renouvelables et dans les
énergies fossiles (2008-2014), milliards de dollars.
Source : Unep-Bloomberg Energy Finance
Il convient ensuite de rapporter ce chiffre de 270 milliards de dollars à celui des investissements
consentis pour les énergies fossiles. Si la comparaison est compliquée par le fait que le périmètre et
la nature du capital investi est différent – les investissements dans les énergies fossiles sont mesurés
« bruts » et inclus le remplacement d’anciennes centrales et ne peuvent donc tous être assimilés à
de « nouveaux » investissement, ce qui est le cas des renouvelables – elle reste éclairante. Les
15
investissements bruts dans les énergies fossiles plafonnent depuis la crise de 2008 dans la fourchette
des 250-300 milliards par an, soit l’actuel niveau des investissements renouvelables. Si on exclut les
investissements dans les barrages hydro-électriques, spécifiques par leur durée, les investissements
dans le renouvelables sont tout juste inférieurs à ceux dans les énergies fossiles (figure 2).
Cette seconde observation est importante, car elle suggère un changement d’attitude des
investisseurs à l’égard du risque dans le secteur de l’énergie. Longtemps perçus comme plus risqué
que les énergies fossiles, les énergies renouvelables semblent désormais un profil de
risque/rendement compatible avec ceux requis par les détenteurs de portefeuille et les investisseurs
institutionnels. La possibilité qu’il existe aujourd’hui une bulle « fossile » sur les marchés, en raison
d’une survalorisation des actifs par rapport à leur valeur corrigée du prix inéluctable du carbone, a
conduit avant la COP21 à Paris des grands patrons et banquiers centraux à réclamer la généralisation
des tests de stress des portefeuilles face à l’effondrement de ladite bulle . Le patron du fonds de
retraite BlackRock – plus de 4 trillions de dollars d’actif -, Larry Fink, a rendu public la lettre envoyée
aux patrons des 500 sociétés de l’indice Standard & Poor par laquelle il les enjoint d’annoncer des
plans crédibles de prise en compte des risques climatiques de long terme sous peine de les sortir de
son portefeuille5. La mise en garde est identique dans l’adresse de Mark Carney, banquier central
d’Angleterre, aux assureurs. La « tragédie de l’horizon » n’est pas inéluctable si ceux-là mêmes qui
ont le souci du temps long sur les places boursières corrigent la valeur anticipée de leurs actifs afin
d’intégrer les conséquences du changement climatique6. La perception d’un risque « fossile » change
la donne pour les renouvelables. Elle a également des conséquences sur les protagonistes de la
course aux énergies bas carbone, dans la mesure où le leadership pourrait à l’avenir s’attester bien
moins dans la prise de risque technologique et le souhait de mener par l’exemple, en jetant la
lumière dans un monde d’obscurité – le projet européen, pour faire court -, que dans le déploiement
à grande échelle de technologies de moins en moins risquées.
2. Innovation dans les énergies renouvelables : la puissance de l’OCDE contestée
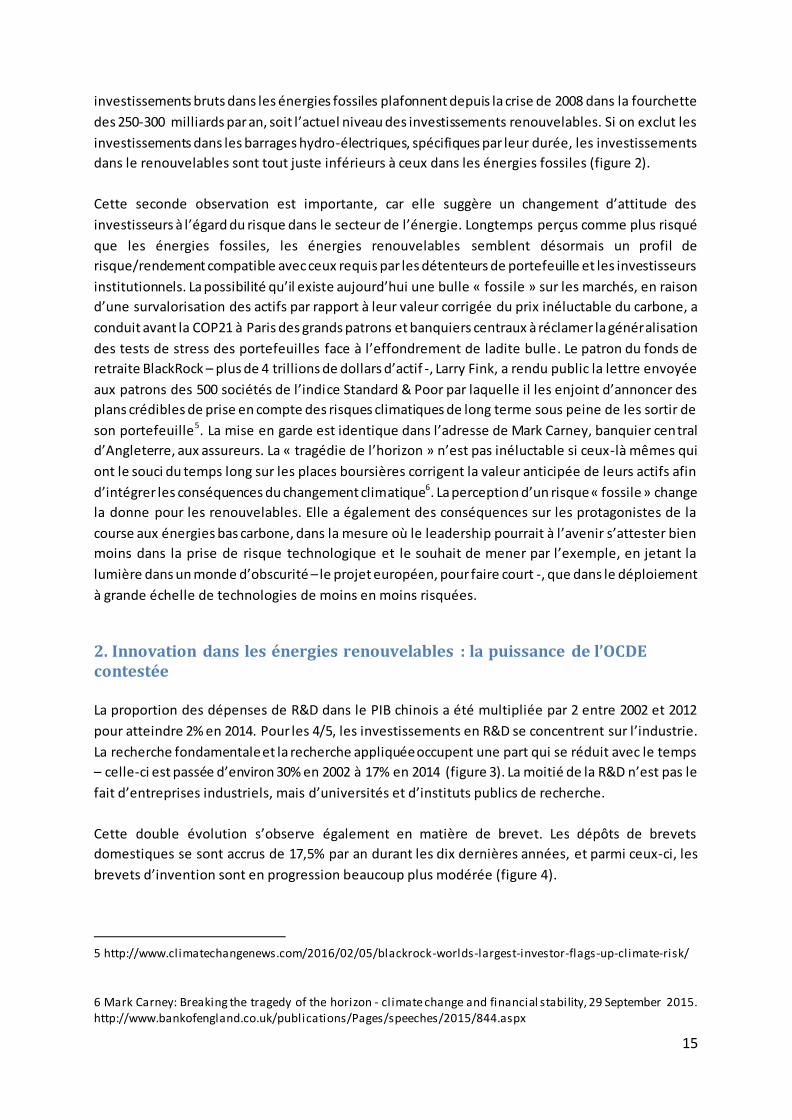
La proportion des dépenses de R&D dans le PIB chinois a été multipliée par 2 entre 2002 et 2012
pour atteindre 2% en 2014. Pour les 4/5, les investissements en R&D se concentrent sur l’industrie.
La recherche fondamentale et la recherche appliquée occupent une part qui se réduit avec le temps
– celle-ci est passée d’environ 30% en 2002 à 17% en 2014 (figure 3). La moitié de la R&D n’est pas le
fait d’entreprises industriels, mais d’universités et d’instituts publics de recherche.
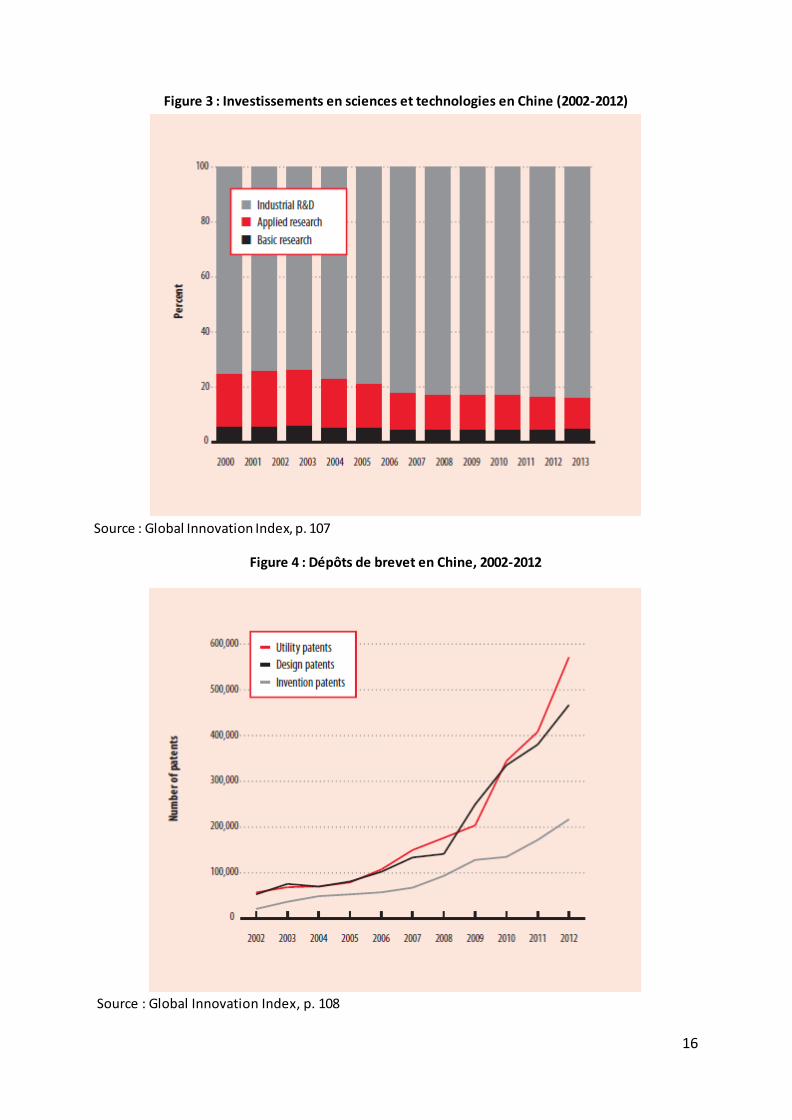
Cette double évolution s’observe également en matière de brevet. Les dépôts de brevets
domestiques se sont accrus de 17,5% par an durant les dix dernières années, et parmi ceux-ci, les
brevets d’invention sont en progression beaucoup plus modérée (figure 4).
5 http://www.climatechangenews.com/2016/02/05/blackrock-worlds-largest-investor-flags-up-climate-risk/
6 Mark Carney: Breaking the tragedy of the horizon - climate change and financial stability, 29 September 2015. http://www.bankofengland.co.uk/publications/Pages/speeches/2015/844.aspx
16
Figure 3 : Investissements en sciences et technologies en Chine (2002-2012)
Source : Global Innovation Index, p. 107
Figure 4 : Dépôts de brevet en Chine, 2002-2012
Source : Global Innovation Index, p. 108
17
Avec les limites que présentent les brevets, indicateurs approximatifs de l’innovation, nous pouvons
dresser un classement des pays – considérés comme un territoire économique – les plus innovants
en matière d’atténuation du changement climatique. Les équipes de recherche parmi les plus ferrées
sur le sujet aujourd’hui en France se trouvent au Cerna, sous la direction de Matthieu Glachant. Nous
restitutions ici leur travail de décompte statistique effectué sur les bases de données de brevet s de
l’OCDE.
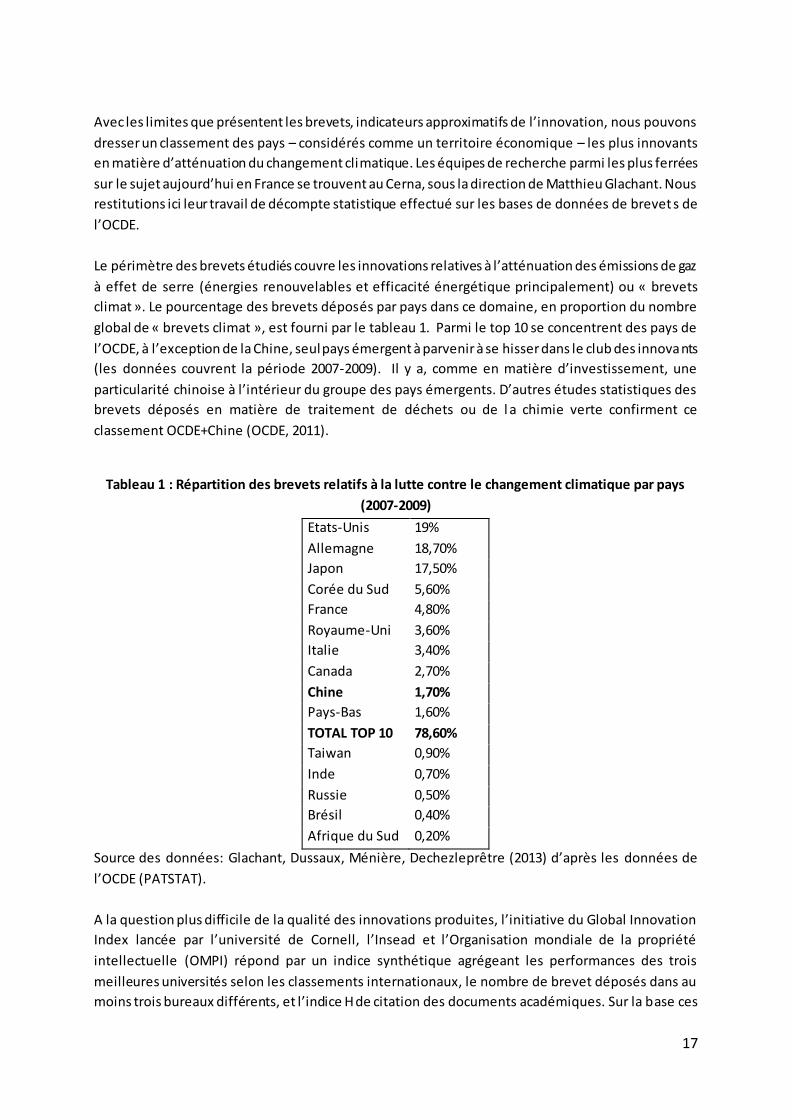
Le périmètre des brevets étudiés couvre les innovations relatives à l’atténuation des émissions de gaz
à effet de serre (énergies renouvelables et efficacité énergétique principalement) ou « brevets
climat ». Le pourcentage des brevets déposés par pays dans ce domaine, en proportion du nombre
global de « brevets climat », est fourni par le tableau 1. Parmi le top 10 se concentrent des pays de
l’OCDE, à l’exception de la Chine, seul pays émergent à parvenir à se hisser dans le club des innovants
(les données couvrent la période 2007-2009). Il y a, comme en matière d’investissement, une
particularité chinoise à l’intérieur du groupe des pays émergents. D’autres études statistiques des
brevets déposés en matière de traitement de déchets ou de l a chimie verte confirment ce
classement OCDE+Chine (OCDE, 2011).
Tableau 1 : Répartition des brevets relatifs à la lutte contre le changement climatique par pays
(2007-2009)
Etats-Unis 19%
Allemagne 18,70%
Japon 17,50%
Corée du Sud 5,60%
France 4,80%
Royaume-Uni 3,60%
Italie 3,40%
Canada 2,70%
Chine 1,70%
Pays-Bas 1,60%
TOTAL TOP 10 78,60%
Taiwan 0,90%
Inde 0,70%
Russie 0,50%
Brésil 0,40%
Afrique du Sud 0,20%
Source des données: Glachant, Dussaux, Ménière, Dechezleprêtre (2013) d’après les données de
l’OCDE (PATSTAT).
A la question plus difficile de la qualité des innovations produites, l’initiative du Global Innovation
Index lancée par l’université de Cornell, l’Insead et l’Organisation mondiale de la propriété
intellectuelle (OMPI) répond par un indice synthétique agrégeant les performances des trois
meilleures universités selon les classements internationaux, le nombre de brevet déposés dans au
moins trois bureaux différents, et l’indice H de citation des documents académiques. Sur la base ces
18
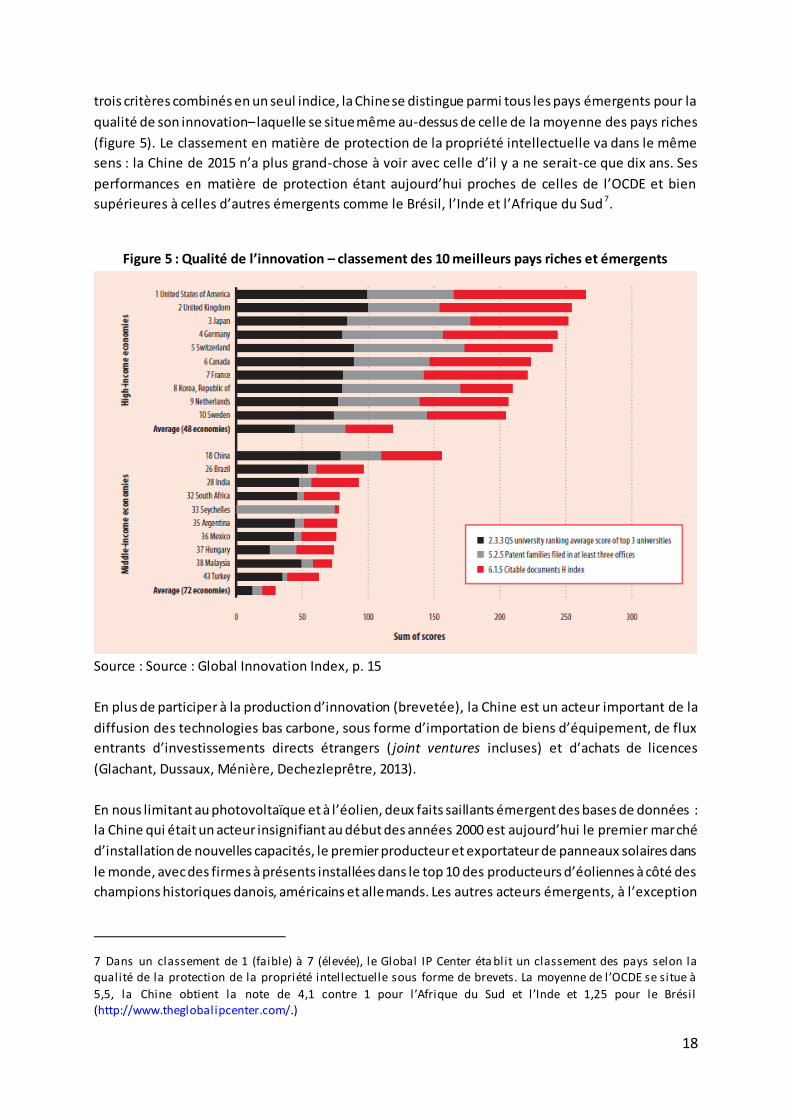
trois critères combinés en un seul indice, la Chine se distingue parmi tous les pays émergents pour la
qualité de son innovation– laquelle se situe même au-dessus de celle de la moyenne des pays riches
(figure 5). Le classement en matière de protection de la propriété intellectuelle va dans le même
sens : la Chine de 2015 n’a plus grand-chose à voir avec celle d’il y a ne serait-ce que dix ans. Ses
performances en matière de protection étant aujourd’hui proches de celles de l’OCDE et bien
supérieures à celles d’autres émergents comme le Brésil, l’Inde et l’Afrique du Sud 7.
Figure 5 : Qualité de l’innovation – classement des 10 meilleurs pays riches et émergents
Source : Source : Global Innovation Index, p. 15
En plus de participer à la production d’innovation (brevetée), la Chine est un acteur important de la
diffusion des technologies bas carbone, sous forme d’importation de biens d’équipement, de flux
entrants d’investissements directs étrangers ( joint ventures incluses) et d’achats de licences
(Glachant, Dussaux, Ménière, Dechezleprêtre, 2013).
En nous limitant au photovoltaïque et à l’éolien, deux faits saillants émergent des bases de données :
la Chine qui était un acteur insignifiant au début des années 2000 est aujourd’hui le premier marché
d’installation de nouvelles capacités, le premier producteur et exportateur de panneaux solaires dans
le monde, avec des firmes à présents installées dans le top 10 des producteurs d’éoliennes à côté des
champions historiques danois, américains et allemands. Les autres acteurs émergents, à l’exception
7 Dans un classement de 1 (faible) à 7 (élevée), le Global IP Center éta blit un classement des pays selon la qualité de la protection de la propriété intellectuelle sous forme de brevets. La moyenne de l’OCDE se situe à
5,5, la Chine obtient la note de 4,1 contre 1 pour l’Afrique du Sud et l’Inde et 1,25 pour le Brésil (http://www.theglobalipcenter.com/.)
19
de l’Inde et de son producteur de turbines Suzlon sont à peu près inexistants en terme de parts de
marché global.
3. Partage de la valeur : une spécialisation Européenne vers des activités non délocalisables
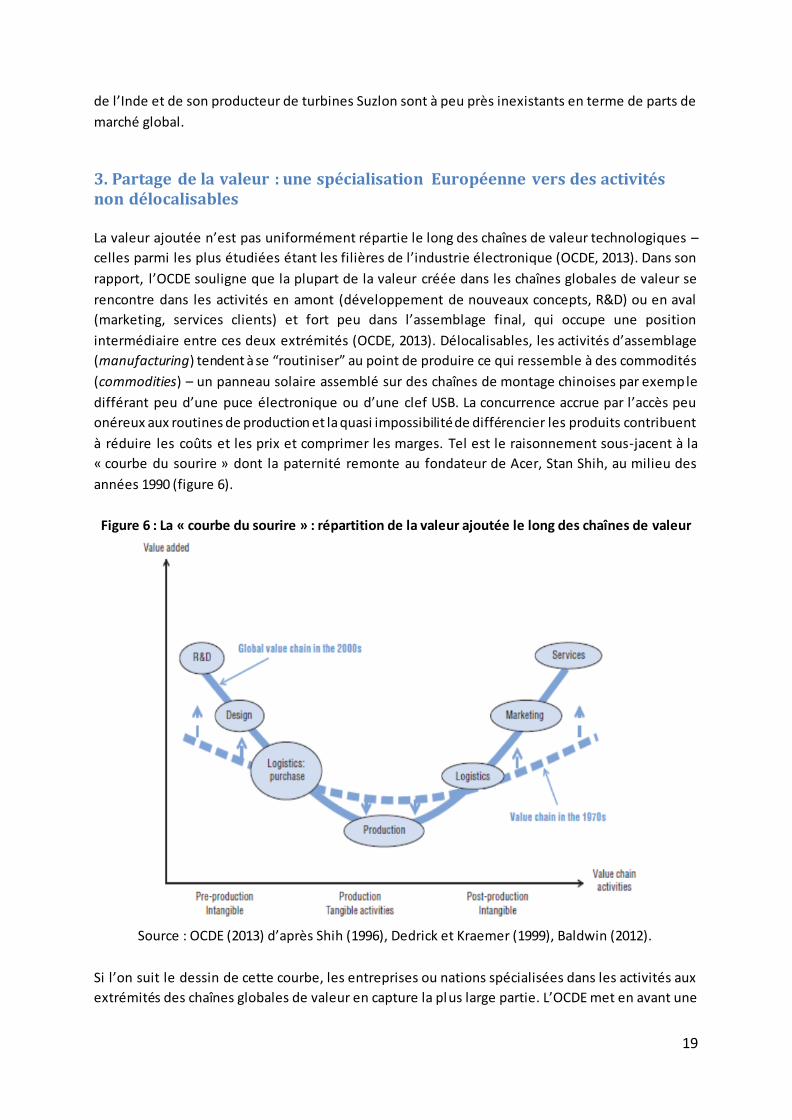
La valeur ajoutée n’est pas uniformément répartie le long des chaînes de valeur technologiques –
celles parmi les plus étudiées étant les filières de l’industrie électronique (OCDE, 2013). Dans son
rapport, l’OCDE souligne que la plupart de la valeur créée dans les chaînes globales de valeur se
rencontre dans les activités en amont (développement de nouveaux concepts, R&D) ou en aval
(marketing, services clients) et fort peu dans l’assemblage final, qui occupe une position
intermédiaire entre ces deux extrémités (OCDE, 2013). Délocalisables, les activités d’assemblage
(manufacturing) tendent à se “routiniser” au point de produire ce qui ressemble à des commodités
(commodities) – un panneau solaire assemblé sur des chaînes de montage chinoises par exemple
différant peu d’une puce électronique ou d’une clef USB. La concurrence accrue par l’accès peu
onéreux aux routines de production et la quasi impossibilité de différencier les produits contribuent
à réduire les coûts et les prix et comprimer les marges. Tel est le raisonnement sous-jacent à la
« courbe du sourire » dont la paternité remonte au fondateur de Acer, Stan Shih, au milieu des
années 1990 (figure 6).
Figure 6 : La « courbe du sourire » : répartition de la valeur ajoutée le long des chaînes de valeur
Source : OCDE (2013) d’après Shih (1996), Dedrick et Kraemer (1999), Baldwin (2012).
Si l’on suit le dessin de cette courbe, les entreprises ou nations spécialisées dans les activités aux
extrémités des chaînes globales de valeur en capture la plus large partie. L’OCDE met en avant une
20
telle courbe pour banaliser les conséquences des délocalisations industrielles ( outsourcing ou
offshoring) depuis le vieux continent ou l’Amérique du Nord dès lors que celles-ci prennent la forme,
dans les faits, de délocalisations manufacturières au sens anglais contemporain du terme, c’est-à-dire
pour l’essentiel d’assemblage final.
La « courbe du sourire » s’observe-t-elle dans l’exemple des chaînes de valeur des technologies
vertes ? Une première réponse, politique, est apportée par le premier ministre chinois – et elle est
affirmative. Quelques mois avant d’être nommé Premier, alors que la Chine se trouvait au centre de
plusieurs conflits commerciaux « verts » avec l’Europe et les Etats-Unis (figure 1), Li Keqiang avait
affirmé dans les colonnes du Financial Times, en substance, que la combinaison d’un « designed in
Europe » et d’un « assembled in China » produisait les meilleurs résultats :
« Economically, both China and Europe have much to benefit from each other's strength; this is the
defining feature of China-EU relations. When "designed in Europe" is combined with "made in China"
and when European technologies are combined with the Chinese market, there will be amazing
results”8.
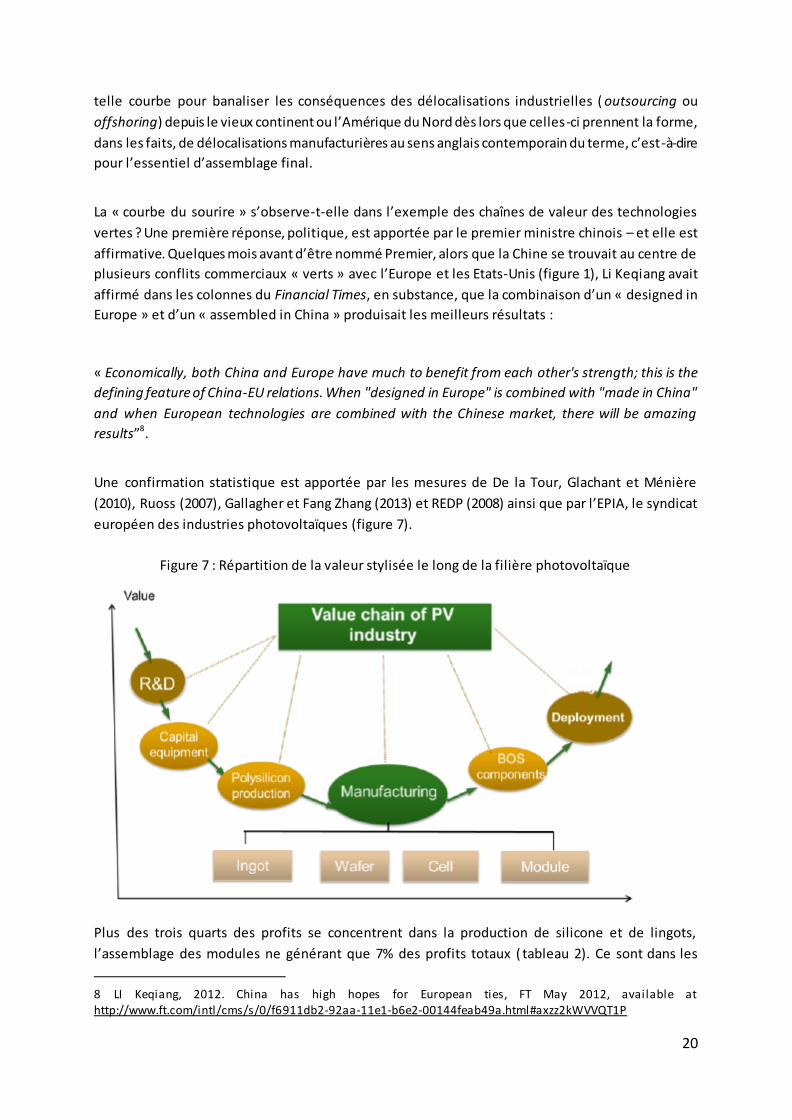
Une confirmation statistique est apportée par les mesures de De la Tour, Glachant et Ménière
(2010), Ruoss (2007), Gallagher et Fang Zhang (2013) et REDP (2008) ainsi que par l’EPIA, le syndicat
européen des industries photovoltaïques (figure 7).
Figure 7 : Répartition de la valeur stylisée le long de la filière photovoltaïque
Plus des trois quarts des profits se concentrent dans la production de silicone et de lingots,
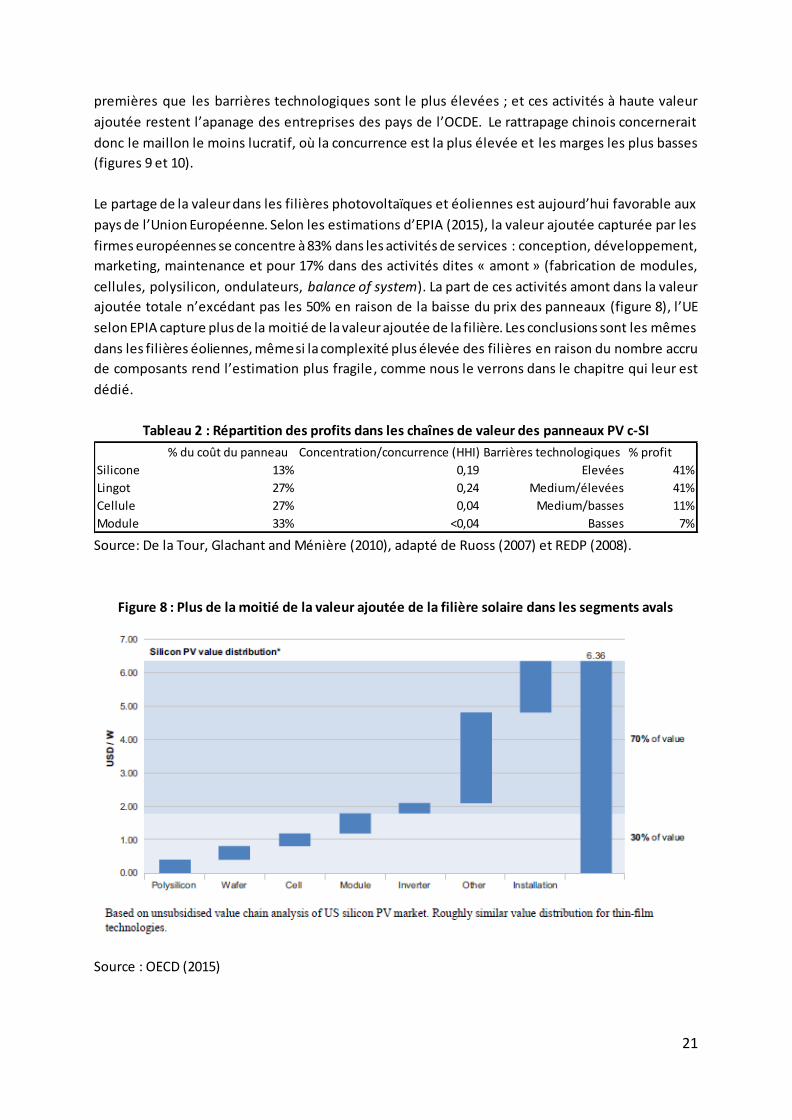
l’assemblage des modules ne générant que 7% des profits totaux ( tableau 2). Ce sont dans les
8 LI Keqiang, 2012. China has high hopes for European ties, FT May 2012, available at http://www.ft.com/intl/cms/s/0/f6911db2-92aa-11e1-b6e2-00144feab49a.html#axzz2kWVVQT1P
21
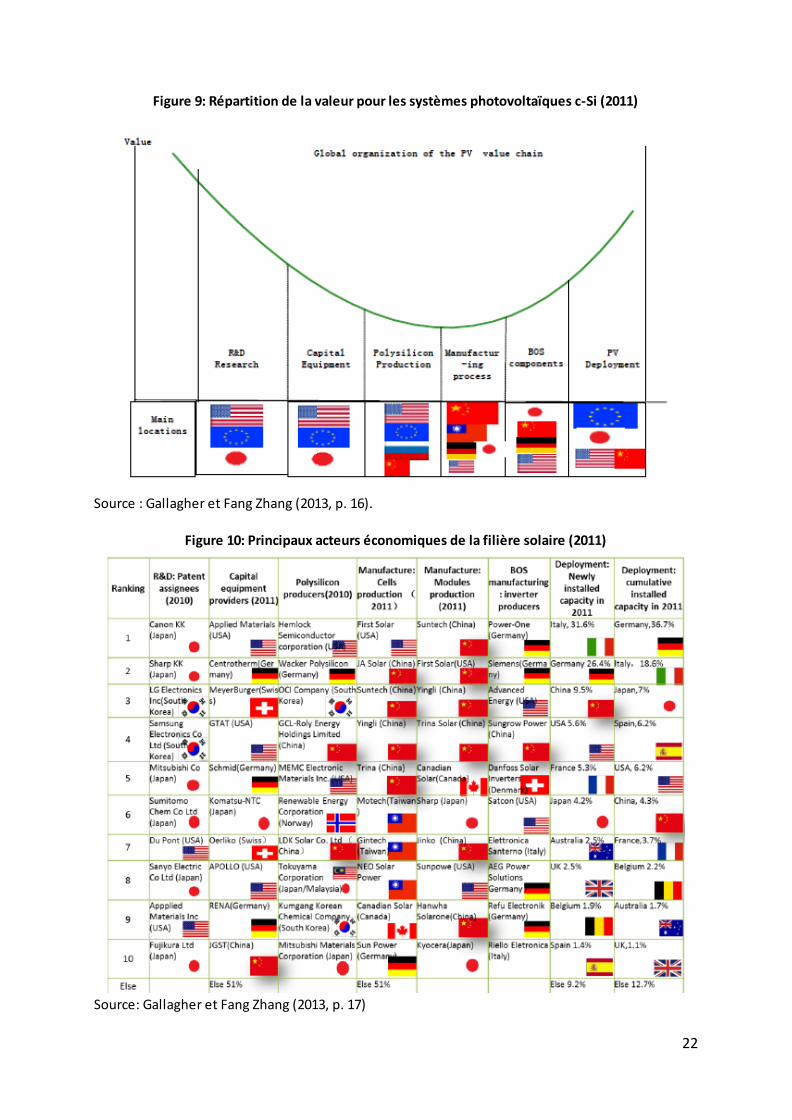
premières que les barrières technologiques sont le plus élevées ; et ces activités à haute valeur
ajoutée restent l’apanage des entreprises des pays de l’OCDE. Le rattrapage chinois concernerait
donc le maillon le moins lucratif, où la concurrence est la plus élevée et les marges les plus basses
(figures 9 et 10).
Le partage de la valeur dans les filières photovoltaïques et éoliennes est aujourd’hui favorable aux
pays de l’Union Européenne. Selon les estimations d’EPIA (2015), la valeur ajoutée capturée par les
firmes européennes se concentre à 83% dans les activités de services : conception, développement,
marketing, maintenance et pour 17% dans des activités dites « amont » (fabrication de modules,
cellules, polysilicon, ondulateurs, balance of system). La part de ces activités amont dans la valeur
ajoutée totale n’excédant pas les 50% en raison de la baisse du prix des panneaux (figure 8), l’UE
selon EPIA capture plus de la moitié de la valeur ajoutée de la filière. Les conclusions sont les mêmes
dans les filières éoliennes, même si la complexité plus élevée des filières en raison du nombre accru
de composants rend l’estimation plus fragile , comme nous le verrons dans le chapitre qui leur est
dédié.
Tableau 2 : Répartition des profits dans les chaînes de valeur des panneaux PV c-SI
Source: De la Tour, Glachant and Ménière (2010), adapté de Ruoss (2007) et REDP (2008).
Figure 8 : Plus de la moitié de la valeur ajoutée de la filière solaire dans les segments avals
Source : OECD (2015)
% du coût du panneau Concentration/concurrence (HHI) Barrières technologiques % profit
Silicone 13% 0,19 Elevées 41%
Lingot 27% 0,24 Medium/élevées 41%
Cellule 27% 0,04 Medium/basses 11%
Module 33% <0,04 Basses 7%
22
Figure 9: Répartition de la valeur pour les systèmes photovoltaïques c-Si (2011)
Source : Gallagher et Fang Zhang (2013, p. 16).
Figure 10: Principaux acteurs économiques de la filière solaire (2011)
Source: Gallagher et Fang Zhang (2013, p. 17)
23
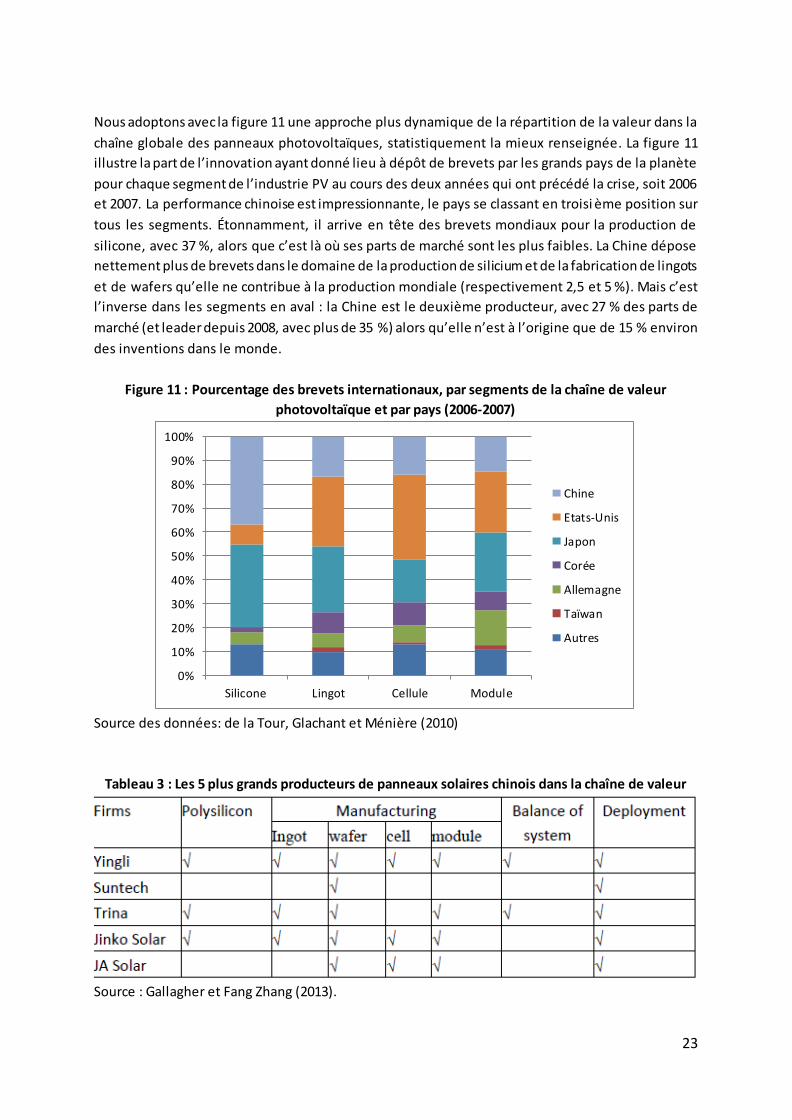
Nous adoptons avec la figure 11 une approche plus dynamique de la répartition de la valeur dans la
chaîne globale des panneaux photovoltaïques, statistiquement la mieux renseignée. La figure 11
illustre la part de l’innovation ayant donné lieu à dépôt de brevets par les grands pays de la planète
pour chaque segment de l’industrie PV au cours des deux années qui ont précédé la crise, soit 2006
et 2007. La performance chinoise est impressionnante, le pays se classant en troisi ème position sur
tous les segments. Étonnamment, il arrive en tête des brevets mondiaux pour la production de
silicone, avec 37 %, alors que c’est là où ses parts de marché sont les plus faibles. La Chine dépose
nettement plus de brevets dans le domaine de la production de silicium et de la fabrication de lingots
et de wafers qu’elle ne contribue à la production mondiale (respectivement 2,5 et 5 %). Mais c’est
l’inverse dans les segments en aval : la Chine est le deuxième producteur, avec 27 % des parts de
marché (et leader depuis 2008, avec plus de 35 %) alors qu’elle n’est à l’origine que de 15 % environ
des inventions dans le monde.
Figure 11 : Pourcentage des brevets internationaux, par segments de la chaîne de valeur
photovoltaïque et par pays (2006-2007)
Source des données: de la Tour, Glachant et Ménière (2010)
Tableau 3 : Les 5 plus grands producteurs de panneaux solaires chinois dans la chaîne de valeur
Source : Gallagher et Fang Zhang (2013).
0%
10%
20%
30%
40%
50%
60%
70%
80%
90%
100%
Silicone Lingot Cellule Module
Chine
Etats-Unis
Japon
Corée
Allemagne
Taïwan
Autres
24
L’intégration progressive des segments amont et aval spécialisés à l’origine dans les modules ne fait
plus de doute aujourd’hui (tableau 3). La hausse exponentielle de la production de modules en Chine
à compter de 2004 exerce une pression telle sur le marché du silicone purifié que les cours grimpent,
le polysilicone atteint les $500/kg en 2008, entraînant à la hausse les prix des panneaux. Afin de
s’assurer un approvisionnement stable, les producteurs de module chinois se lancent très tôt dans
l’intégration de ce maillon. En 2010, la production mondiale est estimée à 140000 tonnes, ce qui avec
un taux de conversion de 7g/Wp assure la mise en marché de 20 GW de modules. La Chine dont la
production était quasi nulle cinq ans auparavant en produit 45000 tonnes, soit 32% du total, ce qui
lui permet de satisfaire environ 75% de sa demande intérieure. On sait qu’ensuite l’excès d’offre tant
de silicone que de panneaux, dans un contexte de brutale crise financière, précipite les cours à la
baisse et provoque un différend commercial avec l’UE.
4. La puissance politique: l’émergence d’un soft power chinois
Un argument mis en avant pour défendre le multilatéralisme énonce, et pour le dire vite, les vertus
du droit sur la force, réside dans la protection qu’offre ce système d’organisation des relations
internationales aux Etats dépourvus de puissance au sens réaliste du terme. Le multilatéralisme
protégerait les Etats sans « hard power » ; il n’est pas étonnant alors de constater le soin mis par l’UE
à défendre ce type d’organisation, le hard power de l’Union, comme entité politique, étant des plus
émoussés (Badie et Devin, 2007). La puissance soft conférée par les règles et le droit s’incarne en
particulier dans la règle d’unanimité et de vote selon laquelle 1 pays=1 voix. En offrant un droit de
veto à tous ses Etats membres, les organisations multilatérales à l’exception des institutions
financières (Banque Mondiale, Fonds Monétaire International) et du Conseil de sécurité, offre aux
Etats la certitude d’être entendus.
La puissance effective, et non plus seulement théorique et symbolique, offerte par ce système,
s’incarne dans la possibilité de faire échouer une négociation (les faire réussir sur sa seule voix est
plus délicat), et de créer sur la base des textes existants une jurisprudence favorable à ses propres
intérêts et à sa conception de l’intérêt général. Nombre de textes de l’OMC en particulier, négociés
sur la base du consensus, nécessitent pour être transformés en droit intangibles la clarification
offerte par le règlement des différends. L’examen des plaintes oblige en effet le conseil général de
l’OMC à clarifier les zones grises du droit écrit, et de transformer celui-ci en droit de fait selon le
principe de jurisprudence. La capacité de mobiliser l’organe de règlement des différends, d’y porter
des plaintes ou de s’associer en tierce partie à celles-ci, mais aussi d’en recevoir et de se défendre
est une indication de l’exercice de la puissance soft d’une Nation.
Nous avons extrait des bases de données de l’OMC les cas de différends commerciaux déposés
auprès de l’Organe de règlement des différends de l’organisation. La Chine en l’espace d’un peu
moins de 15 ans, soumise à des règles particulières relatives à son protocole d’accession, a fait l’objet
de 34 plaintes, en a formulé 13 comme plaignant. Elle s’est associée comme tierce partie à 129
dossiers déposés à l’ORD. Ce nombre est considérable et traduit une volonté d’apprentissage des
règles avant l’exercice de plein droit de celles-ci. Afin de faciliter les comparaisons, nous avons
reproduit sous forme de carte le flux des plaintes entre pays – Etats-Unis, Europe, et le groupe des
25
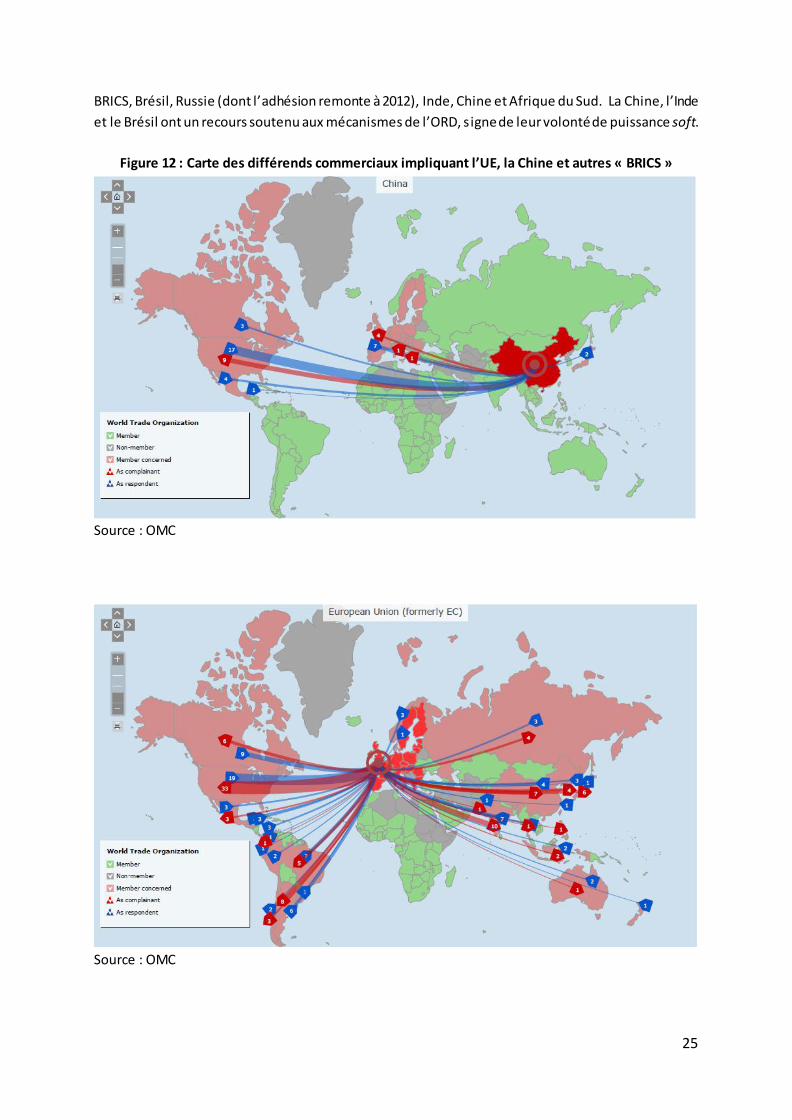
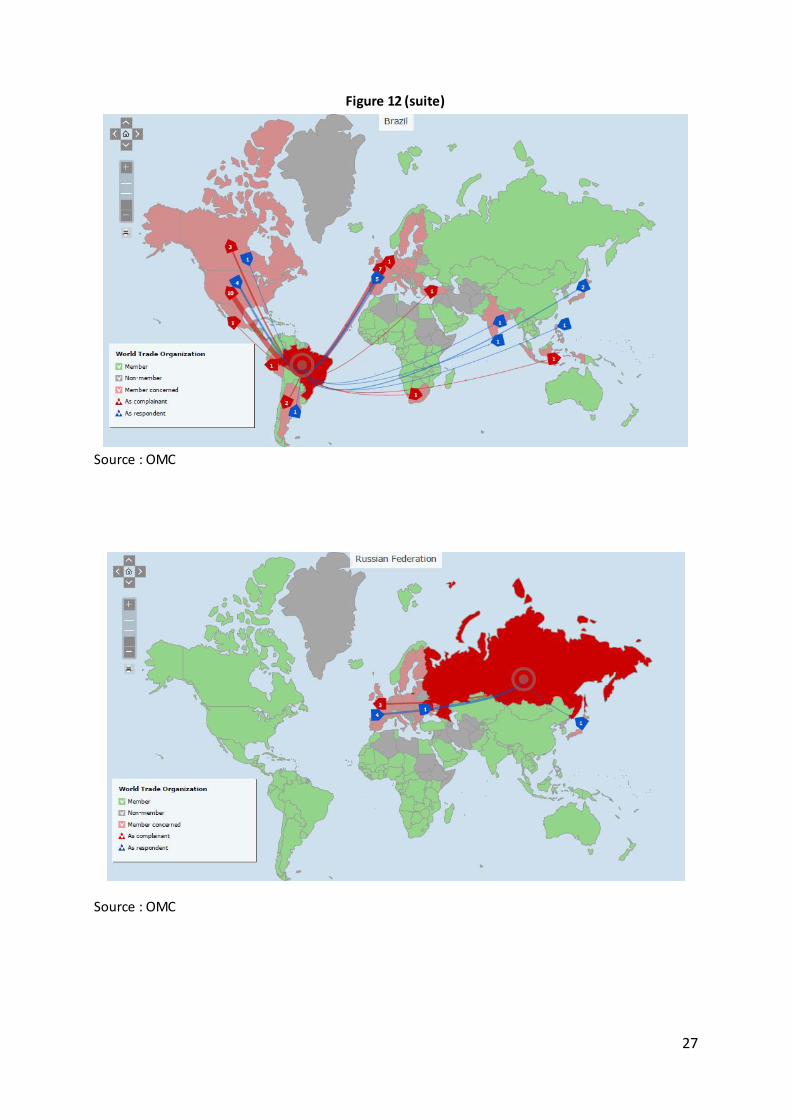
BRICS, Brésil, Russie (dont l’adhésion remonte à 2012), Inde, Chine et Afrique du Sud. La Chine, l’Inde
et le Brésil ont un recours soutenu aux mécanismes de l’ORD, s igne de leur volonté de puissance soft.
Figure 12 : Carte des différends commerciaux impliquant l’UE, la Chine et autres « BRICS »
Source : OMC
Source : OMC

26
27
Figure 12 (suite)
Source : OMC
Source : OMC
28
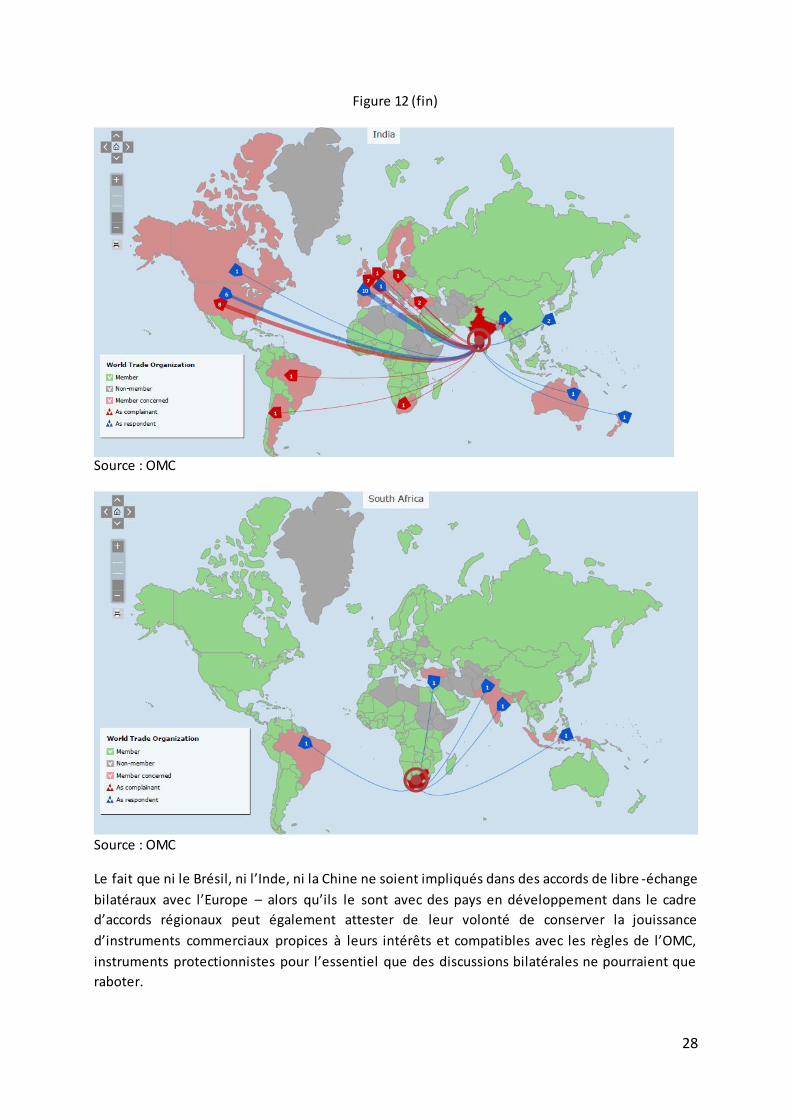
Figure 12 (fin)
Source : OMC
Source : OMC
Le fait que ni le Brésil, ni l’Inde, ni la Chine ne soient impliqués dans des accords de libre -échange
bilatéraux avec l’Europe – alors qu’ils le sont avec des pays en développement dans le cadre
d’accords régionaux peut également attester de leur volonté de conserver la jouissance
d’instruments commerciaux propices à leurs intérêts et compatibles avec les règles de l’OMC,
instruments protectionnistes pour l’essentiel que des discussions bilatérales ne pourraient que
raboter.
29
Chapitre 2
Les instruments de la puissance
Les manifestations des différents aspects de la puissance énoncés, intéressons-nous maintenant aux
instruments mobilisés pour en accroître l’audience et l’emprise. Pour l’essentiel, la littérature réaliste
s’intéresse aux instruments économiques de production de richesse et de renforcement de l’Etat en
tant qu’administration chargée d’exercer le monopole de la violence légitime. On ne peut
comprendre le capitalisme chinois et ses investissements dans l’économie bas carbone depuis cinq
ans sans garder en tête les particularités de cette économie qui la prédispose à se placer au service
ou sous l’influence de l’Etat. L’économie « verte » ou « bas carbone » se distingue en effet de
l’économie conventionnelle – économie des équipements et technologies des énergies fossiles -,
offrant de ce fait des instruments ou leviers particuliers.
Nous nous demanderons dans un premier temps s’il est possible de caractériser cette économie bas
carbone au moyen d’indicateurs capables de motiver l’action publique dans les perspectives
d’affirmation ou de conquête de la puissance dessinées dans le chapitre précédent. Les documents
institutionnels (OCDE, PNUE notamment, mais aussi les documents ministériels comme ceux produits
par le Department for Business, Innovation and Skills britannique 9) insistent bien évidemment sur les
externalités – positives et négatives – attachées à l’économie et aux technologies vertes. Celles-ci
contribuent à réduire l’empreinte d’une externalité négative (les émiss ions de gaz à effet serre) et
par effet miroir, participent à la production d’un bien public – la fourniture de technologies
d’atténuation bon marché. D’autres défaillances de marché émaillent cependant le fonctionnement
de l’économie bas carbone – ainsi des problèmes d’incertitude (retour sur investissement) et
d’asymétrie d’information (entre innovants et consommateurs achetant l’innovation), de relation
principal-agent, de pouvoir de marché (marchés non contestables, ie avec barrière à l’entrée),
d’incohérence institutionnelle et réglementaire (incohérence transversale entre instruments – taxes,
subventions, normes – et incohérence dans le temps, qui renvoie au problème d’incertitude énoncé
précédemment)10.
9 Department for Business, Innovation and Skil ls, and Department of Energy and Climate Change. (2009). The UK Low Carbon Industrial Strategy. London
10 Department for Business Innovation and Skil ls (2009) economics paper – Towards a Low Carbon Economy – economic analysis for a low carbon industrial strategy.
30
Sans la distinguer radicalement de l’économie conventionnelle, ces défaillances de marché, par leur
ampleur et par leur nombre, font de l’économie verte une économie intrinsèquement intensive en
politiques publiques (Gillingham et Swinney, 2010) et donc très logiquement un objet, en soi, de la
puissance. Le soutien public financier – et non simplement réglementaire - constitue un premier
instrument de la puissance au regard de ce que l’on a pu observer sur les marchés du solaire et de
l’éolien ces dix dernières années. Ce n’est pas le seul, comme nous l e verrons dans les sections
suivantes, s’y ajoutent l’exploitation des économies d’échelle et de l’automation, le commerce
international mis au service du transfert de technologies, enfin l’apprentissage horizontal et
l’intégration verticale dans l’exemple particulier de l’écosystème d’innovation chinois.
1. La mobilisation de politiques publiques volontaristes
Contrairement à l’innovation pour laquelle un indice d’intensité existe, à notre connaissance aucun
indice d’intensité en politiques ou soutiens publics n’est disponible pour les différents secteurs de
l’économie, si on excepte l’agriculture et les travaux menés par l’OCDE pour évaluer les distorsions
de concurrence internationale et les écarts entre prix observé et prix d’équilibre du marché 11. Nous
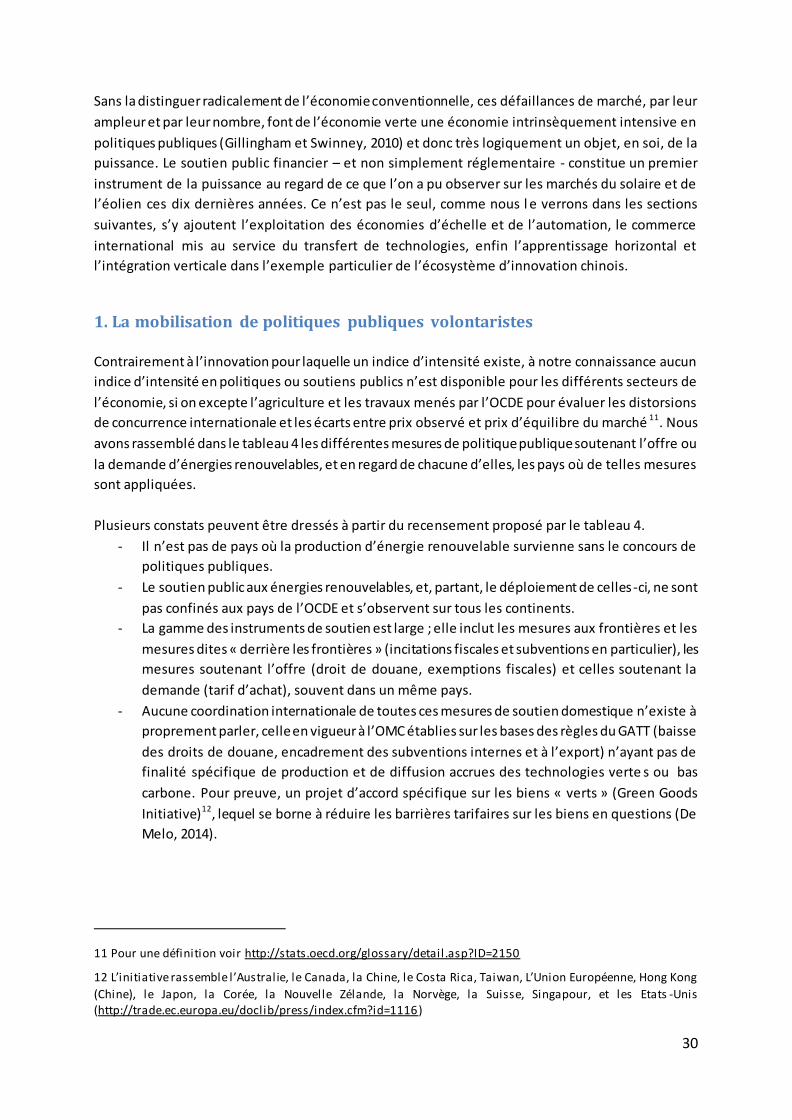
avons rassemblé dans le tableau 4 les différentes mesures de politique publique soutenant l’offre ou
la demande d’énergies renouvelables, et en regard de chacune d’elles, les pays où de telles mesures
sont appliquées.
Plusieurs constats peuvent être dressés à partir du recensement proposé par le tableau 4.
- Il n’est pas de pays où la production d’énergie renouvelable survienne sans le concours de
politiques publiques.
- Le soutien public aux énergies renouvelables, et, partant, le déploiement de celles -ci, ne sont
pas confinés aux pays de l’OCDE et s’observent sur tous les continents.
- La gamme des instruments de soutien est large ; elle inclut les mesures aux frontières et les
mesures dites « derrière les frontières » (incitations fiscales et subventions en particulier), les
mesures soutenant l’offre (droit de douane, exemptions fiscales) et celles soutenant la
demande (tarif d’achat), souvent dans un même pays.
- Aucune coordination internationale de toutes ces mesures de soutien domestique n’existe à
proprement parler, celle en vigueur à l’OMC établies sur les bases des règles du GATT (baisse
des droits de douane, encadrement des subventions internes et à l’export) n’ayant pas de
finalité spécifique de production et de diffusion accrues des technologies verte s ou bas
carbone. Pour preuve, un projet d’accord spécifique sur les biens « verts » (Green Goods
Initiative)12, lequel se borne à réduire les barrières tarifaires sur les biens en questions (De
Melo, 2014).
11 Pour une définition voir http://stats.oecd.org/glossary/detail.asp?ID=2150
12 L’initiative rassemble l’Australie, le Canada, la Chine, le Costa Rica, Taiwan, L’Union Européenne, Hong Kong
(Chine), le Japon, la Corée, la Nouvelle Zélande, la Norvège, la Suisse, Singapour, et les Etats -Unis (http://trade.ec.europa.eu/doclib/press/index.cfm?id=1116)
31
Tableau 4 : Mesures de soutien à la production et à la diffusion des énergies renouvelables
Source : D’après Lewis (2014) ; Lewis and Wiser 2005; Lewis 2007b; Lewis and Wiser 2006; Lewis
2012a; Center for Economic Policy Research 2013; REN21 2013
La quantité des interventions s’explique par la multiplicité des desseins. Une particularité de
l’économie verte réside dans la nature de ses produits, tout à la fois de nature privée – les brevets en
attestent – et publique, dans une acception large, dès lors que la production de technologies bas
carbone contribue à fournir ce bien public qui est la stabilisation des concentrations de gaz à effet de
serre dans l’atmosphère à un niveau qui empêche toute « perturbation anthropique dangereuse du
système climatique. L’incarnation de cette double nature s’observe en Europe comme en Chine.
En Chine, les dépenses consenties dans le secteur des énergies renouvelables s’explique par divers
motifs – lutte contre la pollution de l’air, modernisation d’équipements obsolètes, investissements
sans regrets en raison de l’abondance de liquidités, conquête de parts de marché sur un segment à
valeur ajoutée supérieure à celles des produits précédemment exportés (Xin Wang, Shuwei Zhang,
2016). Les secteurs prioritaires high-tech que sont l’éolien, le solaire et les télécommunications ont
de surcroît bénéficié de prêts à des taux inférieurs à ceux du marché d’un montant de 92,4 milliards
de dollars entre 2005 et 2010 selon les estimations de Sanderson et Forsythe (2013).
Mesures de soutien Pays
Tarifs d'achat Allemagne; Australie; Autriche; Canada; Croatie; Chypre; Republique Tchèque; Danemark;
Estonie; Finlande; France; Grèce; Hongrie; Irelande; Israël; Italie; Japon;
Luxembourg; Malta; Pays-Bas; Portugal; Slovaquie; Slovénie; Espagne; Suisse;
Royaume-Uni; Algérie; Argentine; Bosnie/Herzegovine; Bulgarie; Chine;
Republique Dominicaine; Equateur; Iran; Jordanie; Kazakhstan; Lettonie; Lithuanie;
Macédoine; Malaisie; Maurice; Monténegro; Panama; Perou; Serbie; Thailande;
Turquie; Uruguay; Arménie; Ghana; Honduras; Indie; Indonésie; Lesotho; Moldavie;
Mongolie; Nicaragua; Nigéria; Pakistan; Palestine; Philippines;
Sénégal; Sri Lanka; Syrie; Ukraine; Kenya; Rwanda; Tajikistan; Tanzanie; Ouganda
Subventions directes, remises, prêts avantageux Allemagne; Australie; Austriche; Canada; Croatie; Chypre; République Tchèque; Danemark;
Finlande; France; Grèce; Hongrie; Italie; Japon; Luxembourg; Malte; Pays-Bas;
Norvège; Oman; Pologne; Portugal; Slovaquie; Slovénie; Corée du Sud; Espagne; Suède;
Suisse; Royaume-Uni; Etats-Unis; Argentine; Bosnie/Herzegovine;
Botswana; Bulgarie; Chili; Chine; République Dominicaine; Russie; Turquie; Uruguay;
Egypte; Ghana; Inde; Indonésie; Lesotho; Nigéria; Pakistan; Philippines; Sri Lanka;
Vietnam; Bengladesh; Kyrgyzstan; Nepal; Tanzanie; Ouganda; Zambie
Contenu local Chine (Eolien, 1997); Brésil (Eolien, 2002); Indie (Solaire, 2010);
Canada (Eolien, 2003 ; Eolien/Solaire 2009); Ukraine (Eolien/Solaire, 2013); USA (Eolien/Solaire/Autres, 2009)
Espagne (Eolien, 1994); Italie (Solaire, 2011); France (Solaire, 2012); Croatie (Eolien/Solaire/Autres, 2012)
Afrique du Sud (Eolien/Solaire, 2011); Turquie (Eolien/Solaire/Autres, 2011)
Argentine (Eolien, 2005); Malaisie (Eolien/Solaire/Autres, 2010)
Incitations fiscales Royaume-Uni (Produits verts, 2009); Brésil (Eolien, 2009); Etats-Unis (Eolien/Solaire/Autres, 2009)
Droits de douane Brésil (Eolien, 2009); Russie, Belarus et Kazakhstan (Solaire, 2010); Chine (Eolien, multiples années)
Venezuela (toute production électrique, 2009)
Assistance crédit export Danemark (Eolien, diverses années);
Etats-Unis (Produits verts vers la Corée, 2009; ENR vers Abu Dhabi, 2013 ; Autres); OCDE (Toutes ENR, 2012)
Soutien R&D&Démonstration Chine (Eolien, Solaire, diverses années); Etats-Unis (Solaire, Eolien Offshore ; 2011/2013)
Danemark (Eolien, diverses années); Allemagne (Eolien, Solaire, diverses années)
32
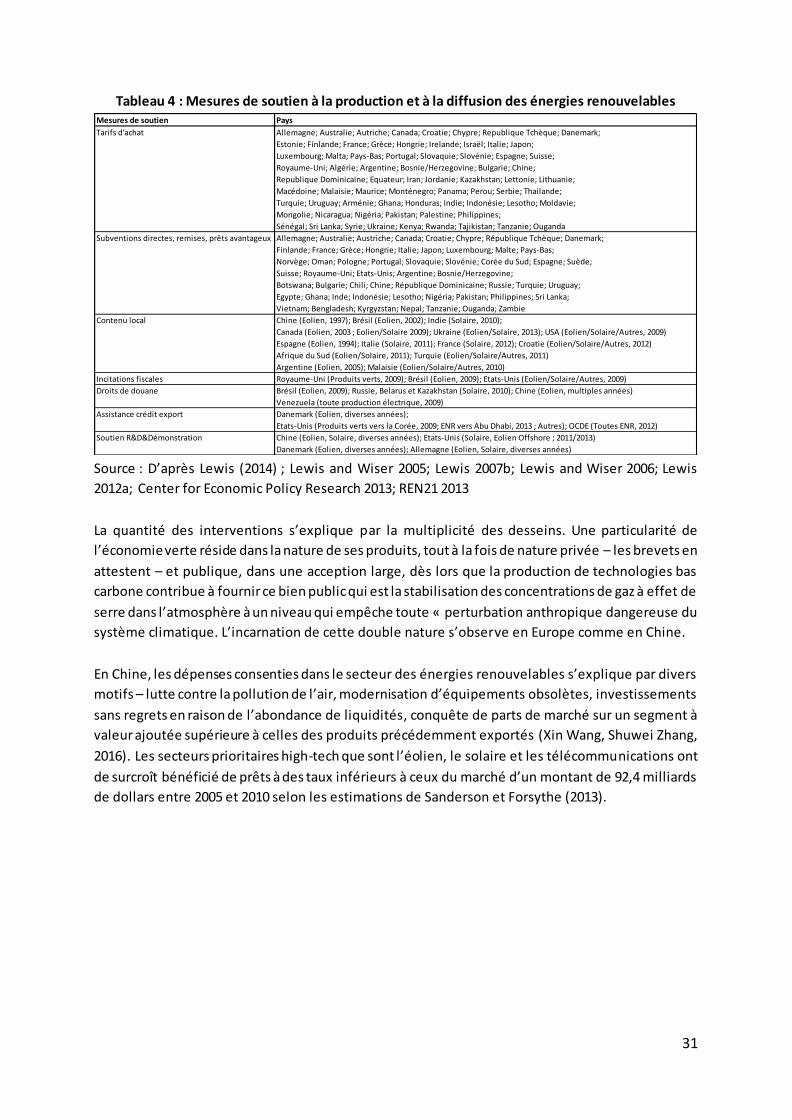
Figure 13 : Ventilations de soutiens publics à l’énergie dans l’UE-28 en 2012
Source : ECOFYS, 2014
Les sommes dépensées par l’Allemagne pour l’énergie solaire, pour l’essentiel sous forme de tarifs
d’achat, sont à peu près équivalentes – une moyenne 10 milliards d’euro par an au cours des treize
dernières années, et 5 milliards par an annoncés durant les 2 prochaines décennies (une « photo »
des soutiens publics est donnée figure 13, la ventilation des soutiens à l’énergie dans l’UE-28 par
types d’instruments figure 14). Rapportés aux émissions évitées, ces chiffres sont colossaux. Selon les
estimations de Lomborg, très critique de ces subventions « pour des technologies dépassées », le
coût d’abattement s’élève à 1000$ la tonne – une absurdité13. Les réserves de Lomborg à l’égard de
politiques de soutien de la demande (« pull ») relève du calcul coût/bénéfice. Sauf à valoriser les
dégâts climatiques très au-delà des estimations les plus courantes, il est inefficace de subventionner
l’installation de panneaux solaires à la technologie dépassée n’ayant aucun effet d’entraînement sur
l’offre technologique allemande. Ces critiques réouvrent un vieux débat sur politiques d’offres et
politiques de demandes, la vérité restant que l’une et l’autre, en Europe comme en Chine, ont été
essayées et que les émissions ne sont toujours pas stabilisées. Plus fondamentalement, l’aberration
économique d’un soutien de l’ordre de 100 milliards d’euros pour du déploiement ne fait pas justice
aux motivations politiques. 100 milliards peut être le prix à payer pour prétende être champion des
renouvelables, rassurer les investisseurs, donner le signal en somme que l’ère du fossile ce termine –
et ce quel qu’en soit le prix. Rétrospectivement, il serait injuste d’accabler les subventions
allemandes quand on sait que grâce à elles, en partie, les volumes produits se sont démultipliés et, à
13 Bjorn Lomborg. 2012. « Goodbye Sunshine ». Project Syndicate.
http://www.slate.com/articles/news_and_politics/project_syndicate/2012/02/why_germany_is_phasing_out_its_solar_power_subsidies_.html
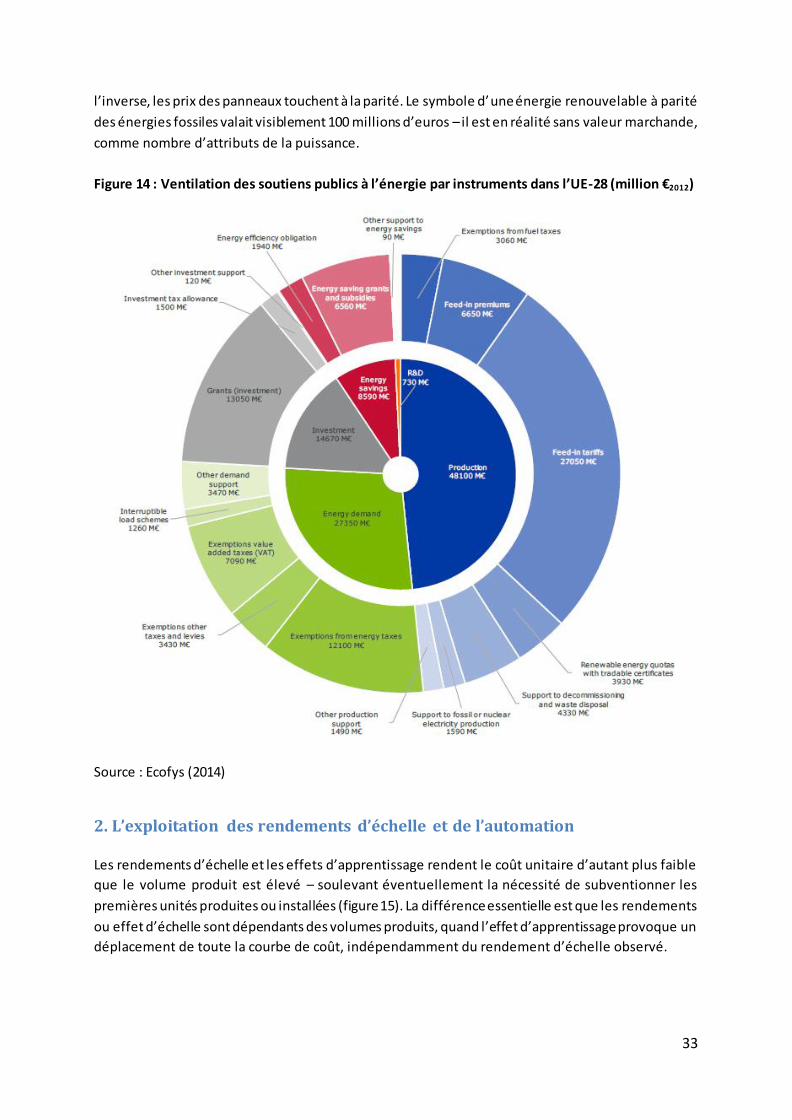
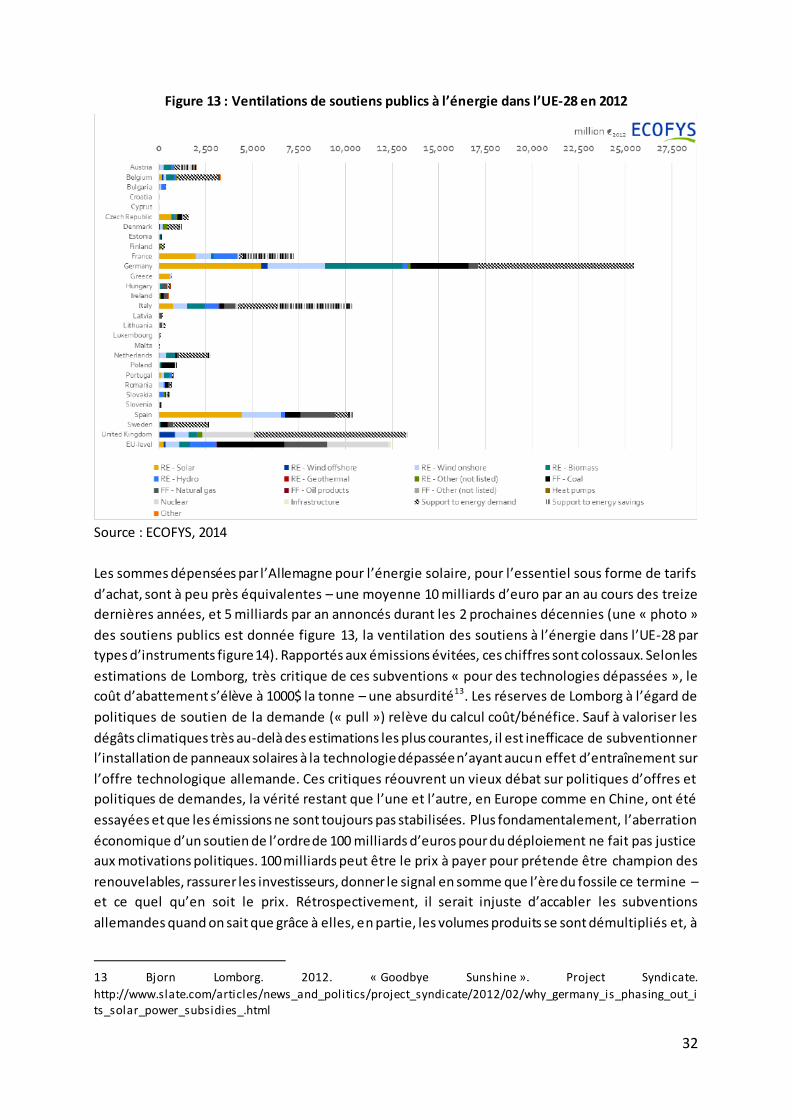
33
l’inverse, les prix des panneaux touchent à la parité. Le symbole d’une énergie renouvelable à parité
des énergies fossiles valait visiblement 100 millions d’euros – il est en réalité sans valeur marchande,
comme nombre d’attributs de la puissance.
Figure 14 : Ventilation des soutiens publics à l’énergie par instruments dans l’UE-28 (million €2012)
Source : Ecofys (2014)
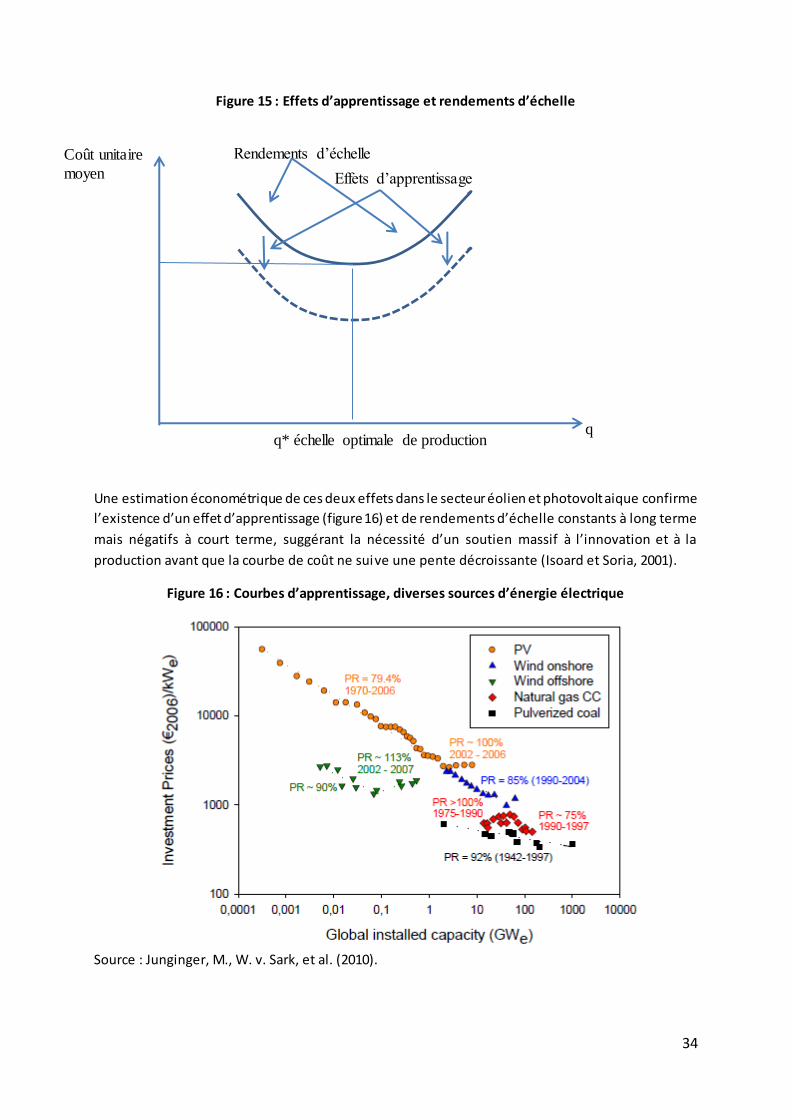
2. L’exploitation des rendements d’échelle et de l’automation
Les rendements d’échelle et les effets d’apprentissage rendent le coût unitaire d’autant plus faible
que le volume produit est élevé – soulevant éventuellement la nécessité de subventionner les
premières unités produites ou installées (figure 15). La différence essentielle est que les rendements
ou effet d’échelle sont dépendants des volumes produits, quand l’effet d’apprentissage provoque un
déplacement de toute la courbe de coût, indépendamment du rendement d’échelle observé.
34
Figure 15 : Effets d’apprentissage et rendements d’échelle
Une estimation économétrique de ces deux effets dans le secteur éolien et photovoltaique confirme
l’existence d’un effet d’apprentissage (figure 16) et de rendements d’échelle constants à long terme
mais négatifs à court terme, suggérant la nécessité d’un soutien massif à l’innovation et à la
production avant que la courbe de coût ne suive une pente décroissante (Isoard et Soria, 2001).
Figure 16 : Courbes d’apprentissage, diverses sources d’énergie électrique
Source : Junginger, M., W. v. Sark, et al. (2010).
Coût unitaire
moyen
q q* échelle optimale de production
Rendements d’échelle
Effets d’apprentissage
35
Une technologie n’est pas prédisposée, par nature en quelque sorte, a faire l’objet d’une production
avec rendements d’échelle. C’est le procédé de production qui fait l’objet d’un effet d’échelle, et non
le produit final. L’exploitation d’effets d’échelle est survenue dans le cas du photovoltaïque par
l’entremise d’automates, semi-automates, et lignes de production modulaires décuplant les
rendements. La « routinisation » de certaines activités de production et d’assemblages grâce à des
équipements pour l’essentiel allemands a permis aux producteurs chinois de produire à grande
échelle des modules et panneaux en bénéficiant de coûts unitaires décroissants - une fois pris en
compte le coût fixe de l’investissement dans l’équipement (Dunford, Kyoung Hoon Lee, Liu Weidong,
Yeung, 2012).
L’automation a des conséquences économiques indubitables – mais aussi juridique. L’automation, la
production modulaire, transforme un bien différencié, ou différenciable, en une commodité. Un des
profonds malentendus autour de l’afflux de panneaux solaires bon marchés en Europe entre 2009 et
2012 est que certains les tenaient pour des produits « high-tech » dignes d’être produits en Europe
et d’y être défendus, quand d’autres n’en voyaient pas l’opportunité au motif qu’il s’agissait de
commodités pour lesquelles l’Europe ne peut prétendre à une quelconque vocation (Voituriez et Xin
Wang, 2014).
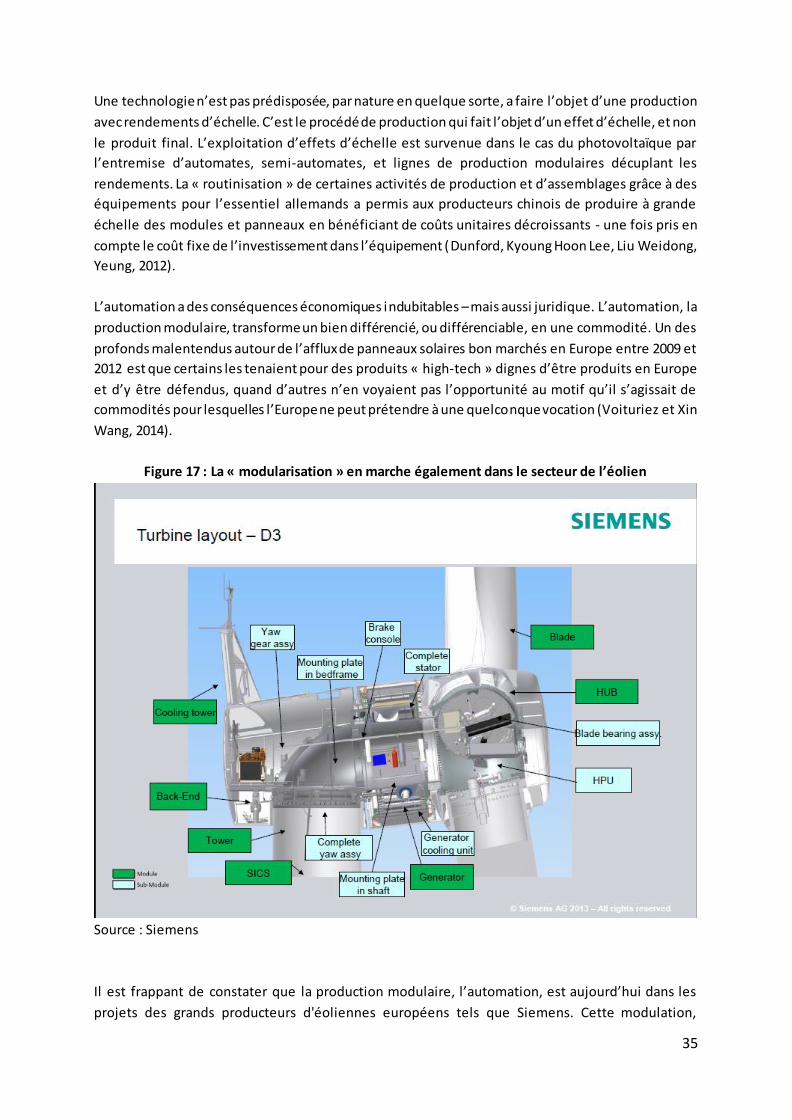
Figure 17 : La « modularisation » en marche également dans le secteur de l’éolien
Source : Siemens
Il est frappant de constater que la production modulaire, l’automation, est aujourd’hui dans les
projets des grands producteurs d'éoliennes européens tels que Siemens. Cette modulation,
36
permettant un éclatement de la chaîne de valeur, n’est pas subie : elle est recherchée, car source de
réduction des coûts dans la mesure où chaque module peut être transporté e nsuite par conteneur
pour un prix dérisoire à travers le monde.
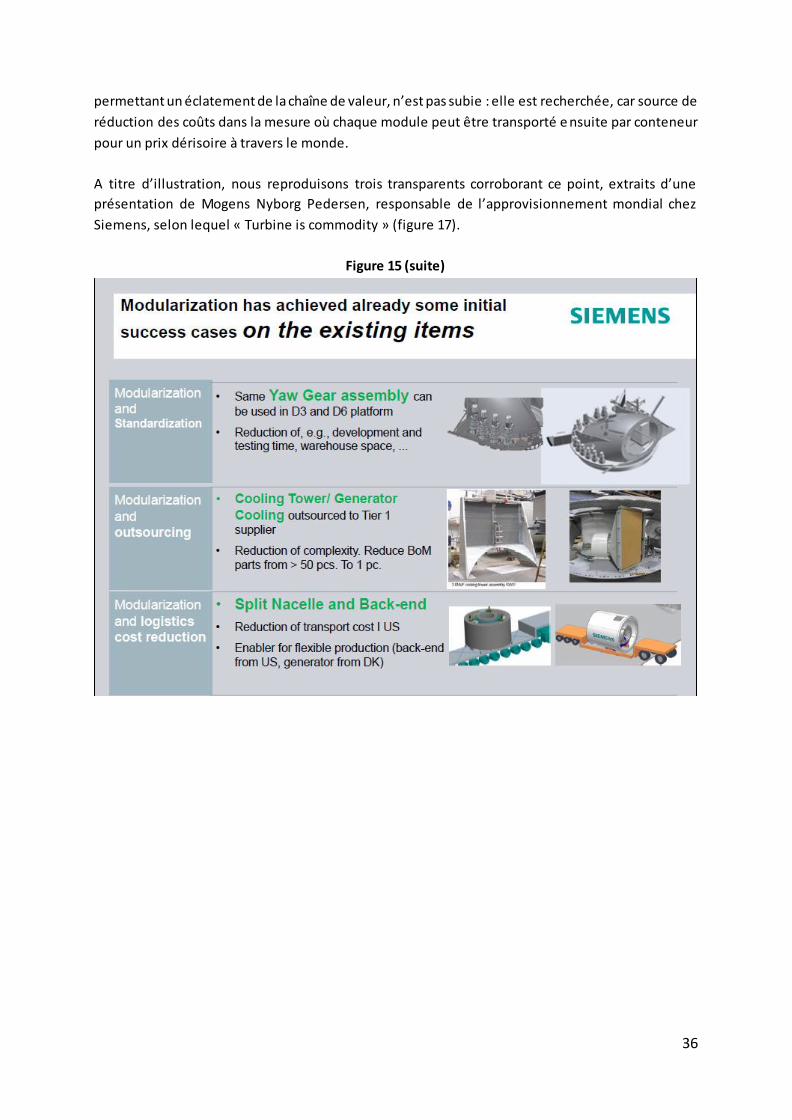
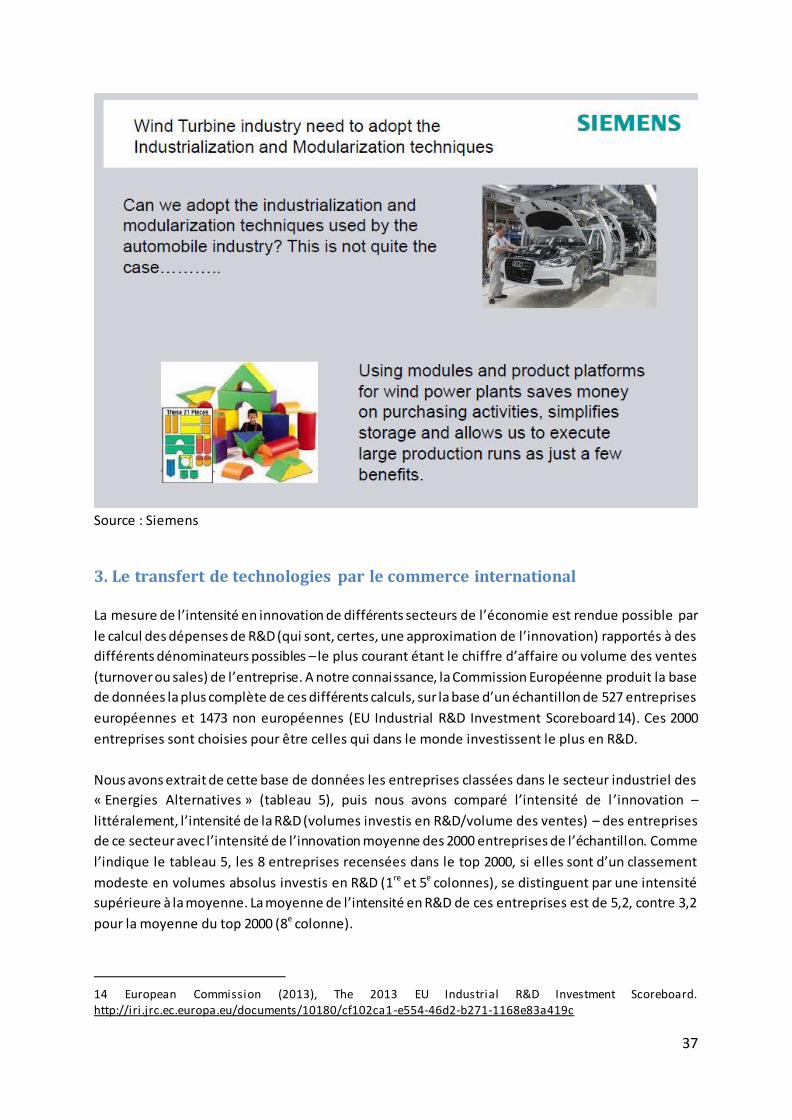
A titre d’illustration, nous reproduisons trois transparents corroborant ce point, extraits d’une
présentation de Mogens Nyborg Pedersen, responsable de l’approvisionnement mondial chez
Siemens, selon lequel « Turbine is commodity » (figure 17).
Figure 15 (suite)
37
Source : Siemens
3. Le transfert de technologies par le commerce international
La mesure de l’intensité en innovation de différents secteurs de l’économie est rendue possible par
le calcul des dépenses de R&D (qui sont, certes, une approximation de l’innovation) rapportés à des
différents dénominateurs possibles – le plus courant étant le chiffre d’affaire ou volume des ventes
(turnover ou sales) de l’entreprise. A notre connaissance, la Commission Européenne produit la base
de données la plus complète de ces différents calculs, sur la base d’un échantillon de 527 entreprises
européennes et 1473 non européennes (EU Industrial R&D Investment Scoreboard 14). Ces 2000
entreprises sont choisies pour être celles qui dans le monde investissent le plus en R&D.
Nous avons extrait de cette base de données les entreprises classées dans le secteur industriel des
« Energies Alternatives » (tableau 5), puis nous avons comparé l’intensité de l ’innovation –
littéralement, l’intensité de la R&D (volumes investis en R&D/volume des ventes) – des entreprises
de ce secteur avec l’intensité de l’innovation moyenne des 2000 entreprises de l’échantillon. Comme
l’indique le tableau 5, les 8 entreprises recensées dans le top 2000, si elles sont d’un classement
modeste en volumes absolus investis en R&D (1re et 5e colonnes), se distinguent par une intensité
supérieure à la moyenne. La moyenne de l’intensité en R&D de ces entreprises est de 5,2, contre 3,2
pour la moyenne du top 2000 (8e colonne).
14 European Commission (2013), The 2013 EU Industrial R&D Investment Scoreboard. http://iri.jrc.ec.europa.eu/documents/10180/cf102ca1-e554-46d2-b271-1168e83a419c

38
A l’intérieur de ce groupe d’entreprises « vertes » innovant, les écarts d’intensité sont considérables,
l’intensité variant dans un rapport de 1 à 3. Les mesures d’intensité collectées auprès de 5
entreprises photovoltaïques par De La Tour, Glachant et Ménière (2010) confirment le niveau élevé
de l’intensité (Schott Solar) et sa grande dispersion – les entreprises chinoises enquêtées, en
particulier, accusant un niveau d’intensité très en-deçà de la moyenne de 5 que nous avons estimée
sur la base des données du Scoreboard de la Commission Européenne (tableau 6).
Tableau 5 : Intensité en R&D des entreprises du secteur des énergies alternatives
Source des données: European Commission (2013), The 2013 EU Industrial R&D Investment
Scoreboard. http://iri.jrc.ec.europa.eu/documents/10180/cf102ca1-e554-46d2-b271-1168e83a419c
Tableau 6 : Intensité en R&D de quelques entreprises photovoltaïques
Pays d'origine Intensité R&D (% ventes 2008) Segments
Schott Solar ALL+Etats-Unis 5% Cellules
Q-Cells ALL 2% Cellules
SunPower Etats-Unis 1,70% Cellules+modules
Solar World ALL 1,40% Cellules
Source : Arnaud de la Tour, Matthieu Glachant et Yann Ménière (2010)
Des transferts massifs de technologie ont eu lieu entre les pays de l’OCDE et la Chine grâce au
commerce – l’échange international étant bien plus efficace en la matière que les mécanismes dédiés
de l’UNFCCC (Glachant et Dechezleprêtre, 2015). Le transfert survient essentiellement via les
échanges de biens intermédiaires, l’octroi de licences et le développement joint de technologies
adaptées aux capacités humaines et techniques des marchés émergents (Lewis, 2013). Le tableau 7
compile, à partir des enquêtes conduites par Lewis, les principaux modes de transferts de
technologies (deuxième colonne) utilisées par les principales entreprises chinoises de turbines
éoliennes.
World - 2000 companies ranked by R&D
Industrial sector R&D 2012
R&D 1
year
growth
R&D 3
years
growth
R&D
intensity Sales 2012
world
rank Name Country (ICB-3D) (€million) (%)
(CAGR-
3y, %) (%) (€million)
387 VESTAS WIND SYSTEMS Denmark Alternative Energy 221,0 -47,1 -2,6 3,1 7216,0
694 SMA SOLAR TECHNOLOGY Germany Alternative Energy 103,2 3,3 28,1 7,1 1463,4
714 FIRST SOLAR USA Alternative Energy 100,4 -5,7 17,4 3,9 2553,1
1129 CENTROTHERM PHOTOVOLTAICS Germany Alternative Energy 53,1 -7,7 28,4 7,6 698,5
1295 SOLARWORLD Germany Alternative Energy 43,9 88,9 62,9 7,2 606,0
1514 NORDEX Germany Alternative Energy 35,2 -39,8 7,8 3,3 1075,3
1843 3W POWER LuxembourgAlternative Energy 25,2 56,6 19,9 6,8 368,0
1866 RENEWABLE ENERGY Norway Alternative Energy 24,9 -40,0 -17,8 2,4 1018,4
Totals - world 2000 538763,8 6,2 6,4 3,2 16854415,9
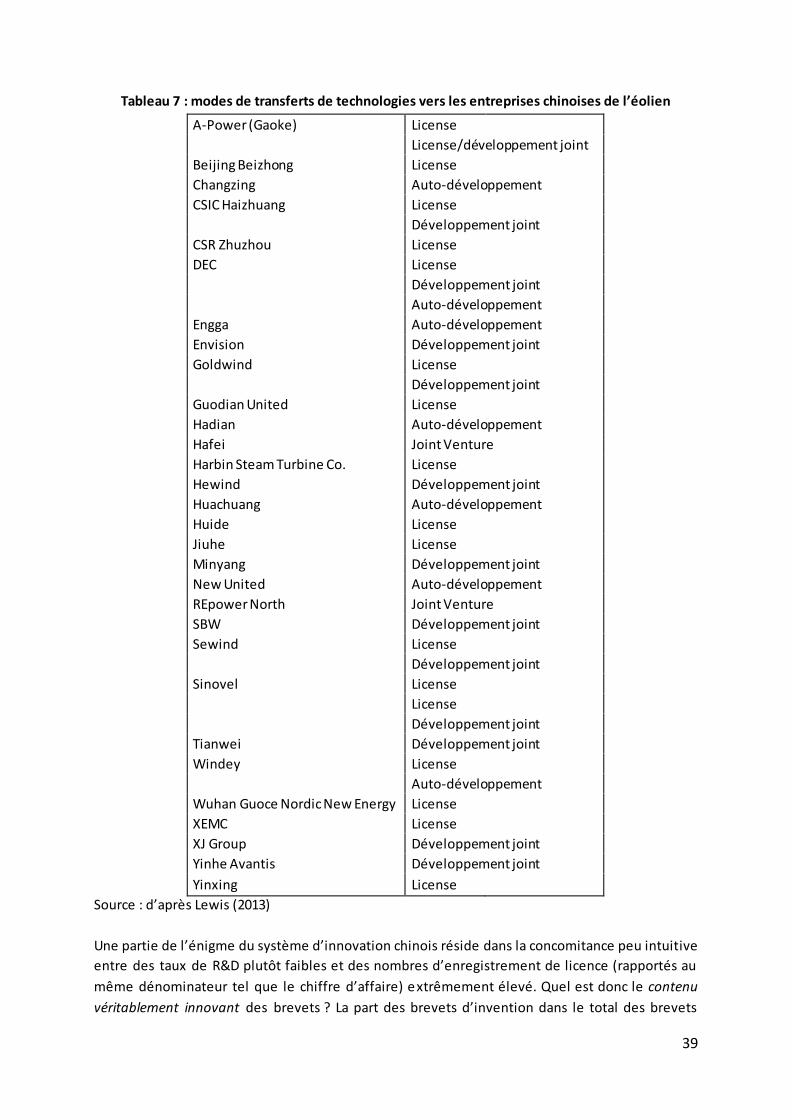
39
Tableau 7 : modes de transferts de technologies vers les entreprises chinoises de l’éolien
A-Power (Gaoke) License
License/développement joint
Beijing Beizhong License
Changzing Auto-développement
CSIC Haizhuang License
Développement joint
CSR Zhuzhou License
DEC License
Développement joint
Auto-développement
Engga Auto-développement
Envision Développement joint
Goldwind License
Développement joint
Guodian United License
Hadian Auto-développement
Hafei Joint Venture
Harbin Steam Turbine Co. License
Hewind Développement joint
Huachuang Auto-développement
Huide License
Jiuhe License
Minyang Développement joint
New United Auto-développement
REpower North Joint Venture
SBW Développement joint
Sewind License
Développement joint
Sinovel License
License
Développement joint
Tianwei Développement joint
Windey License
Auto-développement
Wuhan Guoce Nordic New Energy License
XEMC License
XJ Group Développement joint
Yinhe Avantis Développement joint
Yinxing License
Source : d’après Lewis (2013)
Une partie de l’énigme du système d’innovation chinois réside dans la concomitance peu intuitive
entre des taux de R&D plutôt faibles et des nombres d’enregistrement de licence (rapportés au
même dénominateur tel que le chiffre d’affaire) extrêmement élevé. Quel est donc le contenu
véritablement innovant des brevets ? La part des brevets d’invention dans le total des brevets
40
domestiques oscille entre 25% et 35% - les brevets d’utilité et de design externes sont préférés (Wei
Zhao et Ruet, 2014). La part de brevets également déposés à l’étranger fait également partie des
indicateurs communément utilisés pour en apprécier le caractère véritablement novateur. Seules les
inventions offrant des perspectives lucratives sont déposées à l’étranger – pour d’évidentes raisons
de coût – alors que les inventions mineures sont uniquement brevetées pour le marché intérieur.
Bien entendu, cette méthode d’appréciation est très imparfaite et peut donner lieu à des
controverses, mais elle a le mérite de débroussailler en quelque sorte le terrain. Si l’on en croit
l’analyse des données de PATSTAT effectuée par De La Tour, Glachant et Ménière (2011), seuls 1 %
des brevets chinois sont également déposés à l’étranger, contre une proportion de 15 % pour
l’Allemagne, 7 % pour les États-Unis et 26 % pour le Japon. Pour les auteurs, ce taux « conforte
l’hypothèse selon laquelle la valeur des inventions brevetées par les Chinois est en moyenne assez
faible ». Ils en veulent pour preuve que les entreprises chinoises ne consacrent qu’une faible partie
de leurs recettes à la recherche et au développement (R-D) : de 0,4 à 0,8 %, contre une fourchette de
1,4 à 5 % pour les sociétés occidentales (ibid.). Conclusion, les entreprises chinoises « ont une
propension supérieure à faire breveter leurs inventions que leurs concurrents étrangers – elles
déposent plus de dossiers pour un taux d’innovation équivalent15 ».
Mais, comme le reconnaissent ces auteurs, il serait dangereux d’extrapoler de ce constat que les
entreprises de Chine n’innovent pas. Leur travail sur le terrain et les entretiens qu’ils ont pu mener
en Chine suggèrent que les entreprises chinoises axent davantage leur recherche sur les processus et
que cette recherche n’est en général pas conduite dans des départements dédiés à la R-D mais
directement sur les lignes de production – et qu’ils en préfèrent garder le secret autour des
conclusions plutôt que de les breveter (ibid.).
4. Coordination horizontale et intégration verticale : les leçons du rattrapage chinois
L’histoire du rattrapage technologique chinois en matière de panneaux solaires au silicium est maintenant connue. Des articles lui ont été consacrés, que nos enquêtes ont confirmés (Dunford, Kyoung Hoon Lee, Liu Weidong, Yeung, 2012) – nous en résumons les grandes lignes ici. La Chine a dû surmonter deux “désavantages compétitifs” pour pénétrer le marché international du solaire au silicium (Hobday, 1995). Elle a dû d’abord satisfaire les normes techniques (certifications TÜV and IEC notamment), satisfaire aux exigences européennes de garantie des produits sur 25 ans et établir une réputation de crédibilité pour des produits bon marché. Les industriels chinois ont pour cela importé des équipements et chaînes de montage « clefs en main » depuis l’Allemagne, les Etats-Unis et le Japon, et étendu leur savoir-faire par l’apprentissage (learning by doing). Au début des années 2000, les technologies au silicium étaient considérées comme matures et leur production à grande échelle « routinisable » pour créer un affreux anglicisme (Dunford et al., 2012). Un savoir-faire établi dans d’autres chaînes de montage industrielles a permis à ces firmes de sélectionner les
15
De La Tour, Glachant et Ménière (2011) ont effectué des recherches en Chine qui ont effectivement confirmé
que les entreprises locales déposent systématiquement des brevets pour des inventions mineures. Ils ont remarqué, c’est intéressant de le noter, que « le but n’est pas de protéger les inventions – les plus importantes étant en général tenues secrètes – mais d’envoyer un signal aux pouvoirs publics. En effet, les décisions de la
Commission nationale pour le développement et la réforme (NDRC) d’allouer des subventions publiques sont fortement influencées par le nombre de brevets déposés ».
41
meilleurs procédés et équipements de production. Ce rattrapage sur certaines technologies n’est pas incompatible avec un retard sur d’autres – relatives à certains procédés spécifiques de production de silicium, de cellules, de panneaux ou de lignes d’assemblage – pour lesquelles certaines firmes européennes conservent l’ascendant et l’essentiel des parts de marchés. La « green race » est une course au sens propre ; elle doit être saisie dans une perspective dynamique entre firmes en mouvement. Un élément souvent négligé dans les récentes analyses a été le rôle de la demande intérieure dans l’accroissement de l’offre d’équipements complémentaires aux chaînes de montage, ou substituables à celles-ci. Un écosystème industriel construit sur la coopération entre assembleurs de panneaux et équipementiers locaux s’est développé à partir de 2005, soutenu par la disponibilité d’actifs propres à la Chine : machine outils, semi-conducteurs, capital humain acquis après la première génération de compagnies chinoise du solaire. En 2009, les équipementiers chinois détenaient 50% des parts du marché chinois de l’équipement solaire (Dunford et al., 2012). L’acquisition de capacités technologiques s’est développée, outre par l’importation de chaînes clefs en main, par des activités de fusion et acquisition de firmes étrangères ; ainsi de Suntech absorbant MSK Corporation (assembleur de modules, Japon), et KSL‐Kuttler (spécialisé dans la production d’automates de montage pour la production de circuits imprimés, Allemagne) en 2008. Enfin le capital humain – non limité aux techniciens intervenant sur les chaînes de montage et incluant des scientifiques et ingénieurs ayant étudié les technologies du solaire dans des grands centres à l’étranger tels que l’Université de Galles du Sud (Nobel Laureate Prof Martin A Green’s centre in the University of New South Wales) a joué un rôle considérable dans le rattrapage chinois). Dans une enquête conduite auprès de firmes chinoises du photovoltaïque au silicium, Dunford et al. soulignent que la quasi-totalité des entreprises chinoises (à l’exception de JA Solar) ont adopté des stratégies d’intégration verticale amont afin de sécuriser l’approvisionnement en matières premières et réduire les coûts de transaction. Yingli, Trina Solar, et Solarfun ont démarré leur activité comme assembleurs de modules, en raison de la relative simplicité technologique de ce maillon de la filière, avant d’intégrer l’amont des filières (lingot, cellule). Une fois le retard technologique comblé, les entreprises chinoises ont pu s’appuyer sur leur avantage -coût et vendre leurs panneaux à un prix environ un tiers moins cher que celui de leurs concurrents occidentaux. Les coûts salariaux, dans les activités amont intensives en main d’œuvre (soudure et déploiement des cellules en particulier), ont contribué à cet écart de prix. Les salaires industriels moyens étaient de 26,599 RMB/year (environ 3900 USD) in 2009 (NBSC, 2010). A Jiangsu en 2009 le salaire moyen des ouvriers du solaire se situaient entre 146$ and 220 $ (Lee, 2010). Il en va de même des cadres techniques et des ingénieurs. Un ingénieur sénior travaillant pour Suntech par exemple dans une usine du Yunnan recevait un salaire mensuel d’environ 2000 RMB (environ 300$ USD ) dans les années 1990s. Le premier salaire moyen d’un des 300000 ingénieurs et techniciens diplômés en master d’une université chinoise chaque année touchait dans le PV aux alentours de 3,000 RMB (environ $430) à la fin des années 2000. Des salaires peu élevés (au regard de la productivité du travail élevés grâce aux équipements et chaînes de montage importés) ont renforcé l’avantage de la Chine sur la production de panneaux au silicium à grande échelle. Ajoutons qu’à l’identique de ce qui s’est passé en Allemagne, la collaboration entre entreprises du solaire silicium, universités locales et instituts nationaux de recherche tels que la Shanghai Jiatong University, Sun Yat‐sen University, et l’Académique des sciences chinoise ont facilité de le développement d’innovations à faible coût. Ce point est important ; il est confirmé par nos entretiens et énonce très simplement le fait que le rattrapage n’est pas exempt d’innovation. D’anciens cadres de Suntech par exemple insistant sur les dépenses engagées en R&D pour améliorer la rentabilité électrique des panneaux et accroître les signes de qualité. L’accès à un crédit bon marché, la jouissance presque gracieuse de terrains et d’infrastructure consentie par les gouvernements locaux ont été les autres déterminants du succès chinois dans la
42
production et l’exportation de modules intégrés. Wang (2010) estime que les coûts d’installation d’une ligne de production de 25 MWp combinant équipement local et importé se situaient à environ la moitié du coût supporté par les entreprises étrangères dans les années 2000. Dans les premiers développements de l’industrie solaire chinoise après 2000, le soutien des gouverneurs des villes (shi) et la fourniture de garanties publiques pour les emprunts commerciaux et le financement direct par des entreprises publiques (Park, 2009) ont permis la production de masse et la conquête des marchés extérieurs à mesure que s’infléchissait la courbe d’apprentissage. Les producteurs européens n’ont pu résister à une concurrence par les prix dans les segments de la filière où les barrières technologiques étaient les plus faibles et les rendements d’échelle croissants – tel est le cas de la production de cellule au silicium et de modules (figure 18). Les activités à barrière technologique plus élevée (silicium, et dans une moindre mesure équipements et chaînes de montage) ont conservé leur avantage comparatif après le rattrapage technologique chinois sur les activités d’assemblage et l’intégration de la filière amont (figure 19). Ce constat soulève la question pour l’Europe, en matière de panneaux solaires comme d’éolienne, d’accroître et coordonner la demande intérieure afin de créer les conditions de production à moindre coûts de technologie dont la production repose sur des rendements d’échelle croissants.
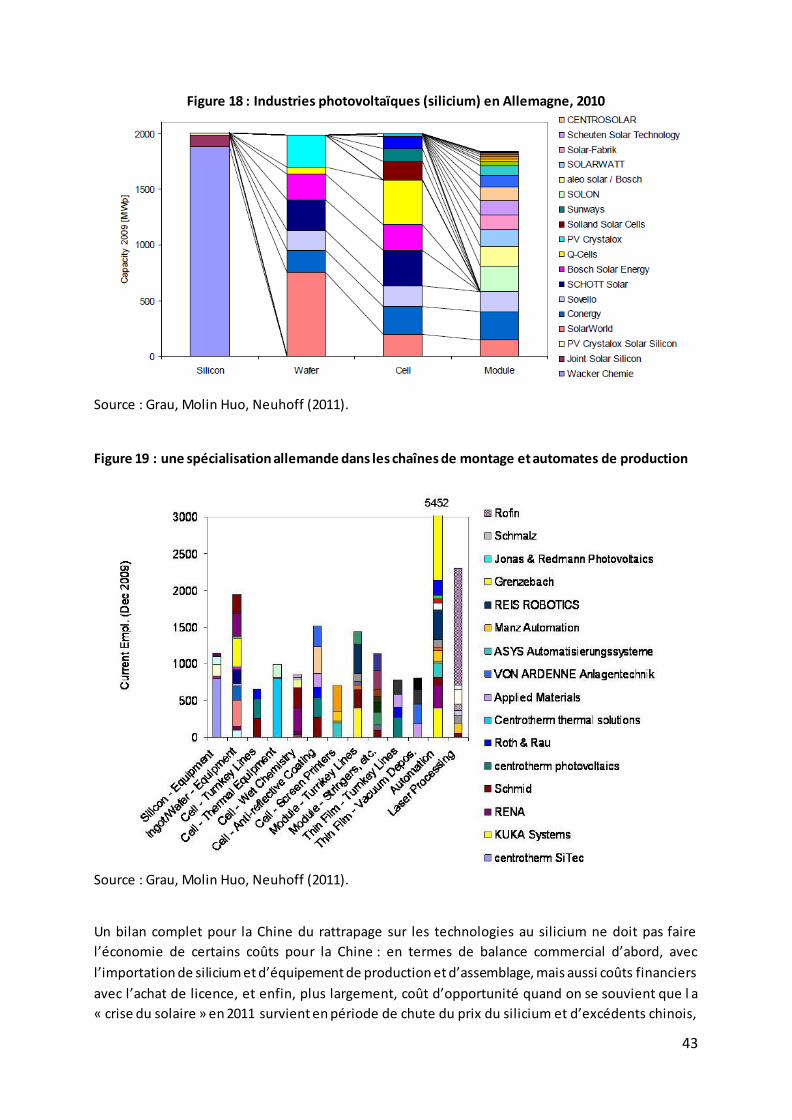
43
Figure 18 : Industries photovoltaïques (silicium) en Allemagne, 2010
Source : Grau, Molin Huo, Neuhoff (2011). Figure 19 : une spécialisation allemande dans les chaînes de montage et automates de production
Source : Grau, Molin Huo, Neuhoff (2011).
Un bilan complet pour la Chine du rattrapage sur les technologies au silicium ne doit pas faire
l’économie de certains coûts pour la Chine : en termes de balance commercial d’abord, avec
l’importation de silicium et d’équipement de production et d’assemblage, mais aussi coûts financiers
avec l’achat de licence, et enfin, plus largement, coût d’opportunité quand on se souvient que l a
« crise du solaire » en 2011 survient en période de chute du prix du silicium et d’excédents chinois,
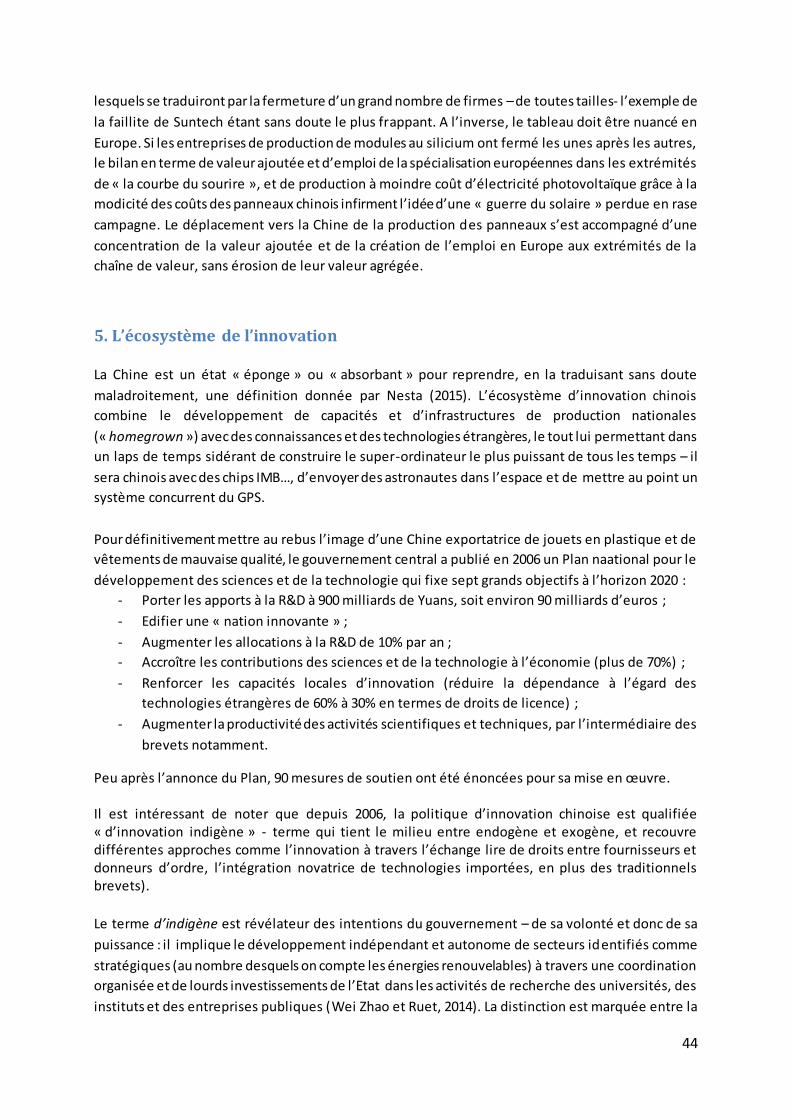
44
lesquels se traduiront par la fermeture d’un grand nombre de firmes – de toutes tailles- l’exemple de
la faillite de Suntech étant sans doute le plus frappant. A l’inverse, le tableau doit être nuancé en
Europe. Si les entreprises de production de modules au silicium ont fermé les unes après les autres,
le bilan en terme de valeur ajoutée et d’emploi de la spécialisation européennes dans les extrémités
de « la courbe du sourire », et de production à moindre coût d’électricité photovoltaïque grâce à la
modicité des coûts des panneaux chinois infirment l’idée d’une « guerre du solaire » perdue en rase
campagne. Le déplacement vers la Chine de la production des panneaux s’est accompagné d’une
concentration de la valeur ajoutée et de la création de l’emploi en Europe aux extrémités de la
chaîne de valeur, sans érosion de leur valeur agrégée.
5. L’écosystème de l’innovation
La Chine est un état « éponge » ou « absorbant » pour reprendre, en la traduisant sans doute
maladroitement, une définition donnée par Nesta (2015). L’écosystème d’innovation chinois
combine le développement de capacités et d’infrastructures de production nationales
(« homegrown ») avec des connaissances et des technologies étrangères, le tout lui permettant dans
un laps de temps sidérant de construire le super-ordinateur le plus puissant de tous les temps – il
sera chinois avec des chips IMB…, d’envoyer des astronautes dans l’espace et de mettre au point un
système concurrent du GPS.
Pour définitivement mettre au rebus l’image d’une Chine exportatrice de jouets en plastique et de
vêtements de mauvaise qualité, le gouvernement central a publié en 2006 un Plan naational pour le
développement des sciences et de la technologie qui fixe sept grands objectifs à l’horizon 2020 :
- Porter les apports à la R&D à 900 milliards de Yuans, soit environ 90 milliards d’euros ;
- Edifier une « nation innovante » ;
- Augmenter les allocations à la R&D de 10% par an ;
- Accroître les contributions des sciences et de la technologie à l’économie (plus de 70%) ;
- Renforcer les capacités locales d’innovation (réduire la dépendance à l’égard des
technologies étrangères de 60% à 30% en termes de droits de licence) ;
- Augmenter la productivité des activités scientifiques et techniques, par l’intermédiaire des
brevets notamment.
Peu après l’annonce du Plan, 90 mesures de soutien ont été énoncées pour sa mise en œuvre. Il est intéressant de noter que depuis 2006, la politique d’innovation chinoise est qualifiée « d’innovation indigène » - terme qui tient le milieu entre endogène et exogène, et recouvre différentes approches comme l’innovation à travers l’échange lire de droits entre fournisseurs et donneurs d’ordre, l’intégration novatrice de technologies importées, en plus des traditionnels brevets).
Le terme d’indigène est révélateur des intentions du gouvernement – de sa volonté et donc de sa
puissance : il implique le développement indépendant et autonome de secteurs identifiés comme
stratégiques (au nombre desquels on compte les énergies renouvelables) à travers une coordination
organisée et de lourds investissements de l’Etat dans les activités de recherche des universités, des
instituts et des entreprises publiques (Wei Zhao et Ruet, 2014). La distinction est marquée entre la
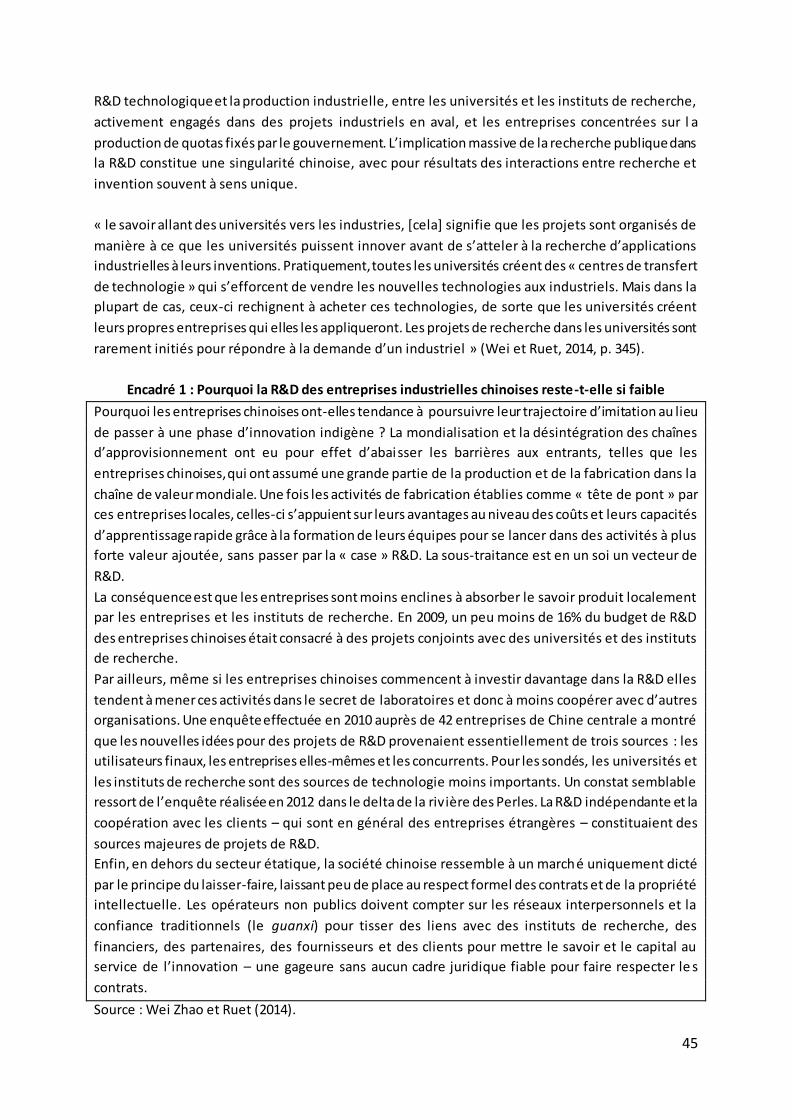
45
R&D technologique et la production industrielle, entre les universités et les instituts de recherche,
activement engagés dans des projets industriels en aval, et les entreprises concentrées sur l a
production de quotas fixés par le gouvernement. L’implication massive de la recherche publique dans
la R&D constitue une singularité chinoise, avec pour résultats des interactions entre recherche et
invention souvent à sens unique.
« le savoir allant des universités vers les industries, [cela] signifie que les projets sont organisés de
manière à ce que les universités puissent innover avant de s’atteler à la recherche d’applications
industrielles à leurs inventions. Pratiquement, toutes les universités créent des « centres de transfert
de technologie » qui s’efforcent de vendre les nouvelles technologies aux industriels. Mais dans la
plupart de cas, ceux-ci rechignent à acheter ces technologies, de sorte que les universités créent
leurs propres entreprises qui elles les appliqueront. Les projets de recherche dans les universités sont
rarement initiés pour répondre à la demande d’un industriel » (Wei et Ruet, 2014, p. 345).
Encadré 1 : Pourquoi la R&D des entreprises industrielles chinoises reste-t-elle si faible
Pourquoi les entreprises chinoises ont-elles tendance à poursuivre leur trajectoire d’imitation au lieu
de passer à une phase d’innovation indigène ? La mondialisation et la désintégration des chaînes
d’approvisionnement ont eu pour effet d’abaisser les barrières aux entrants, telles que les
entreprises chinoises, qui ont assumé une grande partie de la production et de la fabrication dans la
chaîne de valeur mondiale. Une fois les activités de fabrication établies comme « tête de pont » par
ces entreprises locales, celles-ci s’appuient sur leurs avantages au niveau des coûts et leurs capacités
d’apprentissage rapide grâce à la formation de leurs équipes pour se lancer dans des activités à plus
forte valeur ajoutée, sans passer par la « case » R&D. La sous-traitance est en un soi un vecteur de
R&D.
La conséquence est que les entreprises sont moins enclines à absorber le savoir produit localement
par les entreprises et les instituts de recherche. En 2009, un peu moins de 16% du budget de R&D
des entreprises chinoises était consacré à des projets conjoints avec des universités et des instituts
de recherche.
Par ailleurs, même si les entreprises chinoises commencent à investir davantage dans la R&D elles
tendent à mener ces activités dans le secret de laboratoires et donc à moins coopérer avec d’autres
organisations. Une enquête effectuée en 2010 auprès de 42 entreprises de Chine centrale a montré
que les nouvelles idées pour des projets de R&D provenaient essentiellement de trois sources : les
utilisateurs finaux, les entreprises elles-mêmes et les concurrents. Pour les sondés, les universités et
les instituts de recherche sont des sources de technologie moins importants. Un constat semblable
ressort de l’enquête réalisée en 2012 dans le delta de la riv ière des Perles. La R&D indépendante et la
coopération avec les clients – qui sont en général des entreprises étrangères – constituaient des
sources majeures de projets de R&D.
Enfin, en dehors du secteur étatique, la société chinoise ressemble à un marché uniquement dicté
par le principe du laisser-faire, laissant peu de place au respect formel des contrats et de la propriété
intellectuelle. Les opérateurs non publics doivent compter sur les réseaux interpersonnels et la
confiance traditionnels (le guanxi) pour tisser des liens avec des instituts de recherche, des
financiers, des partenaires, des fournisseurs et des clients pour mettre le savoir et le capital au
service de l’innovation – une gageure sans aucun cadre juridique fiable pour faire respecter le s
contrats.
Source : Wei Zhao et Ruet (2014).
46
Le mystère de l’inflation des brevets de dissipe lorsque l’on sait que ceux -ci émanent d’abord des
universités (encadré 1). Qu’en est-il du faible niveau de R&D ?
Remontons dans le temps. Des années 1950 aux années 1970, la Chine se livre à la rétro-ingénierie
ou « ingénierie inverse » pour acquérir de nouvelles technologies (il s’agit de démonter un objet ou
équipement, en comprendre le mécanisme, et concevoir un identique sans utiliser ni copier
l’original). Les entreprises concernées étant détenues par l’Etat, l’incitation à investir dans la R&D est
faible – faiblesse qui persiste jusqu’à l’annonce du plan de 2006, le recours aux importations et aux
licences restant privilégié. Le commerce plutôt que la R&D.
Depuis 2006 cependant la R&D est en hausse maquée dans certains secteurs – ainsi de l’électronique
et des technologies de l’information, où la part du chiffre d’affaires des grands leaders dédiée à la
R&D peut osciller entre 3 et 10%. Néanmoins en moyenne nationale, les entreprises industrielles,
grandes ou petites, consacrent moins de 1% à la R&D. Le commerce international reste meilleur
marché. De surcroît, au sein de la R&D, la part des dépenses de recherche fondamentale et
appliquée est faible. Elle était de 32% en 1995 et a été divisée par 2 (Global Innovation Index, 2015).
« Les entreprises chinoises sont bloquées à mi-chemin entre l’innovation et l’imitation » selon
l’analyse de Wei Zhao et Ruet (2014). Une enquête réalisée en 2012 dans le delta de la rivière des
Perles (Province de Guangdong) auprès de 1201 entreprises industrielles révélait que 44% d’entre
elles s’étaient lancées dans des activités de R&D après 2008 en réaction à la crise, mais que même à
cette époque, 55% affirmaient continuer à imiter en partie les technologies étrangères (Qui, Zhao et
al., 2012). Une illustration de de la « dépense de sentier » en matière de rétro-ingénierie.
Au cours des sept dernières années, la Chine a fait en sorte par sa politique « d’innovation indigène »
même balbutiante (encadré 1) de disposer de technologies de production lui permettant de
développer une industrie solaire PV hautement performante, en acquérant des lignes de production
clé en mains en Allemagne, aux États-Unis et au Japon et, selon De La Tour, Glachant et Ménière
(2011), en recrutant au sein de la diaspora chinoise des cadres qualifiés qui avaient fait partie de
l’aventure du PV à ses débuts. De sorte que le pays est désormais en mesure de fabriquer ses propres
équipements de production – un secteur où les entreprises américaines et allemandes jouissaient
naguère d’un avantage comparatif incontestable (Glachant et al., 2013). Le même phénomène
s’observe en matière de turbines éoliennes, la production étrangère en Chine passant de prè s de
80% à 10% en tout juste six ans (figure 20) grâce à un avantage-coût renforcé au fil du temps (figure
21).
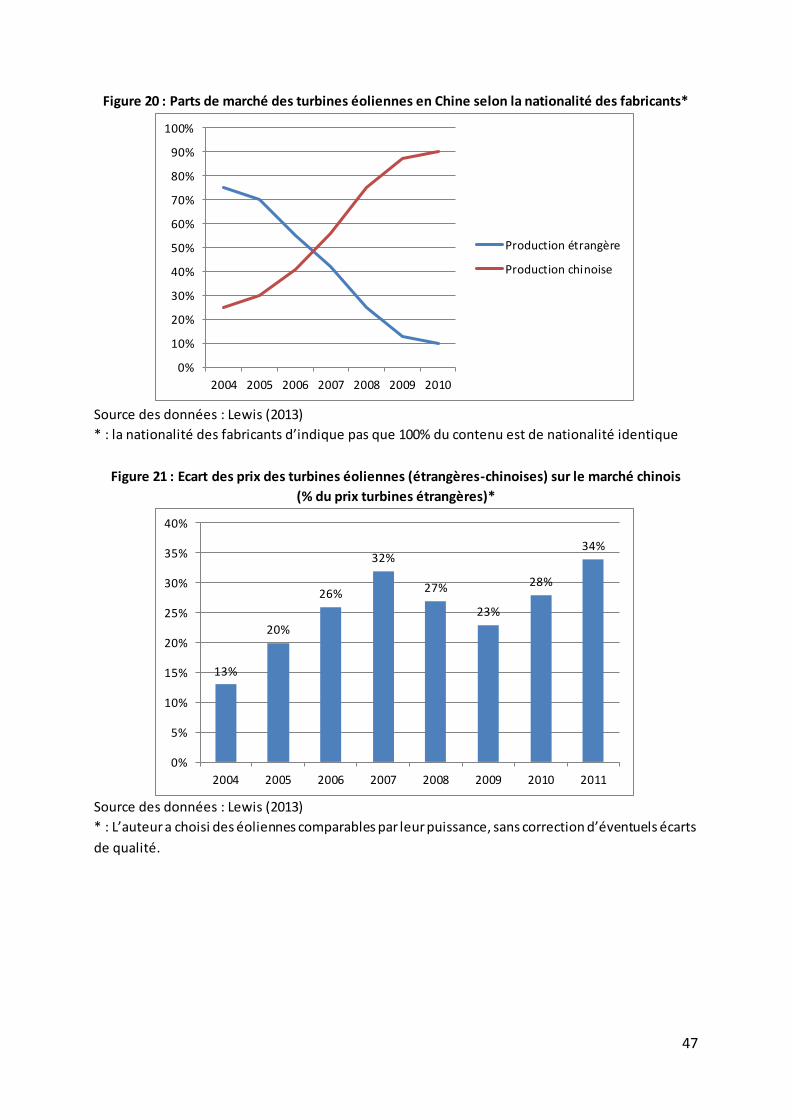
47
Figure 20 : Parts de marché des turbines éoliennes en Chine selon la nationalité des fabricants*
Source des données : Lewis (2013)
* : la nationalité des fabricants d’indique pas que 100% du contenu est de nationalité identique
Figure 21 : Ecart des prix des turbines éoliennes (étrangères-chinoises) sur le marché chinois
(% du prix turbines étrangères)*
Source des données : Lewis (2013)
* : L’auteur a choisi des éoliennes comparables par leur puissance, sans correction d’éventuels écarts
de qualité.
0%
10%
20%
30%
40%
50%
60%
70%
80%
90%
100%
2004 2005 2006 2007 2008 2009 2010
Production étrangère
Production chinoise
13%
20%
26%
32%
27%
23%
28%
34%
0%
5%
10%
15%
20%
25%
30%
35%
40%
2004 2005 2006 2007 2008 2009 2010 2011
48
Chapitre 3
A qui profite la « green race »?
Est-on capable de dire aujourd’hui si la course aux technologies vertes est un jeu à somme positive,
tel que l’esquisse la « courbe du sourire » que nous avons présentée dans le premier chapitre (figure
6), ou s’il est au contraire un jeu gagnant-perdant ou perdant-gagnant, confirmant alors les réserves
de Samuelson, présentées dans l’introduction (encadré 1) ? Nous rassemblons dans ce chapitre des
éléments de réponse à cette question. Les chapitres précédents nous ont montré que si la courbe du
sourire s’observe dans les cas de l’éolien et du photovoltaique, l’é cosystème de l’innovation chinois
permet aux firmes chinoises de remonter, par apprentissage avec leurs clients, et dans une moindre
mesure par investissement dans la R&D, de remonter les filières, et profitant d’un avantage coût, de
se placer progressivement en concurrents des firmes européens spécialisées dans les extrémités du
sourire.
Nous nous plaçons ici dans une perspective délibérément européenne, et nous demandons, aux
regards des attentes exprimées à l’égard des énergies renouvelables, si la stratégie européenne de
cours en tête et ses modalités sont conformes ou non à celles-ci. Rappelons ici que l’alternative pour
la France et l’Europe, sur laquelle nous nous penchons, n’est pas de choisir entre « leader » et
« suiveur ». Il ne ferait aucun sens pour l’Europe de regarder la Chine prendre le leadership en
matière d’innovation et de se spécialiser dans l’assemblage ou l’imitation. L’alternative réside dans
les modalités de la course en tête, et des choix d’instruments de politique publique mobilis és dans
l’accomplissement de celle-ci.
Nous retenons trois critères d’évaluation des performances de la France et de l’Europe en matière de
course aux technologies bas carbone, circonscrite aux filières photovoltaïque et éolienne. La
contribution à l’atténuation du changement climatique, l’effet richesse (gains de croissance), et les
effets sur l’emploi des instruments de la puissance mobilisés par la Chine et l’UE. Notre estimation
est qualitative : elle repose sur des données existantes et des entretiens et n’est pas passée par le
filtre de l’économétrie ou d’une quelconque évaluation quantitative. Elle vise à confirmer des
intuitions et lancer le débat sur la pertinence et les meilleurs moyens d’atteindre trois objectifs de
nature différents.
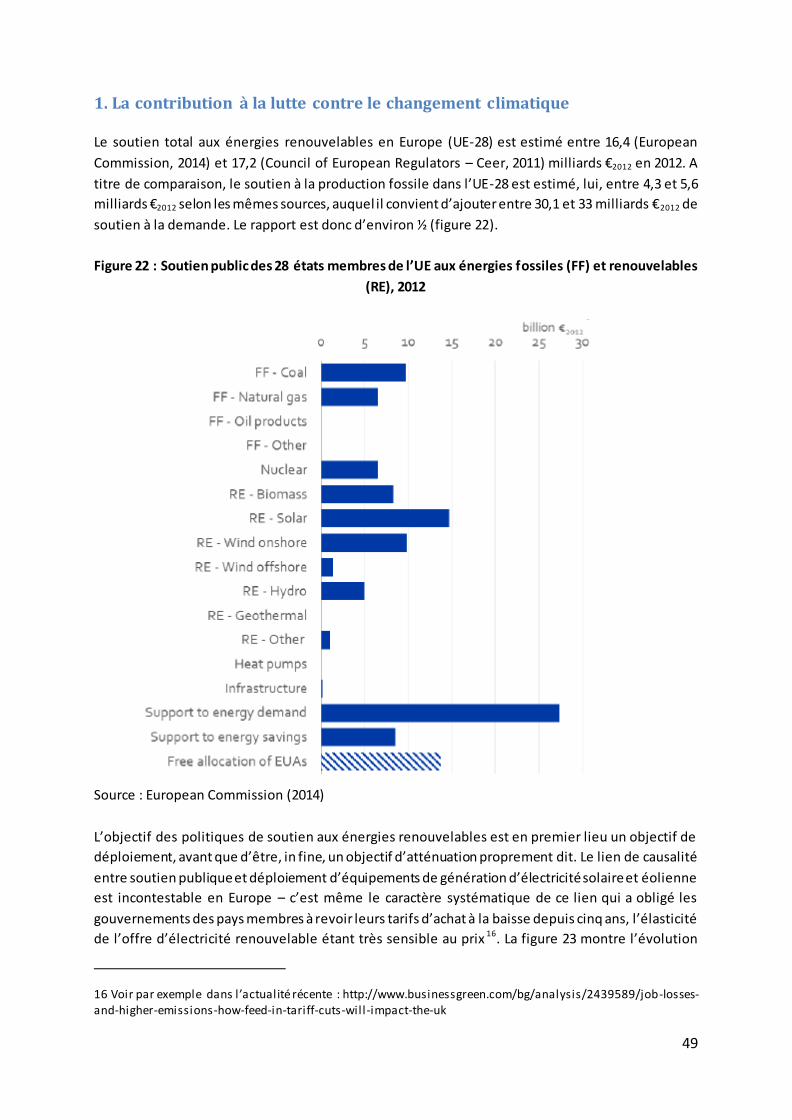
49
1. La contribution à la lutte contre le changement climatique
Le soutien total aux énergies renouvelables en Europe (UE-28) est estimé entre 16,4 (European
Commission, 2014) et 17,2 (Council of European Regulators – Ceer, 2011) milliards €2012 en 2012. A
titre de comparaison, le soutien à la production fossile dans l’UE-28 est estimé, lui, entre 4,3 et 5,6
milliards €2012 selon les mêmes sources, auquel il convient d’ajouter entre 30,1 et 33 milliards €2012 de
soutien à la demande. Le rapport est donc d’environ ½ (figure 22).
Figure 22 : Soutien public des 28 états membres de l’UE aux énergies fossiles (FF) et renouvelables
(RE), 2012
Source : European Commission (2014)
L’objectif des politiques de soutien aux énergies renouvelables est en premier lieu un objectif de
déploiement, avant que d’être, in fine, un objectif d’atténuation proprement dit. Le lien de causalité
entre soutien publique et déploiement d’équipements de génération d’électricité solaire et éolienne
est incontestable en Europe – c’est même le caractère systématique de ce lien qui a obligé les
gouvernements des pays membres à revoir leurs tarifs d’achat à la baisse depuis cinq ans, l’élasticité
de l’offre d’électricité renouvelable étant très sensible au prix 16. La figure 23 montre l’évolution
16 Voir par exemple dans l’actualité récente : http://www.businessgreen.com/bg/analysis/2439589/job-losses-and-higher-emissions-how-feed-in-tariff-cuts-will-impact-the-uk
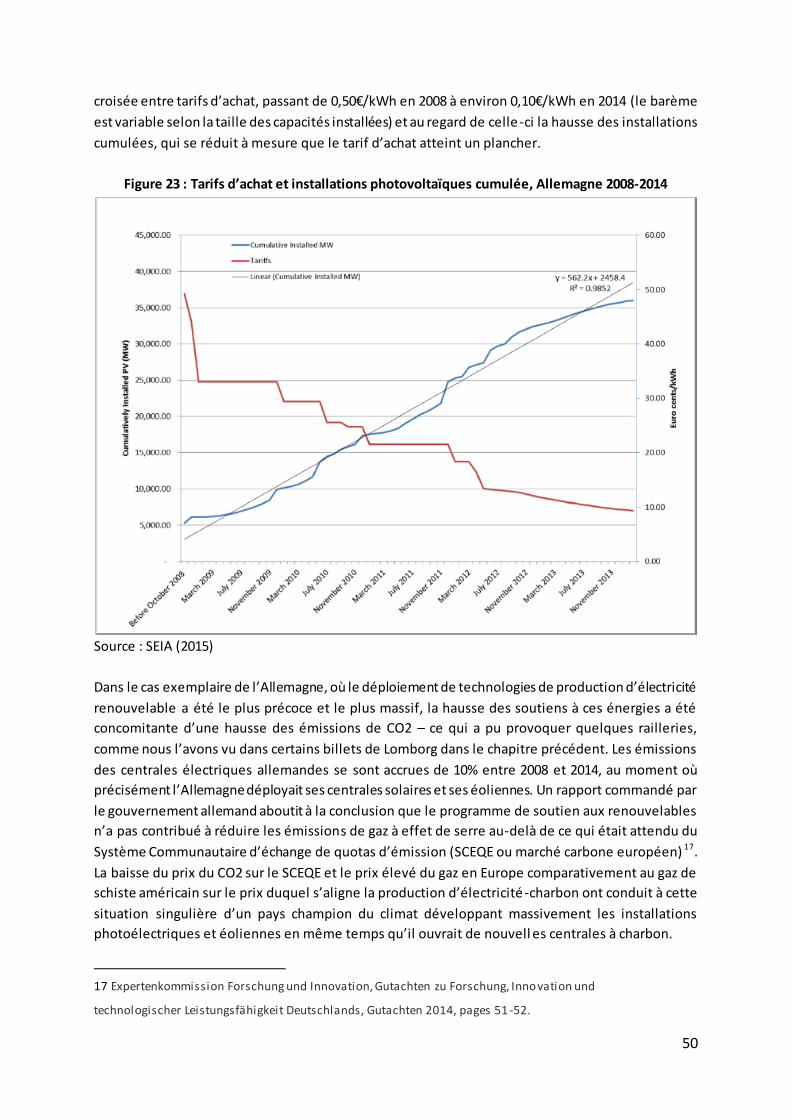
50
croisée entre tarifs d’achat, passant de 0,50€/kWh en 2008 à environ 0,10€/kWh en 2014 (le barème
est variable selon la taille des capacités installées) et au regard de celle -ci la hausse des installations
cumulées, qui se réduit à mesure que le tarif d’achat atteint un plancher.
Figure 23 : Tarifs d’achat et installations photovoltaïques cumulée, Allemagne 2008-2014
Source : SEIA (2015)
Dans le cas exemplaire de l’Allemagne, où le déploiement de technologies de production d’électricité
renouvelable a été le plus précoce et le plus massif, la hausse des soutiens à ces énergies a été
concomitante d’une hausse des émissions de CO2 – ce qui a pu provoquer quelques railleries,
comme nous l’avons vu dans certains billets de Lomborg dans le chapitre précédent. Les émissions
des centrales électriques allemandes se sont accrues de 10% entre 2008 et 2014, au moment où
précisément l’Allemagne déployait ses centrales solaires et ses éoliennes. Un rapport commandé par
le gouvernement allemand aboutit à la conclusion que le programme de soutien aux renouvelables
n’a pas contribué à réduire les émissions de gaz à effet de serre au-delà de ce qui était attendu du
Système Communautaire d’échange de quotas d’émission (SCEQE ou marché carbone européen) 17.
La baisse du prix du CO2 sur le SCEQE et le prix élevé du gaz en Europe comparativement au gaz de
schiste américain sur le prix duquel s’aligne la production d’électricité -charbon ont conduit à cette
situation singulière d’un pays champion du climat développant massivement les installations
photoélectriques et éoliennes en même temps qu’il ouvrait de nouvell es centrales à charbon.
17 Expertenkommission Forschung und Innovation, Gutachten zu Forschung, Innovation und
technologischer Leistungsfähigkeit Deutschlands, Gutachten 2014, pages 51 -52.
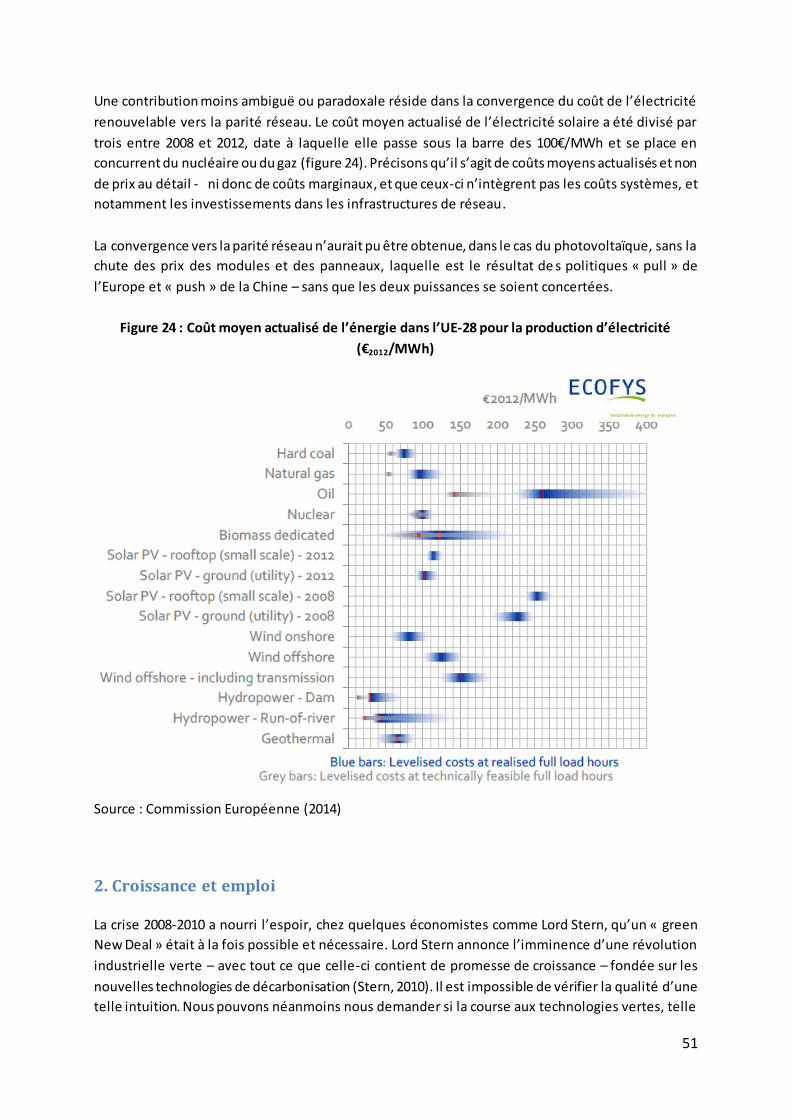
51
Une contribution moins ambiguë ou paradoxale réside dans la convergence du coût de l’électricité
renouvelable vers la parité réseau. Le coût moyen actualisé de l’électricité solaire a été divisé par
trois entre 2008 et 2012, date à laquelle elle passe sous la barre des 100€/MWh et se place en
concurrent du nucléaire ou du gaz (figure 24). Précisons qu’il s’agit de coûts moyens actualisés et non
de prix au détail - ni donc de coûts marginaux, et que ceux-ci n’intègrent pas les coûts systèmes, et
notamment les investissements dans les infrastructures de réseau.
La convergence vers la parité réseau n’aurait pu être obtenue, dans le cas du photovoltaïque, sans la
chute des prix des modules et des panneaux, laquelle est le résultat de s politiques « pull » de
l’Europe et « push » de la Chine – sans que les deux puissances se soient concertées.
Figure 24 : Coût moyen actualisé de l’énergie dans l’UE-28 pour la production d’électricité
(€2012/MWh)
Source : Commission Européenne (2014)
2. Croissance et emploi
La crise 2008-2010 a nourri l’espoir, chez quelques économistes comme Lord Stern, qu’un « green
New Deal » était à la fois possible et nécessaire. Lord Stern annonce l’imminence d’une révolution
industrielle verte – avec tout ce que celle-ci contient de promesse de croissance – fondée sur les
nouvelles technologies de décarbonisation (Stern, 2010). Il est impossible de vérifier la qualité d’une
telle intuition. Nous pouvons néanmoins nous demander si la course aux technologies vertes, telle
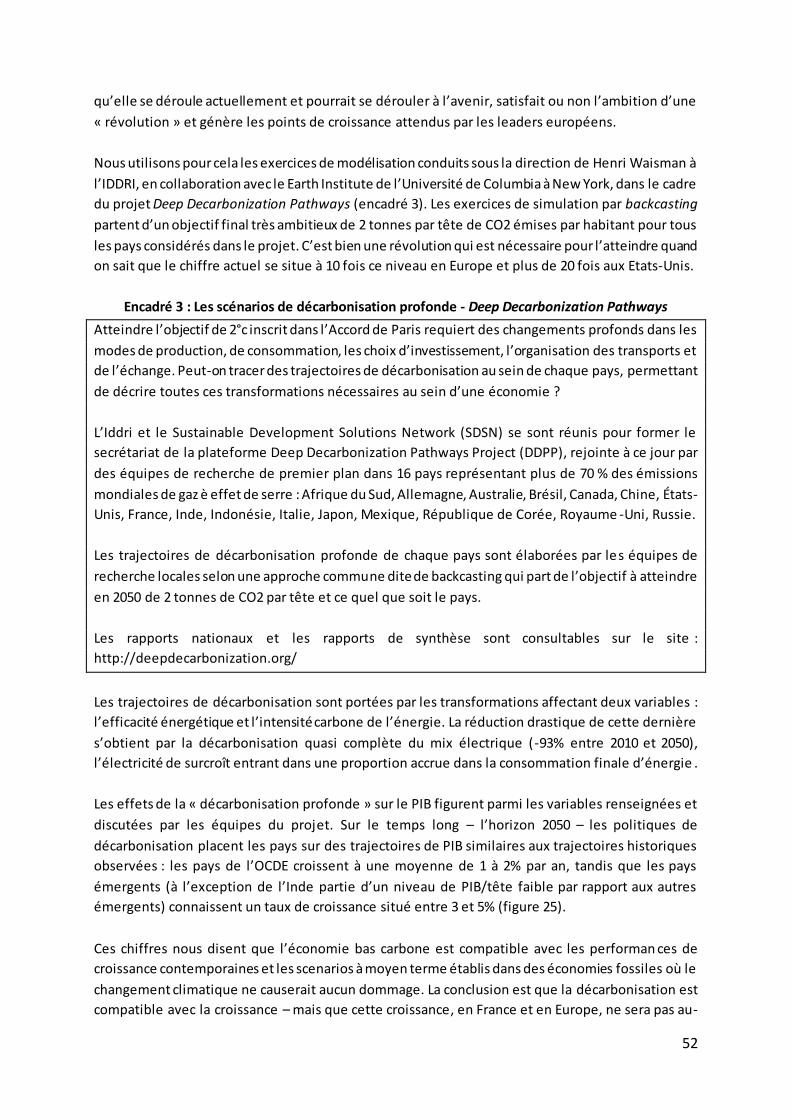
52
qu’elle se déroule actuellement et pourrait se dérouler à l’avenir, satisfait ou non l’ambition d’une
« révolution » et génère les points de croissance attendus par les leaders européens.
Nous utilisons pour cela les exercices de modélisation conduits sous la direction de Henri Waisman à
l’IDDRI, en collaboration avec le Earth Institute de l’Université de Columbia à New York, dans le cadre
du projet Deep Decarbonization Pathways (encadré 3). Les exercices de simulation par backcasting
partent d’un objectif final très ambitieux de 2 tonnes par tête de CO2 émises par habitant pour tous
les pays considérés dans le projet. C’est bien une révolution qui est nécessaire pour l’atteindre quand
on sait que le chiffre actuel se situe à 10 fois ce niveau en Europe et plus de 20 fois aux Etats-Unis.
Encadré 3 : Les scénarios de décarbonisation profonde - Deep Decarbonization Pathways
Atteindre l’objectif de 2°c inscrit dans l’Accord de Paris requiert des changements profonds dans les
modes de production, de consommation, les choix d’investissement, l’organisation des transports et
de l’échange. Peut-on tracer des trajectoires de décarbonisation au sein de chaque pays, permettant
de décrire toutes ces transformations nécessaires au sein d’une économie ?
L’Iddri et le Sustainable Development Solutions Network (SDSN) se sont réunis pour former le
secrétariat de la plateforme Deep Decarbonization Pathways Project (DDPP), rejointe à ce jour par
des équipes de recherche de premier plan dans 16 pays représentant plus de 70 % des émissions
mondiales de gaz è effet de serre : Afrique du Sud, Allemagne, Australie, Brésil, Canada, Chine, États-
Unis, France, Inde, Indonésie, Italie, Japon, Mexique, République de Corée, Royaume -Uni, Russie.
Les trajectoires de décarbonisation profonde de chaque pays sont élaborées par les équipes de
recherche locales selon une approche commune dite de backcasting qui part de l’objectif à atteindre
en 2050 de 2 tonnes de CO2 par tête et ce quel que soit le pays.
Les rapports nationaux et les rapports de synthèse sont consultables sur le site :
http://deepdecarbonization.org/
Les trajectoires de décarbonisation sont portées par les transformations affectant deux variables :
l’efficacité énergétique et l’intensité carbone de l’énergie. La réduction drastique de cette dernière
s’obtient par la décarbonisation quasi complète du mix électrique (-93% entre 2010 et 2050),
l’électricité de surcroît entrant dans une proportion accrue dans la consommation finale d’énergie .
Les effets de la « décarbonisation profonde » sur le PIB figurent parmi les variables renseignées et
discutées par les équipes du projet. Sur le temps long – l’horizon 2050 – les politiques de
décarbonisation placent les pays sur des trajectoires de PIB similaires aux trajectoires historiques
observées : les pays de l’OCDE croissent à une moyenne de 1 à 2% par an, tandis que les pays
émergents (à l’exception de l’Inde partie d’un niveau de PIB/tête faible par rapport aux autres
émergents) connaissent un taux de croissance situé entre 3 et 5% (figure 25).
Ces chiffres nous disent que l’économie bas carbone est compatible avec les performan ces de
croissance contemporaines et les scenarios à moyen terme établis dans des économies fossiles où le
changement climatique ne causerait aucun dommage. La conclusion est que la décarbonisation est
compatible avec la croissance – mais que cette croissance, en France et en Europe, ne sera pas au-
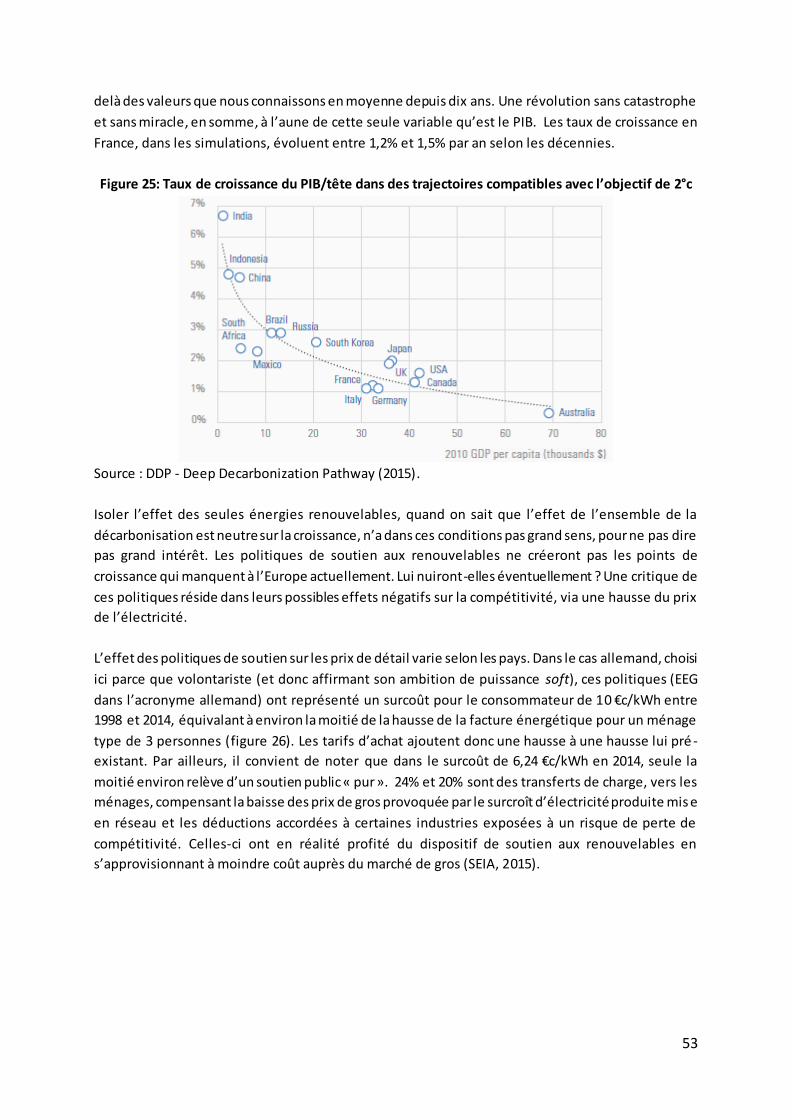
53
delà des valeurs que nous connaissons en moyenne depuis dix ans. Une révolution sans catastrophe
et sans miracle, en somme, à l’aune de cette seule variable qu’est le PIB. Les taux de croissance en
France, dans les simulations, évoluent entre 1,2% et 1,5% par an selon les décennies.
Figure 25: Taux de croissance du PIB/tête dans des trajectoires compatibles avec l’objectif de 2°c
Source : DDP - Deep Decarbonization Pathway (2015).
Isoler l’effet des seules énergies renouvelables, quand on sait que l’effet de l’ensemble de la
décarbonisation est neutre sur la croissance, n’a dans ces conditions pas grand sens, pour ne pas dire
pas grand intérêt. Les politiques de soutien aux renouvelables ne créeront pas les points de
croissance qui manquent à l’Europe actuellement. Lui nuiront-elles éventuellement ? Une critique de
ces politiques réside dans leurs possibles effets négatifs sur la compétitivité, via une hausse du prix
de l’électricité.
L’effet des politiques de soutien sur les prix de détail varie selon les pays. Dans le cas allemand, choisi
ici parce que volontariste (et donc affirmant son ambition de puissance soft), ces politiques (EEG
dans l’acronyme allemand) ont représenté un surcoût pour le consommateur de 10 €c/kWh entre
1998 et 2014, équivalant à environ la moitié de la hausse de la facture énergétique pour un ménage
type de 3 personnes (figure 26). Les tarifs d’achat ajoutent donc une hausse à une hausse lui pré -
existant. Par ailleurs, il convient de noter que dans le surcoût de 6,24 €c/kWh en 2014, seule la
moitié environ relève d’un soutien public « pur ». 24% et 20% sont des transferts de charge, vers les
ménages, compensant la baisse des prix de gros provoquée par le surcroît d’électricité produite mis e
en réseau et les déductions accordées à certaines industries exposées à un risque de perte de
compétitivité. Celles-ci ont en réalité profité du dispositif de soutien aux renouvelables en
s’approvisionnant à moindre coût auprès du marché de gros (SEIA, 2015).
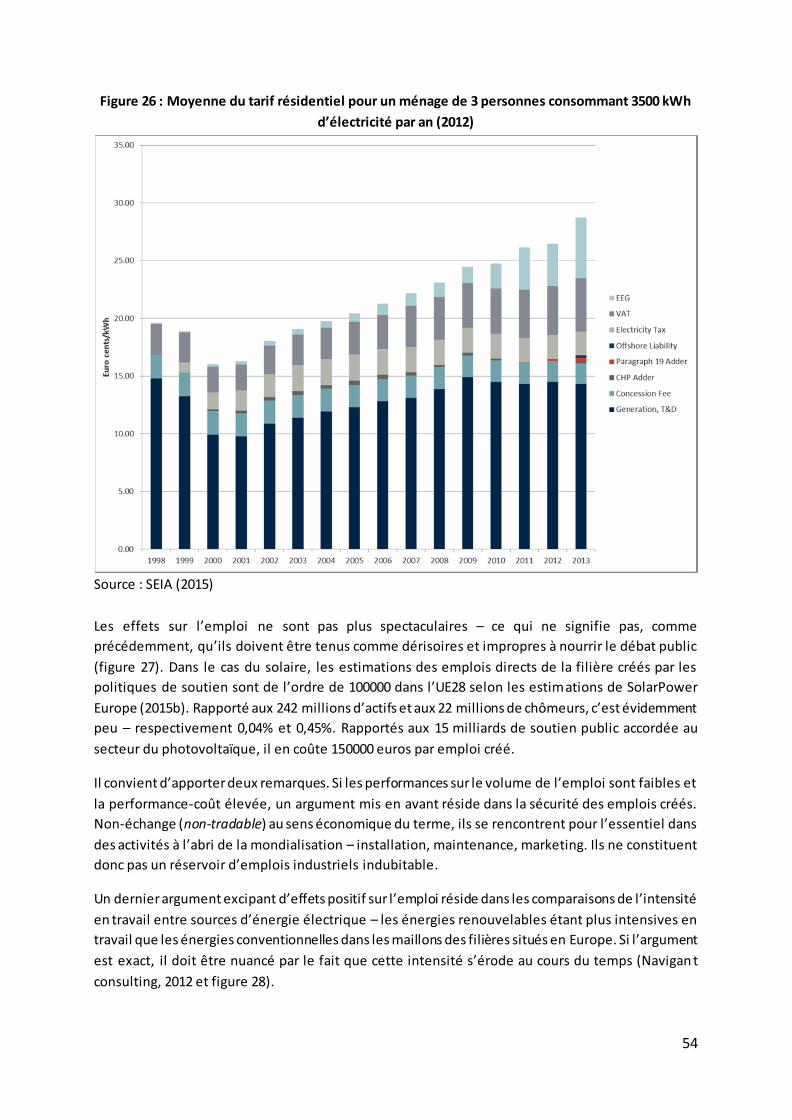
54
Figure 26 : Moyenne du tarif résidentiel pour un ménage de 3 personnes consommant 3500 kWh
d’électricité par an (2012)
Source : SEIA (2015)
Les effets sur l’emploi ne sont pas plus spectaculaires – ce qui ne signifie pas, comme
précédemment, qu’ils doivent être tenus comme dérisoires et impropres à nourrir le débat public
(figure 27). Dans le cas du solaire, les estimations des emplois directs de la filière créés par les
politiques de soutien sont de l’ordre de 100000 dans l’UE28 selon les estimations de SolarPower
Europe (2015b). Rapporté aux 242 millions d’actifs et aux 22 millions de chômeurs, c’est évidemment
peu – respectivement 0,04% et 0,45%. Rapportés aux 15 milliards de soutien public accordée au
secteur du photovoltaïque, il en coûte 150000 euros par emploi créé.
Il convient d’apporter deux remarques. Si les performances sur le volume de l’emploi sont faibles et
la performance-coût élevée, un argument mis en avant réside dans la sécurité des emplois créés.
Non-échange (non-tradable) au sens économique du terme, ils se rencontrent pour l’essentiel dans
des activités à l’abri de la mondialisation – installation, maintenance, marketing. Ils ne constituent
donc pas un réservoir d’emplois industriels indubitable.
Un dernier argument excipant d’effets positif sur l’emploi réside dans les comparaisons de l’intensité
en travail entre sources d’énergie électrique – les énergies renouvelables étant plus intensives en
travail que les énergies conventionnelles dans les maillons des filières situés en Europe. Si l’argument
est exact, il doit être nuancé par le fait que cette intensité s’érode au cours du temps (Navigan t
consulting, 2012 et figure 28).
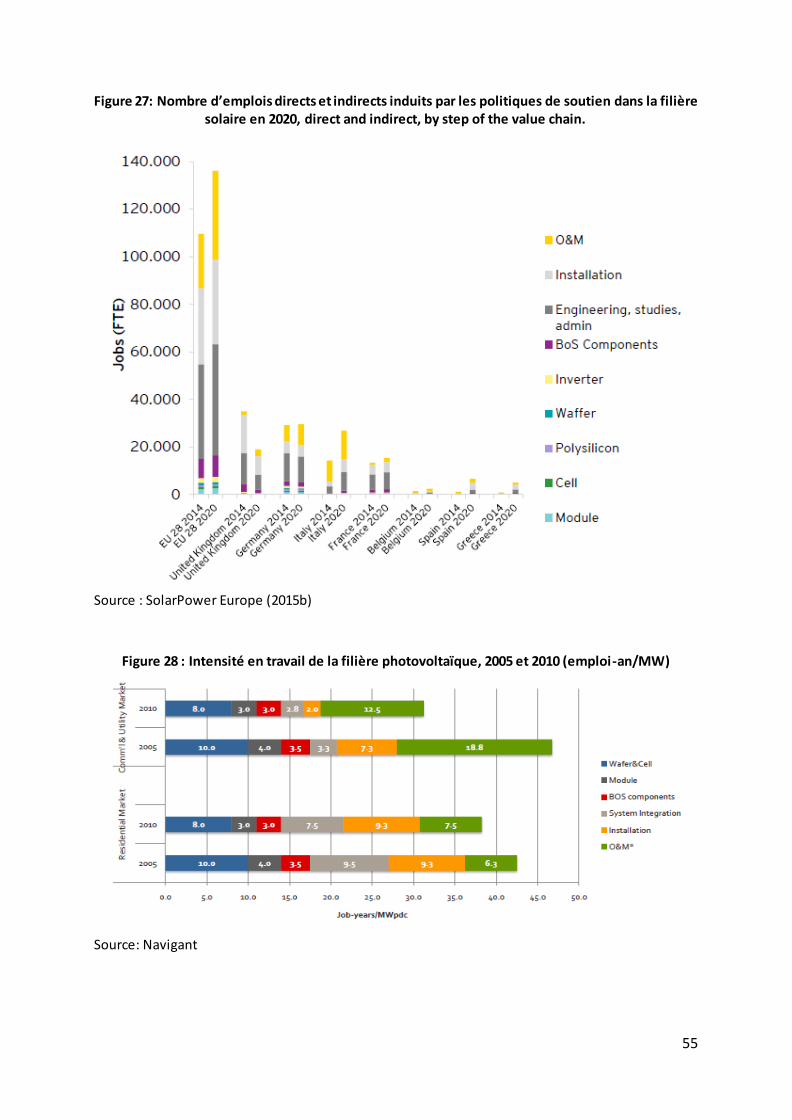
55
Figure 27: Nombre d’emplois directs et indirects induits par les politiques de soutien dans la filière solaire en 2020, direct and indirect, by step of the value chain.
Source : SolarPower Europe (2015b)
Figure 28 : Intensité en travail de la filière photovoltaïque, 2005 et 2010 (emploi-an/MW)
Source: Navigant
56
3. Les avantages de la course en tête Le cas de l’éolien terrestre et off-shore contraste par bien des aspects avec celui du solaire au silicium et permet de tirer des leçons complémentaires à celles dégagées dans ce dernier. L’avance technologique et industrielle de l’Europe s’y rencontre tout au long de la chaîne, et si la Chine parvient à maîtriser es technologies indispensables à la fabrication d’éoliennes « made in China » et à conquérir en moins de cinq ans le marché intérieur chinois, la pénétration du marché européen reste marginale et la dépendance technologique pour certains composants des nacelles élevée.
Les pays uropéens pionniers dans la production d’éoliennes conservent un avantage technologique dans les composants de valeur ajoutée elevée de la filière. Avec le renfort de politiques publiques bien conçues que nous abordons dans le prochain chapitre, cet avantage pourrait être maintenu sinon renforcé dans le court et moyen terme. Dans le cas de la filière éolienne offshore, les avantages potentiels de l’Europe n’ont pas été convenablement exploités. Il serait souhaitable d’augmenter la cooperation entre les pays membres de l’UE, qui ont souvent des compétences complementaires, afin de renforcer leur position stratégique dans l’industrie éolienne mondiale et diffuser les ga ins de la croissance verte à des pays plus récemment actifs dans ce secteur – ainsi de la France. L’idée d’un “airbus de l’éolienne offshore”, loin d’être un slogan politique un peu vague, est apparu de lui -même dans nos entretiens avec des cadres techniques du secteur. Un potentiel élevé selon nos enquêtes existe à l’exportation des technologies et savoir-faire dans les principaux marchés de l’éoliennen offshore, comme la Chine.
Grâce à la barrière naturelle que constituent la dimension de certains composants des éoliennes
(pâles, larges turbines, mâts) et l’impossibilité de faire voyager celles-ci en conteneurs, une part de
la valeur ajoutée et de l’emploi est captive du territoire où les turbines sont déployées. Cette
particularité renforce l’attrait de politique publiques incitatives pour la production ou le déploiement
– les effets des politiques de soutien sont en quelque sorte naturellement territorialisées. En
conséquence, l’Union Européenne et la France ont-elles tout intérêt à orienter leur politique à la fois
sur les segments à haute et basse valeur ajoutée dès lors que ces dernières ne sont pas
mondialisables/mondialisées. Par les caractéristiques dimensionnelles de ses composants principaux,
le marché des éoliennes, de surcroît offshore, infirme l’hypothèse de Samuelson énoncée plus haut.
Une part élevée de la valeur ajoutée est produite et captée par des activités non industrielles –
activités de service en amont et en aval de la chaîne. Ici encore des perspectives d’accroissement du
volume des emplois associés existent, lesquelles dépendent d’objectifs de déploiement de long
terme prévisibles et crédibles. Signalons que dans le cas Français, le développement d’une filière
complète de classe mondiale est, dans cette perspective, une priorité.
Un protectionnisme et une “préférence nationale” cachés sont pratique courante parmi tous les
grands pays leaders dans l’éolien. Sous la forme, le plus souvent, de contenu local ( local content
requirement) ces pratiques constituent une barrière à l’entrée pour les entreprises éoliennes
Européennes dans quelques marchés clefs (Etats-Unis, Chine, Brésil) – y compris à l’intérieur de
l’Europe dans l’accès au marché d’Etats membres. Le gain en emploi et valeur ajoutée domestiques
ne semblent pas suffisants pour justifier ces pratiques au regard du coût pour les consommateurs et
les contribuables soucieux d’atteindre des objectifs d’atténuation à moindre coût. Des dialogues
bilatéraux pourrait réduire l’occurrence de ces politiques “court termistes”. A un niveau pluri-latéral,
57
la France et les pays Européens pourraient joindre et renforcer l ’agenda d’un accord sur le
commercial des énergies durables (Sustainable Energy Trade Agreement).
Le marché de destination des biens et services de l’éolien européen reste l’Europe. Même dans la
perspective d’un approfondissement de la mondialisation avec la réduction des derniers obstacles au
commerce existants entre l’Europe et ses pays partenaires, la barrière naturelle que constitue la
taille des composants limite les perspectives de commerce longue distance (comparativement à
l’auto-approvisionnement) – la taille du marché européen et son évolution potentielle faisant de de
celui-ci le premier marché cible pour les firmes européennes. Dans cette filière plus que dans toute
autre filière d’énergie renouvelable semble-t-il, les co-bénéfices entre création de valeur industrielle
et non- industrielle domestique, création d’emploi, et atténuation à moindre coût semble nt justifier
une stratégie volontariste de développement de champions européens.
4. Implications pour 2030 L’Agence Internationale de l’Energie, la Commission Européenne , les syndicats européens des
énergies renouvelables (SunPower Europe, EWEA) produisent des scenarios de croissance de la
production d’électricité renouvelables à différents horizons. Les scénarios de l’AIE et de la
Commission sont plus conservateurs - sans surprise, que ceux des syndicats européens. Dans son
scénario de référence, la Commission (CE, 2013) évalue par exemple à un peu moins de 50% la
contribution des énergies renouvelables à la production européenne d ’électricité en 2050 (figure 29),
quand l’EWEA affirme dans ses projections qu’il est possible de mettre en place en Europe au même
horizon un réseau électrique capable de distribuer une électricité 100% renouvelable produite pour
moitié par des éoliennes. Le scenario de l’EWEA, quoiqu’indubitablement partisan, a cet intérêt de
visualiser le changement radical qu’implique l’objectif de décarbonisation profonde du mix électrique
(figure 30). Le scenario de référence de la Commission Européenne tire les tendances des
engagements européens tenus pour acquis à l’horizon 2020. Il est une « référence » en ce sens qu’il
appelle au développement de scénarios de décarbonisation permettant à l’Europe d’atteindre son
objectif d’une limitation des émissions de 80% à 95%.
Les scenarios de l’AIE, de la Commission Européenne, comme ceux de l’EWEA et de SunPower
Europe, reposent sur une idée commune et consensuelle aujourd’hui : l’efficacité -coût des
réductions d’émission est la plus élevée dans le secteur électrique, il faut donc substituer autant que
possible les sources d’énergie fossile par des sources électriques. Electrification et décarbonisation
vont de pair et contribuent tout ensemble, à côté d’une réduction de la consommation d’énergie, à
la décarbonisation des économies
Cette idée est développée au sein du projet Deep Decarbonization Pathway de l’IDDRI,
conjointement à 16 équipes nationales réparties dans différents pays (encadré «3). Les scénarios
DDP présentent l’intérêt d’être cohérents d’un point de vue économique – ils ne sont pas des
extrapolations de tendances sectorielles comme peuvent l’être ceux des syndicats d’énergie
renouvelable européen – et non partisans, en ce sens qu’ils ne privilégient pas une source d’énergie à
une autre. Ils sont cet intérêt supplémentaire pour notre étude de dessiner aux horizons 2030 et
2050 les possibles évolutions de la course aux technologies vertes, pour peu que l’on y cherche les
manifestations de la puissance présentées dans notre premier chapitre (figure 31).
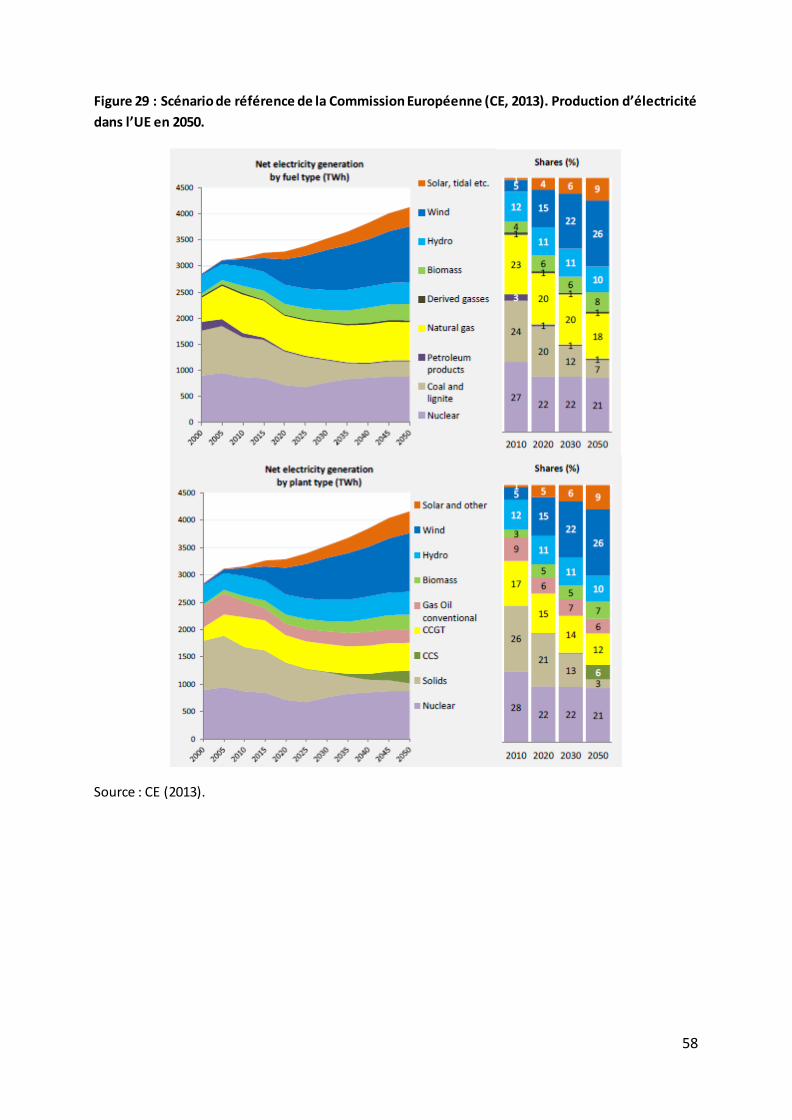
58
Figure 29 : Scénario de référence de la Commission Européenne (CE, 2013). Production d’électricité
dans l’UE en 2050.
Source : CE (2013).
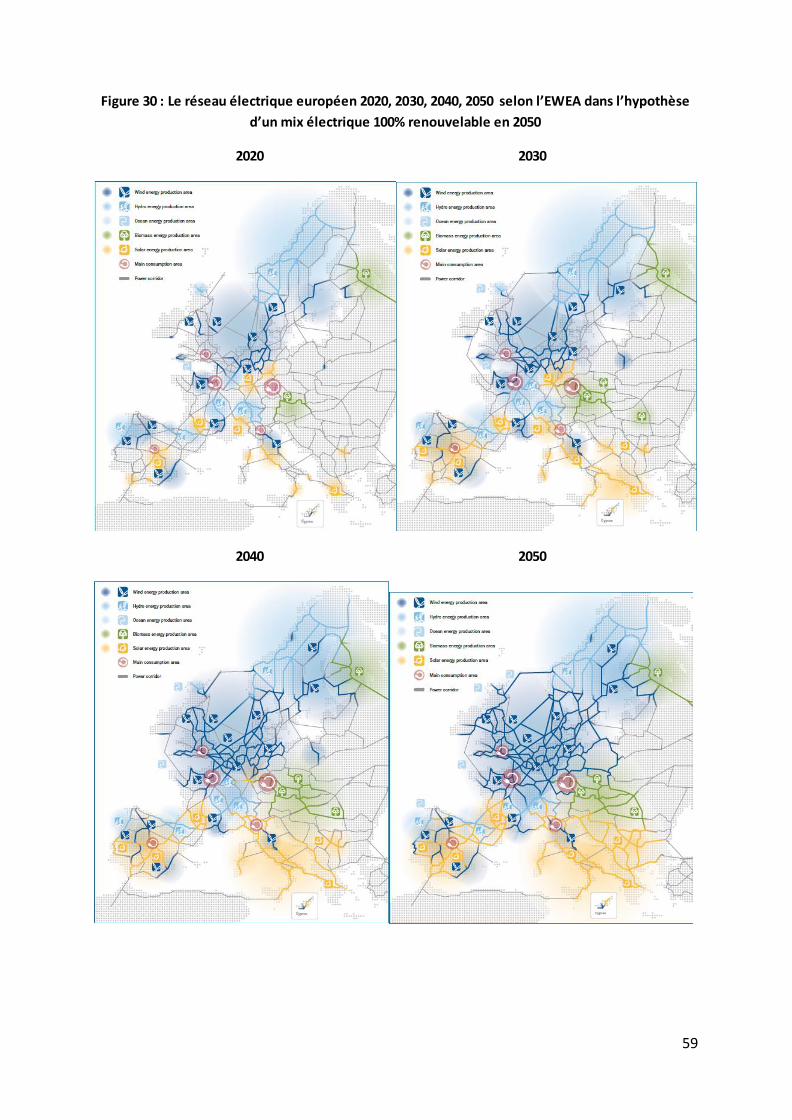
59
Figure 30 : Le réseau électrique européen 2020, 2030, 2040, 2050 selon l’EWEA dans l’hypothèse
d’un mix électrique 100% renouvelable en 2050
2020 2030
2040 2050
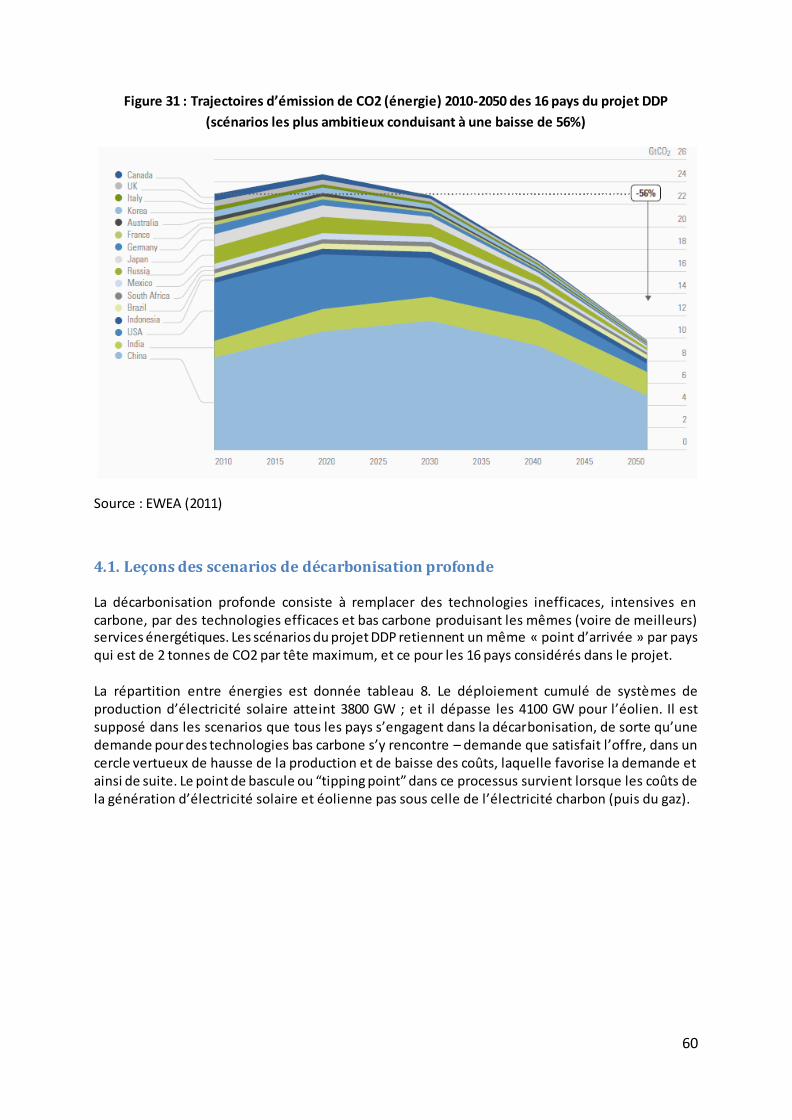
60
Figure 31 : Trajectoires d’émission de CO2 (énergie) 2010-2050 des 16 pays du projet DDP
(scénarios les plus ambitieux conduisant à une baisse de 56%)
Source : EWEA (2011)
4.1. Leçons des scenarios de décarbonisation profonde La décarbonisation profonde consiste à remplacer des technologies inefficaces, intensives en carbone, par des technologies efficaces et bas carbone produisant les mêmes (voire de meilleurs) services énergétiques. Les scénarios du projet DDP retiennent un même « point d’arrivée » par pays qui est de 2 tonnes de CO2 par tête maximum, et ce pour les 16 pays considérés dans le projet. La répartition entre énergies est donnée tableau 8. Le déploiement cumulé de systèmes de production d’électricité solaire atte int 3800 GW ; et il dépasse les 4100 GW pour l’éolien. Il est supposé dans les scenarios que tous les pays s’engagent dans la décarbonisation, de sorte qu’une demande pour des technologies bas carbone s’y rencontre – demande que satisfait l’offre, dans un cercle vertueux de hausse de la production et de baisse des coûts, laquelle favorise la demande et ainsi de suite. Le point de bascule ou “tipping point” dans ce processus survient lorsque les coûts de la génération d’électricité solaire et éolienne pas sous celle de l’électricité charbon (puis du gaz).
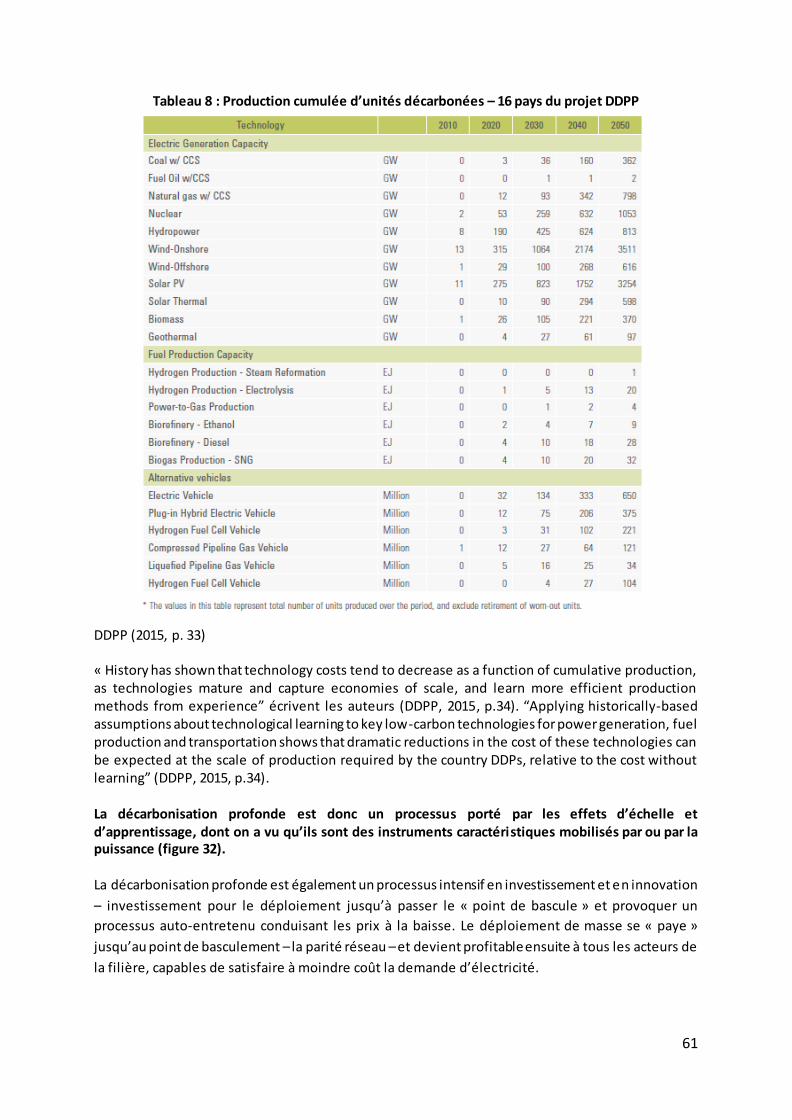
61
Tableau 8 : Production cumulée d’unités décarbonées – 16 pays du projet DDPP
DDPP (2015, p. 33) « History has shown that technology costs tend to decrease as a function of cumulative production, as technologies mature and capture economies of scale, and learn more efficient production methods from experience” écrivent les auteurs (DDPP, 2015, p.34). “Applying historically-based assumptions about technological learning to key low-carbon technologies for power generation, fuel production and transportation shows that dramatic reductions in the cost of these technologies can be expected at the scale of production required by the country DDPs, relative to the cost without learning” (DDPP, 2015, p.34). La décarbonisation profonde est donc un processus porté par les effets d’échelle et d’apprentissage, dont on a vu qu’ils sont des instruments caractéristiques mobilisés par ou par la puissance (figure 32). La décarbonisation profonde est également un processus intensif en investissement et en innovation
– investissement pour le déploiement jusqu’à passer le « point de bascule » et provoquer un
processus auto-entretenu conduisant les prix à la baisse. Le déploiement de masse se « paye »
jusqu’au point de basculement – la parité réseau – et devient profitable ensuite à tous les acteurs de
la filière, capables de satisfaire à moindre coût la demande d’électricité.
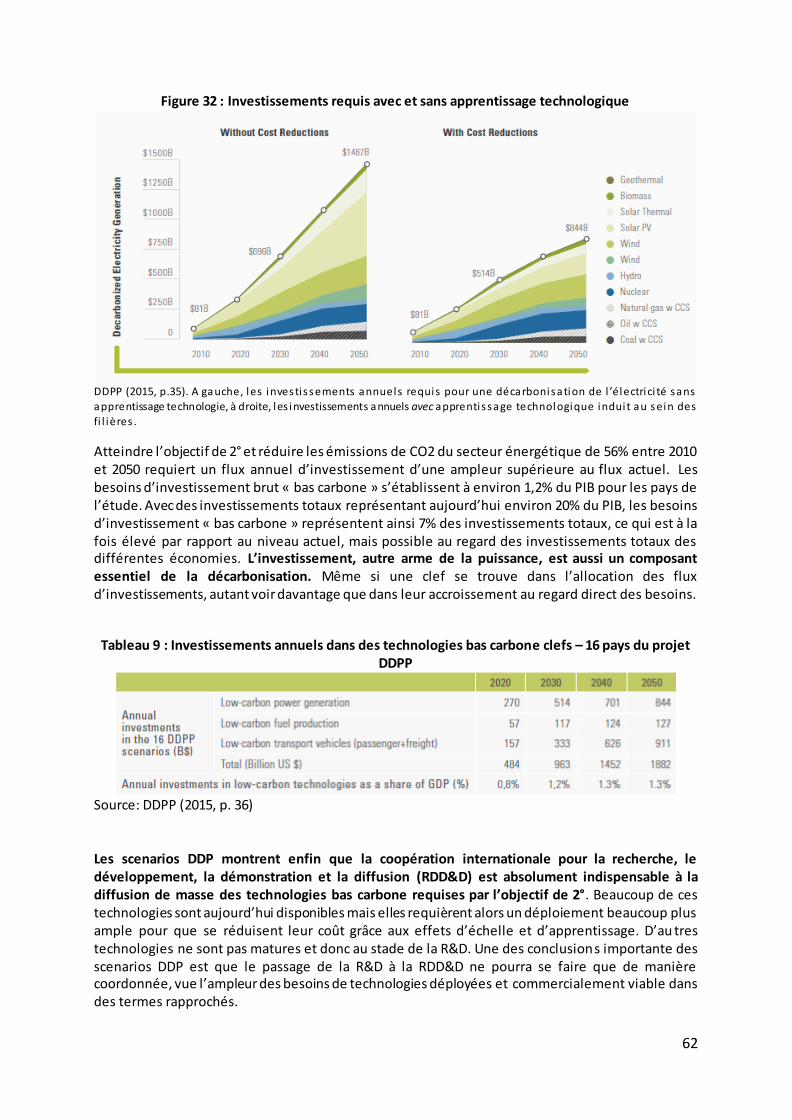
62
Figure 32 : Investissements requis avec et sans apprentissage technologique
DDPP (2015, p.35). A gauche, les investissements annuels requis pour une décarbonisation de l ’électrici té sans apprentissage technologie, à droite, les investissements annuels avec apprentissage technologique induit au sein des
fi l ières .
Atteindre l’objectif de 2° et réduire les émissions de CO2 du secteur énergétique de 56% entre 2010 et 2050 requiert un flux annuel d’investissement d’une ampleur supérieure au flux actuel. Les besoins d’investissement brut « bas carbone » s’établissent à environ 1,2% du PIB pour les pays de l’étude. Avec des investissements totaux représentant aujourd’hui environ 20% du PIB, les besoins d’investissement « bas carbone » représentent ainsi 7% des investissements totaux, ce qui est à la fois élevé par rapport au niveau actuel, mais possible au regard des investissements totaux des différentes économies. L’investissement, autre arme de la puissance, est aussi un composant essentiel de la décarbonisation. Même si une clef se trouve dans l’allocation des flux d’investissements, autant voir davantage que dans leur accroissement au regard direct des besoins.
Tableau 9 : Investissements annuels dans des technologies bas carbone clefs – 16 pays du projet DDPP
Source: DDPP (2015, p. 36)
Les scenarios DDP montrent enfin que la coopération internationale pour la recherche, le développement, la démonstration et la diffusion (RDD&D) est absolument indispensable à la diffusion de masse des technologies bas carbone requises par l’objectif de 2°. Beaucoup de ces technologies sont aujourd’hui disponibles mais elles requièrent alors un déploiement beaucoup plus ample pour que se réduisent leur coût grâce aux effets d’échelle et d’apprentissage. D’au tres technologies ne sont pas matures et donc au stade de la R&D. Une des conclusions importante des scenarios DDP est que le passage de la R&D à la RDD&D ne pourra se faire que de manière coordonnée, vue l’ampleur des besoins de technologies déployées et commercialement viable dans des termes rapprochés.
63
Les activités de capture et stockage du carbone en fournissent un bon exemple. Elles entrent dans les scenarios DDP comme dans ceux de la Commission et de l’AIE. Mais il faut achever la phase de démonstration au plus vite pour entre dans une phase commerciale à croissance rapide dans les années 2020. Cela est impossible sans une réduction rapide des coûts. Sans politiques volontaristes et coordonnées des Etats – via un prix du carbone notamment, mais également en matière de RDD&D, on voit mal comment la baisse des coûts pourra être obtenue dans des délais aussi rapprochés. La coordination – qui n’est pas forcément la coopération – est un élément indispensable du franchissement des points de basculement dans des horizons compatibles avec l’ambition de 2°C.
4.2. De la green race à la décarbonisation profonde : quelles conséquences sur la puissance ? L’objectif auquel a souscrit l’UE – réduire la hausse de la température à 2°c et si possible 1,5°c par rapport au niveau pré-industriel – rend nécessaire une décarbonisation profonde des économies les plus émittrices aujourd’hui, ou appellées à figurer parmi les plus émittrices dans des scenarios business as usual. Cette décarbonisation profonde, selon notre lecture des scenarios du projet Deep Decarbonization Pathway, prolonge la course à la puissance que nous avons décrite dans les premiers chapitres. La décarbonisation magnifie, en quelque sorte, les instruments de la puissance en reposant sur l’exploitation des économies d’échelle et des effets d’apprentissage technologique, en requérant de nouveaux investissements, de l’innovation, et à l’identique de ce que l’on a pu observer avant la « guerre du solaire » entre l’Europe et la Chine, en impliquant une production et une diffusion de masse sur injonction de la puissance publique jusqu’à franchir le point de basculement – la parité réseau, pour le dire vite. Les scenarios DDP, pas plus que ceux de l’AIE, de la Commission Européenne ou des syndicats européens d’énergie renouvelable ne sont conçus pour établir qui, de l’Europe et de ses pays partenaires, profitera le plus des trajectoires simulées pour projetées. L’inaction coûtant plus cher que l’action, par hypothèse, chaque pays se trouve en meilleure situation après qu’avant décarbonisation, que celle-ci soit profonde comme dans le cas DDP, ou légère comme dans les scenarios de référence de la Commission Européenne. Les gains relatifs entre pays, et notamment les gains de puissance, ne sont pas l’objet de ces études. Il est par ailleurs acquis que l’Europe n’a pas d’autre choix que de mener par l’exemple pour exercer son soft power, et tenir ses engagements. La décarbonisation est donc bonne pour tous les pays, à l’aune des valeurs moyennes de variables économiques, environnementales, et sanitaires, même si des perdants se rencontrent à l’intérieur de ceux-ci. Nous tentons dans le tableau 10 de synthétiser les effets relatifs entre l’UE et la Chine de la green race et d’évaluer les ceux découler d’une transformation, d’un prolongement de la green race en une deep decarbonization. L’investissement, qui est à la fois une manifestation de la puissance (chapitre 1) et un instrument de celle-ci (chapitre 2) apparaît comme instrument dans le tableau, pour en simplifier la lecture. Notre évaluation est qualitative et repose sur notre lecture, l’analyse qui précède, et les entretiens conduits pendant l’étude.
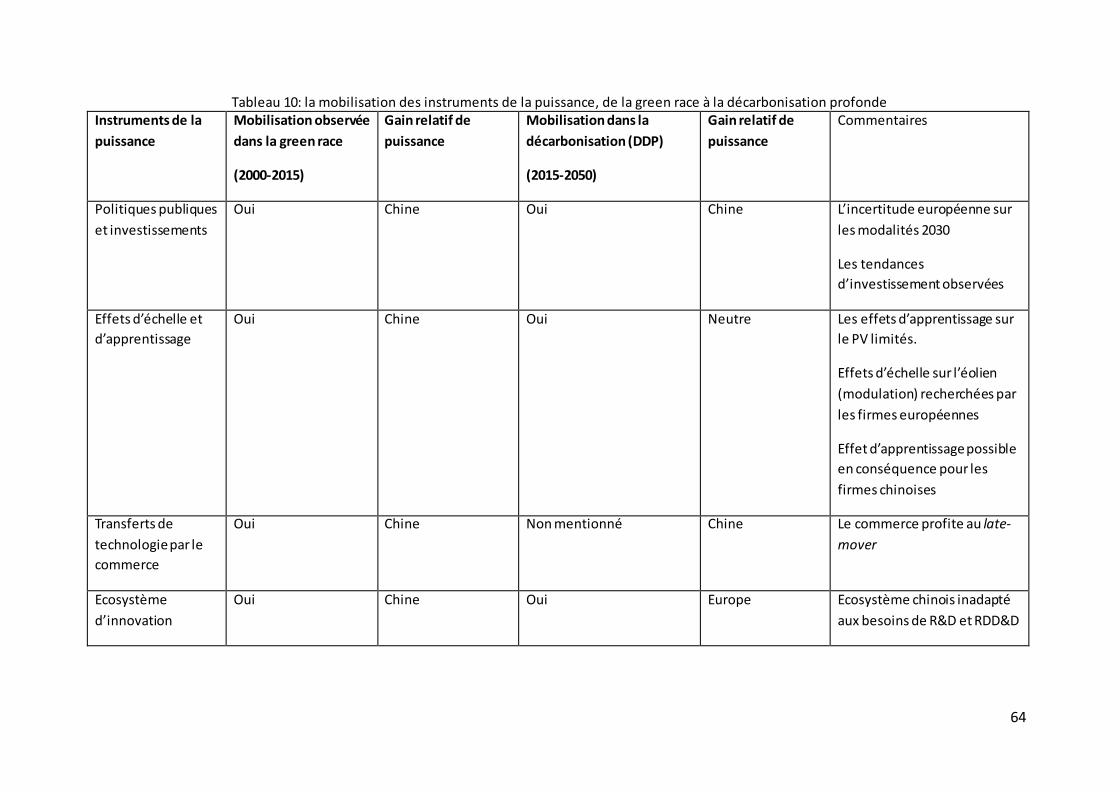
64
Tableau 10: la mobilisation des instruments de la puissance, de la green race à la décarbonisation profonde Instruments de la
puissance
Mobilisation observée
dans la green race
(2000-2015)
Gain relatif de
puissance
Mobilisation dans la
décarbonisation (DDP)
(2015-2050)
Gain relatif de
puissance
Commentaires
Politiques publiques
et investissements
Oui Chine Oui Chine
L’incertitude européenne sur
les modalités 2030
Les tendances
d’investissement observées
Effets d’échelle et
d’apprentissage
Oui Chine Oui Neutre Les effets d’apprentissage sur
le PV limités.
Effets d’échelle sur l’éolien
(modulation) recherchées par
les firmes européennes
Effet d’apprentissage possible
en conséquence pour les
firmes chinoises
Transferts de
technologie par le
commerce
Oui Chine Non mentionné Chine Le commerce profite au late-
mover
Ecosystème
d’innovation
Oui Chine Oui Europe Ecosystème chinois inadapté
aux besoins de R&D et RDD&D
65
En prolongeant les tendances d’investissement actuels entre régions, et en gardant en tête
l’incertitude autour de la mise en œuvre de stratégies nationales des pays membres de l’UE pour
atteindre l’objectif non contraignant d’une part de 27% d’énergie renouvelable en 2030 dans la
consommation d’énergie, la Chine est la puissance dominante à l’aune de l’usage du premier
instrument.
La mobilisation des effets d’échelle et d’apprentissage conduit à des résultats plus équilibrés. La
Chine est arrivée au bout du solaire, si l’expression a un sens – les effets d’échelle et d’apprentissage
y sont aujourd’hui limités. Les firmes européennes en revanche, à l’instar de Siemens, recherche un
fractionnement des filières, une modularisation plus poussée qu’elle ne l’est actuellement, afin de
satisfaire à la demande de masse d’éoliennes devenues des commodities grâce à l’exploitation
d’économies d’échelle. Les effets d’apprentissage qui en découleraient profiteraient à la Chine, selon
l’exemple du solaire durant la dernière décennie.
L’écosystème de l’innovation en Chine ne paraît pas en mesure de satisfaire aux besoins de R&D, et
RDD&D, comme nous l’avons souligné dans le chapitre précédent. Ce que la Chine a réuss i de son fait
sur des technologies datées - la production de masse d’une commodité, le panneau solaire silicium,
avec effets d’apprentissage fournisseurs-clients – ne pourra être reproduit à l’identique dans
l’exemple de l’éolien on shore ou off-shore au regard des progrès technologiques attendus et du
rythme de ceux-ci. Les activités de production de module ne devraient pas lui permettre de pouvoir
livrer clef en main les éoliennes conçues en Europe, ni de capturer la majorité de la valeur ajoutée.
Reste la variable commerce. L’échange dans la green race comme dans la décarbonisation profonde
profite au « late mover » - le transfert de technologie se fait toujours par définition depuis le vendeur
vers l’acheteur. En important les produits intermédiaires européens, en acquérant des licences, en
apprenant-en-faisant par les relations fournisseurs-clients, la Chine profitera du commerce sans
doute davantage que n’en profitera l’Europe à l’aune du transfert de technologie.
Tout cela valide-t-il davantage la thèse du sourire de l’OCDE, ou de la « grimace » de Samuelson et
Krugman ? Notre réponse est que jusqu’à aujourd’hui, la green race a profité au climat, d’abord, en
s’inscrivant dans une perspective inéluctable ; ensuite, elle a conféré davantage de puissance à la
Chine qu’à l’Europe, par l’étendue des instruments mobilisés. Le sourire, qui est une photographie,
n’est pas complètement avéré dans la mesure où les firmes chinoises ont su apprendre, intégrer les
segments amonts et avals et gagner des parts de marché dans les parties extrêmes du sourire.
Pour autant rien dans nos entretiens ne justifie des mesures de relocalisation de la valeur ajoutée
industrielle par des instruments tels que le droit douane, les avantages comparatifs de l’Europe dans
la R&D et la RDD&D justifiant de consacrer à celles-ci des moyens croissants et bien plus élevés que
ceux consentis actuellement. Les gains de puissance, dans notre tableau, restent relatifs, et
conditionnés par la capacité de l’Europe à mobiliser sur son territoire les instruments plus pacifiques
et plus efficaces que sont les rendements d’échelle et des politiques énergétiques claires,
ambitieuses, et coordonnées. Le concurrent de l’Europe à l’horizon 2030 semble bien moins être la
Chine que l’Europe elle-même.
Enfin, des exercices tels que le DDP gagneraient à être assortis de scenarios détaillés par filière des
évolutions possibles de la valeur ajoutée. La localisation géographique de celle -ci, de même que les
emplois attachés à chaque maillon de la filière, sont des données requises dans le débat public. La
66
green race, comme la décarbonisation, créent des gagnants et des perdants. La mobilisation des
premiers et la compensation des seconds sont nécessaires au bon déroulement du processus
d’ajustement rapide vers la décarbonisation. Si une connaissance approfondie de l’état de
l’innovation – qualité des brevets, innovation hors brevet – en Chine est requise pour anticiper le sort
et l’identité des perdants à l’avenir, il en va de même de la connaissance de la répartit ion de la valeur
et de l’emploi, celle-ci de surcroît permettant de confirmer s’il y a lieu le bien-fondé de la
décarbonisation.
Le premier champ – l’évaluation de la production d’un écosystème d’innovation – engage la recherche, pour ses parties les plus méconnues, et pour le reste, selon nos entretiens, relève de l’activité décentralisée du marché – ce sont les entreprises qui connaissent le mieux leur propre secret industriel et devinent éventuellement ceux de leurs concurrents. L’intelligence économique, telle que rassemblée par la D2IE, sans être inutile, nous paraît moins nécessaire qu’une veille sur la répartition de la valeur et de l’emploi au sein de filières « stratégiques » de la décarbonisation.
Conclusion En 2012, le Parlement européen publie un rapport sur l’UE et la Chine, intitulé L’échange inégal ?, où
il rappelle que « le commerce entre l’Union et la Chine a connu une croissance rapide et continue ces
30 dernières années, […] culminant à 395 milliards EUR en 2010 [et que] le commerce bilatéral
accuse un déséquilibre en faveur de la Chine depuis 1997, ce déficit […] s’élevant en 2010 à
168,8 milliards EUR contre 49 milliards en 2000 » Le texte se poursuit ainsi : « la valeur ajoutée des
exportations chinoises est très limitée après soustraction de la valeur des composants importés de
l’Union et d’ailleurs ; [et] les sociétés étrangères installées en Chine réalisent près de 85 % de
l’ensemble du commerce d’exportation découlant des activités d’assemblage » (Parlement européen,
2012).
Le creusement rapide du déficit commercial de l’UE vis-à-vis de la Chine pour les panneaux et cellules
PV a joué un rôle déterminant dans l’initiative antidumping de la Direction générale du commerce
(DG Trade) de la CE contre les importations de panneaux solaires chinois. L’addition des soldes des
échanges pour le silicium, les wafers, les panneaux, cellules et inverseurs PV fait apparaître un déficit
moyen de l’UE vis-à-vis de la Chine de 10 milliards EUR entre 2008 et 2011 – contre un excédent cinq
ans auparavant. L’ampleur de cette dégradation et la rapidité avec laquelle elle s’est concrétisée
rappellent des scénarios observés dans le secteur du textile et de l’habillement en janvier 2005, date
de l’expiration de l’Accord multifibres (AMF) : la position commerciale de l’UE vis-à-vis de la Chine
s’est alors brusquement et fortement détériorée.
Mais deux différences majeures demeurent : dans le cas du photovoltaïque, aucune réduction des
droits ni suppression de quotas n’explique la brusque envolée des importations de l’UE depuis la
Chine ; et la valeur symbolique des modules photovoltaics – décrits à tort comme des produits high-
tech de la « troisième révolution industrielle », produits high-tech dont l’importance a été soulignée
par le président de la Commission, José Manuel Durão Barroso18 – est bien évidemment supérieure à
celle de sous-vêtements féminins. La nature emblématique du PV cristallise également des attentes
18
Conférence sur l’énergie de Loyola de Palacio, “Europe’s energy policy and the third industrial revolution”, Madrid, 1
er octobre 2007 (http://europa.eu/rapid/press-release_SPEECH-07-580_en.htm).
67
en matière de création d’emplois « verts » au sein de l’UE et donc d’inversion du déclin de l’emploi
manufacturier dans l’UE – un traumatisme particulièrement douloureux en France même si, jusqu’ici,
la filière PV n’a reçu que très peu de soutien de l’État.
L’équation peut être posée de la manière suivante : les forces du marché mondial sont-elles toujours
à l’origine de l’innovation et de sa diffusion, conformément aux descriptions des manuels
d’économie ou bien le syndrome de Samuelson que nous avons décrit dans ce chapitre est-il à
l’œuvre, qui veut que les transferts massifs de technologie/l ’imitation vers/dans une Chine
tardivement convertie aux technologies vertes entraînent une érosion du revenu réel dans les pays
qui, comme les États-Unis ou l’UE, ont été des précurseurs en la matière et, de ce fait, y réduisent
l’innovation ? Si tel était le cas, alors la division du travail défendue par le Premier ministre chinois,
selon qui « le ‘conçu en Europe’ va de pair avec le ‘fabriqué en Chine’ et les technologies
européennes s’appliquent au marché chinois », ne produirait plus de « résultats étonnants » étant
donné le manque d’activité sur le front du « conçu en Europe ».
Rien dans nos résultats d’enquête et notre revue de la littérature ne nous permet de contredire la
vision du Premier ministre chinois. Si la division du travail dans la chaîne logistique des renouvelables
photovoltaïques et éolien est en train de connaître des ajustements qui voient les entreprises
chinoises poursuivre leur intégration verticale, progresser dans la chaîne de valeur et accroître
sensiblement leurs dépenses de R-D et leurs dépôts de brevets, rien dans ce mouvement ne paraît
remettre en question les avantages comparatifs de l’Europe dans les segments à haute valeur
ajoutées et/ou forte intensité en emploi naturellement protégé .
Un objectif de ré-industrialisation de l’UE via la fabrication des modules PV en silicium cristallin serait
en conséquence, d’un point de vue strictement économique , un non-sens. En revanche, un objectif
de création d’emplois protégés dans les segments aval des filières (parce que « non-tradable », ie en
concurrence sur le marché international) et de poursuite de l’avantage technologique conquis dans
les segments amonts en particulier en matière d’éolienne offshore paraît satisfaire aux trois critères
de performances des technologies vertes que sont la production d’un bien à caractère public
(atténuation des émissions de gaz à effet de serre), à fort contenu en emploi protégé de la
concurrence international, et à forte valeur ajoutée.
68
Références des chapitres 1 à 3 Badie, B., Devin, G. 2007. Le multilatéralisme, nouvelle forme de l’action internationale. La Découverte. Paris. Baldwin, R. (2012), “Global Supply Chains: Why They Emerged, Why They Matter and Where They Are Going”, CEPR Discussion Paper, No. DP 9103. Center for Economic Policy Research. 2013. Global Trade Alert Database. Center for Economic Policy Research. DDP - Deep Decarbonization Pathway. 2015. Pathways to Deep Decarbonization. SDSN and IDDRI. Paris.
De La Tour, A. et M. Glachant (2013), “How do solar photovoltaic feed-in-tariffs interact with solar
panel and silicon prices? An empirical study”, Working Paper 13-ME-04, Institut interdisciplinaire de
l’innovation, avril.
De La Tour, A., M. Glachant et Y. Ménière (2011), “Innovation and International Technology Transfe r:
the Case of the Chinese Photovoltaic Industry”, Energy Policy, 39(2), pp. 761–770.
De Melo, J. (2014). The Launch of an Environmental Goods Agreement: A Timid Agenda. Planet
Policy, Brookings Institute, http://www.brookings.edu/blogs/planetpolicy/posts/2014/07/15-
environmental-goods-agreement-de-melo.
Dedrick, J. and K. L. Kraemer (1999), “Compaq Computer: Information Technology in a Company in Transition”, CRITO Working Paper, Center for Research on Information Technology and Organizations, University of California, Irvine. Dunford, Kyoung Hoon Lee, Liu Weidong, Yeung, 2012. Geographical interdependence, international trade and economic dynamics: The Chinese and German solar energy industries. Mimeo. EPIA (2012), EPIA-market-report-2011, Bruxelles.
European Commission (2013), The 2013 EU Industrial R&D Investment Scoreboard European Commission. 2013. EU Energy, Transport and GHG Emissions. Trends to 2050. Reference scenario 2013. European Commission. 2014. Subsidies and costs of EU Energy. Report by Ecofys. EWEA. 2011. EU Energy Policy to 2050. Achieving 80-95% emissions reductions. EWEA. March 2011. Frankfurt School-Unep-Bloomberg Energy Finance. 2015. Global Trends In Renewable Energy Investment. Frankfurt School of Finance & Management. Gillingham, K., Sweeney, J. (2010) Market failure and the structure of externalities, in A. Jorge Padilla and Richard Schmalensee (eds) Harnessing Renewable Energy in Electric Power Systems: Theory, Practice, Policy, Resource for the Future Press: 69-92. Glachant, M., Dechezleprêtre, A. 2016. What role for climate negotiations on technology transfer? Forthcoming, Climate Policy.
69
Glachant, M., Dussaux, D., Ménière, Y., Dechezleprêtre, A. (2013) Promoting International Technology Transfer of Low-Carbon Technologies: Evidence and Policy Perspectives. Study commissioned by the French Council of Strategic Analysis. Hobday, Michael (1995) Innovation in East Asia. Cheltenham and Lyme: Edward Elgar. Isoard, S., Soria, A. (2001) Technical change dynamics: evidence from the emerging renewable energy technologies, Energy Economics 23(6): 619-636. Johnstone, J., Haščič, I., Watson, F. (2011) Methodological Issues in the Development of Indicators of Innovation and Transfer in Environmental Technologies. In OECD, Invention and Transfer of Environmental Technologies. Junginger, M., W. v. Sark, et al. (2010). The experience curve approach: history, methodological
aspects and applications. Technological Learning in the Energy Sector: Lessons for Policy, Industry
and Science. M. Junginger, W. Sark and A. Faaij. Cheltenham, Edward Elgar: 90-104.
Lewis, Joanna I. 2007b. A Review of the Potential International Trade Implications of Key Wind Power
Industry Policies in China. Beijing: Energy Foundation China Sustainable Energy Program.
Lewis, Joanna l. 2010. The evolving role of carbon finance in promoting renewable energy
development in China. Energy Policy 38: 2875-2886.
Lewis, Joanna I. 2012a. Emerging Conflicts in Renewable Energy Policy and International Trade Law.
In Proceedings of the World Renewable Energy Forum. Denver, CO.
Lewis, J.I (2013) Green Innovation in China. China’s Wind Power Industry and the Global Transition to
a Low-Carbon Economy, Columbia University Press, New York.
Lewis, J.I (2014) The Rise of Renewable Energy Protectionism: Emerging Trade Conflicts and
Implications for Low Carbon Development, Global Environmental Politics, vol 14 (4), November.
Lewis, Joanna I., and Ryan Wiser. 2005. A Review of International Experience with Policies to Promote
Wind Power Industry Development. Energy Foundation China Sustainable Energy Program.
National Science Board. 2012. Science and Engineering Indicators 2012. (NSB 12-01). Arlington, VA:
National Science Foundation.
OECD (2011), Invention and Transfer of Environmental Technologies, Paris, OECD.
OCDE (2013), Interconnected economies – benefiting from global value chains, OCDE, Paris.
Park, Bun‐Soon (2009) Joongkook Kiup Daehaeboo (An Analysis of Chinese firms) Seoul: Samsung Economic Research Institute (in Korean). Cité par Dunford et al. (2012).
Parlement européen (2012), Rapport sur l’UE et la Chine : l’échange inégal ?, Document de séance,
Strasbourg, 20 avril.
70
REDP (China Renewable Energy Development Project) (2008), Report on the development of the
photovoltaic industry in China.
REN21. 2013. Renewables Global Status Report 2013. Paris: REN21 Secretariat. Available from
<http://www.ren21.net/Portals/97/documents/GSR/REN21_GSR2011.pdf>.
Ruoss, D. (2007), “Global Photovoltaics Business and PV in Malaysia”, Envision report.
Samuelson, P. (2004), “Where Ricardo and Mill Rebut and Confi rm Arguments of Mainstream
Economists Supporting Globalization”, The Journal of Economic Perspectives, vol. 18, n° 3 (été), 135-
146.
Shih, Stan (1996), “Me-Too is Not My Style”, Acer Foundation, 136, Chinese Taipei.
Wei Zhao, Ruet, J. 2014. Chine: comment la transition économique redessine l’innovation. In Paugam, Tubiana, Pachauri (eds) Regards sur la terre 2014 : les promesses de l’innovation durable. Armand Colin. Paris : 343-355. Xin Wang, Shuwei Zhang. 2016. Exploring linkages among China 2030 targets. Climate Policy. DOI:10.1080/14693062.2015.1124752
71
Chapitre 4
La course aux technologies vertes dans le secteur des énergies éoliennes
(chapitre en anglais)
72
Introduction
A by-product of international efforts to tackle climate change has been the emergence of a “green
race” among governments: a competitive drive to capture a share of new markets for high -potential,
low-carbon technologies. This issue has garnered all the more attention because of the macro-
economic context in which it has emerged. Major emerging economies, such as China, Brazil and
India, have tended to see export-led industrialization as central to their economic development
strategies. As part of this process, these countries are keen to move up the manufacturing value
chain and thus to increasingly produce high-value added technologies – traditionally the domain of
advanced economies.
At the same time, many advanced economies find themselves mired in a prolonged period of slow
growth due to deficient demand, high unemployment (particularly among young and low-skilled
workers) and declining productivity. These countries are therefore sometimes alarmed at the
declining share of manufacturing in GDP and the declining share of manufacturing jobs in total
employment. In this context, low-carbon technologies have emerged as a new frontier in the battle
for economic growth and high-quality employment opportunities.
Another dimension to the green race is the fact that the low-carbon transition will entail some
degree of economic disruption for stakeholders in traditional fossil -fuel using sectors. In the short
run, providers of goods and service related to transport, power, and energy-intensive industries will
be disrupted to some extent as they are required to modify their business models in order to reduce
their emissions. For governments, the capacity to create stakeholder groups for whom the benefits
of decarbonisation – e.g. in terms of jobs and GDP – offset or outweigh the short run cost of these
disruptions in traditional sectors could be an important part to maintaining momentum towards
change.
This raises the question of what industrial strategy advanced economies in Europe, and what strategy
France in particular, should adopt. There are a number of aspects to this question: Should these
economies simply focus on specific areas of comparative advantage within the value chain, such as
R&D related to high tech components? Or should they focus on gaining a strategic foothold
throughout the entire value chain? Depending on the chosen strategy, is there likely to be a strategic
benefit in being a first-mover or a second-mover relative to other countries? Moreover, what should
be the articulation and prioritization between different strategic objectives? Is there a trade -off, for
instance, between minimizing the costs of decarbonisation and maximizing the share of employment
and GDP that is generated from domestic production of components? How should this trade -off be
managed? What policy options exist to pursue these strategies most effectively?
The present study seeks to answer these questions with respect to the wind power sector. It does so
based on interviews with wind power company and industry representatives in Europe, China and
Brazil. It is also based on a comprehensive literature survey and available data on the evolution of the
wind power value chain. The study focuses on both offshore and onshore wind technologies. It also
seeks to draw distinctions between France and other European countries where appropriate.
The main conclusions of the study can be summarised as follows:
73
1. Advanced countries in Europe retain a large first mover advantage in high value
components for wind technologies. With the right policies, this advantage could remain in
place for a significant period of time. In the case of offshore wind, this advantage is not yet
fully exploited and possibilities for greater cooperation between EU countries with differing
competencies should be further explored as strategic option to the benefit of several
Member States, including France. Significant potential to export offshore technologies and
exploit European know-how abroad in major markets, such as China, exist if Europe can
develop a robust value chain in the offshore space.
2. Natural barriers to trade are important for key components in the wind sector value chain.
This means that a significant share of the benefits of wind power deployment policies,
particularly in terms of manufacturing employment, are likely to accrue domestically
regardless of trade policies. Thus advanced economies have a can and should focus on both
high value added and lower value added parts of the value chain, since many of the latter are
non-traded.
3. Much value added is added in non-manufacturing activities throughout the value chain. To
realise these benefits, the focus should be on the quality and predictability of deployment
policies for value chain component providers. For France, facilitating the development of a
world class domestic value chain is also a critical priority.
4. Hidden trade protectionism is practiced in virtually all countries in the wind industry sector
and is a barrier to entry for European manufacturers in some markets. In several large
markets, including the US, China and Brazil (but also within Europe), non-tariff-based
protectionism (mainly in the form of local content requirements) remains significant. In some
instances, protectionist policies appear to be significantly raising costs of providing wind
energy for consumers and/or taxpayers. However, evidence suggests that the long-run
economic benefits of such protectionism for the domestic market are often unjustified
compared to the costs imposed for achieving environmental goals and access to affordable
energy for consumers. In some cases, the most appropriate option may be to pursue bilateral
dialogues with the relevant countries to pursue “win-win” trade deals bilaterally. There may
also be a value in Europe throwing its weight behind the Sustainable Energy Trade
Agreement agenda, starting with a small sub-group of major markets where there may be
mutually beneficial gains from freer trade in wind components.
5. Europe’s main trading partner in wind energy components is Europe. Even if non-tariff
barriers to imports and FDI from European component providers are removed, a range of
natural barriers to trade over long distances, and the size of the EU energy market, means
that the bedrock of European markets for wind components is likely to remain in Europe.
This points to a strong synergy between domestic environmental goals (and the deployment
objectives that are set to meet them) and industrial and employment objectives of
developing a robust domestic value chain for wind components.
The structure of this paper is as follows. Section 2 describes the status and evolution of the wind
power chain as well as expectations of future developments. Section 3 defines the strategic
74
objectives Europe as a whole, as France in particular, is seeking to pursue with respect to that value
chain. Section 4 then discusses strategic opportunities and risks for France and other EU economies
with regard to the wind sector value chain. Section 5 concludes.
Section I - Historical background
Technologies for wind power generation were first developed in Europe in the 1970s and 1980s, and
Denmark soon emerged as the hub of an industry that is now of strategic importance at the
international level.19 The benefits of having established an early foothold in the sector are being felt
to this day: in 2013, five European companies were ranked among the top ten wind turbine
manufacturers by market share, being responsible for almost 40% of global capacity added in that
year (see infographic).20 Most of these companies are German (Enercon, Siemens, Nordex) but
Denmark is home to the leader among them (Vestas), and it was in Denmark that most of the
technologies first used by other European companies were originally developed. 21 This head-start
was the result of government “policies [to] ensure stable demand” in domestic markets – including
long-term commitments to purchase electricity from renewable sources at fixed prices (Feed -in-
Tariffs or FITs) – which acted as an incentive for investment in wind power generation.22 Once the
industry had attained critical mass in home markets, European wind turbine manufacturers were
able to export their equipment into important new markets, where they were faced with little or no
competition. In the words of Joanna Lewis, “when the first utility-scale wind turbine was installed in
China in 1985, it was imported from Denmark [and] Vestas pretty much had the Chinese market to
itself”.23
19 Joanna I. Lewis, Green Innovation in China: China’s Wind Power Industry and the Global Transition to a Low-Carbon Economy, Columbia University Press, New York, 2013, pp. 26-31.
20 REN21, Renewables 2014: Global Status Report, REN21 Secretariat, Paris, France, available online at
http://www.ren21.net/portals/0/documents/resources/gsr/2014/gsr2014_full%20report_low%20res.pdf , (accessed 06 May 2015), p. 59.
21 Lewis, pp. 75-105.
22 Ibid., p. 37.
23 ibid., p. 61.
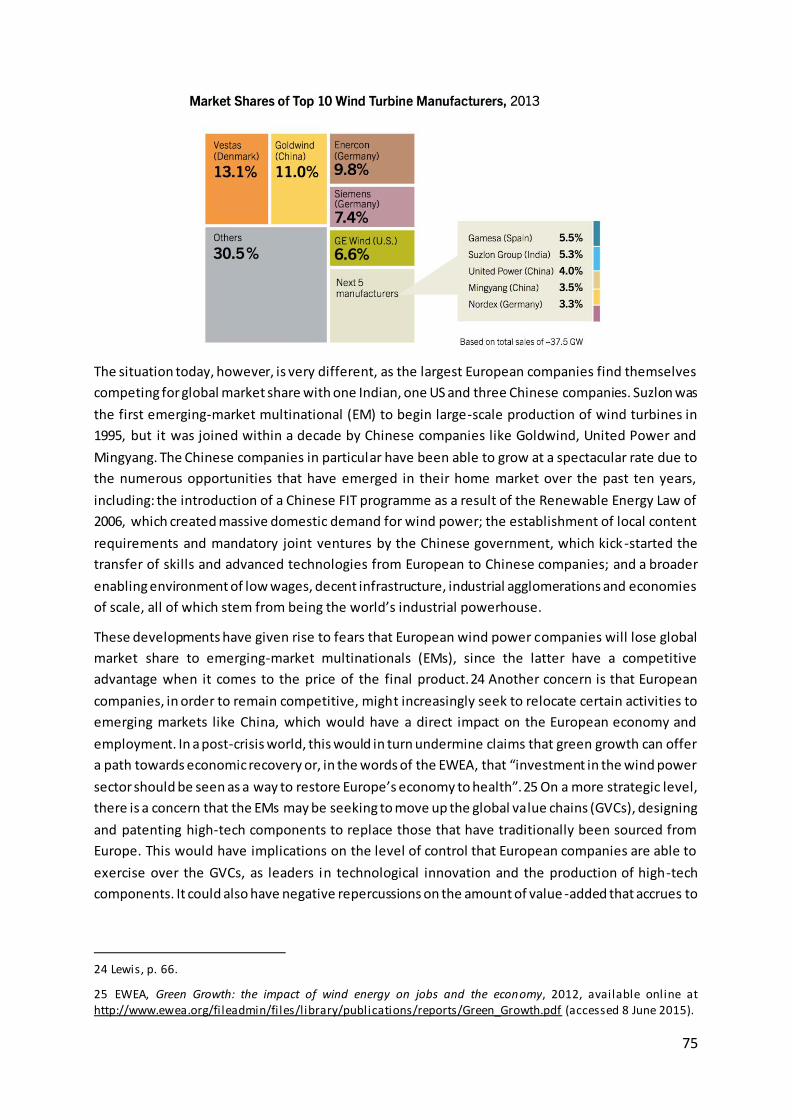
75
The situation today, however, is very different, as the largest European companies find themselves
competing for global market share with one Indian, one US and three Chinese companies. Suzlon was
the first emerging-market multinational (EM) to begin large-scale production of wind turbines in
1995, but it was joined within a decade by Chinese companies like Goldwind, United Power and
Mingyang. The Chinese companies in particular have been able to grow at a spectacular rate due to
the numerous opportunities that have emerged in their home market over the past ten years,
including: the introduction of a Chinese FIT programme as a result of the Renewable Energy Law of
2006, which created massive domestic demand for wind power; the establishment of local content
requirements and mandatory joint ventures by the Chinese government, which kick -started the
transfer of skills and advanced technologies from European to Chinese companies; and a broader
enabling environment of low wages, decent infrastructure, industrial agglomerations and economies
of scale, all of which stem from being the world’s industrial powerhouse.
These developments have given rise to fears that European wind power companies will lose global
market share to emerging-market multinationals (EMs), since the latter have a competitive
advantage when it comes to the price of the final product.24 Another concern is that European
companies, in order to remain competitive, might increasingly seek to relocate certain activities to
emerging markets like China, which would have a direct impact on the European economy and
employment. In a post-crisis world, this would in turn undermine claims that green growth can offer
a path towards economic recovery or, in the words of the EWEA, that “investment in the wind power
sector should be seen as a way to restore Europe’s economy to health”.25 On a more strategic level,
there is a concern that the EMs may be seeking to move up the global value chains (GVCs), designing
and patenting high-tech components to replace those that have traditionally been sourced from
Europe. This would have implications on the level of control that European companies are able to
exercise over the GVCs, as leaders in technological innovation and the production of high-tech
components. It could also have negative repercussions on the amount of value -added that accrues to
24 Lewis, p. 66.
25 EWEA, Green Growth: the impact of wind energy on jobs and the economy, 2012, available online at http://www.ewea.org/fileadmin/files/library/publications/reports/Green_Growth.pdf (accessed 8 June 2015).
76
the European economy. Following sections will examine these concerns and attempt to determine
the impact of recent changes in GVCs on European objectives.
In fact, EM’s integration into the GVC has historically been achieved through specialisation in low -
cost, labour-intensive activities and a focus on domestic markets, coupled with the import of high-
tech components from Europe. Only later did some firms seek to develop a knowledge -base to
manufacture (and eventually develop their own) high-tech components, through the purchase of
licenses and / or the acquisition of companies with strong R&D and a his tory of technological
innovation. Suzlon, for example, initially relied on licenses to manufacture technologies developed by
Sudwind in Germany, before completing strategic acquisitions of Sudwind in 2002 and REpower in
2007, both of which were leaders in the field of technological innovation and wind turbine design.26
Goldwind followed a similar trajectory, obtaining licenses from REpower and Vensys, before
completing a strategic acquisition of Vensys in 2008.27 Although both companies have secured
access to European technologies and are therefore in a good position to engage in international
competition in this area, most R&D and technological innovation still occurs on European soil, and
evidence suggests that EMs have struggled to impose themselves on the high-tech segments of the
value chain. Suzlon has recently taken a decision, for example , to sell its German unit (Senvion,
formerly REpower) for €1 billion, having bought it for €1,32 billion in 2007, in order “to service its
mammoth debt pile”, reorient its strategy away from “high-profile overseas acquisitions” and
“empire-building”, back towards “higher-growth regions such as the domestic market.“28 Chinese
firms have also chosen to focus on the less demanding domestic market, where their weaknesses –
shorter warranties, limited after-sale service, and some persistent shortcomings in quality – pose less
of a problem than in Europe, where industry standards are typically stringent and complex. 29
It is nevertheless important to explore the risks and opportunities that have emerged as a result of
the increasing presence of emerging market players in the various segments of the GVC. How should
Europe respond to new challenges in the sector and how can it best position itself in order to reap
the benefits from the wind power GVC? Two strategies have been proposed in the Terms of
Reference for this paper: in the first, business-as-usual (BAU) scenario, Europe attempts to maintain
its leadership in technological innovation in order to capture a significant proportion of value -added
within the global wind energy value chain; in the second scenario, Europe and France attempt to
“repatriate” a number of industrial activities in order to boost domestic employment and
manufacturing capacity. The conclusion that will be drawn from the analysis that follows is that
neither of these strategies is well suited to the global wind energy value chain as it exists today, and
that a different approach is needed to promote European interests in this sector. The suggested
approach would recognise that the liberalisation of international markets can play an important rol e
in promoting the economic and the environmental objectives of both Europe and China, because
26 Ravi Ramamurti and Jitendra V. Singh (eds.), Emerging Multinationals in Emerging Markets, Cambridge University Press, Cambridge, 2009, Kindle Edition.
27 Lewis, p. 124.
28 Avantika Chilkoti, Suzlon sells German unit to Centerbridge for €1bn , Financial Times, January 22nd 2015, available online at http://www.ft.com/intl/cms/s/0/d5351544-a1fa-11e4-bbb8-
00144feab7de.html#axzz3cTsEsMHY, (accessed 8 June 2015).
29 Lewis, p. 139.
77
there is scope for mutual gains through international trade in wind turbine components. Although it
may be tempting to protect domestic markets in order to support domestic industries, this could
actually end up harming the long-term interests of Europe and France. Instead, policies could seek to
maximise the gains from trade and to harness the “green race” as a tool for long-term economic
development and climate change mitigation.
Section II – Defining the objectives
Effective strategic action presupposes that one or more objective(s) have been clearly defined in
advance. For the purpose of this paper, the broad objectives have been organised into three
categories: environmental, economic and strategic.
Environmental objectives – Government support for wind power generation in Europe was first
designed to incentivise the development of a commercially viable alternative to fossil fuels. Whereas
the combustion of coal and natural gas result in the emission of CO2, which acts as a Green House
Gas (GHG) and contributes to climate change, wind turbines harness a renewable natural resource
for power generation, producing few harmful by-products and thus causing less environmental
damage than conventional fuel-based plants. A transition towards the use of renewable energy
sources for electricity generation has an indispensable role to play in limiting anthropogenic global
temperature increases to +2C. In Europe, wind power alone is claimed to have contributed to
avoiding 140 million metric tonnes of CO2 emissions by 2012 and is projected to avoid a further 200
million metric tonnes by 2020.30 The main instruments that have been used to promote wind power
in Europe are “feed-in tariffs, feed-in premiums, quota obligations, tax exemptions, tenders, and
investment aid”.31 Public support for R&D is another fundamental pillar in the development of green
technologies for power generation.
As a result of these support policies and the incentives provided by the main markets for clean
energy, companies have been able to bring down the levelised cost of electricity (LCOE) generated by
wind turbines through technological improvements, economies of scale and the optimisation of
manufacturing, logistics, project development and O&M functions. 32 Wind power has begun to
demonstrate its potential as a competitor to fossil fuels, reaching grid parity in a number of locations
with strong winds and low costs. However, the rapid diffusion of these gains into international
markets has often found itself hampered by market barriers, erected with a view to secure the
economic benefits of green industries. There are areas, therefore, where the environmental
objectives that first gave birth to the wind power sector can be compromised by economic self -
interest, which is the second major policy objective associated with the wind power sector.
30 EWEA poster
31 EU document
32 O&M: Operations and Maintenance.
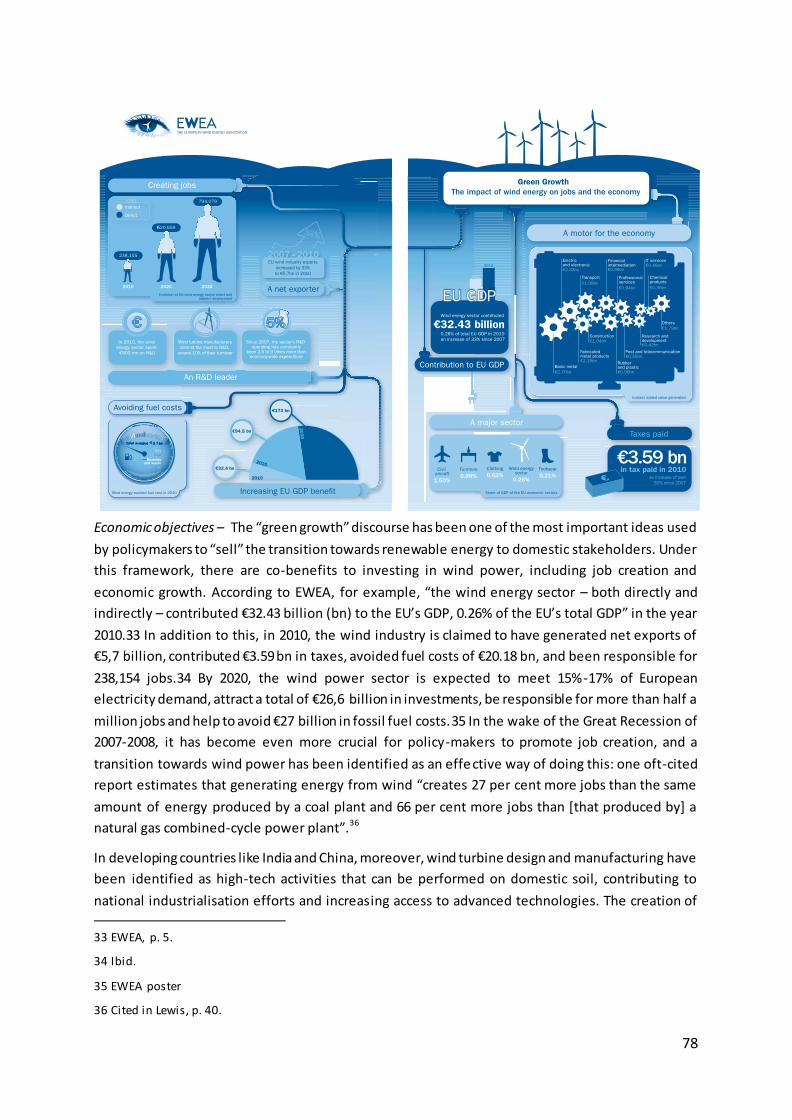
78
Economic objectives – The “green growth” discourse has been one of the most important ideas used
by policymakers to “sell” the transition towards renewable energy to domestic stakeholders. Under
this framework, there are co-benefits to investing in wind power, including job creation and
economic growth. According to EWEA, for example, “the wind energy sector – both directly and
indirectly – contributed €32.43 billion (bn) to the EU’s GDP, 0.26% of the EU’s total GDP” in the year
2010.33 In addition to this, in 2010, the wind industry is claimed to have generated net exports of
€5,7 billion, contributed €3.59 bn in taxes, avoided fuel costs of €20.18 bn, and been responsible for
238,154 jobs.34 By 2020, the wind power sector is expected to meet 15%-17% of European
electricity demand, attract a total of €26,6 billion in investments, be responsible for more than half a
million jobs and help to avoid €27 billion in fossil fuel costs.35 In the wake of the Great Recession of
2007-2008, it has become even more crucial for policy-makers to promote job creation, and a
transition towards wind power has been identified as an effective way of doing this: one oft-cited
report estimates that generating energy from wind “creates 27 per cent more jobs than the same
amount of energy produced by a coal plant and 66 per cent more jobs than [that produced by] a
natural gas combined-cycle power plant”.36
In developing countries like India and China, moreover, wind turbine design and manufacturing have
been identified as high-tech activities that can be performed on domestic soil, contributing to
national industrialisation efforts and increasing access to advanced technologies. The creation of
33 EWEA, p. 5.
34 Ibid.
35 EWEA poster
36 Cited in Lewis, p. 40.
79
national champions in this promising sector can, in turn, allow these economies to integrate
themselves into the global marketplace and provide them with significant opportunities for economic
and social development. Ramamurti and Singh (2009), for example, use Suzlon as an example of how
an EM can leverage “the technological know-how of leading European nations” and couple them
“with low-cost manufacturing and engineering in China and India” in order to “serve an emerging
global market”.37 Positive spillovers are numerous: in addition to its contributions to job creation,
economic growth, technology transfer, and national pride, wind power can also increase access to
electricity in remote areas, since wind power generation (in conjunction with mini-grids) is more
easily decentralised. Emerging countries have therefore demonstrated intense levels of interest in
localising wind turbine design and manufacturing activities. Their relative success in competing w ith
more established, European companies has led some observers to adopt adversarial vocabulary to
describe the phenomenon of the “Green Race”.
Strategic objectives – The last objective that should be borne in mind in our approach to wind GVCs is
a strategic one. Leadership in R&D / innovation and control of intellectual property rights (IPRs) over
key technologies currently allow Europeans to exercise a degree of control over the value chain as a
whole, since these segments of the value chain determine the rate of progress in the industry, the
competitiveness of wind power generation vis-à-vis other technologies, the emergence of new
business opportunities, and so on. Some key raw materials also have strategic value, including the
rare earths that are used in direct-drive turbines (without gearboxes) and are controlled by China,
which accounts for 95%-97% of world production.38 On a more general note, it is crucial for
companies to maintain a diverse range of suppliers in order to ensure access to components that
could become scarce in the event of an external shock. Some stakeholders, moreover, may consider
it important to source select components from domestic suppliers, in order to hedge against
geopolitical risks. As Europe progresses towards its target of generating 28,5% or more of its power
from wind in 2030, all of the above may acquire increasing prominence in discussions concerning
European energy security and soft power.
Section III – International Trade in Wind Turbine Components: Risks and Opportunities
The previous section outlined two objectives for Europe and for France in particular – environment
and economic – with respect to its industrial strategy. This section now examines some of the main
opportunities and risks for achieving those objectives.
Risk: The dangerous attraction of Local Content Requirements.
Many countries with renewable energy deployment policies also implement Local Content
Requirements (LCRs). LCRs are illegal under WTO law for direct support schemes, but may be legal i f
37 Ramamurti and Singh.
38 Voituriez, Muddle Over Green Race
80
set as part public procurement conditions (ICTSD, 2013). LCRs are often motivated by a range of
arguments, such as to generate employment, technological learning and improvements in national
productivity, and potential to increase global competition in component manufacturing in the long
run. On the other hand, there are concerns that LCRs can have a number of negative unintended
consequences. For instance, LCRs necessarily lead to higher costs for deployment of renewable
energy and thus for energy consumers in the short run and this may limit deployment and thus
environmental benefits. Secondly, LCRs may restrict competition and raise energy costs for
consumers even in the long run if they create the conditions for regulatory capture. Thirdly, LCRs
may allocate productive labor and capital inefficiently, leading to lower aggregate economic
productivity, growth and higher inequality.
Unfortunately, the ex-post literature on the experience of LCRs for renewable energy and for wind in
particular is very limited an inconclusive on the benefits and costs of LCRs. There is nevertheless a
significant amount of literature that suggests that import-substituting industrialization – a policy
approach to trade close relation to LCRs – has produced uneven results (Krugman and Obstfeld,
2002). More specifically, both existing theoretical literature on LCRs (cf. ICTSD, 2013) and a closer
analysis of the wind sector, suggests that there is likely to be a relatively precise set of pre -conditions
that need to be checked before LCRs should be implemented.
The size and stability of the final market for wind components. If the market is large, then
the higher upfront investment cost in developing a domestic industry from scratch for
producing all components is more likely to be subject to higher economies of scale.
An honest evaluation of existing industrial capacities. If the home market is a long way
from being capable producing a certain component at high quality, then restrictive LCRs are
likely to add significant costs for energy consumers while running a high risk of failure to
generate a competitive world class industry in an acceptable timeframe.
The coordination of the implementation of LCRs with industry and investors. If LCRs are
introduced gradually and predictably, then industry will tend to have more time to adapt
and create the necessary supply chain. They will also be able to highlight where LCR
restrictions are likely to pose problems and raise costs for deployment and thus for energy
consumers.
The targeting of LCRs: are LCRs targeted to those parts of the value chain that are likely to
generate the most employment and long-run competition benefits for consumers, or are
they applied in an indiscriminate manner? In the case of onshore wind, since around 40% of
value added is produced in the actually installation and maintenance of turbines, and a
large share of value added in contained in the technically complex nacelles, is a restrictive
focus on high LCRs on manufacturing of components the best way to promote diffusion and
employment?
Is there a clear set of objectives for the LCRs and thus a clear review and phase out
strategy once they have achieved (or not achieved) their aim?
A survey of the available evidence suggests that there is reason to be concerned that many LCRs are
not implemented in accordance with these principles. For instance, ICTSD (2013) analysed LCRs in 12
countries and find that “most countries using them base their policy choices on political motivations,
81
rather than on economic and empirical analyses, which remain largely absent in the case of LCRs.”39
There is also evidence that LCRs in some countries, such as Brazil are extremely costly and are
consequently inhibiting the market for wind deployment. For instance, Brazil’s average wind turbine
costs have been estimated at 30% higher than those in Europe as a result of its 60% LCRs for onshore
wind turbines. Key regions where wind is competitive have also reportedly struggled to compete with
new coal-fired power plant. Brazil has recently raised the possibility of increasing its LCR ratios for
onshore wind turbines to 100%.
In principle, LCRs may be circumvented by European firms engaging in foreign directive investment in
local plant. There is evidence of this in Brazil, for instance, where Vestas and Gamesa have set up
local operations to supply the market directly while meeting local content requirements. Moreover,
FDI can be a more effective way to drive technology transfer. However, FDI may be excessively
expensive relative to importing key components if the local market is small and fixed costs of FDI
cannot be spread over large and predictable demand. Firms may also be reticent to engage on FDI of
the local market conditions are too unfavourable. For instance, our interviews reveale d that some
European wind turbine manufacturers had pulled out of China because of perceived bias in the
awarding of competitive contracts by local authorities towards lower quality and higher cost local
producers. Finally, limits on the local available of skilled labour and important value chain
component producers can still render FDI unattractive for European firms. This can in turn lead to a
backlog of orders that are unfulfilled and thus slow diffusion and therefore also employment linked
to other parts of the wind power value chain.
Opportunity: Exploiting natural barriers to trade: a low-risk, light-touch industrial policy
However, more fundamentally, one must also question the empirical logic of LCRs for the wind
power deployment sector given that there are in fact many natural barriers to trade for many key
components of wind turbines. For instance, the size and shape of both blades, completed nacelles
and towers, means that they are difficult and expensive to containerize and ship and even t o
transport domestically. Moreover, local investors in domestic wind farms typically like to have a
reliable local supply chain for components to ensure quality, timeliness of delivery, availability of
after sale services, etc. Thus there is typically a strong pre-existing economic case for the
development of domestic industry to produce many wind components irrespective of LCRs.
Goods with tradeable potential will tend to be those components that are both high value but
relatively small or low-weight, such as key components inside the nacelle of a wind turbine. It is here
that local content requirements may present some promise of long term gains in terms of domestic
value added for countries that are able to develop high quality and low-average cost production of
these parts.
39 P.9 Jan-Christoph Kuntze and Tom Moerenhout (May 2013) Local Content Requirements And The
Renewable Energy Industry - A Good Match? (SETA), ICSTD, Geneva,
82
However, for the reasons just-described, not all markets will able or well-positioned to do so in the
short or medium-term, let alone support the R&D investment required to be durably competitive
industry in tradeable, high tech components. Thus, it is here that ill-advised LCRs could do the most
damage the diffusion of wind technologies and thus other parts of the value chain contributing to
growth and employment. Therefore, policy-makers looking to promote employment and value added
from wind power technology, may be better advised to aim, as a first low-risk step, to foster the
favourable local conditions for a domestic supply chain to develop for those parts of the value chain
that naturally would be less costly if produced local ly and which are less R&D intensive. This requires
stable and efficient deployment policies (to ensure stable demand for the supply chain to develop).
Secondly, it may require identification and guidance to local manufacturers with relevant skills to
facilitate entry into the domestic wind supply chain. The French example of Windustry is an
interesting model in this regard.
Opportunity: Domestic markets
There is a lot of attention given to the “globalized” nature of world markets, however, it is likely that
even in the long run, Europe will remain the biggest market for European firms to sell wind
technology components. This partly reflects the natural barriers to trade in key components of the
wind-value chain described above. It also partly reflects regulatory constraints and technological
catch up in large foreign markets (such as North America or China) that are likely to lead to an
enduring competitive position by local firms in those markets (at least for onshore wind, for offshore
wind Europe arguable has an important first mover advantage).
In this context, Europe’s domestic market becomes all -the-more important. A robust domestic
market can enable three things: Firstly, a healthy domestic market in Europe ensures that Europe can
fully exploit the lion’s share of European employment and value generating potential linked to the
entire value chain for wind farm deployment.
Secondly, a strong domestic market is important for innovation to maintain a competitive edge in
high tech components. The wind technology sector is highly R&D intensive, with some interviewees
suggesting that around 25% of their costs were linked to R&D. The greater is the sales volume of
European firms, the greater is the capacity of these firms to continue to have free cashflow to invest
in R&D. Moreover, a significant amount of innovation in the sector in the future is starting to be
linked to developing technologies that facilitate integration of high shares of wind into the power
system – e.g. slow wind technologies, virtual power plants, storage options, forecasting tools, etc.
Thus, there are important synergies between the overall level of wind deployment and the kind of
innovation that is undertaken by European firms and thus, in turn, the innovative edge of EU firms in
new wind technologies.
Thirdly, where entry into foreign markets is limited and exposes firms to high risks, a robust domestic
base can help to maintaining revenue stability and protect company-wide returns on investment.
This may be important to maintaining long-run readiness to enter and exploit new opportunities
abroad as they present themselves.
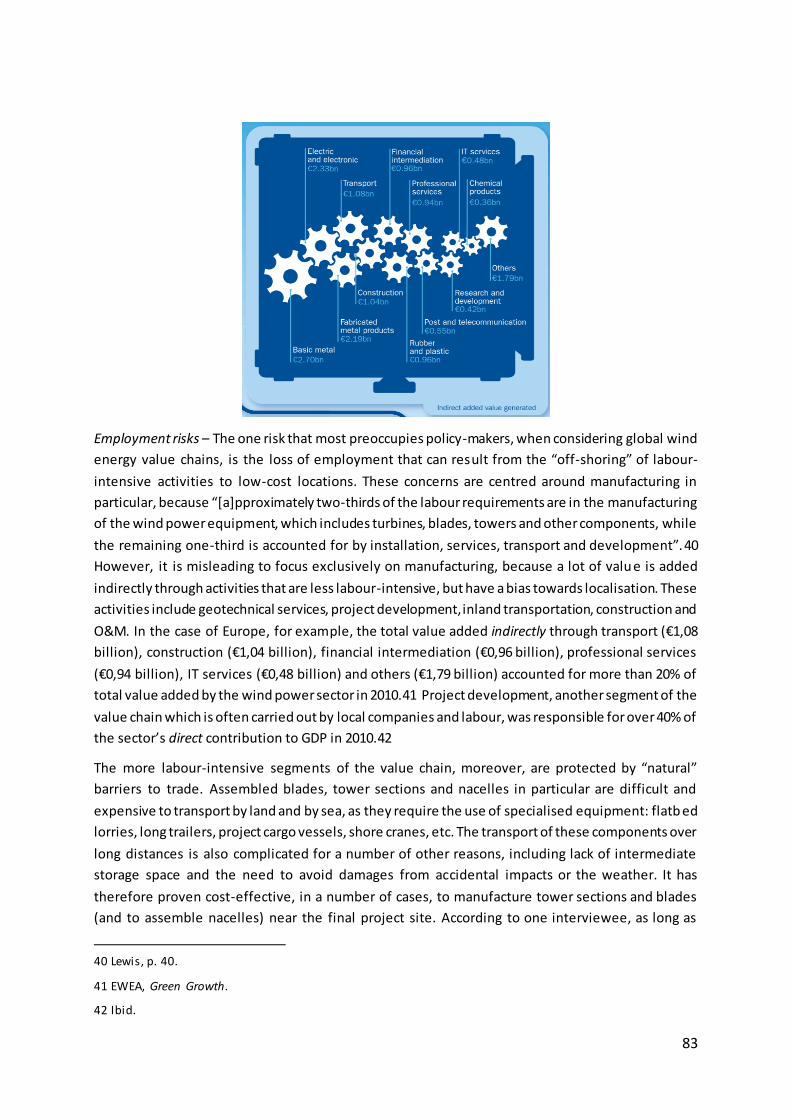
83
Employment risks – The one risk that most preoccupies policy-makers, when considering global wind
energy value chains, is the loss of employment that can result from the “off-shoring” of labour-
intensive activities to low-cost locations. These concerns are centred around manufacturing in
particular, because “[a]pproximately two-thirds of the labour requirements are in the manufacturing
of the wind power equipment, which includes turbines, blades, towers and other components, while
the remaining one-third is accounted for by installation, services, transport and development”.40
However, it is misleading to focus exclusively on manufacturing, because a lot of valu e is added
indirectly through activities that are less labour-intensive, but have a bias towards localisation. These
activities include geotechnical services, project development, inland transportation, construction and
O&M. In the case of Europe, for example, the total value added indirectly through transport (€1,08
billion), construction (€1,04 billion), financial intermediation (€0,96 billion), professional services
(€0,94 billion), IT services (€0,48 billion) and others (€1,79 billion) accounted for more than 20% of
total value added by the wind power sector in 2010.41 Project development, another segment of the
value chain which is often carried out by local companies and labour, was responsible for over 40% of
the sector’s direct contribution to GDP in 2010.42
The more labour-intensive segments of the value chain, moreover, are protected by “natural”
barriers to trade. Assembled blades, tower sections and nacelles in particular are difficult and
expensive to transport by land and by sea, as they require the use of specialised equipment: flatb ed
lorries, long trailers, project cargo vessels, shore cranes, etc. The transport of these components over
long distances is also complicated for a number of other reasons, including lack of intermediate
storage space and the need to avoid damages from accidental impacts or the weather. It has
therefore proven cost-effective, in a number of cases, to manufacture tower sections and blades
(and to assemble nacelles) near the final project site. According to one interviewee, as long as
40 Lewis, p. 40.
41 EWEA, Green Growth.
42 Ibid.
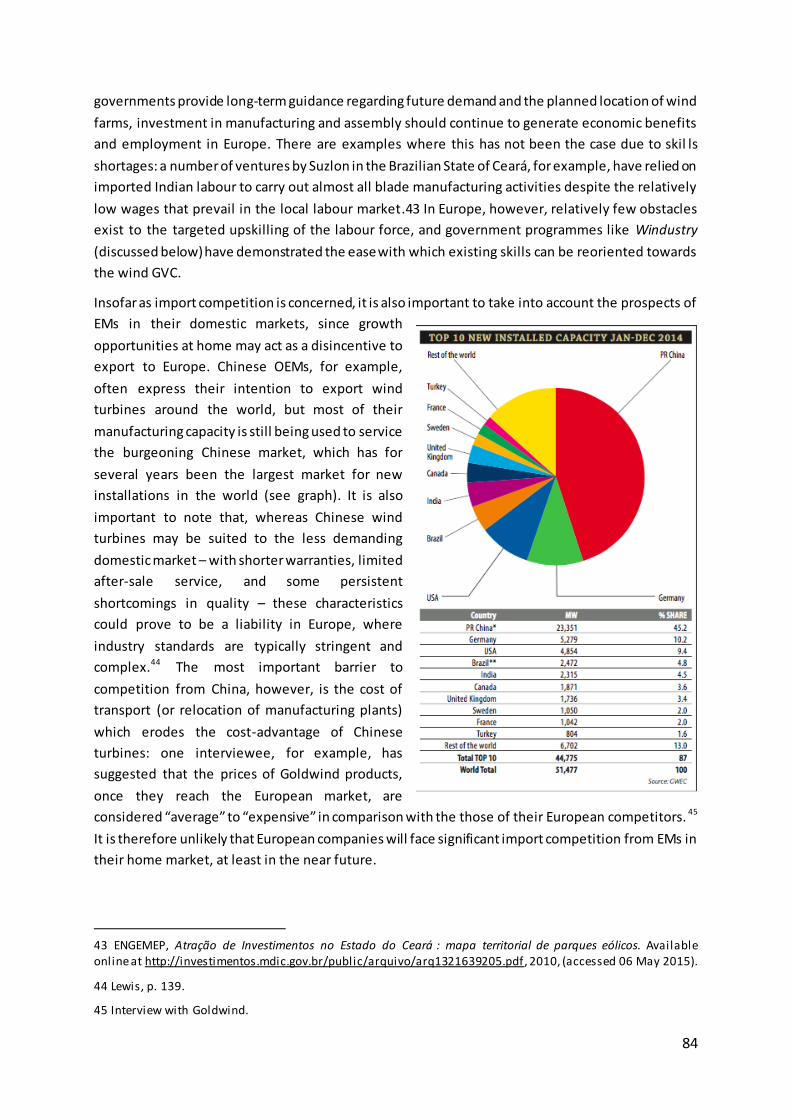
84
governments provide long-term guidance regarding future demand and the planned location of wind
farms, investment in manufacturing and assembly should continue to generate economic benefits
and employment in Europe. There are examples where this has not been the case due to skil ls
shortages: a number of ventures by Suzlon in the Brazilian State of Ceará, for example, have relied on
imported Indian labour to carry out almost all blade manufacturing activities despite the relatively
low wages that prevail in the local labour market.43 In Europe, however, relatively few obstacles
exist to the targeted upskilling of the labour force, and government programmes like Windustry
(discussed below) have demonstrated the ease with which existing skills can be reoriented towards
the wind GVC.
Insofar as import competition is concerned, it is also important to take into account the prospects of
EMs in their domestic markets, since growth
opportunities at home may act as a disincentive to
export to Europe. Chinese OEMs, for example,
often express their intention to export wind
turbines around the world, but most of their
manufacturing capacity is still being used to service
the burgeoning Chinese market, which has for
several years been the largest market for new
installations in the world (see graph). It is also
important to note that, whereas Chinese wind
turbines may be suited to the less demanding
domestic market – with shorter warranties, limited
after-sale service, and some persistent
shortcomings in quality – these characteristics
could prove to be a liability in Europe, where
industry standards are typically stringent and
complex.44 The most important barrier to
competition from China, however, is the cost of
transport (or relocation of manufacturing plants)
which erodes the cost-advantage of Chinese
turbines: one interviewee, for example, has
suggested that the prices of Goldwind products,
once they reach the European market, are
considered “average” to “expensive” in comparison with the those of their European competitors. 45
It is therefore unlikely that European companies will face significant import competition from EMs in
their home market, at least in the near future.
43 ENGEMEP, Atração de Investimentos no Estado do Ceará : mapa territorial de parques eólicos. Available online at http://investimentos.mdic.gov.br/public/arquivo/arq1321639205.pdf, 2010, (accessed 06 May 2015).
44 Lewis, p. 139.
45 Interview with Goldwind.
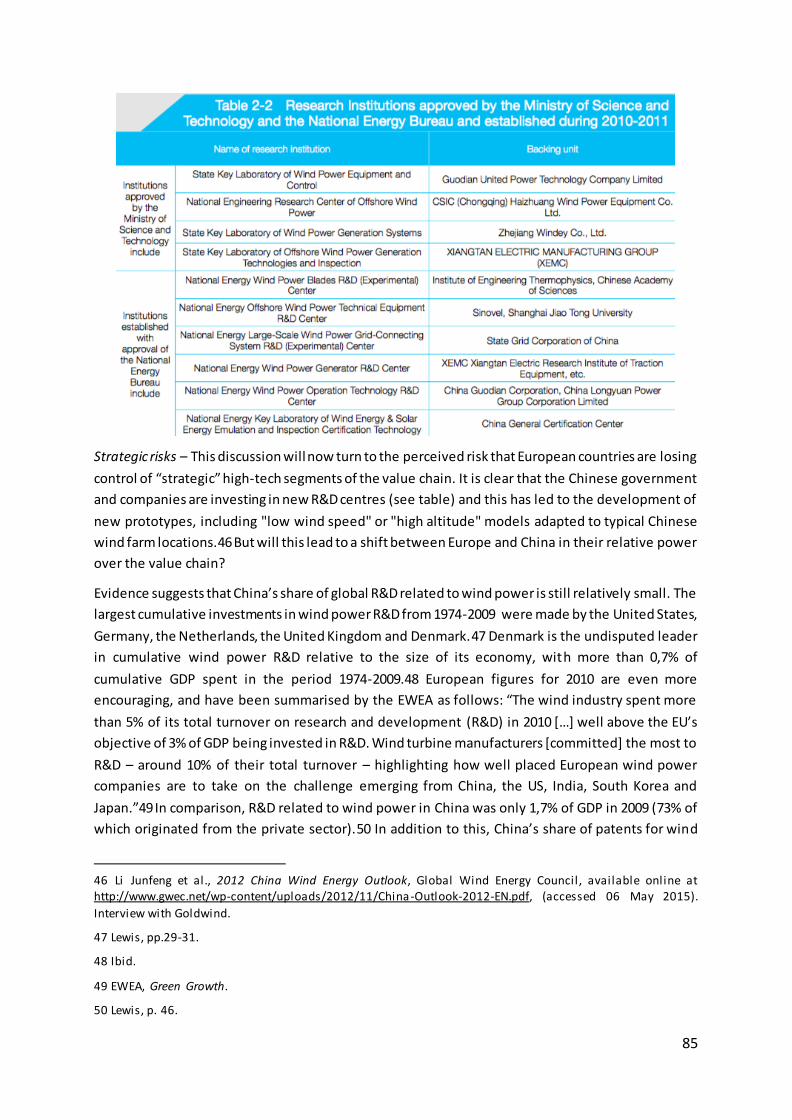
85
Strategic risks – This discussion will now turn to the perceived risk that European countries are losing
control of “strategic” high-tech segments of the value chain. It is clear that the Chinese government
and companies are investing in new R&D centres (see table) and this has led to the development of
new prototypes, including "low wind speed" or "high altitude" models adapted to typical Chinese
wind farm locations.46 But will this lead to a shift between Europe and China in their relative power
over the value chain?
Evidence suggests that China’s share of global R&D related to wind power is still relatively small. The
largest cumulative investments in wind power R&D from 1974-2009 were made by the United States,
Germany, the Netherlands, the United Kingdom and Denmark.47 Denmark is the undisputed leader
in cumulative wind power R&D relative to the size of its economy, with more than 0,7% of
cumulative GDP spent in the period 1974-2009.48 European figures for 2010 are even more
encouraging, and have been summarised by the EWEA as follows: “The wind industry spent more
than 5% of its total turnover on research and development (R&D) in 2010 […] well above the EU’s
objective of 3% of GDP being invested in R&D. Wind turbine manufacturers [committed] the most to
R&D – around 10% of their total turnover – highlighting how well placed European wind power
companies are to take on the challenge emerging from China, the US, India, South Korea and
Japan.”49 In comparison, R&D related to wind power in China was only 1,7% of GDP in 2009 (73% of
which originated from the private sector).50 In addition to this, China’s share of patents for wind
46 Li Junfeng et al., 2012 China Wind Energy Outlook, Global Wind Energy Council, available online at http://www.gwec.net/wp-content/uploads/2012/11/China-Outlook-2012-EN.pdf, (accessed 06 May 2015).
Interview with Goldwind.
47 Lewis, pp.29-31.
48 Ibid.
49 EWEA, Green Growth.
50 Lewis, p. 46.
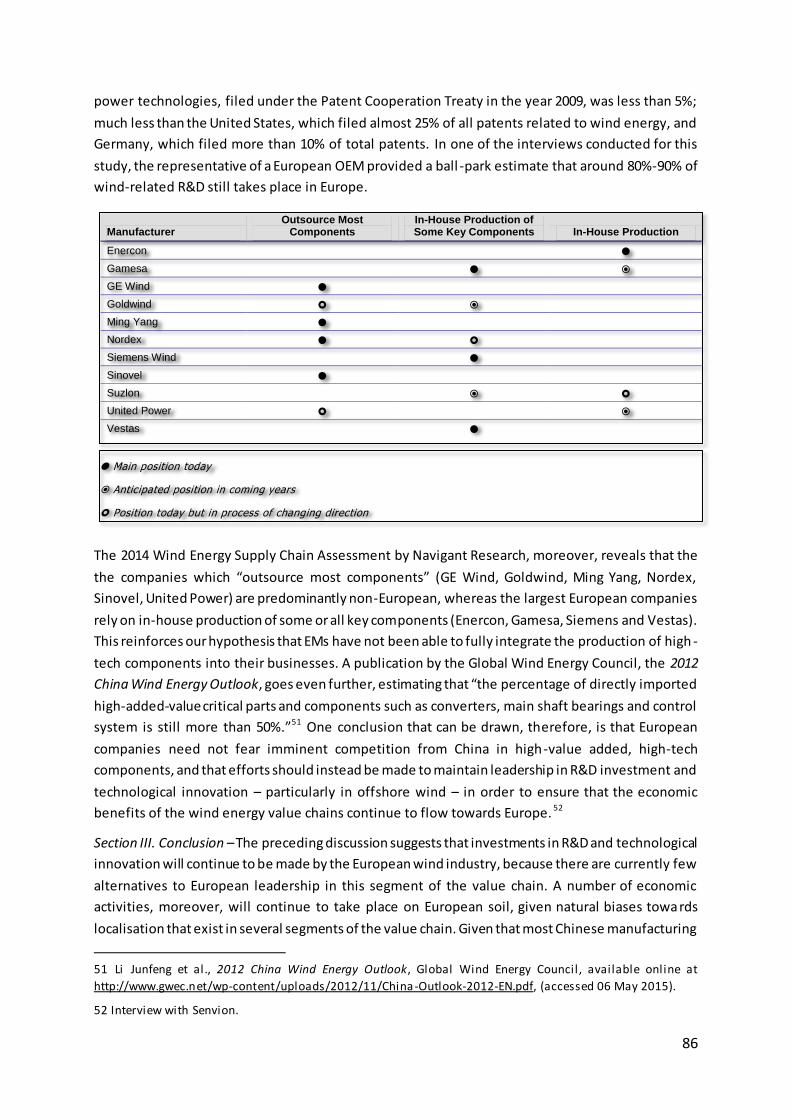
86
power technologies, filed under the Patent Cooperation Treaty in the year 2009, was less than 5%;
much less than the United States, which filed almost 25% of all patents related to wind energy, and
Germany, which filed more than 10% of total patents. In one of the interviews conducted for this
study, the representative of a European OEM provided a ball -park estimate that around 80%-90% of
wind-related R&D still takes place in Europe.
The 2014 Wind Energy Supply Chain Assessment by Navigant Research, moreover, reveals that the
the companies which “outsource most components” (GE Wind, Goldwind, Ming Yang, Nordex,
Sinovel, United Power) are predominantly non-European, whereas the largest European companies
rely on in-house production of some or all key components (Enercon, Gamesa, Siemens and Vestas).
This reinforces our hypothesis that EMs have not been able to fully integrate the production of high -
tech components into their businesses. A publication by the Global Wind Energy Council, the 2012
China Wind Energy Outlook, goes even further, estimating that “the percentage of directly imported
high-added-value critical parts and components such as converters, main shaft bearings and control
system is still more than 50%.”51 One conclusion that can be drawn, therefore, is that European
companies need not fear imminent competition from China in high-value added, high-tech
components, and that efforts should instead be made to maintain leadership in R&D investment and
technological innovation – particularly in offshore wind – in order to ensure that the economic
benefits of the wind energy value chains continue to flow towards Europe. 52
Section III. Conclusion – The preceding discussion suggests that investments in R&D and technological
innovation will continue to be made by the European wind industry, because there are currently few
alternatives to European leadership in this segment of the value chain. A number of economic
activities, moreover, will continue to take place on European soil, given natural biases towards
localisation that exist in several segments of the value chain. Given that most Chinese manufacturing
51 Li Junfeng et al., 2012 China Wind Energy Outlook, Global Wind Energy Council, available online at
http://www.gwec.net/wp-content/uploads/2012/11/China-Outlook-2012-EN.pdf, (accessed 06 May 2015).
52 Interview with Senvion.
Main position today
Anticipated position in coming years
Position today but in process of changing direction
Manufacturer Outsource Most
Components In-House Production of Some Key Components In-House Production
Enercon
Gamesa
GE Wind
Goldwind
Ming Yang
Nordex
Siemens Wind
Sinovel
Suzlon
United Power
Vestas
87
capacity is being used to service the burgeoning Chinese market, there is reason to believe that
import competition is less of a concern in the wind energy sector than it has been in other sectors,
like solar PV. Protection of domestic markets is therefore not the most appropriate way to support
the wind industry, and may even serve to undermine the environmental and economic objectives
that have been outlined above. However, there is still significant scope for policy-makers to support
the growth of the industry through other means. On the one hand, there is a need to ensure that
demand in the domestic market remains strong, to act as a base from which European companies
can develop their businesses and continue to make progress at the technological frontier. As demand
in non-European countries continues to grow, it will also be important to ensure that European
companies are able to access the most promising markets, such as China, the US, India, Brazil and
South Africa. On the supply side, a number of actions could be taken to strengthen the domestic
supply chain without compromising the interests of existing actors. These policy options will be
discussed in more detail below.
Section IV – Policy Recommendations
Domestic demand – The preceding discussion has emphasized the role of domestic demand-side
policies to driving employment, domestic value creation and competitiveness in international
markets. There are three key elements sound demand-side policy for deployment of wind-
technologies:
Credibility and stability of deployment targets,
Effective cost-control policies, and
Innovation sensitive public procurement and tendering processes.
These principles may sound obvious, but they are often implemented ineffectively.
Credibility and stability of medium and longer term targets is crucial to firm-level decision-making on
local investment in the value chain and to allocations to potentially more risky investments in
innovative technologies. Credibility and stability of deployment goals is also crucial to ensuring that
there is effective coordination along the value chain to supply key components and ensure fast and
cost-efficient construction of wind farms. Because they are capital intensive investments linked to
sometimes debt-intensive project finance structures, delays in the pre-operational investment phase
can substantially raise the financing costs of a given wind-farm investment, thus discouraging
investors, reducing competition and requiring higher rates of investment support. This in turn can
weaken momentum for the development of the sector as a whole in a given market.
Because wind technologies are very capital intensive and have higher capex/opex ratios than
conventional technologies, it is critical that investment support and state aid frameworks for
deployment are designed in a way that minimizes capital costs. There are several elements to this,
including the targeted use (or non-use) and design of competitive tendering procedures, the use of
effective long-term price risk mitigating support instruments, the simplicity and efficiency of
permitting procedures, the targeted use of loan guarantees or other financial insturments to
facilitate access to low-cost finance (cf. Sartor et al, 2015 or Rathmann, 2011). By mitigating capital
88
costs and thus the overall cost of deployment of wind technologies, well -designed support
frameworks can help to minimize opposition to wind-power deployment, thus allowing for their
benefits in terms of employment and value added to be maximized.
When new technologies in the wind sector are developed, they are sometimes accompanied by
higher project risks and may have a higher initial cost structure due to the absence of economies of
scale in the production of new innovative components. If these technologies are placed directly into
competition with more mature technologies, they may be unable to compete and thus to gain a
foothold in markets. It is important that, although the wind-power sector is increasingly seen as
being relatively mature technologically, that appropriate scope is kept for technology -specific
tendering or public procurement for new and promising technologies in an otherwise maturing
sector.
International demand – OEMs’ access to a number of international markets for wind power is
currently restricted by explicit or implicit local content requirements (LCRs), which have long been a
feature of support policies targeted at this sector. Under such rules, companies that wish to benefit
from support policies – like FITs, tax exemptions or concessional finance – must prove that a certain
percentage of the content of the wind turbines used in a given project has been produced within
national borders. The enforcement of LCRs (and other regulations with similar effects) is ubiquitous
in developing countries and developed countries alike, as can be seen from the table below. The
degree of protectionist intent behind these policies varies from case to case, but there is evidence to
suggest that most of them serve to encourage or protect domestic actors.
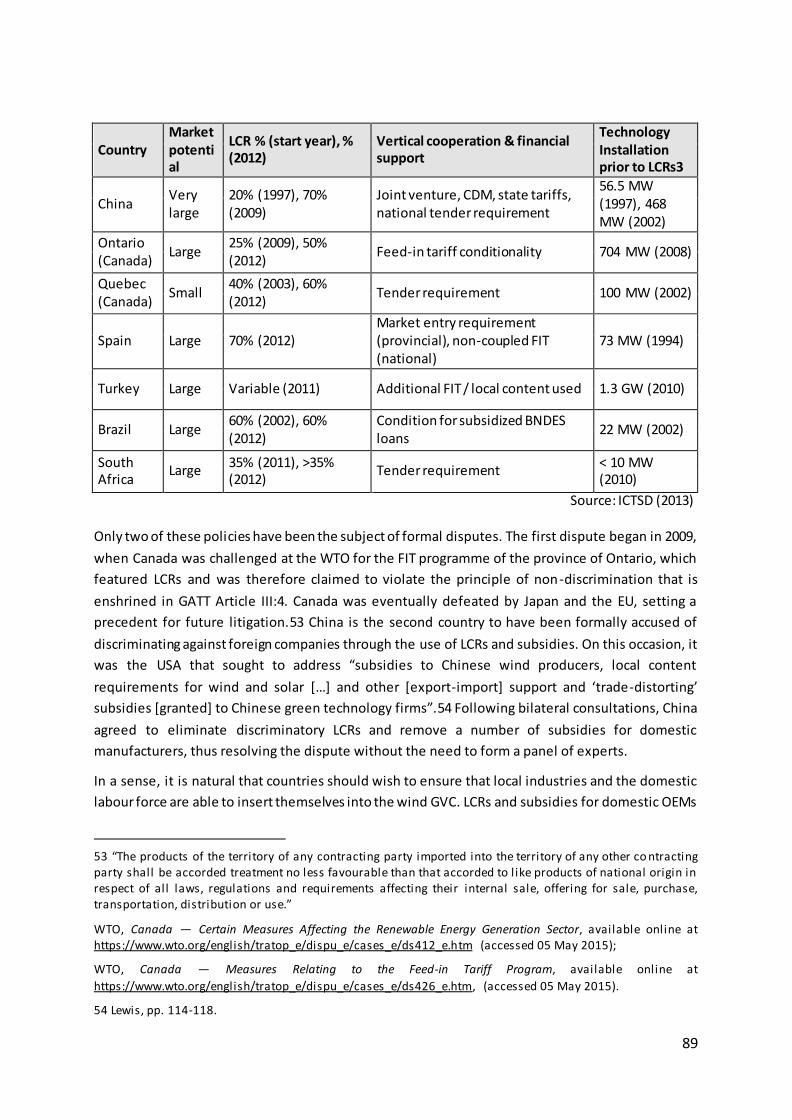
89
Country Market potential
LCR % (start year), % (2012)
Vertical cooperation & financial support
Technology Installation prior to LCRs3
China Very large
20% (1997), 70% (2009)
Joint venture, CDM, state tariffs, national tender requirement
56.5 MW (1997), 468 MW (2002)
Ontario (Canada)
Large 25% (2009), 50% (2012)
Feed-in tariff conditionality 704 MW (2008)
Quebec (Canada)
Small 40% (2003), 60% (2012)
Tender requirement 100 MW (2002)
Spain Large 70% (2012) Market entry requirement (provincial), non-coupled FIT (national)
73 MW (1994)
Turkey Large Variable (2011) Additional FIT / local content used 1.3 GW (2010)
Brazil Large 60% (2002), 60% (2012)
Condition for subsidized BNDES loans
22 MW (2002)
South Africa
Large 35% (2011), >35% (2012)
Tender requirement < 10 MW (2010)
Source: ICTSD (2013)
Only two of these policies have been the subject of formal disputes. The first dispute began in 2009,
when Canada was challenged at the WTO for the FIT programme of the province of Ontario, which
featured LCRs and was therefore claimed to violate the principle of non-discrimination that is
enshrined in GATT Article III:4. Canada was eventually defeated by Japan and the EU, setting a
precedent for future litigation.53 China is the second country to have been formally accused of
discriminating against foreign companies through the use of LCRs and subsidies. On this occasion, it
was the USA that sought to address “subsidies to Chinese wind producers, local content
requirements for wind and solar […] and other [export-import] support and ‘trade-distorting’
subsidies [granted] to Chinese green technology firms”.54 Following bilateral consultations, China
agreed to eliminate discriminatory LCRs and remove a number of subsidies for domestic
manufacturers, thus resolving the dispute without the need to form a panel of experts.
In a sense, it is natural that countries should wish to ensure that local industries and the domestic
labour force are able to insert themselves into the wind GVC. LCRs and subsidies for domestic OEMs
53 “The products of the territory of any contracting party imported into the territory of any other co ntracting party shall be accorded treatment no less favourable than that accorded to l ike products of national origin in respect of all laws, regulations and requirements affecting their internal sale, offering for sale, purchase, transportation, distribution or use.”
WTO, Canada — Certain Measures Affecting the Renewable Energy Generation Sector, available online at https://www.wto.org/english/tratop_e/dispu_e/cases_e/ds412_e.htm (accessed 05 May 2015);
WTO, Canada — Measures Relating to the Feed-in Tariff Program, available online at
https://www.wto.org/english/tratop_e/dispu_e/cases_e/ds426_e.htm, (accessed 05 May 2015).
54 Lewis, pp. 114-118.
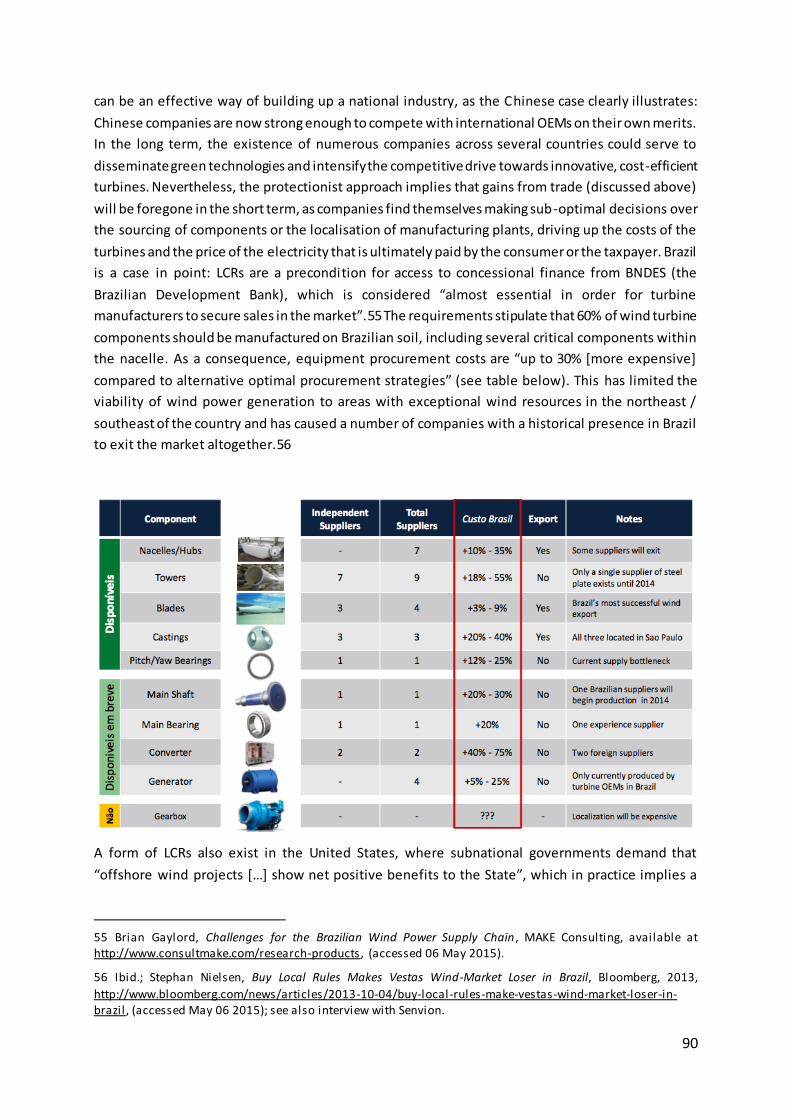
90
can be an effective way of building up a national industry, as the Chinese case clearly illustrates:
Chinese companies are now strong enough to compete with international OEMs on their own merits.
In the long term, the existence of numerous companies across several countries could serve to
disseminate green technologies and intensify the competitive drive towards innovative, cost-efficient
turbines. Nevertheless, the protectionist approach implies that gains from trade (discussed above)
will be foregone in the short term, as companies find themselves making sub-optimal decisions over
the sourcing of components or the localisation of manufacturing plants, driving up the costs of the
turbines and the price of the electricity that is ultimately paid by the consumer or the taxpayer. Brazil
is a case in point: LCRs are a precondition for access to concessional finance from BNDES (the
Brazilian Development Bank), which is considered “almost essential in order for turbine
manufacturers to secure sales in the market”.55 The requirements stipulate that 60% of wind turbine
components should be manufactured on Brazilian soil, including several critical components within
the nacelle. As a consequence, equipment procurement costs are “up to 30% [more expensive]
compared to alternative optimal procurement strategies” (see table below). This has limited the
viability of wind power generation to areas with exceptional wind resources in the northeast /
southeast of the country and has caused a number of companies with a historical presence in Brazil
to exit the market altogether.56
A form of LCRs also exist in the United States, where subnational governments demand that
“offshore wind projects […] show net positive benefits to the State”, which in practice implies a
55 Brian Gaylord, Challenges for the Brazilian Wind Power Supply Chain , MAKE Consulting, available at http://www.consultmake.com/research-products, (accessed 06 May 2015).
56 Ibid.; Stephan Nielsen, Buy Local Rules Makes Vestas Wind-Market Loser in Brazil, Bloomberg, 2013,
http://www.bloomberg.com/news/articles/2013-10-04/buy-local-rules-make-vestas-wind-market-loser-in-brazil , (accessed May 06 2015); see also interview with Senvion.
91
“need to find local sources for offshore wind turbine […] components”.57 In addition to this, the
Merchant Marine Act of 1920 (Jones Act) mandates the use of US flag vessels in the development of
offshore wind farms, further limiting the options available to foreign companies wishing to enter that
market.58 These policies can hardly be claimed to be protecting an “infant industry”, since the USA
already has ample domestic manufacturing capacity and is home to one of the world’s leading OEMs:
GE Wind. Instead, it would seem that the main purpose of such policies is to favour domestic
companies and to create jobs in the State that is providing the support. In contrast to China, LCRs in
the USA and Brazil do not appear to be temporary in nature, as there seems to be little prospect of
their removal, gradual or otherwise, once domestic OEMs have improved their competitiveness and
begin to compete on an equal footing with the more established players. One could argue that these
policies therefore serve little purpose other than to drive up the cost of wind power generation vis-à-
vis the alternatives, by protecting inefficient producers from import competition.
Non-tariff barriers also exist within Europe that implicitly favour local industries, even though the EU
market rules prohibit the use of LCRs and other protectionist policies. In order to apply for a Contract
for Difference in the UK, for example, companies must submit a supply chain plan for the approval of
the Department for Energy and Climate Change, which assesses applications on the basis of three
criteria. Under the first criteria (“competition”) companies must demonstrate that their procurement
processes are competitive and help to “broaden the supply chain”, develop “a wider and therefore
more robust pipeline of suppliers”, remove “barriers to entry” and increase “competition amon gst
suppliers”. The second criteria (“innovation”) also emphasises the need for “new types of
procurement and contracting strategies” to “support less established suppliers”. The third criteria
(“skills”) seeks to promote “investment […] to address the current skills shortages […] through
internal training or working in partnership with education institutions, colleges, institutions, local or
regional authorities, universities, or public or private skills providers”. Private companies, of course,
already have their own reasons to pursue each of these objectives, including the incentive of
increased profit margins (by sourcing more cost-effective components) and reputation (by providing
better quality products and services). It is unlikely that the (rather dirigiste) requirements contained
in these guidelines would render companies more efficient than they already are, so one wonders
what the supply chain plans are really meant to achieve. In an brief discussion with an anonymous
interviewee, it was suggested that such plans were responsible for encouraging foreign companies to
increase investments in the domestic supply chain, in order to boost manufacturing capacity and
employment in the UK.
Other examples abound. Idiosyncratic regulations, like the grid code in Denmark or the DTIP
construction rules in Germany, make it more difficult for foreign companies to compete in these
markets. Spanish provinces enforce “an informal, noninstitutionalized LCR as a condition for project
developers to be allowed market entry […] There is no national LCR policy [but] provincial LCRs [are]
57 Bruce Hamilton, Navigant Consulting, The US Offshore Wind Market: Opportunities and Challenges Faced by
Project Developers in a Brave New World, presented at Copenhagen Offshore 2015 on March 11 2015.
58 ibid.
92
used when governments decide to grant development concessions, [even though they] are often not
formalized in legislation”.59
In view of the above, the ICTSD has carried out an “assessment of the use, potential usefulness and
legality of local content requirements (LCRs) in [renewable energy] policy”. It finds that, while “LCRs
[...] create short-term costs for the industry and [...] inflate retail power prices alike, a medium-term
benefit of increasing competition and innovation on the international market may offset these
costs”, although this trade-off has “not been modelled or demonstrated”. The question remains,
therefore, of what can be done to improve the governance of wind GVCs, in order to maximise the
environmental and economic benefits that the wind power sector can bring to the international
community. According to the ICTSD, “the current stalemate in the WTO’s Doha negotiations,
particularly in efforts to liberalise environmental goods and services, has prevented action to address
barriers to trade in sustainable energy goods and services”, indicating that there is a need for
innovative approaches. The report concludes by supporting calls for a “Sustainable Energy Trade
Agreement (SETA), a stand-alone initiative designed to address barriers to trade and enable a trade
policy-supported energy governance regime, [which could] help clarify existing ambiguities in various
trade rules and agreements as they pertain to sustainable energy and provide focalised governance
through effective, operational provisions”. This paper supports this idea and urges policy -makers to
consider alternatives to the WTO, which has proven too slow to effectively deal with the proliferation
of protectionism related to green technologies.
Supply side | France – the Windustry idea
In order to pass ambitious post-2020 renewable energy support policies in Europe – with the
ultimate aim of reducing GHG emissions and mitigating climate change in accordance with the 2°C
scenario – there is a need to ensure buy-in from all EU Member States, including those that have
hitherto not participated in wind GVCs due to limited R&D and manufacturing capacity. In a post -
crisis context, “green growth” policies still have a role to play in helping governments to meet
economic and environmental objectives, although care should be taken not to resort to the sort of
beggar-thy-neighbour protectionist policies that the EU was designed to eliminate. Windustry is one
example of how this might be done.60
Established by leaders of the European wind industry in collaboration with the French government,
Windustry is an industrial development programme that identifies companies with the potential to
manufacture wind turbine components and attempts to ease their insertion into the wind energy
value chain. Windustry hires expert consultants to advise selected companies on how they might
adapt their existing processes to meet the needs of OEMs, with the objective of creating a domestic
manufacturing industry that can act as a reliable source of crucial components in France, thus
capturing value and creating employment on French soil. So far, the programme has identified
opportunities to manufacture large, low-cost components for which international transport is not a
cost-effective option (e.g. tower sections) and some innovative components that are already in use in
the French aerospace industry (e.g. protective coating for blades). It has also observed that
companies located near final project sites have a competitive advantage in being able to customise
59 ICTSD
60 All of the information on Windustry is from an interview with project manager, David Saint-André.
93
their products at short notice. The main challenges encountered to date have been the absence of
production lines in continuous use and the need to improve companies’ quality control so as to meet
industry standards. Although it is too early to measure the success of this programme, it seems
reasonable to assume that this ‘light-touch’ approach will prove effective in identifying ‘low-hanging
fruit’ without harming the interests of France’s European partners.
Supply side | Europe – the Airbus idea
Another suggested initiative would aim to capitalise on the complementarities between European
countries in order to accelerate the development of the offshore wind industry. 61 Based on the
‘Airbus model’, such an initiative would incentivise the creation of an industrial cluster that could
combine Danish leadership in R&D with German manufacturing expertise, British experience in the
offshore sector, and so on. European companies are the first to have invested significantly in offshore
wind technologies, and competition from non-European competitors is extremely limited. China, for
example, is expected to fall far short of its target to add 5GW of offshore capacity by the end of 2015.
It is therefore reasonable to expect that European companies could benefit from first-mover
advantages (FMA) in the production of offshore wind turbine components, similar to those that led
to European leadership in onshore wind energy markets. In order for this to happen, how ever, it will
be crucial to act with speed and determination, given the global recognition of the sector’s potential
and the increasing ability of EMs to compete for market share and the development of new
technologies. The domestic industrial base needs to grow and adapt, in order for European
companies to benefit from economies of scale and the concomitant cost reductions. It will also be
vital to establish a strong presence in emerging markets with a view to future growth. Strong
demand in the home market and a set of clear incentives for collaboration could provide the
necessary impetus for further progress in offshore wind, which could become yet another success for
renewable energy whilst simultaneously acting as the stimulus for economic growth that Europe so
desperately needs.
61 Interview with Senvion.
94
Chapitre 5
La course aux technologies vertes dans le secteur des énergies solaires
(chapitre en anglais)
95
Structure
1. Introduction 2. PV market outlook 2.1 EU and China in the global PV market 2.2 Projections for 2018-19 PV market: a Chinese leadership 2.3 PV system cost evolution 2.4 PV system components 3. PV industry value chain 3.1 General trend Silicon, wafers, modules, inverters and installation 3.2 PV value chain in Europe 3.3 PV value chain in China 4. Trade 4.1 EU-China PV trade value chain 4.2 China's PV export structure 4.3 China's PV export quality: still processing trade dominated 4.4 Free trade and implications of anti-trade measures 5. Domestic supportive policies in China 5.1 Supporting PV production in early phase 5.2 Insufficient supports on consumption side in early phase 5.3 Increasing supports on consumption in recent years 5.4 A particular focus on distributed PV 5.5 An ambition of building competitive PV industry 6. PV market development in China 6.1 Current challenges Key technologies still depend on import Trade and competitiveness Reduced access to credits Environmental pollution of PV production 6.2 Future orientations Going out strategy: installation of production sites in tier countries From polysilicon to monosilicon
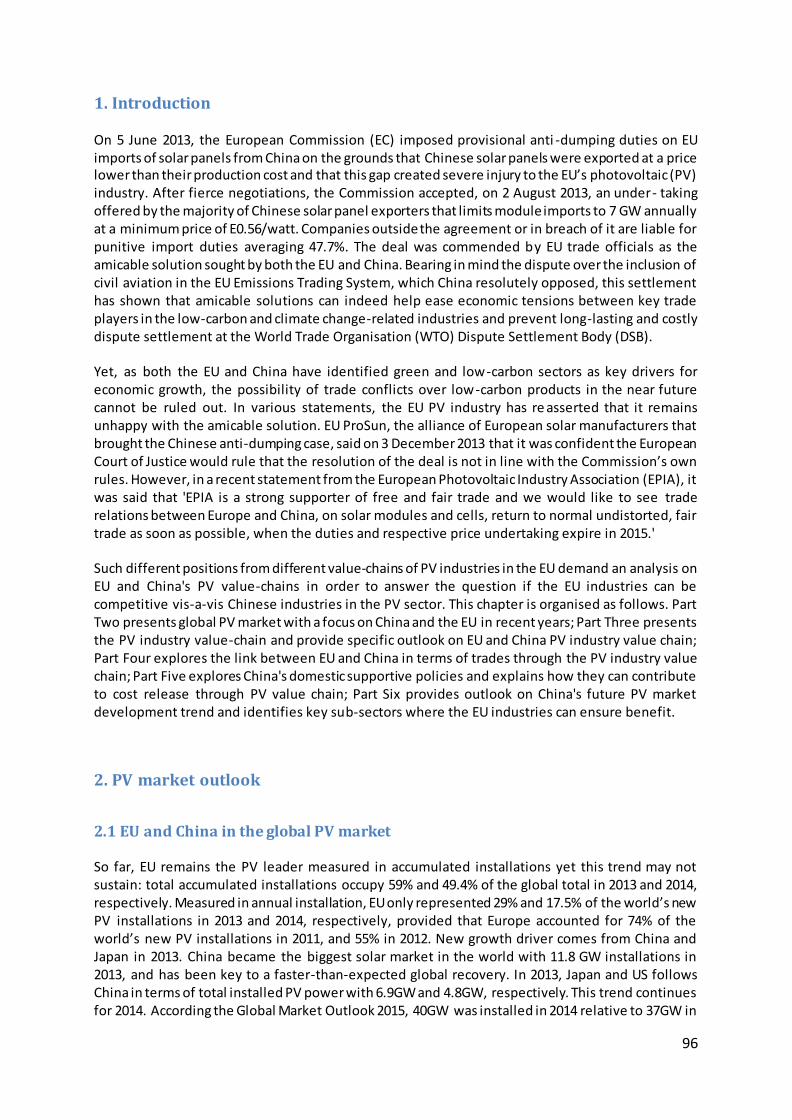
96
1. Introduction On 5 June 2013, the European Commission (EC) imposed provisional anti -dumping duties on EU imports of solar panels from China on the grounds that Chinese solar panels were exported at a price lower than their production cost and that this gap created severe injury to the EU’s photovoltaic (PV) industry. After fierce negotiations, the Commission accepted, on 2 August 2013, an under- taking offered by the majority of Chinese solar panel exporters that limits module imports to 7 GW annually at a minimum price of E0.56/watt. Companies outside the agreement or in breach of it are liable for punitive import duties averaging 47.7%. The deal was commended by EU trade officials as the amicable solution sought by both the EU and China. Bearing in mind the dispute over the inclusion of civil aviation in the EU Emissions Trading System, which China resolutely opposed, this settlement has shown that amicable solutions can indeed help ease economic tensions between key trade players in the low-carbon and climate change-related industries and prevent long-lasting and costly dispute settlement at the World Trade Organisation (WTO) Dispute Settlement Body (DSB). Yet, as both the EU and China have identified green and low-carbon sectors as key drivers for economic growth, the possibility of trade conflicts over low-carbon products in the near future cannot be ruled out. In various statements, the EU PV industry has re asserted that it remains unhappy with the amicable solution. EU ProSun, the alliance of European solar manufacturers that brought the Chinese anti-dumping case, said on 3 December 2013 that it was confident the European Court of Justice would rule that the resolution of the deal is not in line with the Commission’s own rules. However, in a recent statement from the European Photovoltaic Industry Association (EPIA), it was said that 'EPIA is a strong supporter of free and fair trade and we would like to see trade relations between Europe and China, on solar modules and cells, return to normal undistorted, fair trade as soon as possible, when the duties and respective price undertaking expire in 2015.' Such different positions from different value-chains of PV industries in the EU demand an analysis on EU and China's PV value-chains in order to answer the question if the EU industries can be competitive vis-a-vis Chinese industries in the PV sector. This chapter is organised as follows. Part Two presents global PV market with a focus on China and the EU in recent years; Part Three presents the PV industry value-chain and provide specific outlook on EU and China PV industry value chain; Part Four explores the link between EU and China in terms of trades through the PV industry value chain; Part Five explores China's domestic supportive policies and explains how they can contribute to cost release through PV value chain; Part Six provides outlook on China's future PV market development trend and identifies key sub-sectors where the EU industries can ensure benefit.
2. PV market outlook
2.1 EU and China in the global PV market So far, EU remains the PV leader measured in accumulated installations yet this trend may not sustain: total accumulated installations occupy 59% and 49.4% of the global total in 2013 and 2014, respectively. Measured in annual installation, EU only represented 29% and 17.5% of the world’s new PV installations in 2013 and 2014, respectively, provided that Europe accounted for 74% of the world’s new PV installations in 2011, and 55% in 2012. New growth driver comes from China and Japan in 2013. China became the biggest solar market in the world with 11.8 GW installations in 2013, and has been key to a faster-than-expected global recovery. In 2013, Japan and US follows China in terms of total installed PV power with 6.9GW and 4.8GW, respectively. This trend continues for 2014. According the Global Market Outlook 2015, 40GW was installed in 2014 relative to 37GW in
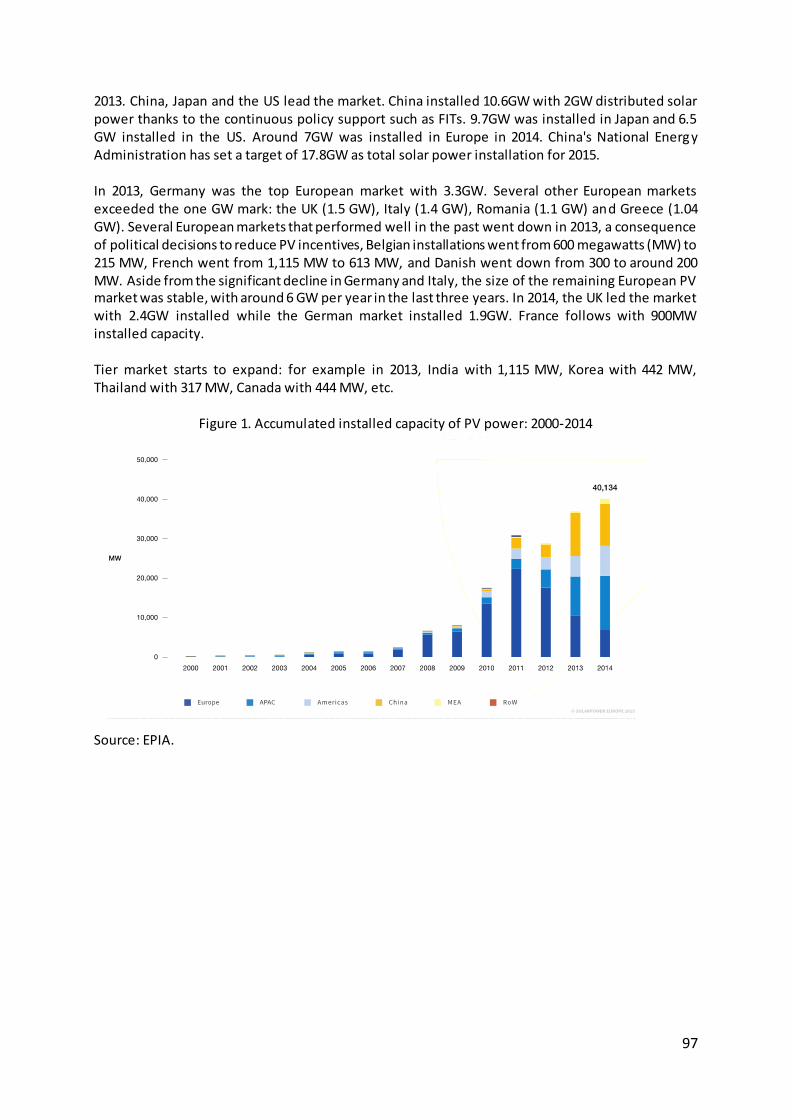
97
2013. China, Japan and the US lead the market. China installed 10.6GW with 2GW distributed solar power thanks to the continuous policy support such as FITs. 9.7GW was installed in Japan and 6.5 GW installed in the US. Around 7GW was installed in Europe in 2014. China's National Energy Administration has set a target of 17.8GW as total solar power installation for 2015. In 2013, Germany was the top European market with 3.3GW. Several other European markets exceeded the one GW mark: the UK (1.5 GW), Italy (1.4 GW), Romania (1.1 GW) and Greece (1.04 GW). Several European markets that performed well in the past went down in 2013, a consequence of political decisions to reduce PV incentives, Belgian installations went from 600 megawatts (MW) to 215 MW, French went from 1,115 MW to 613 MW, and Danish went down from 300 to around 200 MW. Aside from the significant decline in Germany and Italy, the size of the remaining European PV market was stable, with around 6 GW per year in the last three years. In 2014, the UK led the market with 2.4GW installed while the German market installed 1.9GW. France follows with 900MW installed capacity. Tier market starts to expand: for example in 2013, India with 1,115 MW, Korea with 442 MW, Thailand with 317 MW, Canada with 444 MW, etc.
Figure 1. Accumulated installed capacity of PV power: 2000-2014
Source: EPIA.
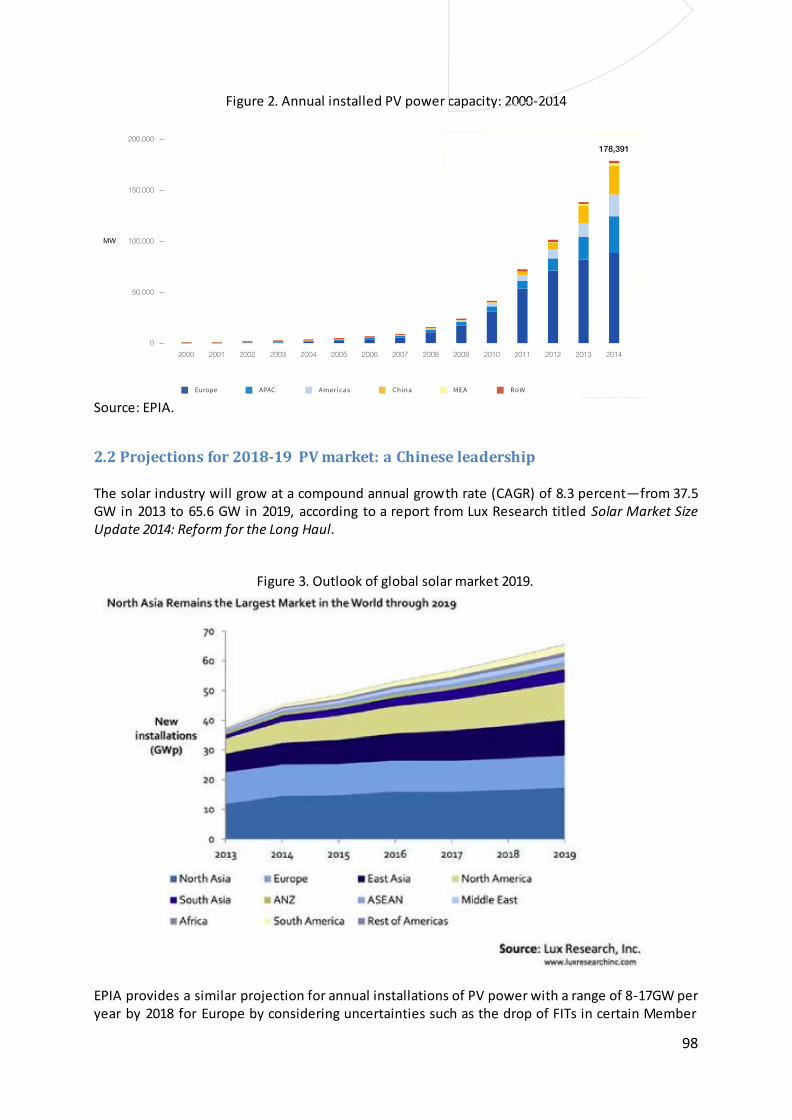
98
Figure 2. Annual installed PV power capacity: 2000-2014
Source: EPIA.
2.2 Projections for 2018-19 PV market: a Chinese leadership The solar industry will grow at a compound annual growth rate (CAGR) of 8.3 percent—from 37.5 GW in 2013 to 65.6 GW in 2019, according to a report from Lux Research titled Solar Market Size Update 2014: Reform for the Long Haul.
Figure 3. Outlook of global solar market 2019.
EPIA provides a similar projection for annual installations of PV power with a range of 8-17GW per year by 2018 for Europe by considering uncertainties such as the drop of FITs in certain Member
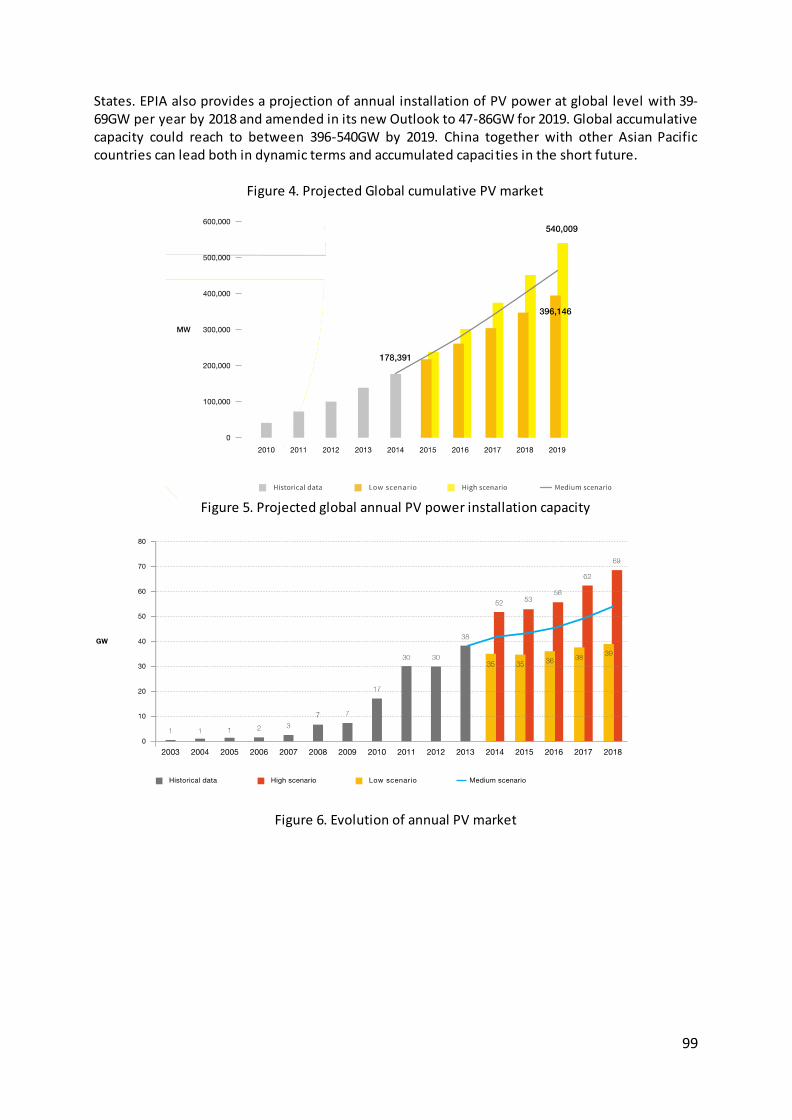
99
States. EPIA also provides a projection of annual installation of PV power at global level with 39-69GW per year by 2018 and amended in its new Outlook to 47-86GW for 2019. Global accumulative capacity could reach to between 396-540GW by 2019. China together with other Asian Pacific countries can lead both in dynamic terms and accumulated capacities in the short future.
Figure 4. Projected Global cumulative PV market
Figure 5. Projected global annual PV power installation capacity
Figure 6. Evolution of annual PV market
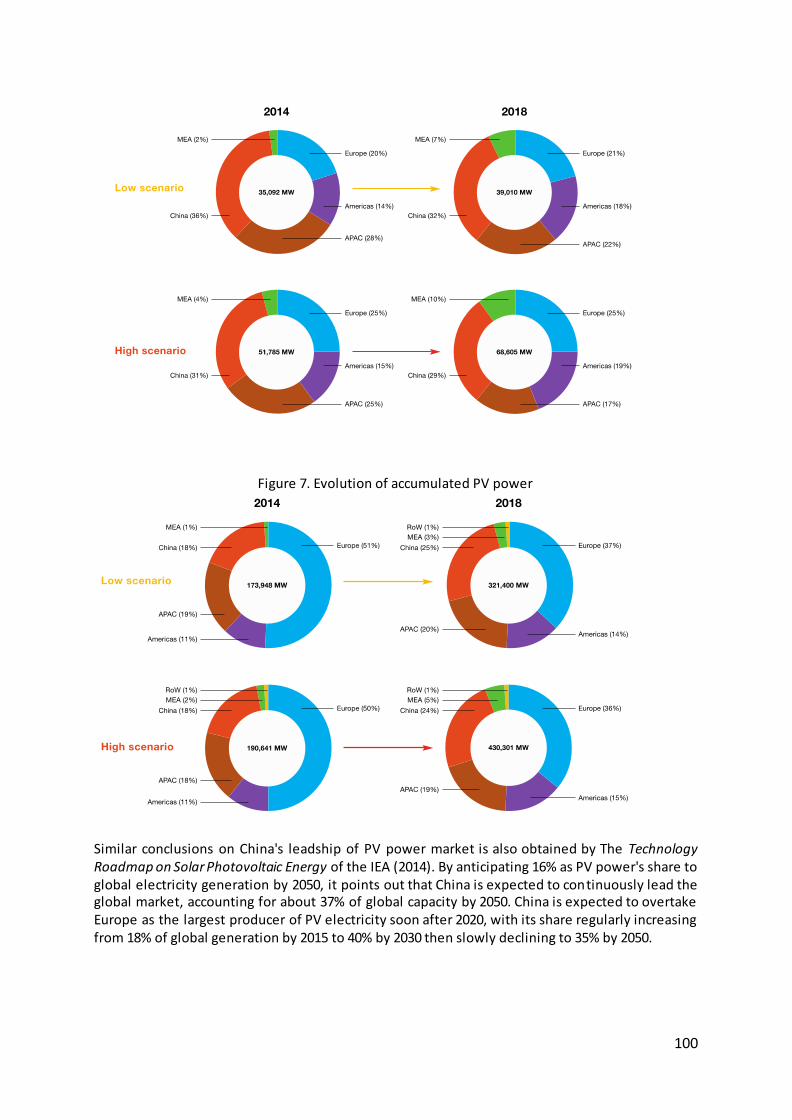
100
Figure 7. Evolution of accumulated PV power
Similar conclusions on China's leadship of PV power market is also obtained by The Technology Roadmap on Solar Photovoltaic Energy of the IEA (2014). By anticipating 16% as PV power's share to global electricity generation by 2050, it points out that China is expected to continuously lead the global market, accounting for about 37% of global capacity by 2050. China is expected to overtake Europe as the largest producer of PV electricity soon after 2020, with its share regularly increasing from 18% of global generation by 2015 to 40% by 2030 then slowly declining to 35% by 2050.
101
2.3 PV system cost evolution In terms of electricity generation cost, the Technology Roadmap on Solar Photovoltaic Energy of the IEA (2014) expects an average cost reduction of 25% by 2020, 45% by 2030, and 65% by 2050, leading to a range of 40 to 160$/MWh. According to the report Solar Market Size Update 2014: Reform for the Long Haul, incremental increases in efficiency from technologies such as passivated emitter rear contact (PERC), heterojunction with intrinsic layer (HIT) and selective emitter (SE), will enable system costs to drop by between $0.36/W for utility-scale and $0.60/W for residential by 2019, equaling to a 20% cut in total system costs. The Global Market Outlook 2015 draws similar conclusion. The cost of PV systems continued to decline in 2014 with system prices below 1 Eur/wp (for utility scale PV above 1 MW) common in several European countries and 1$/wp reported in the most competitive tenders. The cost reduction of PV system is a general result of declining prices of modules, inverters and economies of scale that brought installation costs down much faster than many expected. One particular point the Outlook highlighted is that the minimum import price on modules from China in Europe as the result of 2012 EU-China PV trade dispute settlement has maintained module prices higher than market level, thus increasing the total cost of PV system in Europe.
2.4 PV system components Crystalline silicon (c-Si) will dominate the solar market through 2019. X-Si, with an 84.6 percent market share, will grow from 31.6 GW in 2013 to 55.7 GW in 2019, growing at a CAGR of 8.45 percent. Cadmium telluride (CdTe) and copper iridium gallium diselenide (CIGS) will be a distant second and third, growing to 4.8 GW and 4.2 GW, respectively, in 2019. Alternative PV technologies, including thin films, had been expected to gain an increasing share of the market, but instead their share shrank from 15% in 2009 to about 10% in 2013. Utility-scale systems and rooftop systems will each have roughly half of the global market by 2050.
3. PV value chain
3.1 General trend In general, the PV sector value chain is described by figure 8. PV power has witnessed important development and growth in recent years. The decreasing costs of PV power can be considered in general as a result of technological improves and rapid market expansion that ensures economies of scale. Such a continuous cost reduction enables PV power to be competitive with other REN and conventional energies.
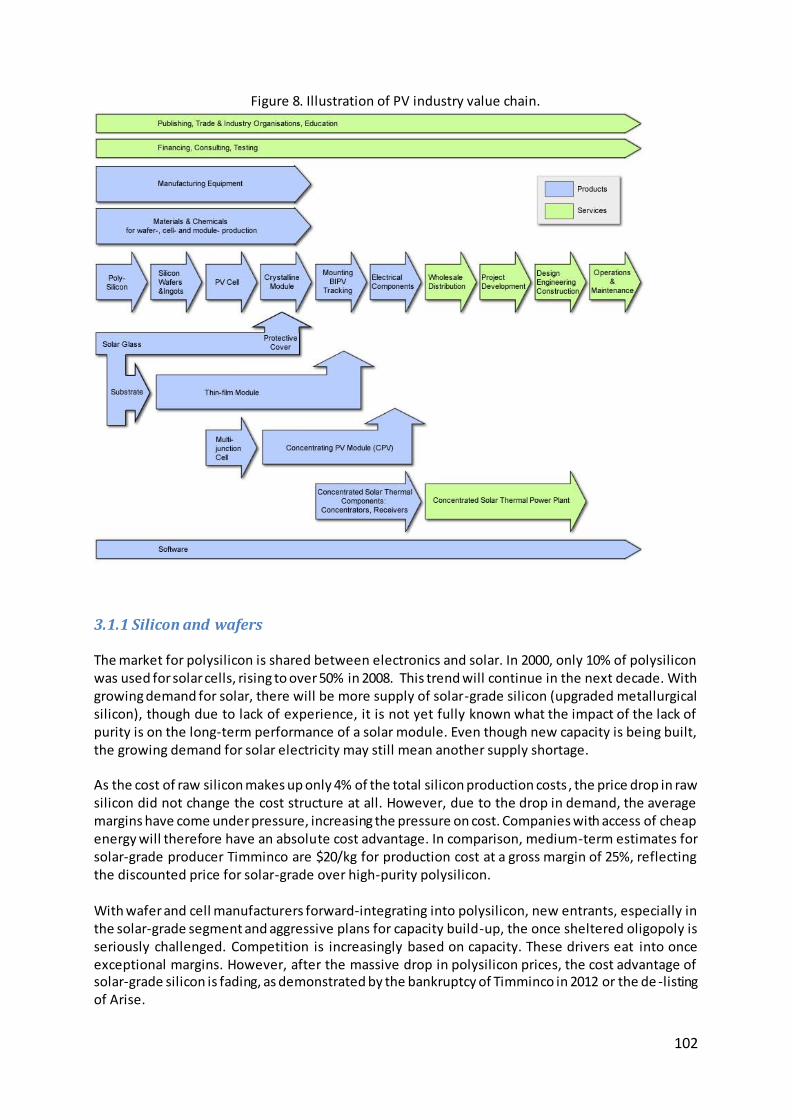
102
Figure 8. Illustration of PV industry value chain.
3.1.1 Silicon and wafers The market for polysilicon is shared between electronics and solar. In 2000, only 10% of polysilicon was used for solar cells, rising to over 50% in 2008. This trend will continue in the next decade. With growing demand for solar, there will be more supply of solar-grade silicon (upgraded metallurgical silicon), though due to lack of experience, it is not yet fully known what the impact of the lack of purity is on the long-term performance of a solar module. Even though new capacity is being built, the growing demand for solar electricity may still mean another supply shortage. As the cost of raw silicon makes up only 4% of the total silicon production costs , the price drop in raw silicon did not change the cost structure at all. However, due to the drop in demand, the average margins have come under pressure, increasing the pressure on cost. Companies with access of cheap energy will therefore have an absolute cost advantage. In comparison, medium-term estimates for solar-grade producer Timminco are $20/kg for production cost at a gross margin of 25%, reflecting the discounted price for solar-grade over high-purity polysilicon. With wafer and cell manufacturers forward-integrating into polysilicon, new entrants, especially in the solar-grade segment and aggressive plans for capacity build-up, the once sheltered oligopoly is seriously challenged. Competition is increasingly based on capacity. These drivers eat into once exceptional margins. However, after the massive drop in polysilicon prices, the cost advantage of solar-grade silicon is fading, as demonstrated by the bankruptcy of Timminco in 2012 or the de -listing of Arise.
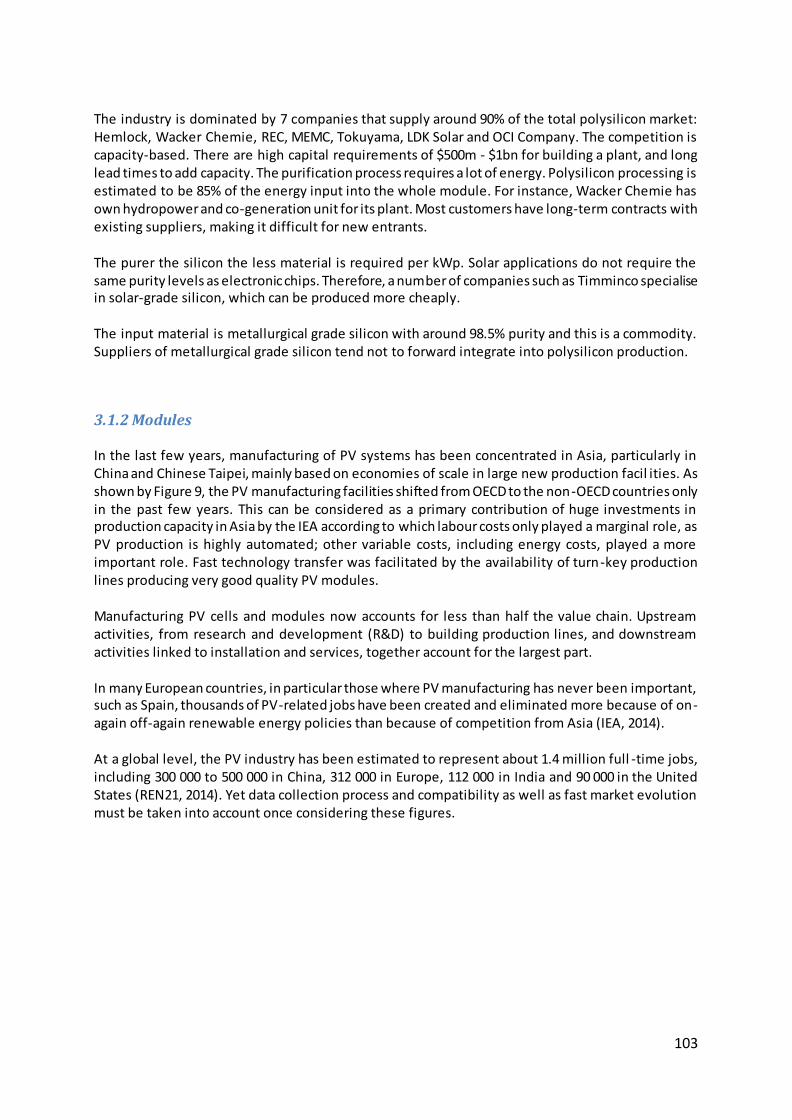
103
The industry is dominated by 7 companies that supply around 90% of the total polysilicon market: Hemlock, Wacker Chemie, REC, MEMC, Tokuyama, LDK Solar and OCI Company. The competition is capacity-based. There are high capital requirements of $500m - $1bn for building a plant, and long lead times to add capacity. The purification process requires a lot of energy. Polysilicon processing is estimated to be 85% of the energy input into the whole module. For instance, Wacker Chemie has own hydropower and co-generation unit for its plant. Most customers have long-term contracts with existing suppliers, making it difficult for new entrants. The purer the silicon the less material is required per kWp. Solar applications do not require the same purity levels as electronic chips. Therefore, a number of companies such as Timminco specialise in solar-grade silicon, which can be produced more cheaply. The input material is metallurgical grade silicon with around 98.5% purity and this is a commodity. Suppliers of metallurgical grade silicon tend not to forward integrate into polysilicon production.
3.1.2 Modules In the last few years, manufacturing of PV systems has been concentrated in Asia, particularly in China and Chinese Taipei, mainly based on economies of scale in large new production facil ities. As shown by Figure 9, the PV manufacturing facilities shifted from OECD to the non-OECD countries only in the past few years. This can be considered as a primary contribution of huge investments in production capacity in Asia by the IEA according to which labour costs only played a marginal role, as PV production is highly automated; other variable costs, including energy costs, played a more important role. Fast technology transfer was facilitated by the availability of turn-key production lines producing very good quality PV modules. Manufacturing PV cells and modules now accounts for less than half the value chain. Upstream activities, from research and development (R&D) to building production lines, and downstream activities linked to installation and services, together account for the largest part. In many European countries, in particular those where PV manufacturing has never been important, such as Spain, thousands of PV-related jobs have been created and eliminated more because of on-again off-again renewable energy policies than because of competition from Asia (IEA, 2014). At a global level, the PV industry has been estimated to represent about 1.4 million full -time jobs, including 300 000 to 500 000 in China, 312 000 in Europe, 112 000 in India and 90 000 in the United States (REN21, 2014). Yet data collection process and compatibility as well as fast market evolution must be taken into account once considering these figures.
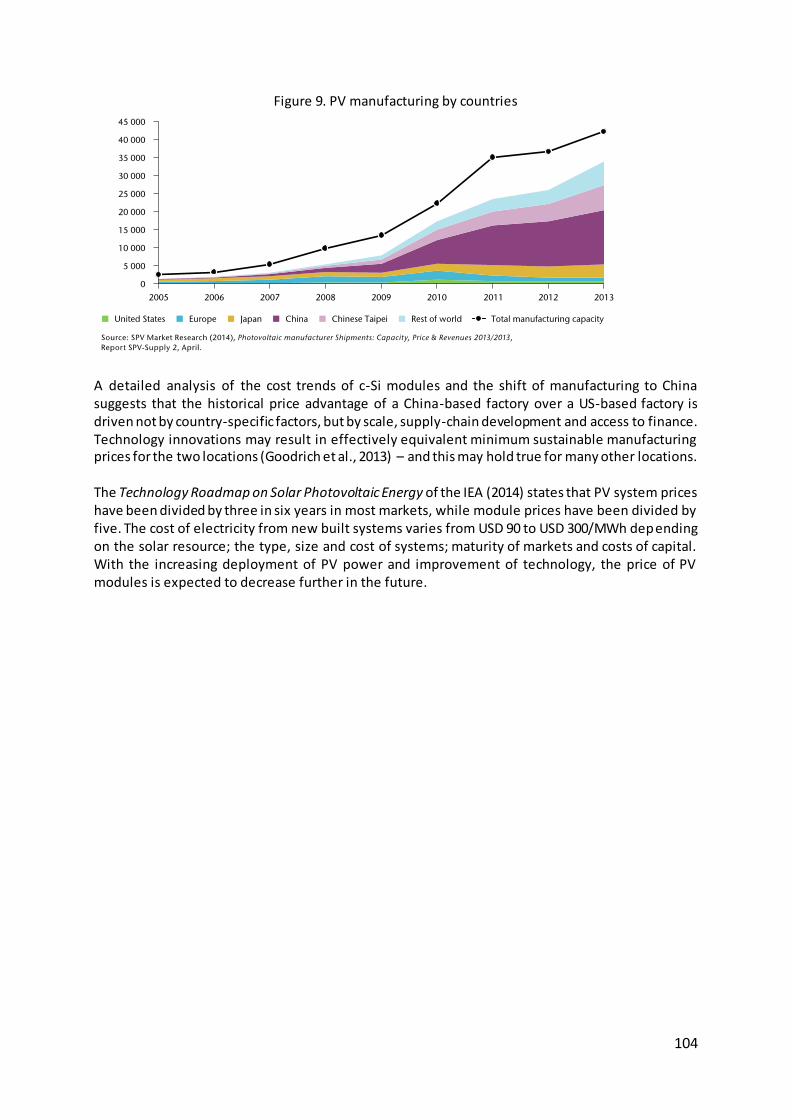
104
Figure 9. PV manufacturing by countries
A detailed analysis of the cost trends of c-Si modules and the shift of manufacturing to China suggests that the historical price advantage of a China-based factory over a US-based factory is driven not by country-specific factors, but by scale, supply-chain development and access to finance. Technology innovations may result in effectively equivalent minimum sustainable manufacturing prices for the two locations (Goodrich et al., 2013) – and this may hold true for many other locations. The Technology Roadmap on Solar Photovoltaic Energy of the IEA (2014) states that PV system prices have been divided by three in six years in most markets, while module prices have been divided by five. The cost of electricity from new built systems varies from USD 90 to USD 300/MWh depending on the solar resource; the type, size and cost of systems; maturity of markets and costs of capital. With the increasing deployment of PV power and improvement of technology, the price of PV modules is expected to decrease further in the future.
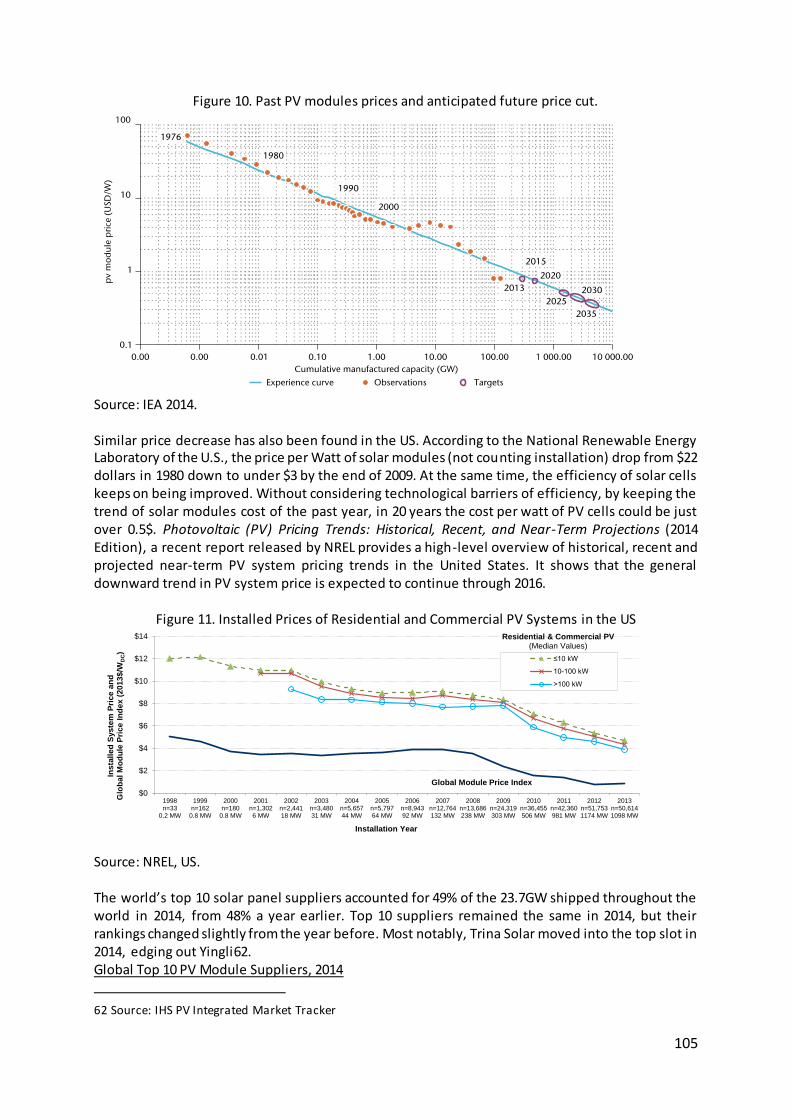
105
Figure 10. Past PV modules prices and anticipated future price cut.
Source: IEA 2014. Similar price decrease has also been found in the US. According to the National Renewable Energy Laboratory of the U.S., the price per Watt of solar modules (not counting installation) drop from $22 dollars in 1980 down to under $3 by the end of 2009. At the same time, the efficiency of solar cells keeps on being improved. Without considering technological barriers of efficiency, by keeping the trend of solar modules cost of the past year, in 20 years the cost per watt of PV cells could be just over 0.5$. Photovoltaic (PV) Pricing Trends: Historical, Recent, and Near-Term Projections (2014 Edition), a recent report released by NREL provides a high-level overview of historical, recent and projected near-term PV system pricing trends in the United States. It shows that the general downward trend in PV system price is expected to continue through 2016.
Figure 11. Installed Prices of Residential and Commercial PV Systems in the US
Source: NREL, US. The world’s top 10 solar panel suppliers accounted for 49% of the 23.7GW shipped throughout the world in 2014, from 48% a year earlier. Top 10 suppliers remained the same in 2014, but their rankings changed slightly from the year before. Most notably, Trina Solar moved into the top slot in 2014, edging out Yingli62. Global Top 10 PV Module Suppliers, 2014
62 Source: IHS PV Integrated Market Tracker
energy.gov/sunshot
Median Reported Installed Prices of Residential
and Commercial PV Systems over Time
Since 1998, reported PV system prices have fallen by 6-8% per year on average
$0.70/W (15%) for systems >100 kW
By comparison, global annual average module prices rose by $0.07/W from 2012-2013.
Note: Median installed prices are shown only if 15 or more observations are available for the individual size range. The Global Module Price Index is SPV Market Research’s average module selling price for the first buyer (P. Mints).
8
$0
$2
$4
$6
$8
$10
$12
$14
1998n=33
0.2 MW
1999n=162
0.8 MW
2000n=180
0.8 MW
2001n=1,3026 MW
2002n=2,44118 MW
2003n=3,48031 MW
2004n=5,65744 MW
2005n=5,79764 MW
2006n=8,94392 MW
2007n=12,764132 MW
2008n=13,686238 MW
2009n=24,319303 MW
2010n=36,455506 MW
2011n=42,360981 MW
2012n=51,7531174 MW
2013n=50,6141098 MW
Ins
tall
ed
Syste
m P
rice
an
d
Glo
bal
Mo
du
le P
rice
In
dex
(20
13
$/W
DC)
Installation Year
Residential & Commercial PV (Median Values)
Global Module Price Index
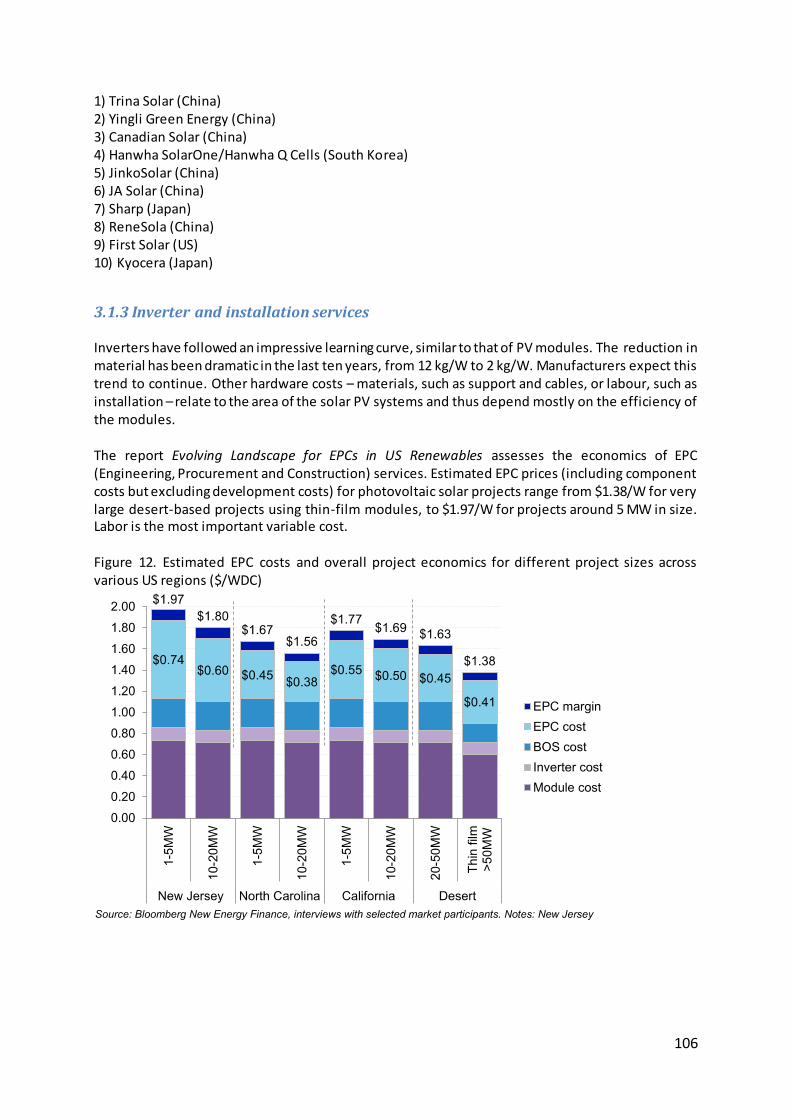
106
1) Trina Solar (China) 2) Yingli Green Energy (China) 3) Canadian Solar (China) 4) Hanwha SolarOne/Hanwha Q Cells (South Korea) 5) JinkoSolar (China) 6) JA Solar (China) 7) Sharp (Japan) 8) ReneSola (China) 9) First Solar (US) 10) Kyocera (Japan)
3.1.3 Inverter and installation services Inverters have followed an impressive learning curve, similar to that of PV modules. The reduction in material has been dramatic in the last ten years, from 12 kg/W to 2 kg/W. Manufacturers expect this trend to continue. Other hardware costs – materials, such as support and cables, or labour, such as installation – relate to the area of the solar PV systems and thus depend mostly on the efficiency of the modules. The report Evolving Landscape for EPCs in US Renewables assesses the economics of EPC (Engineering, Procurement and Construction) services. Estimated EPC prices (including component costs but excluding development costs) for photovoltaic solar projects range from $1.38/W for very large desert-based projects using thin-film modules, to $1.97/W for projects around 5 MW in size. Labor is the most important variable cost. Figure 12. Estimated EPC costs and overall project economics for different project sizes across various US regions ($/WDC)
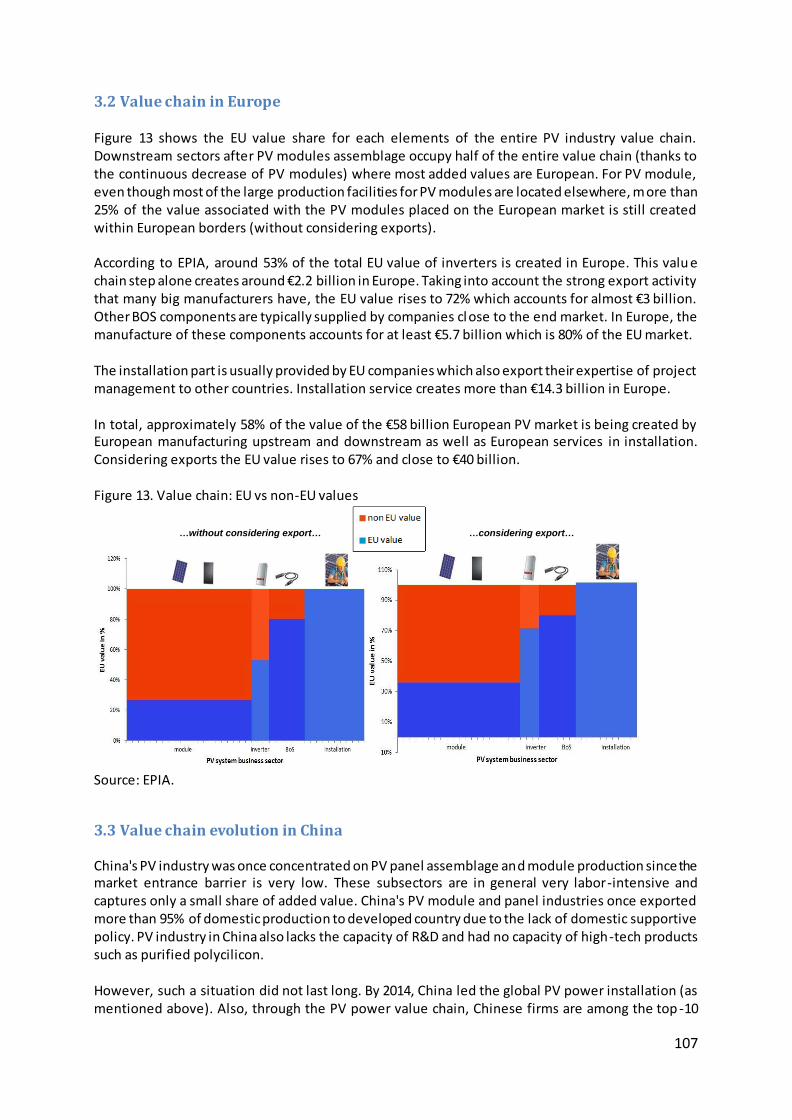
107
3.2 Value chain in Europe Figure 13 shows the EU value share for each elements of the entire PV industry value chain. Downstream sectors after PV modules assemblage occupy half of the entire value chain (thanks to the continuous decrease of PV modules) where most added values are European. For PV module, even though most of the large production facilities for PV modules are located elsewhere, more than 25% of the value associated with the PV modules placed on the European market is still created within European borders (without considering exports). According to EPIA, around 53% of the total EU value of inverters is created in Europe. This valu e chain step alone creates around €2.2 billion in Europe. Taking into account the strong export activity that many big manufacturers have, the EU value rises to 72% which accounts for almost €3 billion. Other BOS components are typically supplied by companies close to the end market. In Europe, the manufacture of these components accounts for at least €5.7 billion which is 80% of the EU market. The installation part is usually provided by EU companies which also export their expertise of project management to other countries. Installation service creates more than €14.3 billion in Europe. In total, approximately 58% of the value of the €58 billion European PV market is being created by European manufacturing upstream and downstream as well as European services in installation. Considering exports the EU value rises to 67% and close to €40 billion. Figure 13. Value chain: EU vs non-EU values
Source: EPIA.
3.3 Value chain evolution in China China's PV industry was once concentrated on PV panel assemblage and module production since the market entrance barrier is very low. These subsectors are in general very labor-intensive and captures only a small share of added value. China's PV module and panel industries once exported more than 95% of domestic production to developed country due to the lack of domestic supportive policy. PV industry in China also lacks the capacity of R&D and had no capacity of high-tech products such as purified polycilicon. However, such a situation did not last long. By 2014, China led the global PV power installation (as mentioned above). Also, through the PV power value chain, Chinese firms are among the top -10
About EPIA
EPIA – the European Photovoltaic Industry Association –
represents members active along the whole solar PV value chain:
from silicon, cells and module production to systems development
and PV electricity generation as well as marketing and sales .
EPIA’s mission is to give its global membership a distinct and
effective voice in the European market, especiall y in the EU.
www.epia.org
suppliers of key materials for PV (around 25% of the value of this business segment). In other words, even though most of the large production facilities for PV modules are located elsewhere, more than 25% of the value associated with the PV modules placed on the European market is still created within European borders (without considering exports).
…downstream…
The same is true for the downstream part of the PV value chain. Currently, around 53% of the total EU value of inverters – a critical part of a PV system that converts the electricity from the modules into AC current that can be injected onto the grid – is created in Europe. This value chain step alone creates around €2.2 billion in Europe. Taking into account the strong export activity that many big manufacturers have, the EU value rises to 72% which accounts for almost €3 billion. Other BoS components are typically supplied by companies close to the end market. In Europe, the manufacture of these components accounts for at least €5.7 billion which is 80% of the EU market. Another major step in the value chain is the installation of PV systems. Here, all of the value is created locally. In fact, in this sector, European companies are actually exporting part of their expertise, especially in terms of project management, to emerging markets. This means that more than €14.3 billion is created by European installation services.
…and ev en further do wnstream
The PV value chain extends even further. A large basis of PV installations also triggers a market for services related to the operation and maintenance of these PV systems.
These services create employment opportunities on a long-term basis (the lifetime of a PV installation is at least 25 years). The 21,642 MW of installed PV capacity in 2011 could create almost €9.8 billion of value in operating and maintenance services over the lifetime of those PV systems.
Value creation in Europe In total, approximately 58% of the value of the €58 billion European PV market is being created by European manufacturing upstream and downstream as well as European services in installation. Considering exports the EU value rises to 67% and close to €40 billion.
Keeping Europe Competitive
Ensuring that European companies and citizens will
continue to benefit from the growth of PV markets
worldwide requires that European and national
policymakers should create regulatory frameworks that:
Favour renewable energies on a long-term
Support dedicated investments in the
manufacturing industry
Support R&D and innovative products
Improve access to financing
Support standardization
Develop skill and competencies by educational
programs
Ensuring the principle of reciprocity and supporting the free and fair global trade
Value creation – European added value
…without considering export…
…considering export…
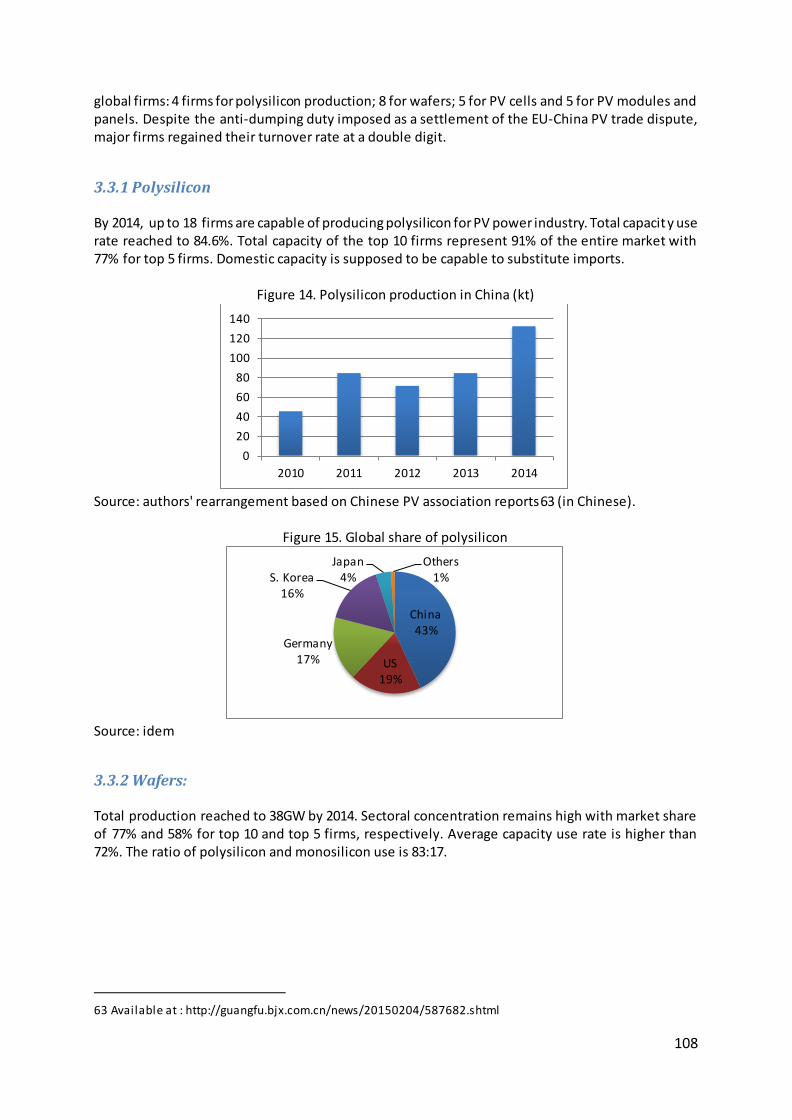
108
global firms: 4 firms for polysilicon production; 8 for wafers; 5 for PV cells and 5 for PV modules and panels. Despite the anti-dumping duty imposed as a settlement of the EU-China PV trade dispute, major firms regained their turnover rate at a double digit.
3.3.1 Polysilicon By 2014, up to 18 firms are capable of producing polysilicon for PV power industry. Total capacity use rate reached to 84.6%. Total capacity of the top 10 firms represent 91% of the entire market with 77% for top 5 firms. Domestic capacity is supposed to be capable to substitute imports.
Figure 14. Polysilicon production in China (kt)
Source: authors' rearrangement based on Chinese PV association reports63 (in Chinese).
Figure 15. Global share of polysilicon
Source: idem
3.3.2 Wafers: Total production reached to 38GW by 2014. Sectoral concentration remains high with market share of 77% and 58% for top 10 and top 5 firms, respectively. Average capacity use rate is higher than 72%. The ratio of polysilicon and monosilicon use is 83:17.
63 Available at : http://guangfu.bjx.com.cn/news/20150204/587682.shtml
0
20
40
60
80
100
120
140
2010 2011 2012 2013 2014
China 43%
US 19%
Germany 17%
S. Korea 16%
Japan 4%
Others 1%
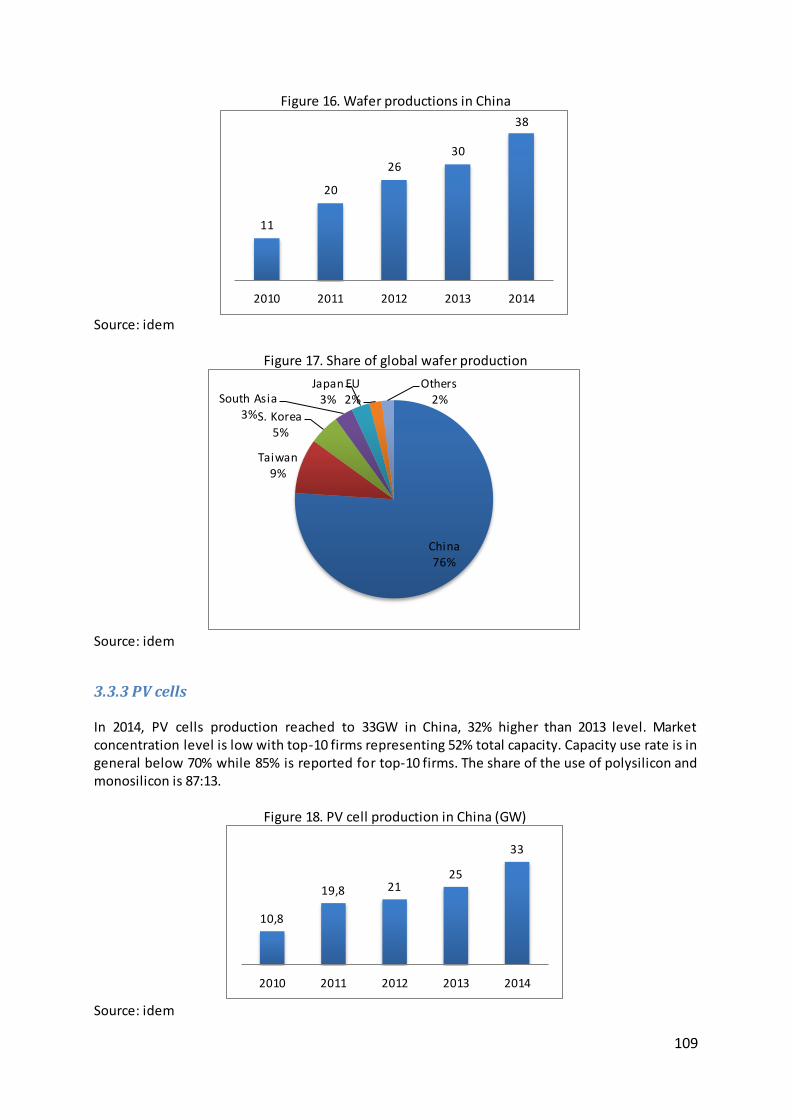
109
Figure 16. Wafer productions in China
Source: idem
Figure 17. Share of global wafer production
Source: idem
3.3.3 PV cells In 2014, PV cells production reached to 33GW in China, 32% higher than 2013 level. Market concentration level is low with top-10 firms representing 52% total capacity. Capacity use rate is in general below 70% while 85% is reported for top-10 firms. The share of the use of polysilicon and monosilicon is 87:13.
Figure 18. PV cell production in China (GW)
Source: idem
11
20
26 30
38
2010 2011 2012 2013 2014
China 76%
Taiwan 9%
S. Korea 5%
South Asia 3%
Japan 3%
EU 2%
Others 2%
10,8
19,8 21 25
33
2010 2011 2012 2013 2014
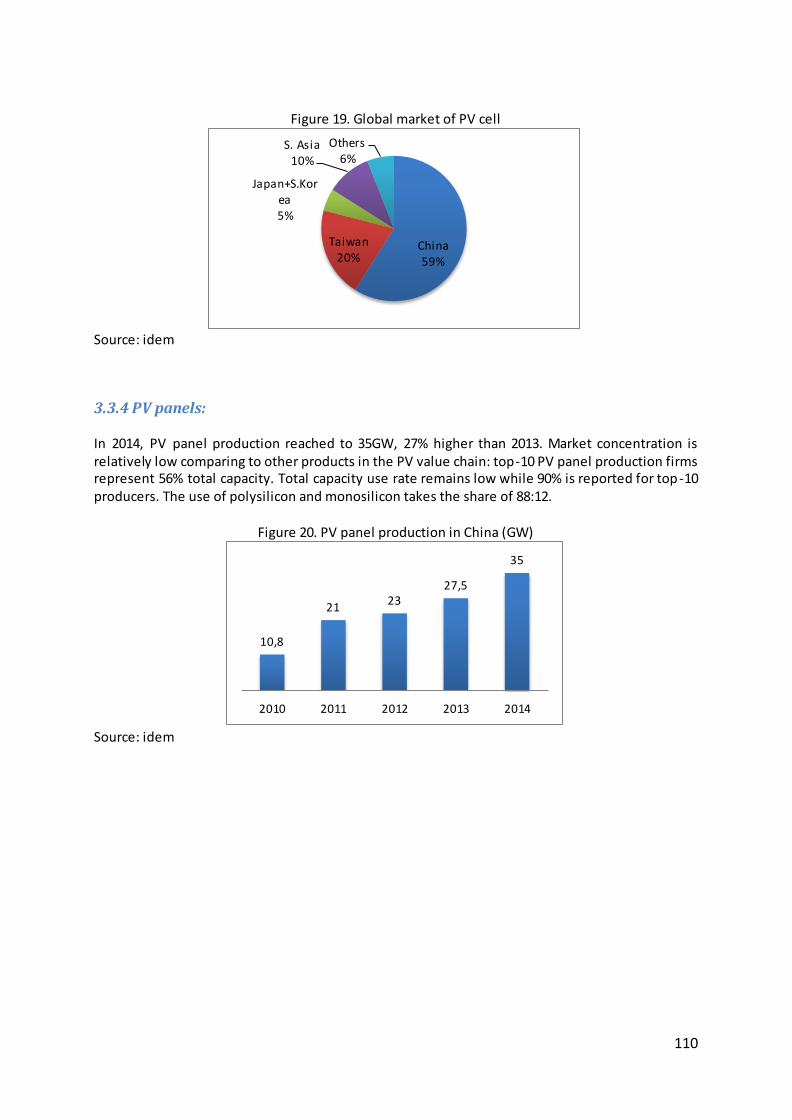
110
Figure 19. Global market of PV cell
Source: idem
3.3.4 PV panels: In 2014, PV panel production reached to 35GW, 27% higher than 2013. Market concentration is relatively low comparing to other products in the PV value chain: top-10 PV panel production firms represent 56% total capacity. Total capacity use rate remains low while 90% is reported for top-10 producers. The use of polysilicon and monosilicon takes the share of 88:12.
Figure 20. PV panel production in China (GW)
Source: idem
China 59%
Taiwan 20%
Japan+S.Korea 5%
S. Asia 10%
Others 6%
10,8
21 23
27,5
35
2010 2011 2012 2013 2014
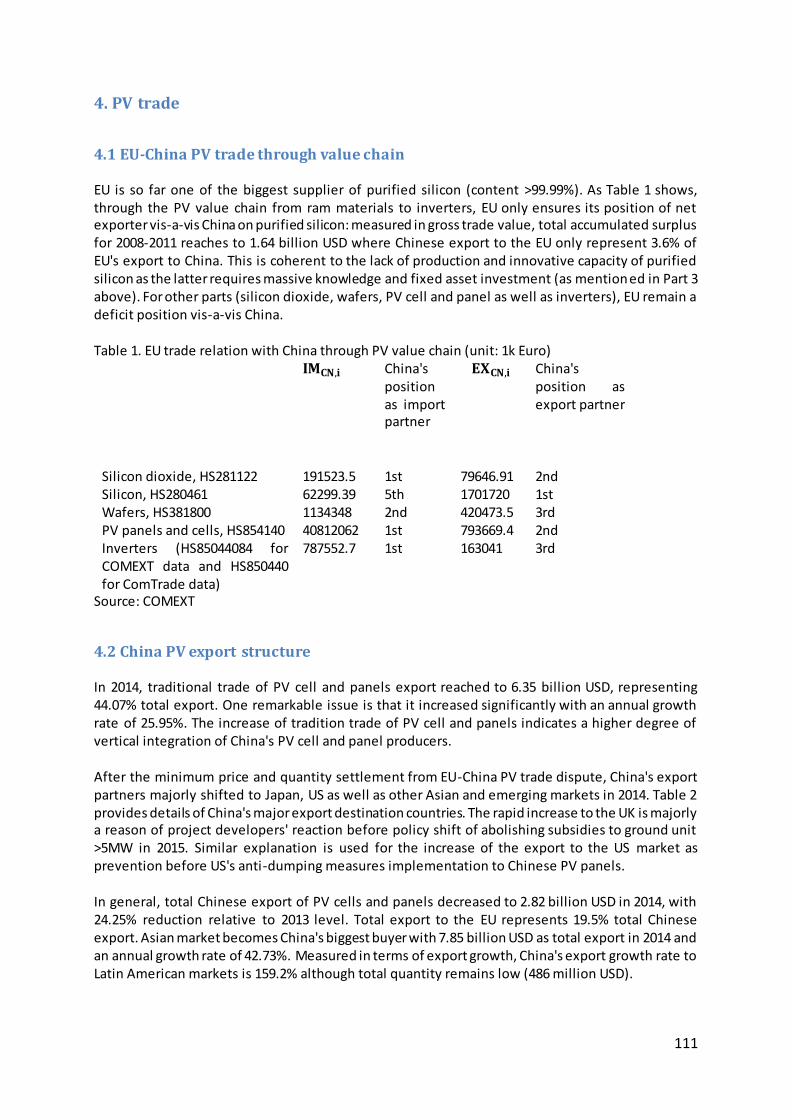
111
4. PV trade
4.1 EU-China PV trade through value chain EU is so far one of the biggest supplier of purified silicon (content >99.99%). As Table 1 shows, through the PV value chain from ram materials to inverters, EU only ensures its position of net exporter vis-a-vis China on purified silicon: measured in gross trade value, total accumulated surplus for 2008-2011 reaches to 1.64 billion USD where Chinese export to the EU only represent 3.6% of EU's export to China. This is coherent to the lack of production and innovative capacity of purified silicon as the latter requires massive knowledge and fixed asset investment (as mentioned in Part 3 above). For other parts (silicon dioxide, wafers, PV cell and panel as well as inverters), EU remain a deficit position vis-a-vis China. Table 1. EU trade relation with China through PV value chain (unit: 1k Euro)
𝐈𝐌𝐂𝐍,𝐢
China's position as import partner
𝐄𝐗𝐂𝐍,𝐢 China's position as export partner
Silicon dioxide, HS281122 191523.5 1st 79646.91 2nd Silicon, HS280461 62299.39 5th 1701720 1st Wafers, HS381800 1134348 2nd 420473.5 3rd PV panels and cells, HS854140 40812062 1st 793669.4 2nd Inverters (HS85044084 for COMEXT data and HS850440 for ComTrade data)
787552.7 1st 163041 3rd
Source: COMEXT
4.2 China PV export structure In 2014, traditional trade of PV cell and panels export reached to 6.35 billion USD, representing 44.07% total export. One remarkable issue is that it increased significantly with an annual growth rate of 25.95%. The increase of tradition trade of PV cell and panels indicates a higher degree of vertical integration of China's PV cell and panel producers. After the minimum price and quantity settlement from EU-China PV trade dispute, China's export partners majorly shifted to Japan, US as well as other Asian and emerging markets in 2014. Table 2 provides details of China's major export destination countries. The rapid increase to the UK is majorly a reason of project developers' reaction before policy shift of abolishing subsidies to ground unit >5MW in 2015. Similar explanation is used for the increase of the export to the US market as prevention before US's anti-dumping measures implementation to Chinese PV panels. In general, total Chinese export of PV cells and panels decreased to 2.82 billion USD in 2014, with 24.25% reduction relative to 2013 level. Total export to the EU represents 19.5% total Chinese export. Asian market becomes China's biggest buyer with 7.85 billion USD as total export in 2014 and an annual growth rate of 42.73%. Measured in terms of export growth, China's export growth rate to Latin American markets is 159.2% although total quantity remains low (486 million USD).
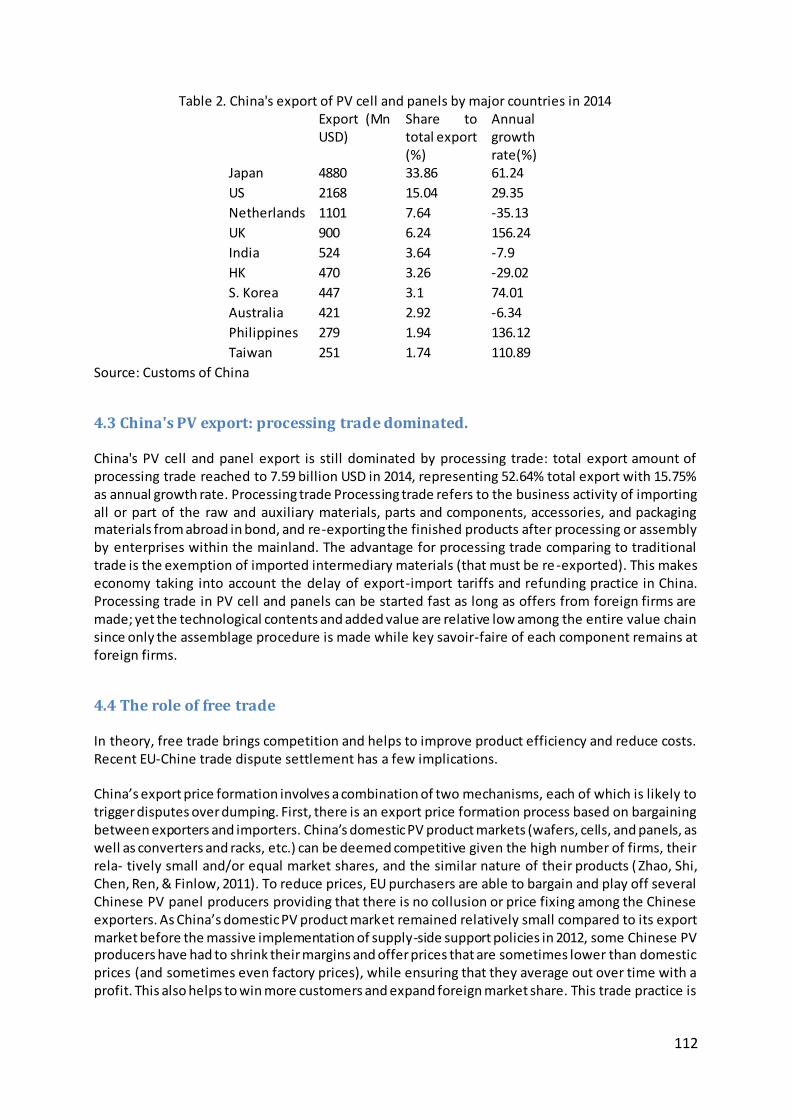
112
Table 2. China's export of PV cell and panels by major countries in 2014 Export (Mn
USD) Share to total export (%)
Annual growth rate(%)
Japan 4880 33.86 61.24
US 2168 15.04 29.35
Netherlands 1101 7.64 -35.13
UK 900 6.24 156.24
India 524 3.64 -7.9
HK 470 3.26 -29.02
S. Korea 447 3.1 74.01
Australia 421 2.92 -6.34
Philippines 279 1.94 136.12
Taiwan 251 1.74 110.89
Source: Customs of China
4.3 China's PV export: processing trade dominated. China's PV cell and panel export is still dominated by processing trade: total export amount of processing trade reached to 7.59 billion USD in 2014, representing 52.64% total export with 15.75% as annual growth rate. Processing trade Processing trade refers to the business activity of importing all or part of the raw and auxiliary materials, parts and components, accessories, and packaging materials from abroad in bond, and re-exporting the finished products after processing or assembly by enterprises within the mainland. The advantage for processing trade comparing to traditional trade is the exemption of imported intermediary materials (that must be re -exported). This makes economy taking into account the delay of export-import tariffs and refunding practice in China. Processing trade in PV cell and panels can be started fast as long as offers from foreign firms are made; yet the technological contents and added value are relative low among the entire value chain since only the assemblage procedure is made while key savoir-faire of each component remains at foreign firms.
4.4 The role of free trade In theory, free trade brings competition and helps to improve product efficiency and reduce costs. Recent EU-Chine trade dispute settlement has a few implications. China’s export price formation involves a combination of two mechanisms, each of which is likely to trigger disputes over dumping. First, there is an export price formation process based on bargaining between exporters and importers. China’s domestic PV product markets (wafers, cells, and panels, as well as converters and racks, etc.) can be deemed competitive given the high number of firms, their rela- tively small and/or equal market shares, and the similar nature of their products ( Zhao, Shi, Chen, Ren, & Finlow, 2011). To reduce prices, EU purchasers are able to bargain and play off several Chinese PV panel producers providing that there is no collusion or price fixing among the Chinese exporters. As China’s domestic PV product market remained relatively small compared to its export market before the massive implementation of supply-side support policies in 2012, some Chinese PV producers have had to shrink their margins and offer prices that are sometimes lower than domestic prices (and sometimes even factory prices), while ensuring that they average out over time with a profit. This also helps to win more customers and expand foreign market share. This trade practice is
113
common in the solar energy sector and a regular subject for complaint by the Chinese PV manufacturers themselves64. Second, China provides PV producers with corporate tax rebates (50% reduction), enabling them to sell their PV products at a price that undercuts the price they would have to apply in the absence of such policies. Moreover, for PV cell and panel manufacturers, Chinese banks offer loan facilities at below- market rates, and leading PV producers (e.g. SunTech) have been encouraged to accept the loans, particularly during the boom years (roughly 2008–2012). Combined with economies of scale, this may have lowered the marginal cost of PV manufacturing in China and provided Chinese firms with additional financial sources to offset any temporary losses induced by factory price dumping (Yu, 2013). Given all these domestic support policies, the hypothesis that China is pursuing a strategic export policy (with the intention to bankrupt foreign firms and then raise prices, in line with the text - book behaviour of monopolistic firms) cannot be totally discarded, despite that fact that no evidence has been collected so far to corroborate this. A third dispute-triggering factor is the lack of coordination among push and pull policies worldwide, and especially between the EU and China. In terms of timing, the above -mentioned supply-side policies in the Chinese PV production sector coincided massively with demand-side policies (notably, feed-in tariffs, FITs) in the EU65. Moreover, the unbalanced nature of supply-side/demand-side support policies between the EU and China wil l very probably extend to other (green) sectors. On the one hand, according to the National Plan for the Development of SES over the 12th Five -Year Plan period66 (published in 2012), China will implement more supply-side support measures for SES. As several Chinese official documents indicate67, the clear objective of China’s supply-side support policies is to make sure that the industries promoted (e.g. SES) gain dominant competitiveness in the future, even though this choice incurs expensive social costs due to the sub-optimal use of public budgets (which, in the short term, need to be used for other priorities such as poverty, health, and trans- port). On the other hand, EU Member States are constrained by free competition regulations and cannot, like China, massively and rapidly implement supply-side support policies for green industries (although there are different supply-side support policies in certain Member States). All else equal, the imbalance between the capacities of China and the EU to pursue domestic support policies heightens the likelihood of future trade disputes. PV industry value chain can be affected by anti-trade measures. For example, an anti-dumping duty could increase the PV panel cost thus the entire PV project costs in Europe. Provided that the added value of most of the downstream sectors remains at the EU territory, this could entail negative impact on PV project development as long as PV panel prices from China remain high and no alternative suppliers of PV panels and cells can be found in the short term for EU. This corresponds to the argument of the new EPIA announcement mentioned in the introduction.
64 Source: Chinese media report (in Chinese), available at http://news.xinhuanet.com/fortune/2013 -08/09/c_ 125139787.htm.
65 Even though FITs have been revised downward in the EU since 2008–2009 and China has started to use
demand-side policies to stimulate the domestic installation of PV energy since 2013, this differentiated pattern of support stil l holds.
66 A Chinese version is available at http://www.gov.cn/zwgk/2012-07/20/content_2187770.htm.
67 For example, State Council Order No. 512 on the Implementation Regulations of Corporate Income Tax Law published in January 2008.
114
5. Domestic supportive policy Comparing to wind power development in China, and comparing to the important export of PV panels, solar power installation has only witnessed a rapid development since very recent years, which is to an important degree, due to the lack of related supporting policies. Annual newly added solar power capacity remains at a very low level before 2009. However, after this, annual new solar power installation capacity has skyrocketed: 0.52GW, 2.7GW, 4.5GW, 12GW respectively for 2010-2013. Such a superfast solar power development in China cannot be disconnected with massive supportive policies implemented since 2012. Provided the rapid solar power development, in 2013, China’s State Council issued suggestions on promoting the healthy development of PV industry which set a revised target for solar power development: 35GW of installed PV power by 2015, with an annual growth rate of 10GW for 2013-2015. China’s PV power development can be generally divided by several phases based on different supportive policies and strategies.
5.1 Supporting production during early phases From the outset, China’s domestic support policies in the PV sector have been of the push variety, while pull policies have been increasingly introduced in recent years. In general, while a handful of circulars and notices were published in the early 2000s that contained qualitative regulat ions to support the PV industry and its deployment, the first concrete and effective support measures for the PV sector were not produced until 2006. Table A1 in the Annex summarizes China’s PV sector support policies, listing them according to their implementation date. These policies have had both direct and indirect effects on the development of the PV sector in China. 68 Interestingly, most policies have been very recently released (since 2011), indicating China’s increasing focus on the PV sector. When measured purely in terms of the numbers of concrete support policies, the PV sector (from the production of PV panels through to the installation and service side) has still benefited from fewer policies than the wind power sector, which currently has more than 20 support policies in place in different chains throughout the whole sector. Early domestic support policies in China were mainly of a push nature. The first effective supportive measures were implemented in January 2006 and focused on providing fi scal facilities and tax reductions for PV research and development (R&D) in order to accelerate the commercialization of PV panels. As PV panels and related supplies and services gradually commercialized, China’s State Council published implementation rules for a corporate income tax in January 2008, which reduced income tax for PV production enterprises (as well as other renewable energy production firms) during their first six years of operation. These two policies may have contributed to China’s increasing domestic capacity for PV panel production and to China’s recent shift from being a net importer to becoming the biggest exporter of solar panels and cells.
68 Other policies also exist (circulars, notices, etc.) that were not included in this paper given that they only provided guidelines or propaganda and did not have a real effect on the development of the PV sector.
115
5.2 Insufficient demand side supportive policies in early phase Early phase pull policies were insufficient to absorb domestic PV production capacity. As domestic PV panel capacity rapidly increased, policies were introduced in 2009 to facilitate domestic PV electricity power projects, including subsidies for the building of PV power generation facilities. The well-known Golden Sun project was then implemented in July 2009 as an additional boost to domestic PV panel capacity through the financing and subsidizing of PV electricity projects. However, PV investors lacked relevant experience and an insufficient number of projects were financed, so that only a (relatively) small amount of PV panels were purchased in China compared to its exportation level. 69
5.3 Increasing efforts to stimulate domestic demand in recent years China became aware of this insufficiency in the domestic need for its PV panels, and since 2011 has introduced more pull policies. In July 2011, the National Development and Reform Commission (NDRC) released price regulations on standard PV power grid connections. While in September 2011, additional regulations were introduced to follow up the Golden Sun project, requiring the strengthening and scaling up of PV power project implementation in China. It provided further clarifications regarding China’s project financing facility: both PV producers and investors in PV electricity power became eligible for subsidies from the central government. Although this subsidy to PV panel producers is of a push nature, the policy can be considered as a stimulus to the consumption of PV panels given that subsidies are only given for PV panels sold to build domestic PV power projects in cases where project investors could benefit from lower PV panel prices. Additional policies to encourage the scaling up of domestic PV power projects were introduced in 2012. In March 2012, subsidies were brought in to finance the connection of PV electricity generation projects to the national power grid. In September 2012, a notice was released on the scaling up of pilot projects for distributed PV electricity power, which encouraged the moving up of such projects to the national level, with very detailed guidelines for project implementation following in October 2012. After this, the State Grid Corporation of China released a policy that made available several facilities and free or low cost services for PV electricity grid connection. In the meantime, the 12 th Five Year Plan (FYP) for the PV electricity industry (2011-2015) set ambitious targets for total PV power installation, distributed PV electricity capacity as well as the development of PV power pilot projects in cities and districts. More recently, China’s Energy Minister Liu Tienan announced a further increase to its ambitious targets for PV power, stating that China would double its objectives by seeking to install 10GW of PV power in 2013 (cf. real achieved target in 2013: 13GW).70 In addition, the 2015 objective for installed PV power capacity has been increased four times, now standing at 35GW.71 Together with the ongoing reform of environmental taxation, resource and consumption taxes as well as the introduction of an emission trading system for CO2 which would raise the costs of fossil fuel energy and/or CO2 emissions, these measures and targets that focus on the current key obstacles of PV power installation in China could significantly drive up the demand for PV panels in China in the coming years.
69 Further, the technical and institutional difficulties for PV power grid connection were also an important obstacle for developing domestic PV electricity projects in China in 2009.
70 Leslie Hook, China Solar Industry aims to shine out, Financial Times, 10 Jan. 2013.
http://www.ft.com/cms/s/0/394bb232-5a58-11e2-bc93-00144feab49a.html#axzz2HZ3wQTTh
71 See http://www.ccchina.gov.cn/Detail.aspx?newsId=39196&TId=57 for details.
116
5.4 Particular focus on distributed PV power installation Since 2013, NDRC published a number of policies promoting and supporting the development of distributed power generation, including distributed PV power development in China. Subsidies (0.42Yuan/kWh) are given to electricity generated from distributed PV power. 18 pilot projects have been identified to conduct distributed PV power. CDB also provides loan facilities and third-party insurance and guarantee system for distributed power projects. Also, REN electricity price added fees, National key hydro power fund added fees, Supportive Fund for migration due to key hydro power installation added fees, Agricultural loans Fund added fees are usually collected from electricity price in China. MOF released a notice that exempts these four fees from own use electricity generated by distributed PV power in order to reduce their final price of electricity. In order to ensure the real development of distributed power, NEA also requires local governments to provide 2013 distributed PV power generation development report and provide suggestions for 2014 targets.
5.5 Ambition to build competitive solar power industry While most of the recent PV policies have focused on boosting the demand for PV panels in China, there is evidence that China will continue to support the development of its PV industry as a strategic sector in the coming years. This is not surprising given that in 2010 China identified seven strategic and emerging sectors, which included new energy and PV power, where it wanted to sustain competitiveness and ensure green growth. Although no further concrete support measures have been introduced to date since those mentioned above (aside from a confirmation in 2012 from the China Development Bank that it would guarantee loans to key PV enterprises), China’s Ministry of Industry and Information Technology (MIIT) and its Ministry of Science and Technology (MOST) have set a dozen targets for the production costs of PV companies and for technology improvement, which were published in the 12th FYP for the PV industry and the 12th FYP for PV technology, respectively in February and March 2012, which aim to develop a higher value-added and technology-and-innovation-led PV industry within the current decade. Additionally, pull policies have been increasingly introduced since 2012. MIIT published Standards of PV Manufacturing Sectors in 2013 which formalised the future sectoral development strategies. Key elements include: 1. Strictly limit pure expansion of PV production capacity, own capital rate of total investment of
new expansion/installation of PV production capacity should be higher than 20% 2. PV production firms must possess R&D activities: for each year, at least 3% (and more less than
10Mn Yuan) of total sale revenue of the firm should be used to conduct R&D and production process improvement activities.
3. Minimal annual production capacity is set: 3000ton for polycilicon, 1000ton for silicon ingot and rod, 50Mn pieces for silicon wafers (pellet), 200MWp for PV cells and panels, 50MWp for thin film PV panels.
4. Minimum technical standard of products, energy intensity, water consumption standards for existing PV production firms
5. More stringent minimum technical standard for new installations of PV production capacity.
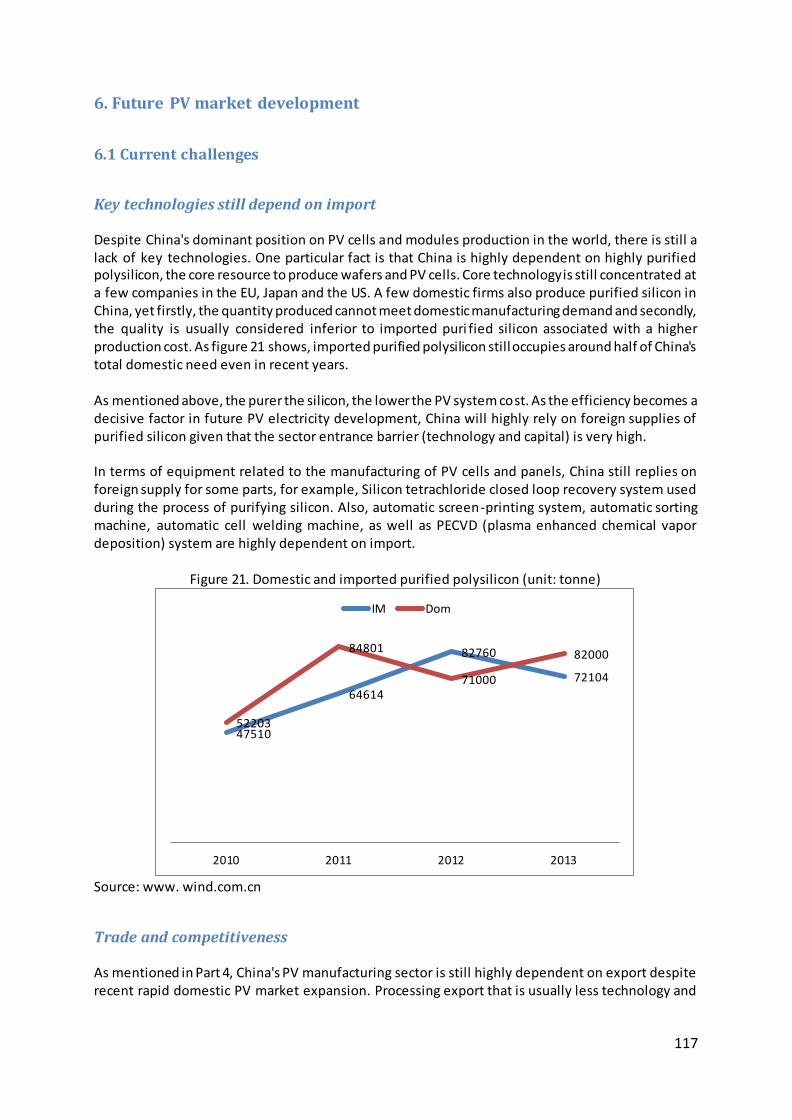
117
6. Future PV market development
6.1 Current challenges
Key technologies still depend on import Despite China's dominant position on PV cells and modules production in the world, there is still a lack of key technologies. One particular fact is that China is highly dependent on highly purified polysilicon, the core resource to produce wafers and PV cells. Core technology is still concentrated at a few companies in the EU, Japan and the US. A few domestic firms also produce purified silicon in China, yet firstly, the quantity produced cannot meet domestic manufacturing demand and secondly, the quality is usually considered inferior to imported puri fied silicon associated with a higher production cost. As figure 21 shows, imported purified polysilicon still occupies around half of China's total domestic need even in recent years. As mentioned above, the purer the silicon, the lower the PV system cost. As the efficiency becomes a decisive factor in future PV electricity development, China will highly rely on foreign supplies of purified silicon given that the sector entrance barrier (technology and capital) is very high. In terms of equipment related to the manufacturing of PV cells and panels, China still replies on foreign supply for some parts, for example, Silicon tetrachloride closed loop recovery system used during the process of purifying silicon. Also, automatic screen-printing system, automatic sorting machine, automatic cell welding machine, as well as PECVD (plasma enhanced chemical vapor deposition) system are highly dependent on import.
Figure 21. Domestic and imported purified polysilicon (unit: tonne)
Source: www. wind.com.cn
Trade and competitiveness As mentioned in Part 4, China's PV manufacturing sector is still highly dependent on export despite recent rapid domestic PV market expansion. Processing export that is usually less technology and
47510
64614
82760
72104
52203
84801
71000
82000
2010 2011 2012 2013
IM Dom
118
capital-dependent than traditional export still takes half of total PV cell and panel exports, indicating low technological content of the PV manufacturing market in China. China's domestic supportive policies, together with the increasing interest of supporting domestic PV industries in other countries, could trigger further trade disputes thus affecting the export of PV manufacturing sector in China. A large number of Chinese PV manufacturing firms do not invest sufficient capital into R&D and most of the PV manufacturing firms do not yet have a mature R&D department. The competitiveness of PV cells and panels made in China majorly reply on its relatively lower price thanks to other inputs costs and complete market infrastructures, while the technological innovation is still not a Chin ese competitiveness.
Reduced credit accessibility Before the EU-China PV trade dispute and recent global economic crisis, PV production was considered as an emerging and new sector in China. Some local governments had even identified big PV firms as the key driver of local economy. Chinese banks were not totally familiar with the PV industry (and its dynamic). As certain local governments promoted a lot the development of PV industry, this makes the illusion for banks that PV industries are very low ri sk together with the high record of PV panel export in China. This explains why during that period, banks even begged big PV panel production firms to accept their standard (sometimes slightly lower interest rate) rate loans. As the SunTech bankruptcy affair and continuous shut-down of small and mid-sized PV producers due to foreign market shrink and PV sector development, Chinese banks also start to learn better the PV sector. Today, there are very few bank loans accorded to PV panel producers, even for top 10 producers. This is a reason that banks now consider the PV production as indifferent to other sectors and start to allocate their resource to sectors with lower risks or higher return rates.
Environmental pollution The production chain of PV cells and panels is sometimes very polluting. Most of China's current PV producers do not possess clean production technology. The production of polysilicon, ingots and wafers is in particular energy-intensive and environmentally polluting. As China pays more political attention to depollution, environmental cost may be added into production costs, thus reducing their price advantage in the future.
6.2 Strategies
Going out strategy In general, there is a trend for the coming years for Chinese PV manufacturers to go out of China and install production sites in other countries. This is motivated by several reasons: first, to prevent recent EU and US trade protective measures; second, to anticipate tier market development; and third, to integrate into the general Chinese strategy of "one belt, one road" that aims at integrating and promoting Chinese domestic firms into pan EU-Asia economy.
119
So far, mainland and Taiwan firms aim at installing around 3GWp PV cells and panels production in Malaysia, Thailand and Vietnam by the end of 2015. Some Chinese firms also intend to install production site in other countries. For example, CSun, one of the biggest PV cell and modules manufacturers in China, started to install its first production site abroad in Turkey in May 2013 with 100MW and 300MW capacity for PV cells and modules. This makes CSun the first Chinese domestic PV manufacturer that installed outside China and ensured profit. CSun will expand the capacity up to 200MW and 400MW for PV cells and modules in Turkey by the mid 2015. The cost in its Turkish production site almost equals to the cost in its domestic production site in China with a total turnover more than 100 Million USD in 2014 and a positive net profit. CSun has also invested in South Korea in early 2015 with a total first round investment of 20 Million Yuan for a capacity of 200MW PV cell production site. The particularity is that CSun positioned this production site to produce high -end PV products. Before the completion of its production site, CSun's facility in South Korea has already received commands for wafers, PV cells and modules. JinkoSolar, one of the top 10 PV cell producers in the world, has also completed its installation in Malaysia since May 2015 with an annual capacity of 500MW and 450MW for PV cells and modules. JA Solar will also complete its installation in Malaysia with an annual capacity of 400MW for PV modules by the end of 2015. JA Solar also signed a MoU with Essel Infraprojects Ltd, a sub-sector of Indian's big industrial group Essel Group in charge of infrastructures and solar power investment, to co-invest an installation site in India with an annual capacity of producing 500MW PV cells and modules. Trina Solar, another top 10 PV manufacturers in the world, also signed a MoU with Welspun in India aiming at co-investing in a production site in India with 1GW for each of PV cell and modules as well as constructing a PV industry park for vertical integration. Chinese PV firms' actions are also in coherent to China's general strategy of promoting domestic firms at the international market. The State Council of China published on 13 May, 2015 the Guidelines for promoting international cooperation on capacity and manufacturing, which stated that Chinese domestic PV firms should participate actively in foreign tenders to promote international cooperation in the PV industry. Such a strategy could in fact shift current market location where more than 70% PV cells and modules are produced in China. Also, the promotion of international cooperation can also be considered as co-investments in PV manufacturing and R&D in European territory.
From polysilicon to monosilicon The Chinese government continues to require on improvement of PV module efficiency in 2015. NDRC together with other seven ministries published the Implementation Plan of Leaders of Energy Efficiency in January 2015, which requires that transformation efficiency of PV modules with monosilicon and polysilicon higher than 17% and 16.5%, respectively. In February 2015, National Energy Administration issued opinions on promoting technology improvement and sector upgrade of the PV sector. In this document, a minimum PV market entrance was set and it required that solar power developers must apply the most efficient PV modules and inverters in order to be eligible to receiving government subsidies. So far, China's PV capacity is dominated by polysilicon (as mentioned in above sections) and most of the monosilicon-based products are exported. The share of monosilicon wafer in total wafer export increased from 41.6% in 2013 to 43.2% in 2014. At firm level, taking XiAn LONGi Silicon Materials Co Ltd for example, total production of monosilicon wafer is 2GW and 3GW in 2013 and 2014
120
respectively, around 75% are exported and the 25% are further processed in China and exported in the form of monosilicon modules. However, Chinese domestic producers have shown great interests in monosilicon-based products (wafers, modules). For example, GCL power, one of the biggest silicon wafer producers in the world with 13GW capacity and 12.9GW production in 2014, recently announced that it would invest in a 10GW polysilicon project in China. For PV module producers, JA Solar also declared that it would increase its capacity of Percium type monosilicon module from 80MW in 2014 to 400MW by the end of 2015. According to our interviews with PV industries in China, such a trend of focusing on monosilicon is due to the fact that current efficiency of polysilicon-based PV system is closed to its theoretical threshold while monosilicon-based PV modules (P-type, N-type) still have large space to increase its efficiency. In fact, transformation efficiency becomes more and more decisive and kernel for reducing PV modules and BOS costs. Comparing to polysilicon solar power, monosylicon has several advantages as higher stability and transformation rate as well as higher per surface installation rate, etc. Yet the higher cost and more complicated technology and process requirements of monosilicon was not coherent with Chinese domestic investor's "short-term fast money" logic. This explains why polysilicon dominated current PV market in China. As monosilicon-related system costs continues to go down, together with the Chinese government's requirement of developing high efficient PV industries, the monosilicon market in China is anticipated to have a 50% future market share by 2018.
121
Chapitre 6
La course aux technologies vertes dans le secteur des biocarburants pour l’aviation
(chapitre en anglais)
122
Table des matières
1. Executive Summary ........................................................................................................ 123
2. The case for aviation biofuels .................................................... Erreur ! Signet non défini. i. Introduction .................................................................................................................... 124 ii. Background .................................................................................................................... 124 iii. Sustainable alternative jet fuel ....................................................................................... 126 iv. Cost............................................................................................................................... 129 v. Drivers of innovation ....................................................................................................... 135
3. Support policies .............................................................................................................. 137 vi. Recommendations ......................................................................................................... 140
4. Conclusion.................................................................................................................... 143
123
Executive Summary
The global aviation industry is responsible for about 2% of total green house gas (GHG)
emissions worldwide, most of which result from the burning of kerosene during flights.
Given high industry growth rates, it is clear to observers that fuel-efficiency gains will be
unable to bring about a reduction in absolute aviation-related emissions over the coming
decades, meaning that alternative power sources will have to be found. Alternative jet fuels
are being developed that will allow flights to be powered by renewable sources in the
future, although at the moment, these technologies are either speculative or at a very early
stage of development. Current discussions on this issue are focussed on “drop-in” biofuels
for aviation, which are identical to and fungible with conventional kerosene, but are made
from biomass and therefore have a better carbon footprint than their fossi l fuel
counterparts. However, question marks remain over all alternative jet fuels with regards to
their commercial viability and their potential at the large scales demanded by the aviation
industry. This paper provides an overview of the different technologies available, concluding
that cost – and in particular, the cost of feedstocks used in the production process – remain
a major stumbling block in the development of aviation biofuels.
The paper also provides an overview of existing support policies and attempts to identify the
different motivations behind the development of aviation biofuels, which straddle a number
of policy areas: environment and sustainability, economic development, energy security,
agricultural support. It evaluates the advantages and disadvantages of existing policies and
makes recommendations with a view to developing an enabling framework for green
technologies in the aviation sector. Its main conclusion is that alternative jet fuels are not yet
able to make a significant contribution to GHG emissions reduction in aviation. More support
is needed to improve the performance of aviation biofuels and integrate them into existing
logistics infrastructure at scale. In the meantime, it is recommended that the industry be
made to internalise some of the negative externalities generated by air travel, particularly in
the case of short-haul flights, for which other, less carbon-intensive transport modes can
substitute. This will be achieved in the long run through economic instruments like the EU
ETS and, eventually, the international market-based mechanism (MBM) being discussed at
ICAO. In the short-term, governments could address these issues by considering different
taxation options, and using the revenues to fund further efforts to de-carbonise aviation.
Unless applied across the board, however, such a solution could affect the competitiveness
of airlines based in the countries where the tax is first introduced. A more indirect and less
conspicuous means of taxing short-haul aviation would involve an adjustment of airport
taxes, especially those with a greater reliance on budget airlines.
Insofar as the Green Race is concerned, it is not clear if there are advantages to be gained
from being a first- or second-mover in the development of aviation biofuels, as the
technology is still immature and its full potential has not yet been confirmed.
124
1. Introduction
The case for developing alternative jet fuel for aeroplanes is compelling. Arguments in
favour have been made in a number of recent publications, of which perhaps the most
comprehensive is Walter J. Palmer’s book-length study: Will Sustainability Fly? Aviation Fuel
Options in a Low-Carbon World (Palmer 2015). In this book and elsewhere, proponents of
alternative jet fuels begin by estimating the (historical, current and predicted) contribution
of aviation to total Green House Gas (GHG) emissions worldwide, before explaining why the
development of alternative jet fuels could be the most important means of reducing the
negative environmental impacts of aviation over the next decades. This paper will briefly
summarise these arguments, before proceeding to examine a range of alternative jet fuels
that are either available or expected to become available in the coming years. The purpose
of the paper is to develop policy recommendations for the French and European contexts,
with a view to achieving the following objectives:
(i) minimise the environmental impact of aviation (bearing in mind the industry
commitment to reduce emissions by 50% in 2050);
(ii) minimise the economic costs incurred by the domestic aviation industry as a result of
objective (i);
(iii) maximise the economic gains from new global value chains that will emerge to meet
demand for sustainable aviation solutions.
These objectives correspond to the terms of reference of the Green Race project, which
seeks to identify opportunities for stimulating “green growth” and increasing the
competitiveness of France and Europe vis-à-vis emerging markets like China, with a focus on
three specific green technologies: solar PV, wind and alternative jet fuels. The last case study
to be presented – on alternative jet fuels – distinguishes itself from the previous two, due to
the immaturity of the relevant technologies and the scarcity of existing value chains to be
studied. The following discussion will therefore offer some projections regarding the future
development of alternative jet fuel technologies and associated value chains before
attempting to develop “Green Race” strategies for France and Europe in this sector. In
particular, we hope to determine whether a first- or second-mover strategy would be most
appropriate, given the current state of affairs and possible future scenarios.
2. Background
The share of global GHG emissions attributable to aviation has been estimated at around
2%-3%, although the inclusion of substances other than CO2 can be considered to increase
this figure to 5% (Palmer 2015). The contribution of aviation to global GHG emissions can
therefore be considered rather minor in comparison with other sectors, like land transport
and electricity. There is nevertheless still cause for concern, given prevailing growth
projections for the industry over the coming decades: this could amount to more than 5%
per annum, leading to a sixfold increase by 2050 (Pearce 2015). Combine this with expected
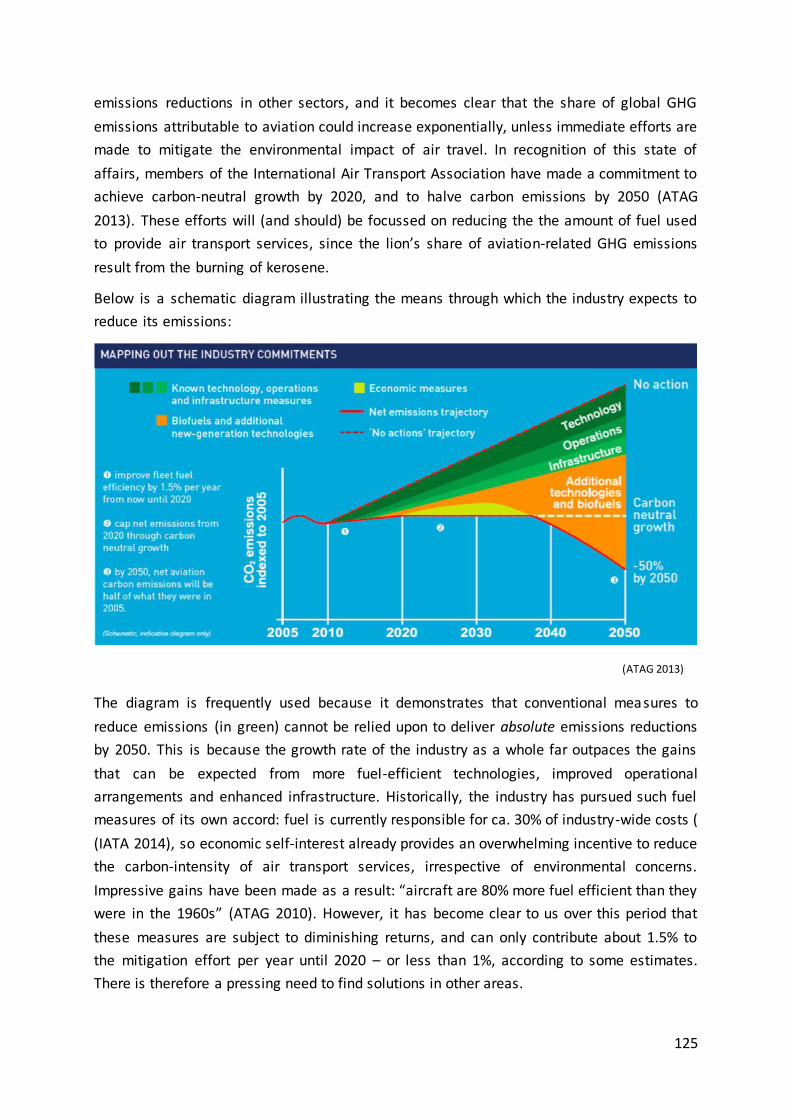
125
emissions reductions in other sectors, and it becomes clear that the share of global GHG
emissions attributable to aviation could increase exponentially, unless immediate efforts are
made to mitigate the environmental impact of air travel. In recognition of this state of
affairs, members of the International Air Transport Association have made a commitment to
achieve carbon-neutral growth by 2020, and to halve carbon emissions by 2050 (ATAG
2013). These efforts will (and should) be focussed on reducing the the amount of fuel used
to provide air transport services, since the lion’s share of aviation-related GHG emissions
result from the burning of kerosene.
Below is a schematic diagram illustrating the means through which the industry expects to
reduce its emissions:
The diagram is frequently used because it demonstrates that conventional measures to
reduce emissions (in green) cannot be relied upon to deliver absolute emissions reductions
by 2050. This is because the growth rate of the industry as a whole far outpaces the gains
that can be expected from more fuel-efficient technologies, improved operational
arrangements and enhanced infrastructure. Historically, the industry has pursued such fuel
measures of its own accord: fuel is currently responsible for ca. 30% of industry-wide costs (
(IATA 2014), so economic self-interest already provides an overwhelming incentive to reduce
the carbon-intensity of air transport services, irrespective of environmental concerns.
Impressive gains have been made as a result: “aircraft are 80% more fuel efficient than they
were in the 1960s” (ATAG 2010). However, it has become clear to us over this period that
these measures are subject to diminishing returns, and can only contribute about 1.5% to
the mitigation effort per year until 2020 – or less than 1%, according to some estimates.
There is therefore a pressing need to find solutions in other areas.
(ATAG 2013)
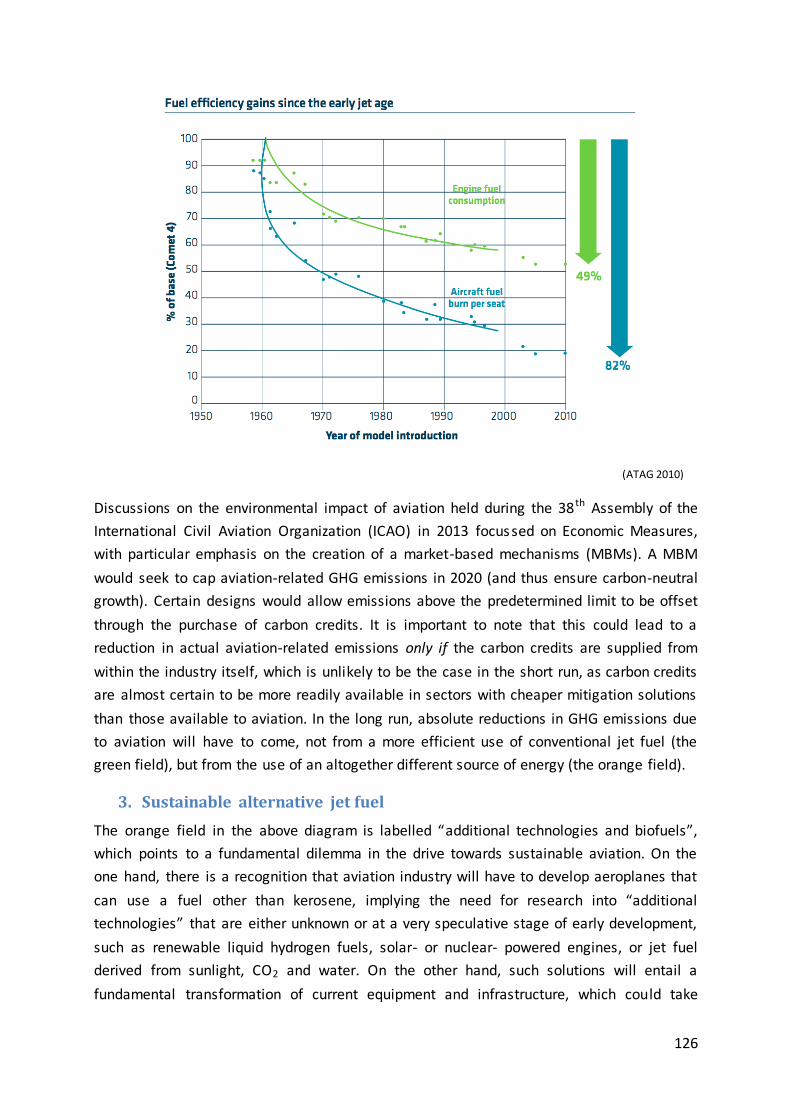
126
Discussions on the environmental impact of aviation held during the 38th Assembly of the
International Civil Aviation Organization (ICAO) in 2013 focussed on Economic Measures,
with particular emphasis on the creation of a market-based mechanisms (MBMs). A MBM
would seek to cap aviation-related GHG emissions in 2020 (and thus ensure carbon-neutral
growth). Certain designs would allow emissions above the predetermined limit to be offset
through the purchase of carbon credits. It is important to note that this could lead to a
reduction in actual aviation-related emissions only if the carbon credits are supplied from
within the industry itself, which is unlikely to be the case in the short run, as carbon credits
are almost certain to be more readily available in sectors with cheaper mitigation solutions
than those available to aviation. In the long run, absolute reductions in GHG emissions due
to aviation will have to come, not from a more efficient use of conventional jet fuel (the
green field), but from the use of an altogether different source of energy (the orange field).
3. Sustainable alternative jet fuel
The orange field in the above diagram is labelled “additional technologies and biofuels”,
which points to a fundamental dilemma in the drive towards sustainable aviation. On the
one hand, there is a recognition that aviation industry will have to develop aeroplanes that
can use a fuel other than kerosene, implying the need for research into “additional
technologies” that are either unknown or at a very speculative stage of early development,
such as renewable liquid hydrogen fuels, solar- or nuclear- powered engines, or jet fuel
derived from sunlight, CO2 and water. On the other hand, such solutions will entail a
fundamental transformation of current equipment and infrastructure, which could take
(ATAG 2010)
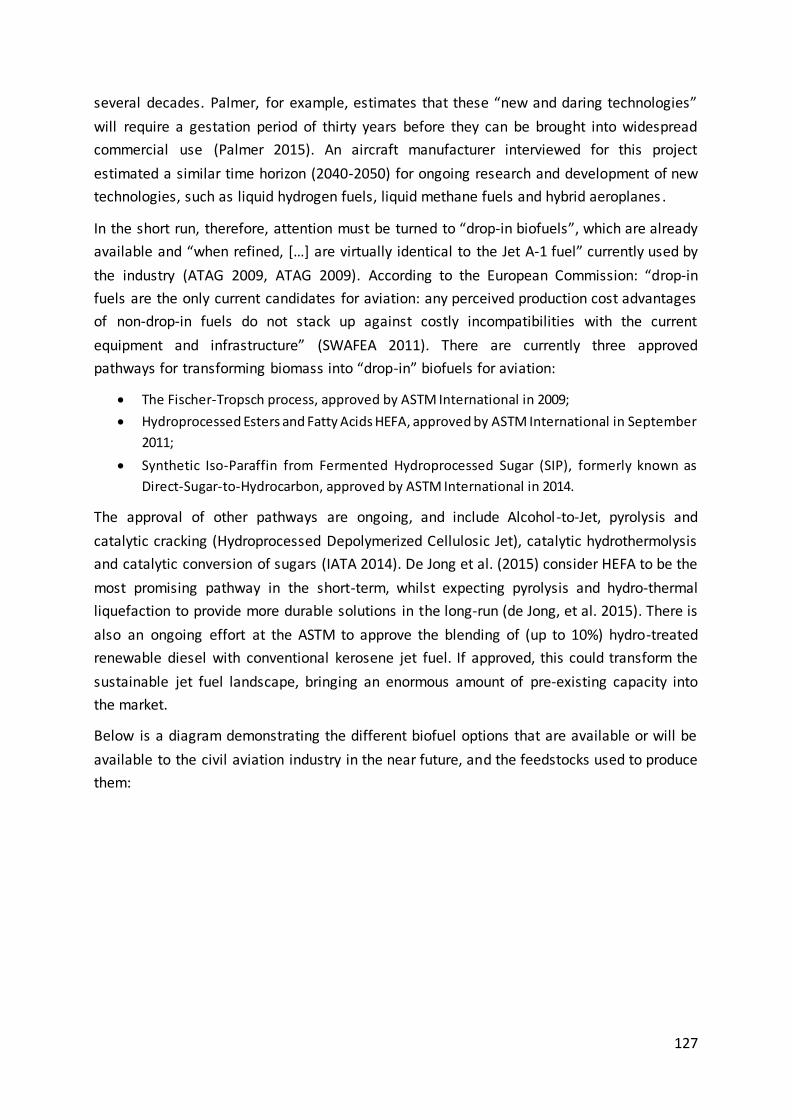
127
several decades. Palmer, for example, estimates that these “new and daring technologies”
will require a gestation period of thirty years before they can be brought into widespread
commercial use (Palmer 2015). An aircraft manufacturer interviewed for this project
estimated a similar time horizon (2040-2050) for ongoing research and development of new
technologies, such as liquid hydrogen fuels, liquid methane fuels and hybrid aeroplanes .
In the short run, therefore, attention must be turned to “drop-in biofuels”, which are already
available and “when refined, […] are virtually identical to the Jet A-1 fuel” currently used by
the industry (ATAG 2009, ATAG 2009). According to the European Commission: “drop-in
fuels are the only current candidates for aviation: any perceived production cost advantages
of non-drop-in fuels do not stack up against costly incompatibilities with the current
equipment and infrastructure” (SWAFEA 2011). There are currently three approved
pathways for transforming biomass into “drop-in” biofuels for aviation:
The Fischer-Tropsch process, approved by ASTM International in 2009;
Hydroprocessed Esters and Fatty Acids HEFA, approved by ASTM International in September
2011;
Synthetic Iso-Paraffin from Fermented Hydroprocessed Sugar (SIP), formerly known as
Direct-Sugar-to-Hydrocarbon, approved by ASTM International in 2014.
The approval of other pathways are ongoing, and include Alcohol-to-Jet, pyrolysis and
catalytic cracking (Hydroprocessed Depolymerized Cellulosic Jet), catalytic hydrothermolysis
and catalytic conversion of sugars (IATA 2014). De Jong et al. (2015) consider HEFA to be the
most promising pathway in the short-term, whilst expecting pyrolysis and hydro-thermal
liquefaction to provide more durable solutions in the long-run (de Jong, et al. 2015). There is
also an ongoing effort at the ASTM to approve the blending of (up to 10%) hydro-treated
renewable diesel with conventional kerosene jet fuel. If approved, this could transform the
sustainable jet fuel landscape, bringing an enormous amount of pre-existing capacity into
the market.
Below is a diagram demonstrating the different biofuel options that are available or will be
available to the civil aviation industry in the near future, and the feedstocks used to produce
them:
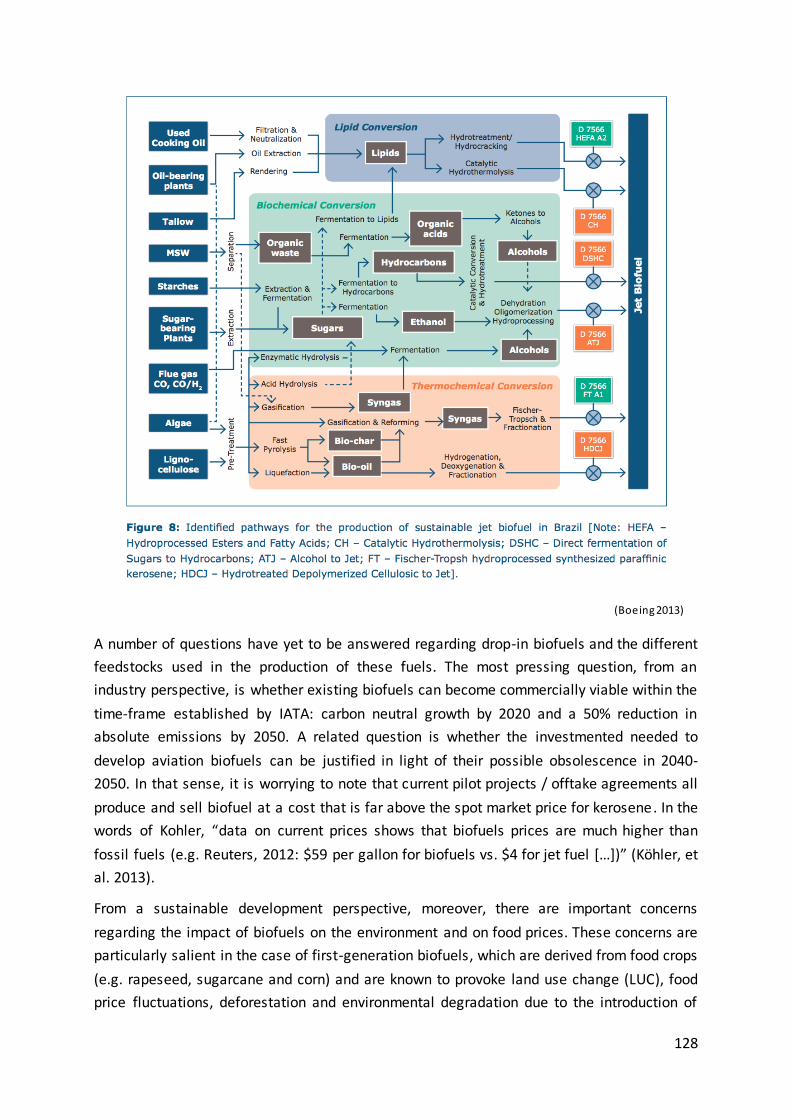
128
A number of questions have yet to be answered regarding drop-in biofuels and the different
feedstocks used in the production of these fuels. The most pressing question, from an
industry perspective, is whether existing biofuels can become commercially viable within the
time-frame established by IATA: carbon neutral growth by 2020 and a 50% reduction in
absolute emissions by 2050. A related question is whether the investmented needed to
develop aviation biofuels can be justified in light of their possible obsolescence in 2040-
2050. In that sense, it is worrying to note that current pilot projects / offtake agreements all
produce and sell biofuel at a cost that is far above the spot market price for kerosene. In the
words of Kohler, “data on current prices shows that biofuels prices are much higher than
fossil fuels (e.g. Reuters, 2012: $59 per gallon for biofuels vs. $4 for jet fuel […])” (Köhler, et
al. 2013).
From a sustainable development perspective, moreover, there are important concerns
regarding the impact of biofuels on the environment and on food prices. These concerns are
particularly salient in the case of first-generation biofuels, which are derived from food crops
(e.g. rapeseed, sugarcane and corn) and are known to provoke land use change (LUC), food
price fluctuations, deforestation and environmental degradation due to the introduction of
(Boeing 2013)
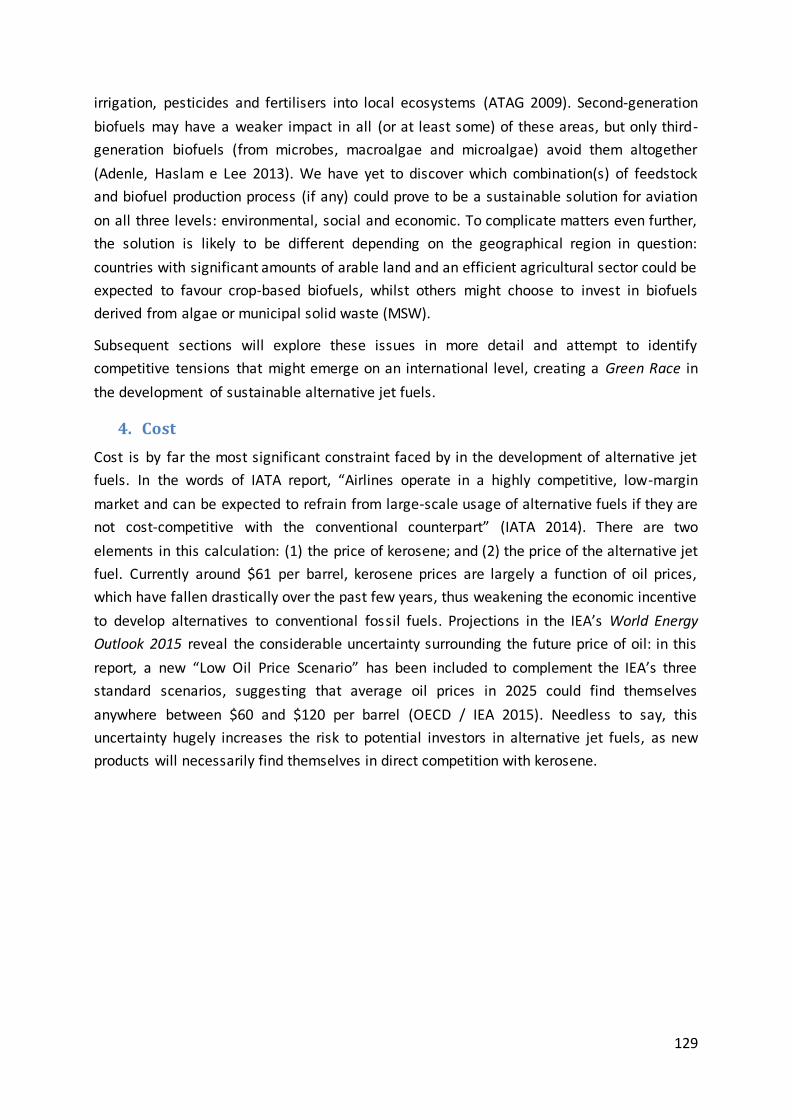
129
irrigation, pesticides and fertilisers into local ecosystems (ATAG 2009). Second-generation
biofuels may have a weaker impact in all (or at least some) of these areas, but only third-
generation biofuels (from microbes, macroalgae and microalgae) avoid them altogether
(Adenle, Haslam e Lee 2013). We have yet to discover which combination(s) of feedstock
and biofuel production process (if any) could prove to be a sustainable solution for aviation
on all three levels: environmental, social and economic. To complicate matters even further,
the solution is likely to be different depending on the geographical region in question:
countries with significant amounts of arable land and an efficient agricultural sector could be
expected to favour crop-based biofuels, whilst others might choose to invest in biofuels
derived from algae or municipal solid waste (MSW).
Subsequent sections will explore these issues in more detail and attempt to identify
competitive tensions that might emerge on an international level, creating a Green Race in
the development of sustainable alternative jet fuels.
4. Cost
Cost is by far the most significant constraint faced by in the development of alternative jet
fuels. In the words of IATA report, “Airlines operate in a highly competitive, low-margin
market and can be expected to refrain from large-scale usage of alternative fuels if they are
not cost-competitive with the conventional counterpart” (IATA 2014). There are two
elements in this calculation: (1) the price of kerosene; and (2) the price of the alternative jet
fuel. Currently around $61 per barrel, kerosene prices are largely a function of oil prices,
which have fallen drastically over the past few years, thus weakening the economic incentive
to develop alternatives to conventional fossil fuels. Projections in the IEA’s World Energy
Outlook 2015 reveal the considerable uncertainty surrounding the future price of oil: in this
report, a new “Low Oil Price Scenario” has been included to complement the IEA’s three
standard scenarios, suggesting that average oil prices in 2025 could find themselves
anywhere between $60 and $120 per barrel (OECD / IEA 2015). Needless to say, this
uncertainty hugely increases the risk to potential investors in alternative jet fuels, as new
products will necessarily find themselves in direct competition with kerosene.
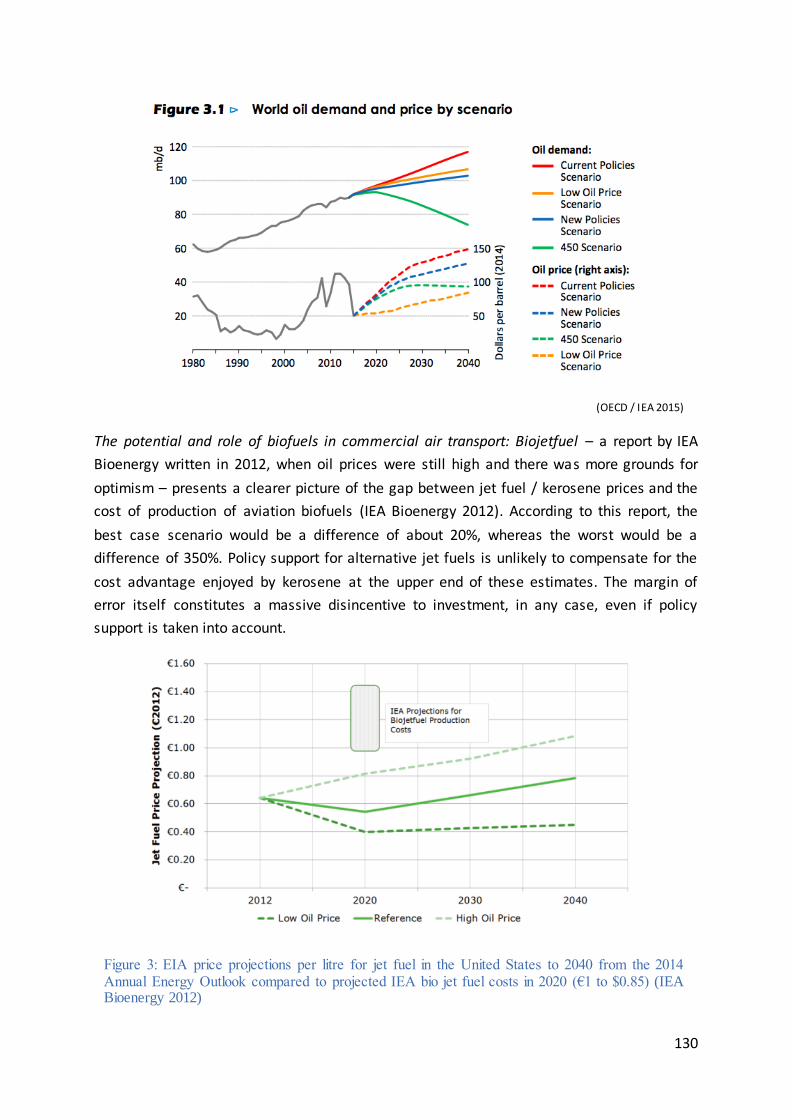
130
The potential and role of biofuels in commercial air transport: Biojetfuel – a report by IEA
Bioenergy written in 2012, when oil prices were still high and there was more grounds for
optimism – presents a clearer picture of the gap between jet fuel / kerosene prices and the
cost of production of aviation biofuels (IEA Bioenergy 2012). According to this report, the
best case scenario would be a difference of about 20%, whereas the worst would be a
difference of 350%. Policy support for alternative jet fuels is unlikely to compensate for the
cost advantage enjoyed by kerosene at the upper end of these estimates. The margin of
error itself constitutes a massive disincentive to investment, in any case, even if policy
support is taken into account.
(OECD / IEA 2015)
Figure 3: EIA price projections per litre for jet fuel in the United States to 2040 from the 2014 Annual Energy Outlook compared to projected IEA bio jet fuel costs in 2020 (€1 to $0.85) (IEA Bioenergy 2012)
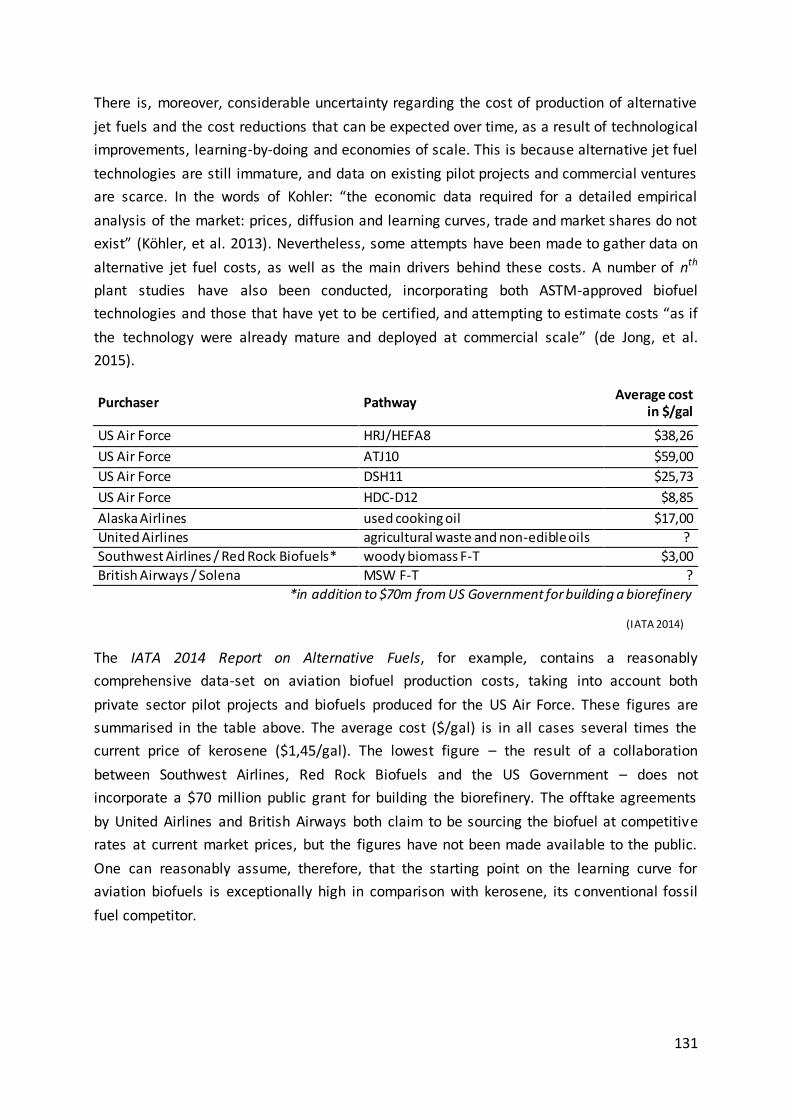
131
There is, moreover, considerable uncertainty regarding the cost of production of alternative
jet fuels and the cost reductions that can be expected over time, as a result of technological
improvements, learning-by-doing and economies of scale. This is because alternative jet fuel
technologies are still immature, and data on existing pilot projects and commercial ventures
are scarce. In the words of Kohler: “the economic data required for a detailed empirical
analysis of the market: prices, diffusion and learning curves, trade and market shares do not
exist” (Köhler, et al. 2013). Nevertheless, some attempts have been made to gather data on
alternative jet fuel costs, as well as the main drivers behind these costs. A number of nth
plant studies have also been conducted, incorporating both ASTM-approved biofuel
technologies and those that have yet to be certified, and attempting to estimate costs “as if
the technology were already mature and deployed at commercial scale” (de Jong, et al.
2015).
Purchaser Pathway Average cost
in $/gal
US Air Force HRJ/HEFA8 $38,26
US Air Force ATJ10 $59,00
US Air Force DSH11 $25,73
US Air Force HDC-D12 $8,85
Alaska Airlines used cooking oil $17,00
United Airlines agricultural waste and non-edible oils ?
Southwest Airlines / Red Rock Biofuels* woody biomass F-T $3,00
British Airways / Solena MSW F-T ?
*in addition to $70m from US Government for building a biorefinery
The IATA 2014 Report on Alternative Fuels, for example, contains a reasonably
comprehensive data-set on aviation biofuel production costs, taking into account both
private sector pilot projects and biofuels produced for the US Air Force. These figures are
summarised in the table above. The average cost ($/gal) is in all cases several times the
current price of kerosene ($1,45/gal). The lowest figure – the result of a collaboration
between Southwest Airlines, Red Rock Biofuels and the US Government – does not
incorporate a $70 million public grant for building the biorefinery. The offtake agreements
by United Airlines and British Airways both claim to be sourcing the biofuel at competitive
rates at current market prices, but the figures have not been made available to the public.
One can reasonably assume, therefore, that the starting point on the learning curve for
aviation biofuels is exceptionally high in comparison with kerosene, its conventional fossil
fuel competitor.
(IATA 2014)
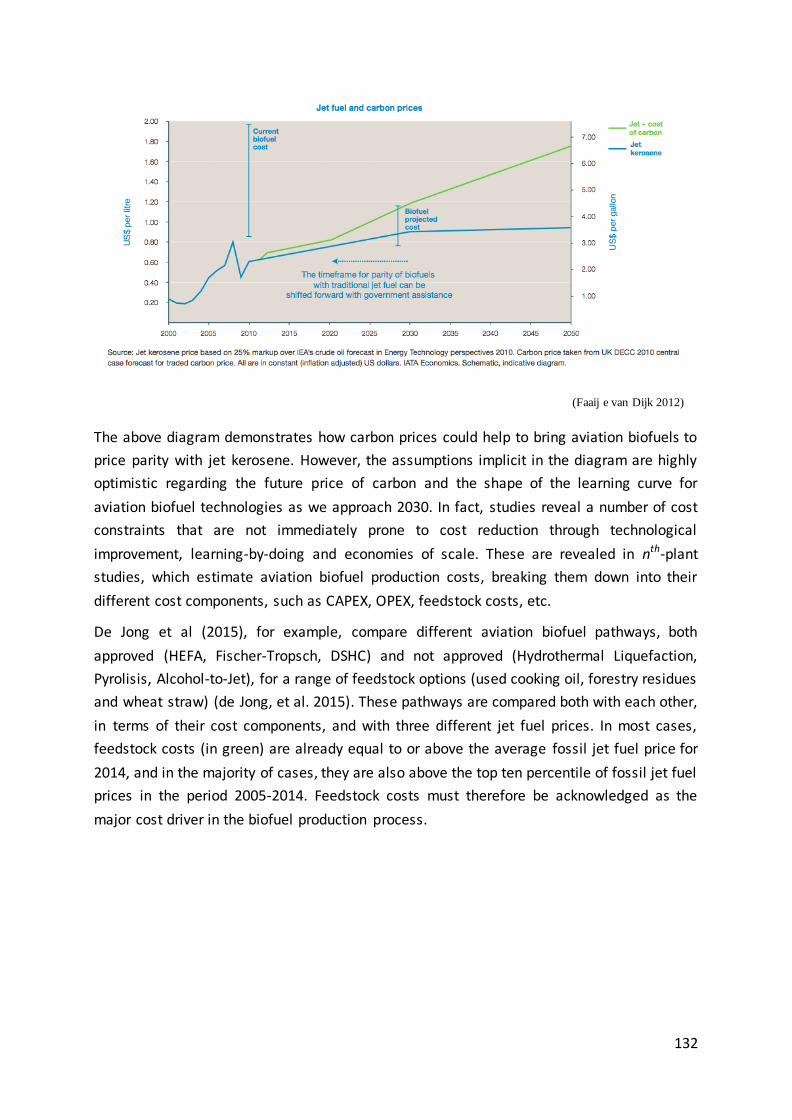
132
The above diagram demonstrates how carbon prices could help to bring aviation biofuels to
price parity with jet kerosene. However, the assumptions implicit in the diagram are highly
optimistic regarding the future price of carbon and the shape of the learning curve for
aviation biofuel technologies as we approach 2030. In fact, studies reveal a number of cost
constraints that are not immediately prone to cost reduction through technological
improvement, learning-by-doing and economies of scale. These are revealed in nth-plant
studies, which estimate aviation biofuel production costs, breaking them down into their
different cost components, such as CAPEX, OPEX, feedstock costs, etc.
De Jong et al (2015), for example, compare different aviation biofuel pathways, both
approved (HEFA, Fischer-Tropsch, DSHC) and not approved (Hydrothermal Liquefaction,
Pyrolisis, Alcohol-to-Jet), for a range of feedstock options (used cooking oil, forestry residues
and wheat straw) (de Jong, et al. 2015). These pathways are compared both with each other,
in terms of their cost components, and with three different jet fuel prices. In most cases,
feedstock costs (in green) are already equal to or above the average fossil jet fuel price for
2014, and in the majority of cases, they are also above the top ten percentile of fossil jet fuel
prices in the period 2005-2014. Feedstock costs must therefore be acknowledged as the
major cost driver in the biofuel production process.
(Faaij e van Dijk 2012)
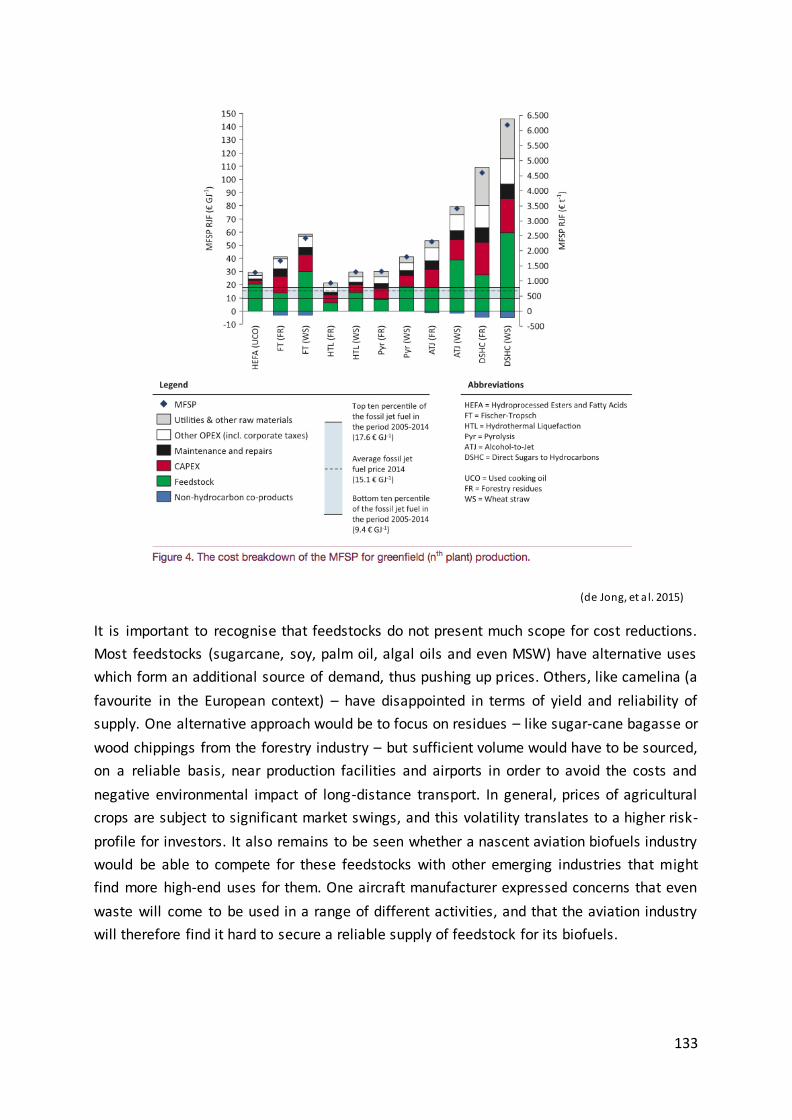
133
It is important to recognise that feedstocks do not present much scope for cost reductions.
Most feedstocks (sugarcane, soy, palm oil, algal oils and even MSW) have alternative uses
which form an additional source of demand, thus pushing up prices. Others, like camelina (a
favourite in the European context) – have disappointed in terms of yield and reliability of
supply. One alternative approach would be to focus on residues – like sugar-cane bagasse or
wood chippings from the forestry industry – but sufficient volume would have to be sourced,
on a reliable basis, near production facilities and airports in order to avoid the costs and
negative environmental impact of long-distance transport. In general, prices of agricultural
crops are subject to significant market swings, and this volatility translates to a higher risk-
profile for investors. It also remains to be seen whether a nascent aviation biofuels industry
would be able to compete for these feedstocks with other emerging industries that might
find more high-end uses for them. One aircraft manufacturer expressed concerns that even
waste will come to be used in a range of different activities, and that the aviation industry
will therefore find it hard to secure a reliable supply of feedstock for its biofuels.
(de Jong, et a l. 2015)
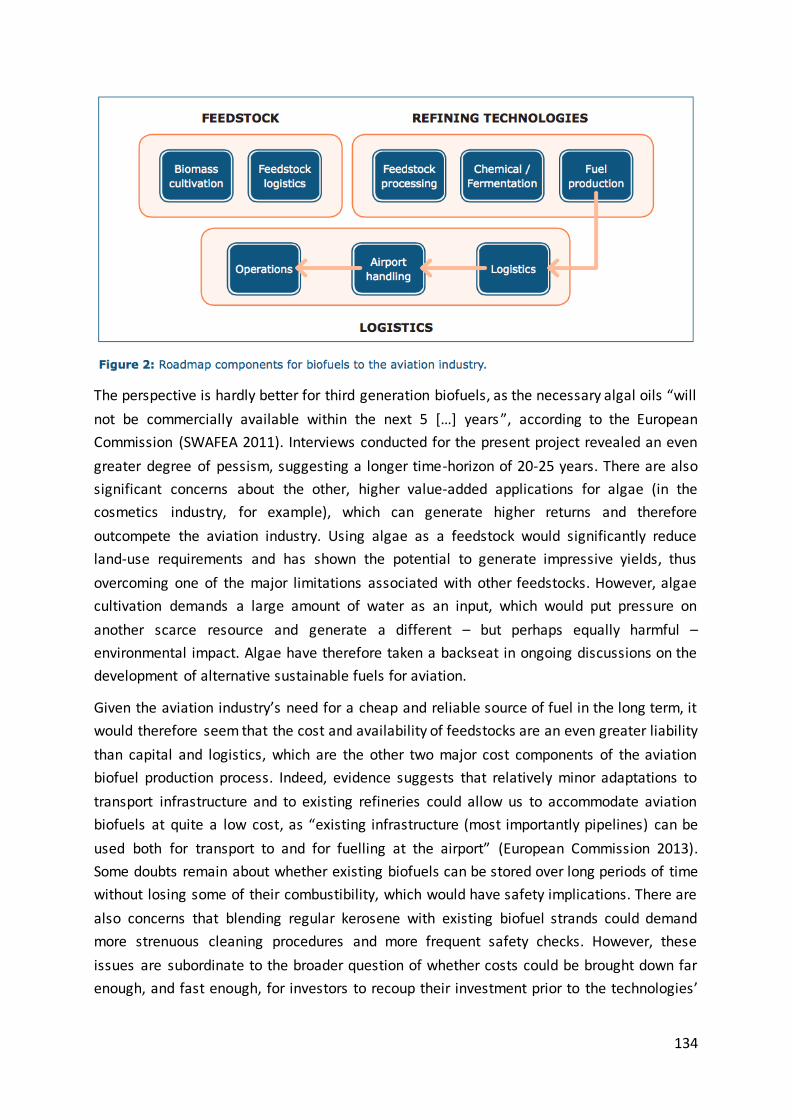
134
The perspective is hardly better for third generation biofuels, as the necessary algal oils “will
not be commercially available within the next 5 […] years”, according to the European
Commission (SWAFEA 2011). Interviews conducted for the present project revealed an even
greater degree of pessism, suggesting a longer time-horizon of 20-25 years. There are also
significant concerns about the other, higher value-added applications for algae (in the
cosmetics industry, for example), which can generate higher returns and therefore
outcompete the aviation industry. Using algae as a feedstock would significantly reduce
land-use requirements and has shown the potential to generate impressive yields, thus
overcoming one of the major limitations associated with other feedstocks. However, algae
cultivation demands a large amount of water as an input, which would put pressure on
another scarce resource and generate a different – but perhaps equally harmful –
environmental impact. Algae have therefore taken a backseat in ongoing discussions on the
development of alternative sustainable fuels for aviation.
Given the aviation industry’s need for a cheap and reliable source of fuel in the long term, it
would therefore seem that the cost and availability of feedstocks are an even greater liability
than capital and logistics, which are the other two major cost components of the aviation
biofuel production process. Indeed, evidence suggests that relatively minor adaptations to
transport infrastructure and to existing refineries could allow us to accommodate aviation
biofuels at quite a low cost, as “existing infrastructure (most importantly pipelines) can be
used both for transport to and for fuelling at the airport” (European Commission 2013).
Some doubts remain about whether existing biofuels can be stored over long periods of time
without losing some of their combustibility, which would have safety implications. There are
also concerns that blending regular kerosene with existing biofuel strands could demand
more strenuous cleaning procedures and more frequent safety checks. However, these
issues are subordinate to the broader question of whether costs could be brought down far
enough, and fast enough, for investors to recoup their investment prior to the technologies’
135
obsolence (taking into account rational and affordable support measures from governments
attempting to meet their commitments to reduce GHGs).
5. Drivers of innovation
The preceding discussion makes it clear that the future of aviation biofuels, as a low-carbon
solution for aviation, is riddled with uncertainties. This begs the question: how can
governments justify ambitious support policies when the prospect of rapid cost reductions
are uncertain, the technologies face possible obsolescence over the next 25-35 years, and
the environmental benefits are ambiguous? It has been suggested that aviation biofuels
could be used to ease the transition to a low-carbon future, but given the high costs and
short time-horizon, risk-averse investors can be forgiven for suspecting that they will be
unable to recoup their investments before another, better low-carbon solution for aviation
enters the scene. Governments should also be cautious not to expect too much from
aviation biofuels in terms of economic growth, employment and other typical “green
growth” benefits. These could be limited or short-lived, and simply substitute economic
activities in the domestic oil and gas sector. In order to understand recent efforts to promote
aviation biofuels, therefore, we have to look elsewhere.
The USA is currently the “world leader in biofuels production and has the highest level of
technological development activity in patents and demonstration plants”, so the history of
its domestic production can perhaps help us to identify the most important drivers of
aviation biofuel development (Köhler, et al. 2013). As expected, GHG reductions and
economic growth have not been the main motivation behind US support for aviation biofuel
technologies. Energy security concerns have clearly played a much greater role, explaining
grants from the US Department of Defense through DARPA (Defense Advanced Research
Project Agency) and the US Air Force’s aggressive public procurement policies, including its
target to have “have one-half of its jet fuel nonpetroleum-based by the year 2016” (ATAG
2011). More recently, the Farm to Fly initiative (July 2010) brought together the US
Department of Agriculture, the US Air Transport Association and Boeing in a commitment to
“accelerate the availability of a commercially viable sustainable aviation biofuel industry in
the United States, increase domestic energy security, establish regional supply chains and
support rural development” (ATAG 2011). Domestic farm support has thus emerged as
another driver behind public support for aviation biofuels in the US.
In the debate on sustainable alternative jet fuels, it is important to take into account such
(potentially conflicting) interests, in order to avoid a situation in which different countries –
in conjunction with representatives of domestic industries and farm lobbies – seek to take
advantage of their standing in global fora (IATA, ICAO) to promote low-carbon solutions that
suit their own interests, regardless of the net impact on a global level. To some extent, this
seems to be happening already, as Boeing and the US government push hard to promote
crop-based biofuels as the alternative jet fuel of choice, whilst Airbus and EU governments
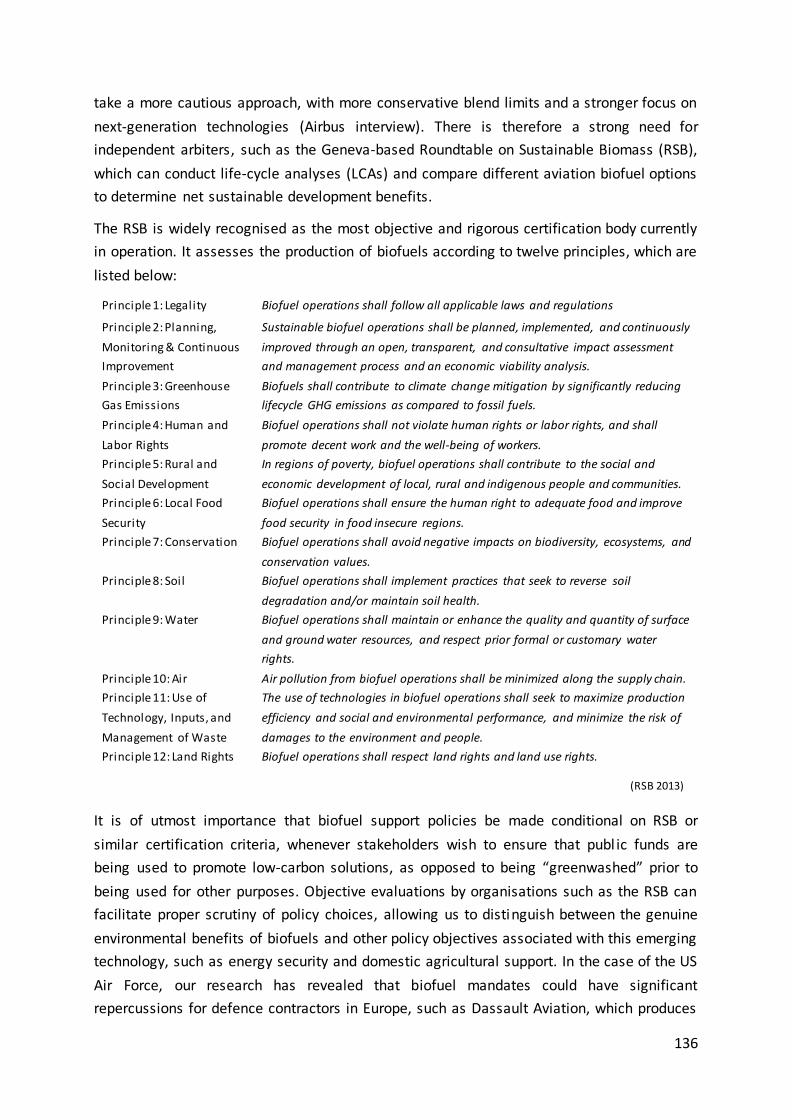
136
take a more cautious approach, with more conservative blend limits and a stronger focus on
next-generation technologies (Airbus interview). There is therefore a strong need for
independent arbiters, such as the Geneva-based Roundtable on Sustainable Biomass (RSB),
which can conduct life-cycle analyses (LCAs) and compare different aviation biofuel options
to determine net sustainable development benefits.
The RSB is widely recognised as the most objective and rigorous certification body currently
in operation. It assesses the production of biofuels according to twelve principles, which are
listed below:
Principle 1: Legality Biofuel operations shall follow all applicable laws and regulations
Principle 2: Planning,
Monitoring & Continuous
Improvement
Sustainable biofuel operations shall be planned, implemented, and continuously
improved through an open, transparent, and consultative impact assessment
and management process and an economic viability analysis.
Principle 3: Greenhouse
Gas Emissions
Biofuels shall contribute to climate change mitigation by significantly reducing
lifecycle GHG emissions as compared to fossil fuels.
Principle 4: Human and
Labor Rights
Biofuel operations shall not violate human rights or labor rights, and shall
promote decent work and the well-being of workers.
Principle 5: Rural and
Social Development
In regions of poverty, biofuel operations shall contribute to the social and
economic development of local, rural and indigenous people and communities.
Principle 6: Local Food
Security
Biofuel operations shall ensure the human right to adequate food and improve
food security in food insecure regions.
Principle 7: Conservation Biofuel operations shall avoid negative impacts on biodiversity, ecosystems, and
conservation values.
Principle 8: Soil Biofuel operations shall implement practices that seek to reverse soil
degradation and/or maintain soil health.
Principle 9: Water Biofuel operations shall maintain or enhance the quality and quantity of surface
and ground water resources, and respect prior formal or customary water
rights.
Principle 10: Air Air pollution from biofuel operations shall be minimized along the supply chain.
Principle 11: Use of
Technology, Inputs, and
Management of Waste
The use of technologies in biofuel operations shall seek to maximize production
efficiency and social and environmental performance, and minimize the risk of
damages to the environment and people.
Principle 12: Land Rights Biofuel operations shall respect land rights and land use rights.
It is of utmost importance that biofuel support policies be made conditional on RSB or
similar certification criteria, whenever stakeholders wish to ensure that publ ic funds are
being used to promote low-carbon solutions, as opposed to being “greenwashed” prior to
being used for other purposes. Objective evaluations by organisations such as the RSB can
facilitate proper scrutiny of policy choices, allowing us to distinguish between the genuine
environmental benefits of biofuels and other policy objectives associated with this emerging
technology, such as energy security and domestic agricultural support. In the case of the US
Air Force, our research has revealed that biofuel mandates could have significant
repercussions for defence contractors in Europe, such as Dassault Aviation, which produces
(RSB 2013)
137
the well-known Rafale fighter jets. Rafale jets are not designed to run on biofuels, and could
therefore lose access an important market unless they are adapted to burn the kind of
blends that the USAF is targeting in the near future. It is therefore in the interest of defence
contractors in Europe to rigorously scrutinize any environmental claims made by US biofuel
support programmes.
6. Support policies
Aside from the USAF procurement policies described above, support policies for aviation
biofuels are rather scarce at the moment. In Europe, flights within the European economic
Area (EEA) are subject to the EU Emissions Trading Scheme (ETS), which can be seen as an
indirect stimulus for biofuel production. However, the original objective of legislation passed
in 2012 – seeking to bring all flights to and from the European Union into the scope of the
ETS – was suspended due to intense pressure from the US and others. Partner countries
insisted that the measure should not be introduced prior to the development of an
international MBM, to be agreed upon during the 2016 ICAO General Assembly and applied
by 2020 at the latest. In any case, the ETS is unlikely to have a strong influence on the
development of aviation biofuels in the short run, as airlines are likely to prefer offsetting
their emissions through the purchase of surplus allowances from other sectors or industries,
as this will continue to be the cheaper option for the foreseeable future. The reduction of
emissions from within the industry itself could thus be postponed to an uncertain future
date.
Notwithstanding the above, more targeted efforts have been made to support aviation
biofuels in Europe, in the form of targets, funding for research and development (R&D) and
public support for pilot projects. These inscribe themselves into the European Commission’s
(European Comission 2011), a plan developed by the High Level Group on Aviation Research.
The objectives included are expected to lead to a 75% reduction in CO2 emissions per
passenger kilometre by 2050, as can be seen in the below diagram:
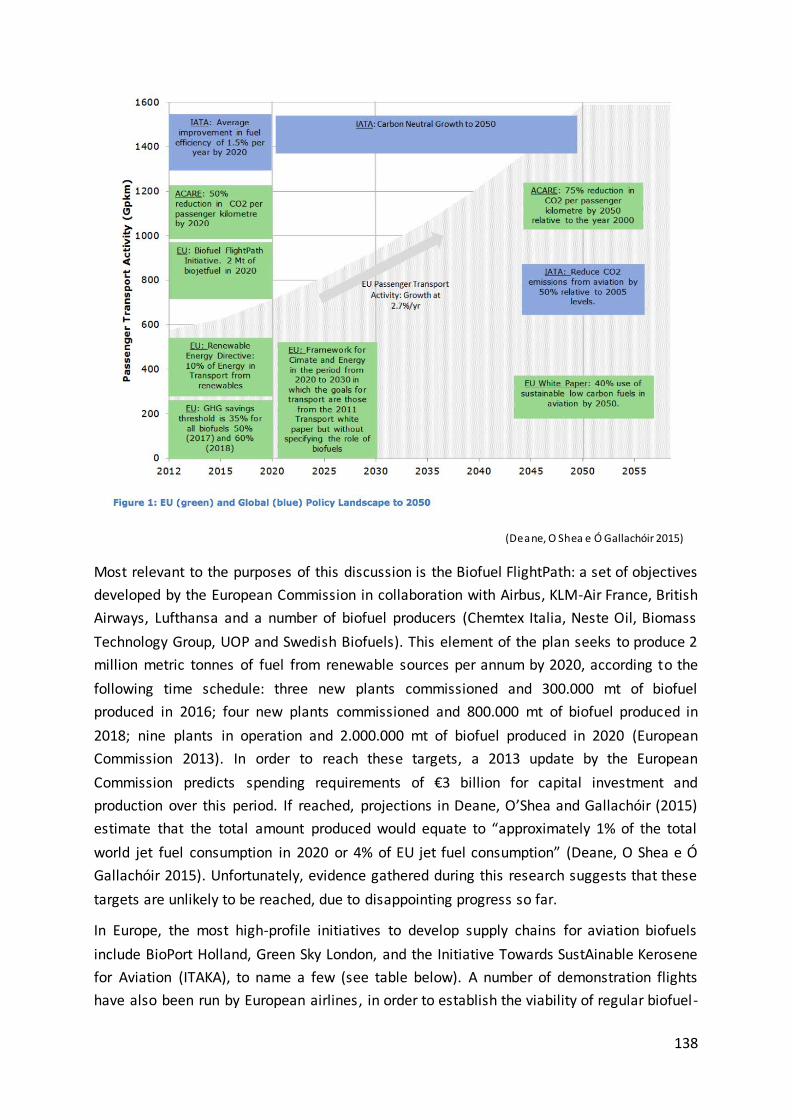
138
Most relevant to the purposes of this discussion is the Biofuel FlightPath: a set of objectives
developed by the European Commission in collaboration with Airbus, KLM-Air France, British
Airways, Lufthansa and a number of biofuel producers (Chemtex Italia, Neste Oil, Biomass
Technology Group, UOP and Swedish Biofuels). This element of the plan seeks to produce 2
million metric tonnes of fuel from renewable sources per annum by 2020, according to the
following time schedule: three new plants commissioned and 300.000 mt of biofuel
produced in 2016; four new plants commissioned and 800.000 mt of biofuel produced in
2018; nine plants in operation and 2.000.000 mt of biofuel produced in 2020 (European
Commission 2013). In order to reach these targets, a 2013 update by the European
Commission predicts spending requirements of €3 billion for capital investment and
production over this period. If reached, projections in Deane, O’Shea and Gallachóir (2015)
estimate that the total amount produced would equate to “approximately 1% of the total
world jet fuel consumption in 2020 or 4% of EU jet fuel consumption” (Deane, O Shea e Ó
Gallachóir 2015). Unfortunately, evidence gathered during this research suggests that these
targets are unlikely to be reached, due to disappointing progress so far.
In Europe, the most high-profile initiatives to develop supply chains for aviation biofuels
include BioPort Holland, Green Sky London, and the Initiative Towards SustAinable Kerosene
for Aviation (ITAKA), to name a few (see table below). A number of demonstration flights
have also been run by European airlines, in order to establish the viability of regular biofuel-
(Deane, O Shea e Ó Gallachóir 2015)
139
powered flights, including: Lab’Line, a weekly Air-France flight between Paris Orly and
Toulouse, run on a 10% blend of Amyris-Total Farnesene (a SIP biofuel) and counting on the
support of Safran and DGAC72; a KLM Takes Care series of twenty weekly flights between
Amsterdam and Aruba, run on biofuels sourced by ITAKA and supplied by SkyNRG; and
Burnfair, a series of four daily round flights between Hamburg and Frankfurt, fuelled with a
50% blend of HEFA synthetic fuel produced by Neste Oil in its refinery of Porvoo in Finland.
Name Partners Description
BioPort
Holland
KLM, Schiphol Airport,
SkyNRG, Neste Oil, Port of
Rotterdam, Dutch Ministries
SkyNRG’s bioport creates demand for sustainable jet fuel in the
short term and enables investments in the development of a
regional sustainable jet fuel supply chain for the long run.
Green Sky
London
British Airways, Solena Green Sky London is a project to build a biofuel production plant
combining plasma gasification and Fischer-Tropsch technology
to convert municipal waste in l iquid fuels. The project is based
on an off-take agreement between BA and Solena for 50.000 mt
of jet fuel per annum over 10 years, at “market competitive”
prices”.
ITAKA SENASA, Airbus, Embraer,
Camelina Company España,
Neste Oil, SkyNRG etc.
This project seeks to develop a full value-chain in Europe to
produce sustainable drop-in Hydroprocessed Esters and Fatty
Acids at large scale to be tested using biojet fuel […] in existing
logistical systems and in normal fl ight operations in the EU.
NISA Nordic airl ines, airports,
government authorities,
Boeing, Volvo, Airbus
Several of NISA's members have been involved in a number of
biofuel blend promotional fl ights, and in agreements on the
establishment of biofuel airports. NISA is also committed to the
establishment of a Nordic biofuel fund, Fly Green Fund Nordic,
which aims to engage customers in contributing to the purchase
of avai lable biofuel and to support new research.
Evidence suggests that these regular flights – although technically viable – are not yet
sustainable, given the high costs involved. The Lab’Line project, for example, will be
discontinued once it has run its course, just as the Burnfair project was before it. Our
interviews also suggested that a number of difficulties have been encountered in the ITAKA
project, due to insufficient and unpredictable yields from the camelina crops harvested in
Spain as feedstock, thus having an impact on the economic viability of the supply chain as a
whole. It seems, therefore, that the Biofuel FlightPath objectives for 2020 will have to be
revised, and the current approach to aviation biofuel development improved, if we hope to
genuinely address the issue of aviation emissions through these means. The following
sections will explore and evaluate supply-side and demand-side policy options available to
72 Direction Générale de l ’Aviation Civile.
140
decision makers, in order to arrive at a set of policy recommendations that seem best suited
to stimulate the development of the emerging aviation biofuel sector.
7. Recommendations
There are number of policy instruments that could be used to support the aviation biofuel
sector. Carbon pricing and emissions trading schemes have already been discussed, and
remain an effective means of addressing GHG emissions without attempting to “pick
winners” from among the most immature green technologies. This paper supports efforts
underway at the EU level and at ICAO to create a market-based mechanism for aviation at an
international level. However, this will not be sufficient to spur the long-term development of
sustainable alternative jet fuels, since carbon prices are and will remain far below the
additional costs associated with existing alternative fuels (i.e. biofuels of the type described
above). Efforts must continue to be made, therefore, to support existing and nascent biofuel
technologies through funding for R&D and pilot projects, whilst attempting to address the
problems that have emerged in past and present initiatives, including cost and reliability of
supply. Again, it is important that such funding be “technology-neutral” and that the net be
cast as widely as possible, in order to give all existing technologies a chance to emerge as
viable options, thus avoiding the logic of “picking winners” from among different feedstock
and biofuel production pathways. In this vein, it is suggested that the European Biofuel
FlightPath be revised to include more realistic targets, and to encourage new initiatives from
stakeholder groups and governments.
But what about other support measures, such as biofuel mandates, public procurement
policies and direct subsidies for production? Indonesia, for example, has positioned itself as
a pioneer in the use of biofuel mandates for aviation, declaring a mandatory blend of 2% in
all domestic flights by 2016, to be increased to 5% in 2025 (IATA 2014). Should the European
Union follow suit? There is a competitiveness issue here, as those airlines that can mostly
easily circumvent a mandate that is introduced in any given country, or group of countries,
would be able to refuel at a lower cost and thus gain the upper hand on its competitors. This
reflects the fact that airlines on international flights can choose where to refuel, at origin or
destination. Routes could also be retraced to avoid refuelling in countries with biofuel
mandates. In addition to this point, t seems risky to oblige airlines to use biofuels at this
point, given the fact that the technology is still unproven: aviation biofuels are not yet
available on a commercial basis, they are very costly, and the feedstock supplies used to
make them are unreliable. Given these constraints, it has yet to be seen whether enough
supply will come online in Indonesia to supply the domestic aviation industry in accordance
with the new mandate. One interviewee from Indonesia suggested that the government’s
landmark biofuel policy was intended more as a mechanism to support palm oil cultivators,
as opposed to a genuine attempt to develop alternative jet fuels for aviation.
141
What about subsidies? At the moment, the main complaint from the European aviation
industry is that it faces unfair competition from the road transport sector for biofuels, for
which mandates and subsidies already exist. This creates a distortion in biofuel markets,
generating an incentive to produce biofuel for road vehicles rather than for aeroplanes.
Aviation industry representatives are careful not make an explicit appeal for subsidies, but
the desired “level playing field” implies that the level of subsidies in the road transport
sector should either be matched for aviation, or eliminated altogether. The sole action being
taken at the moment is the impending decision at EU level to reward the production /
consumption of aviation with “biotickets” that can be sold to the road transport sector and
contribute to its emissions reduction targets (SkyNRG interview). This policy change will have
the unfortunate effect of diluting the total emissions reductions required from the road
transport sector without obliging aviation to make concomitant emissions reductions on its
own side. The policy change, moreover, cannot be expected to create a level playing field of
its own accord, as the amounts involved are small in comparison to total subsidies that exist
in the road transport sector. A range of other subsidies are therefore being considered by
proponents of aviation biofuels.
Palmer proposes the following (Palmer 2015):
…the simplest and most efficient way of providing support might be to simply tender contracts to buy
fuel. Rather than the granting agencies chasing fuel development ideas and trying to sort out what is
currently and potentially promising, perhaps the fuels should come to the funding: fuel technologies
seeking support should, while meeting set standards of sustainability on environmental and social fronts,
quantify their level of carbon reduction against a fossil fuel equivalent and bid for contract. […] If even
the best bids can only offer the sustainable fuel at a price above that of the petroleum fuel that is also in
the system, government support means paying the higher price and putting the sustainable fuel into the
market at the prevailing price.
A scheme like this could prove quite costly, and would have to set a ceiling on the maximum
price that the government is willing to pay for a given amount of fuel. However the scheme
would have the merit of revealing whether the private sector is able to supply at or below
the ceiling and – in an ideal situation where several bidders compete for the contract –
would also reveal the lowest feasible price given current levels of technological progress. If
there are no bidders, the funds would be kept and another tender could be set for a later
date. The downside, of course, would be the considerable demand on the public purse,
which would take on the whole responsibility for reducing GHG emissions from aviation,
with no contribution from the industry itself. This would be a misallocation of responsibility,
as taxpayers should not be expected to protect the profit margins of commercial airlines, or
defend the ticket prices of consumers. On the contrary, one can convincingly argue that
airlines and consumers should be the ones internalising the negative externalities generated
by air travel. It will be therefore be argued, in the following sections, that commercial
airlines and passengers should make a just contribution both towards emissions reductions
in the aviation sector and towards the development of sustainable alternative jet fuels.
142
Evidence suggests that this is already happening, but could be encouraged further by
governments.
At the moment, the negative externalities from aviation are only internalised on a voluntary
basis, through (1) offsetting schemes offered by some airlines to individual consumers when
they buy their tickets, and (2) donations made by companies to offset the emissions
associated with business travel. Offsetting schemes of the first type are generally quite
inexpensive for consumers, costing less than €5 per round flight, and yet there seems to be a
natural limit to the number of passengers that are willing to “buy-in”. Voluntary donations of
the second type are an inbuilt element in the business model of some companies in the
sustainable jet fuel business, most noteably SkyNRG. In the framework of the KLM Corporate
Biofuel Programme, for example, voluntary donations co-fund the supply of aviation biofuels
to KLM, bridging the price premium with respect to conventional kerosene. Launched this
summer, the Fly Green Fund is a similar collaborative initiative – between Karlstad Airport,
SkyNRG the Nordic Initiative on Sustainable Aviation (NISA), Swedavia, SAS, Braathens, KLM
and EFS (European Flight Service) – that seeks to co-found the supply of aviation biofuels to
the aforementioned Nordic airlines. According to interviews conducted for this study, these
initiatives have allowed SkyNRG to reduce the cost of the biofuels supplied from 1500% the
cost of conventional kerosene to 150-200%, in some cases (SkyNRG interview).
It is nevertheless legitimate to question whether voluntary donations can be relied upon to
scale up these initiatives in a sustainable manner. At the scale needed to meet a sizeable
percentage of fuel demand from aviation (e.g. 1% of the total world jet fuel consumption in
2020 or 4% of EU jet fuel consumption), it is doubtful whether enough voluntary
contributions could be found to bridge the price premium between aviation biofuels and
kerosene. It might therefore be wise for national governments to consider imposing a tax on
fuel, which could then be used to fund efforts to reduce aviation-related emissions across
Europe. This would probably result in higher air fares for passengers, and a subsequent
decrease in demand for air travel, thus account for the negative externalities incurred when
taking a flight. A unilateral tax on kerosene, however, would have a negative impact on the
domestic airlines of the country that imposes the tax, given that domestic airlines refuel
most often in their home countries. This loss in competitiveness and the possible
consequences – reduced market share vis-à-vis competitors from others countries – are
likely to face vehement objections from domestic airlines, unless equivalent measures are
introduced in neighbouring countries. In Europe, given that the EU does not have a mandate
to raise taxes, this would require a coordinative effort by the largest players in the European
market, which may be difficult given the current political context.
It would be preferable, moreover, to design a system that accounts for the differences
between short-haul and long-haul flights. Most air travel-related emissions are incurred
during take-off and landing, meaning that short-haul flights produce more CO2 per kilometre
143
travelled, on average, than long-haul flights. Short-haul flights are also more easily
substituted by other modes of transport, like train networks or car-sharing arrangements.
The exceptionally low ticket prices that currently prevail for short-distance flights – offered
mainly by budget airlines – are a huge disincentive for consumers to make environmentally
responsible choices with regards to transport modes. Although inexpensive flights are valued
for their contribution towards economic development, the cheapest flights are in fact
concentrated in developed economies, where average incomes could probably bear the
impact of price increases. It would nonethless be desireable to conduct further studies on
the income profiles of the customers of budget airlines, to better understand the
socioeconomic impacts of such a measure.
One major problem with the above-mentioned regulatory solutions is that they could be
considered “a frontal assault on the aviation industry”. Palmer (2015) recommends that such
measures should remain voluntary, and originate from within the industry itself. Another
approach would be to raise token amounts, which would have only a marginal effect on
bottom lines, but which could act as a signal that irresonsible behaviour should not continue.
These amounts could be increased in the future if the air transport sector fails to act on GHG
emissions of its own accord. Another measure mentioned by more than one interviewee is
the airport tax, a form of indirect taxation that is ‘invisible’ to consumers. This could be a
particularly effective means of targeting budget airlines, which tend to be based at small
airports at mid- to long-range distance from major demand hubs so as to avoid punitive
runway charges and airport taxes. It should be noted, here, that such measures should not
be used merely as a means to raise revenue, which would in all likelihood then be redirected
back to carbon-intensive economies. Instead, the measures must themselves become part of
the solution, helping to fund sustainable alternatives for aviation with a view to cancelling
themselves out in the future. Demand-side measures could thus act as a transition towards
low-carbon aviation, providing both the funds to develop alternative sustainable jet fuels at
scale, and the incentive to do so.
Conclusion
Alternative jet fuels currently fall into two categories: (1) technologies that are unknown or
at the early, more speculative stages of Research and Development, and (2) aviation
biofuels, based on known technologies, some of which have been approved by the ASTM for
use in aviation. Although the latter are technically viable at the moment, obstacles remain to
their use on a large scale, including costs associated with the production process, such as the
cost of feedstock. It is doubtful whether enough biofuel production capacity will come online
in the next five years to reach the IATA objective of carbon-neutral growth by 2020, without
much stronger public support. The IATA target for 2020 could still be nominally reached if
the market-based mechanism (MBM) under consideration by ICAO allows the aviation
144
industry to offset its emissions by purchasing carbon credits from other sectors. It is
important to note, however, that this would still not lead to a reduction in actual aviation-
related emissions. In order to meet more long-term targets – e.g. 50% absolute reduction in
emissions by 2050 – more revenue will have to be directed towards green technologies for
aviation, including alternative jet fuels as the main priority.
In order to accelerate the development of alternative jet fuels, an appropriate incentive
structure needs to be created that will both discourage airlines from using kerosene and
encourage innovative solutions for aviation. At the moment, the only incentives in the drive
towards sustainability in aviation in Europe are the EU ETS, and private firms’ more general
concern with their reputation among customers. Given the low price of EU Allowances and
EU Aviation Allowances, and the limited return on investment in Corporate Social
Responsibility (CSR), it is argued here that there needs to be a stronger incentive to avoid
the negative externalities associated with burning jet fuel. This is particularly true for short-
haul flights, which can be substituted by less carbon-intensive transport modes, and which
are responsible for the largest emissions per kilometre travelled. Suggested solutions include
higher taxation, either on kerosene or on the use of airports. It is acknowledged that
unilateral action on this front would have an impact on the competitiveness of domestic
airlines in the country or countries taking the action. It is therefore suggested that the
countries with the largest share of the European air transport sector be encouraged to come
up with a solution that could be applied across the board.
Insofar as the Green Race is concerned, it is not clear if there are advantages to be gained
from being a first- or second-mover in the development of aviation biofuels. “Drop-in”
biofuels will not themselves be a major game-changer in the aircraft manufacturing or the
commercial aviation industries, as they are designed to be compatible with existing
infrastructure and entirely fungible with conventional kerosene. At most, they may be
expected to displace some activity in the oil & gas sector. Governments should also be
cautious not to expect too much from aviation biofuels in terms of economic growth,
employment and other typical “green growth” benefits. The production of aviation biofuels
is not a labour-intensive or high value-added activity. The emerging aviation biofuels sector
could perhaps increase the market for certain agricultural crops, but the impact on land-use
and food prices would be uncertain, and potentially very negative. There is also little reason
to expect intense international competition in this area, given the global nature of the
aviation industry. In the words of Kohler (2013): “the aviation industry has a history of
international cooperation and this can be clearly seen in the international nature of the
airline-supplier relationships that are being developed”. Rather than adopting a Green Race
logic, therefore, it might be more rewarding to encourage international cooperation in order
to better promote the development of this nascent technology.
145
Bibliographie du chapitre 6
Adenle, Ademola A., Gareth E. Haslam, et Lisa Lee. «Global assessment of research and development for algae biofuel production and its potential role for sustainable development
in developing countries.» Energy Policy, 6 July 2013: 182-195.
ATAG. «Beginner's Guide to Aviation Biofuels.» May 2009. www.atag.org/component/downloads/downloads/60.html (accès le December 16, 2015).
—. «Beginner's Guide to Aviation Efficiency.» November 2010. www.atag.org/component/downloads/downloads/59.html (accès le December 16, 2015).
—. «Powering the future of flight: The six easy steps to growing a viable aviation biofuels
industry .» March 2011. www.atag.org/component/downloads/downloads/152.html (accès le December 16, 2015).
—. «Reducing Emissions from Aviation through Carbon-Neutral Growth from 2020.» September/October 2013. https://www.iata.org/policy/environment/Documents/atag-paper-on-cng2020-july2013.pdf (accès le December 16, 2015).
Boeing, Embraer, FAPESP & UNICAMP. «Flightpath to Aviation Biofuels in Brazil: Action Plan.» June 2013. http://www.fapesp.br/publicacoes/flightpath-to-aviation-biofuels-in-brazil-action-plan.pdf (accès le December 16, 2015).
de Jong, Sierk, Ric Hoefnagels, André Faaij, Raphael Slade, Rebecca Mawhood, et Martin Junginger. «The feasibility of short-term production strategies for renewable jet fuels – a comprehensive techno-economic comparison .» Biofuels, Bioproducts and Biorefining, 21 September 2015: 778-800.
Deane, Paul, Richard O Shea, et Brian Ó Gallachóir. «Biofuels for Aviation.» Insight Energy. April 2015. http://www.insightenergy.org/system/publication_files/files/000/000/013/original/RREB_Bi
ofuels_in_Aviation_Draft_Final.pdf?1438176277 (accès le December 16, 2015).
European Comission. «Flightpath 2050 Europe’s Vision for Aviation : Report of the High Level
Group on Aviation Research.» 2011. http://ec.europa.eu/transport/modes/air/doc/flightpath2050.pdf (accès le December 16,
2015).
European Commission. «2 million tons per year: A performing biofuels supply chain for EU aviation .» August 2013. https://ec.europa.eu/energy/sites/ener/files/20130911_a_performing_biofuels_supply_chain.pdf (accès le December 16, 2015).
Faaij, André, et Maarten van Dijk. «White Paper on Sustainable Jet Fuel: SkyNRG Future Friendly Flying.» June 2012. http://skynrg.com/wp-content/uploads/2013/11/White-paper-
on-sustainable-jet-fuel-June-2012-Faaij-van-Dijk-copy.pdf (accès le December 16, 2015).
IATA. «IATA 2014 Report on Alternative Fuels.» December 2014. http://rsb.org/pdfs/documents_and_resources/IATA%202014-report-alternative-fuels.pdf (accès le December 16, 2015).
—. «IATA forecast - December 2014.» December 2014. http://www.iata.org/whatwedo/Documents/economics/Central-forecast-Dec-2014-
Figures.pdf (accès le December 16, 2015).
146
IEA Bioenergy. «The Potential and Role of Biofuels in Commercial Air Transport.» September 2012. www.bioenergytrade.org (accès le December 16, 2015).
Köhler, Jonathan, Rainer Walz, Frank Marscheder-Weidemann, et Benjamin Thedieck. «Lead markets in 2nd generation biofuels for aviation: A comparison of Germany, Brazil and the USA .» Environmental Innovation and Societal Transitions, 30 October 2013: 59-76.
OECD / IEA. World Energy Outlook 2015. Paris: IEA Publications, 2015.
Palmer, Walter J. Will Sustainability Fly? Aviation Fuel Options in a Low-Carbon World. Farnham, Surrey: Ashgate Publishing Limited, 2015.
Pearce, Brian. «Economic Performance of the Airline Industry: mid-year 2015 forecast.» IATA. June 2015. https://www.iata.org/whatwedo/Documents/economics/Economic-Performance-of-the-Airline-Industry-mid-year-2015-forecast-slides.pdf (accès le December 16, 2015).
RSB. «RSB Principles & Criteria for Sustainable Biofuel Production.» 2013. http://rsb.org/pdfs/standards/11-03-08%20RSB%20PCs%20Version%202.1.pdf (accès le December 16, 2015).
SWAFEA. «Sustainable Way for Alternative Fuels and Energy in Aviation.» April 2011.
http://www.icao.int/environmental-protection/GFAAF/Documents/SW_WP9_D.9.1%20Final%20report_released%20July2011.pd
f (accès le December 16, 2015).
147
ANNEXE
Liste des personnes interrogées
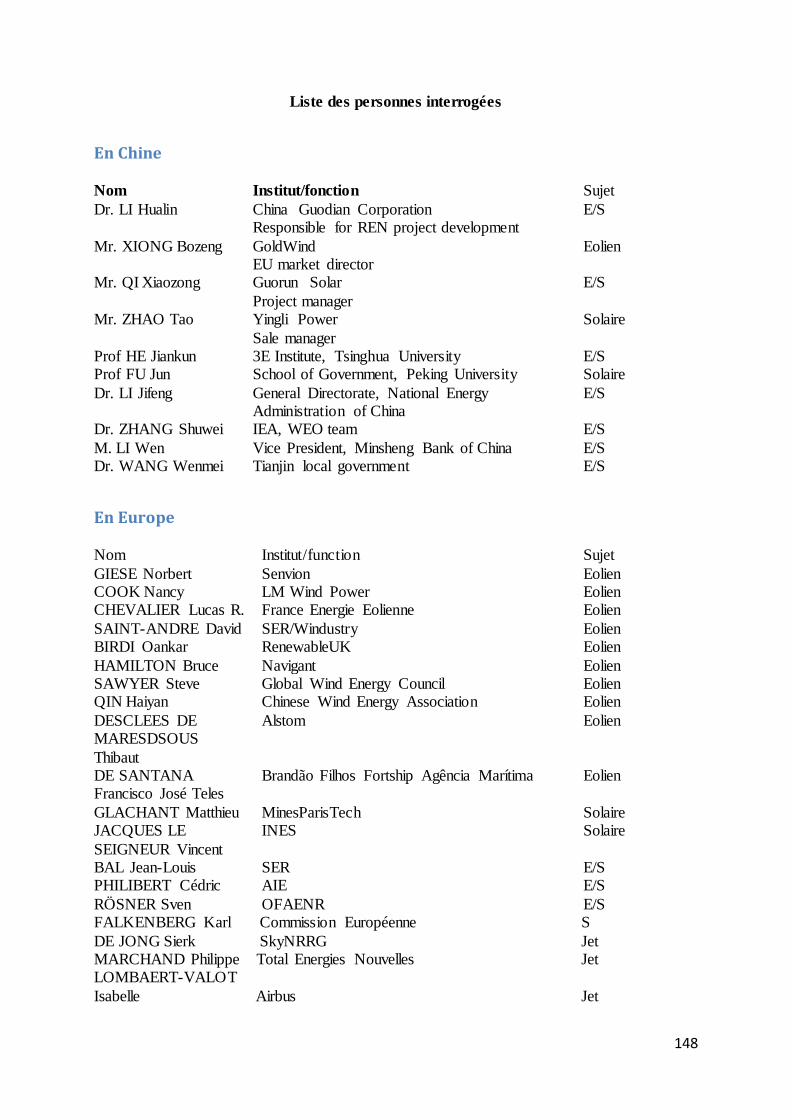
148
Liste des personnes interrogées
En Chine Nom Institut/fonction Sujet
Dr. LI Hualin China Guodian Corporation Responsible for REN project development
E/S
Mr. XIONG Bozeng GoldWind EU market director
Eolien
Mr. QI Xiaozong Guorun Solar
Project manager
E/S
Mr. ZHAO Tao Yingli Power
Sale manager
Solaire
Prof HE Jiankun 3E Institute, Tsinghua University E/S Prof FU Jun School of Government, Peking University Solaire
Dr. LI Jifeng General Directorate, National Energy Administration of China
E/S
Dr. ZHANG Shuwei IEA, WEO team E/S
M. LI Wen Vice President, Minsheng Bank of China E/S Dr. WANG Wenmei Tianjin local government E/S
En Europe Nom Institut/function Sujet
GIESE Norbert Senvion Eolien COOK Nancy LM Wind Power Eolien CHEVALIER Lucas R. France Energie Eolienne Eolien
SAINT-ANDRE David SER/Windustry Eolien BIRDI Oankar RenewableUK Eolien
HAMILTON Bruce Navigant Eolien SAWYER Steve Global Wind Energy Council Eolien QIN Haiyan Chinese Wind Energy Association Eolien
DESCLEES DE MARESDSOUS
Thibaut
Alstom Eolien
DE SANTANA Francisco José Teles
Brandão Filhos Fortship Agência Marítima Eolien
GLACHANT Matthieu MinesParisTech Solaire JACQUES LE
SEIGNEUR Vincent
INES Solaire
BAL Jean-Louis SER E/S PHILIBERT Cédric AIE E/S
RÖSNER Sven OFAENR E/S FALKENBERG Karl Commission Européenne S
DE JONG Sierk SkyNRRG Jet MARCHAND Philippe Total Energies Nouvelles Jet LOMBAERT-VALOT
Isabelle Airbus Jet