Embed Size (px)
Citation preview
Tectonic-driven climate change and the diversificationof angiospermsAnne-Claire Chaboureaua,1, Pierre Sepulchrea, Yannick Donnadieua, and Alain Francb
aLaboratoire des Sciences du Climat et de l’Environnement, Unité Mixte, Centre National de la Recherche Scientifique–Commissariat à l’Energie Atomique–Université de Versailles Saint-Quentin-en-Yvelines, 91191 Gif-sur-Yvette, France; and bUnité Mixte de Recherche Biodiversité, Gènes et Communautés, InstitutNational de la Recherche Agronomique, 33612 Cestas, France
Edited by Robert E. Dickinson, The University of Texas at Austin, Austin, TX, and approved August 1, 2014 (received for review December 23, 2013)
In 1879, Charles Darwin characterized the sudden and unexplainedrise of angiosperms during the Cretaceous as an “abominable mys-tery.” The diversification of this clade marked the beginning ofa rapid transition among Mesozoic ecosystems and floras formerlydominated by ferns, conifers, and cycads. Although the role of en-vironmental factors has been suggested [Coiffard C, Gómez B (2012)Geol Acta 10(2):181–188], Cretaceous global climate change hasbarely been considered as a contributor to angiosperm radiation,and focus was put on biotic factors to explain this transition. Herewe use a fully coupled climate model driven by Mesozoic paleogeo-graphic maps to quantify and discuss the impact of continental drifton angiosperm expansion and diversification. We show that thedecrease of desertic belts between the Triassic and the Cretaceousand the subsequent onset of long-lasting humid conditions duringthe Late Cretaceous were driven by the breakup of Pangea andwere contemporaneous with the first rise of angiosperm diversifi-cation. Positioning angiosperm-bearing fossil sites on our paleobio-climatic maps shows a strong match between the location of fossil-rich outcrops and temperate humid zones, indicating that climatechange from arid to temperate dominance may have set the stagefor the ecological expansion of flowering plants.
climate modeling | paleogeography
Angiosperms have gradually dominated terrestrial environ-ments after their appearance during the Early Cretaceous
(1, 2). Their radiation was characterized by high and rapid di-versification (3, 4), high rates of speciation throughout theCretaceous (5), and unprecedented ecological dominance. Mosthypotheses to explain angiosperm radiation invoke biotic (instrin-sic) factors, such as pollinating insects (6), coevolution withherbivorous insects (7), morphological novelties (8), or eco-physiological innovations (9–11) as well as macroevolutionarypatterns (1). However, recent studies have shown that extrinsicinfluences combined with biotic factors may drive species di-versity at the multimillion-year time scale (6, 12), reviving thepotential role of global climate change (13, 14) on angiospermradiation. Such a combination is supported by fossil data, as il-lustrated by the latest studies based on the European megafossilplant record that provided a scenario in which angiosperm ra-diation was concomitant, in space and time, with the evolution ofthe physical environment (15).Although the Cretaceous climate is described as warm and
equable, onset of such climatic conditions is gradual (16) andresults from long-term processes that occurred throughout theMesozoic. Climate simulations were conducted using a fullycoupled ocean–atmosphere general circulation model (FOAM)for five continental configurations, from the Middle Triassic [225million years ago (Ma)] to the Late Cretaceous (70 Ma). Thecoupling of the Lund–Potsdam–Jena dynamic global vegetationmodel (LPJ) within FOAM experiments helped to account forvegetation feedbacks on the climate system and to build the mostaccurate paleoclimatic maps for each of the five periods. Threeatmospheric pCO2 levels have been tested for each paleoge-ography (560 ppm, 1,120 ppm, and 2,240 ppm). This range
covers the large uncertainties of pCO2 estimates for thesegeological periods.To validate our paleoclimatic experiments, the geographical
distribution of climate-sensitive sediments such as evaporites (dryor seasonally dry climate indicators) and coals (humid climateindicators) have been compared with our maps of simulated biomesfor each time period (Fig. S1). Overall, for every time period, thespatial fit between coals and humid biomes is higher for 1,120-ppmand 2,240-ppm pCO2 scenarios than for 560 ppm (Table S1 andFig. S1). Still, relative distribution of arid and humid zones does notshow major changes between 1,120 and 2,240 ppm (Fig. S1), andcoals cannot discriminate between these two scenarios. For theCarnian and Toarcian, we select the 1,120-ppm scenario, which isconsistent with most studies that agree on a background pCO2 ofca. 1,000 ppm for these periods. For the Cretaceous, comparisonsof our simulations with oceanic latitudinal thermal gradientsreconstructed from paleoceanographic data (17–25) show that pCO2of 2,240 ppm is required to produce sea surface temperaturescomparable with data for the Aptian and Cenomanian, whereas forthe Maastrichian, data-derived sea surface temperature gradient isbetter reproduced at 1,120 ppm (Fig. S2). Based on these com-parisons, the best-fit model–data scenario corresponds to thesimulations at 1,120 ppm, except for the Aptian and Cenomaniansimulations, for which CO2 concentrations of 2,240 ppm are used.
Climatic EvolutionOur simulations show that the evolution of paleogeography trig-gers strong changes in rainfall patterns (Fig. 1C). Continentalrainfall increases (ca. +60%) from the Middle Triassic (225 Ma)to reach maximal values at the Cenomanian (95 Ma) for 1,120
Significance
Angiosperm range expansion and diversification have beenmajor biotic upheavals in the Earth history. Mechanisms in-volved in their successful diversification have mainly calledupon intrinsic processes at the plant level, leaving the influenceof the global tectonics poorly explored. We investigate evolu-tion of paleogeography and climate and correlate it with thediversification of angiosperms by using a general circulationmodel. We show that Pangea breakup induced an importantexpansion of temperate zones during the late Cretaceous whichwas concomitant to the rise of angiosperms. We suggest thatthe breakup of Pangea led to the onset of new humid bioclima-tic continents, which in turn may have provided new externalconditions for ecological expansion of the angiosperms andtheir diversification.
Author contributions: A.-C.C., P.S., Y.D., and A.F. performed research and A.-C.C., P.S.,Y.D., and A.F. wrote the paper.
The authors declare no conflict of interest.
This article is a PNAS Direct Submission.1To whom correspondence should be addressed. Email: [email protected].
This article contains supporting information online at www.pnas.org/lookup/suppl/doi:10.1073/pnas.1324002111/-/DCSupplemental.
14066–14070 | PNAS | September 30, 2014 | vol. 111 | no. 39 www.pnas.org/cgi/doi/10.1073/pnas.1324002111
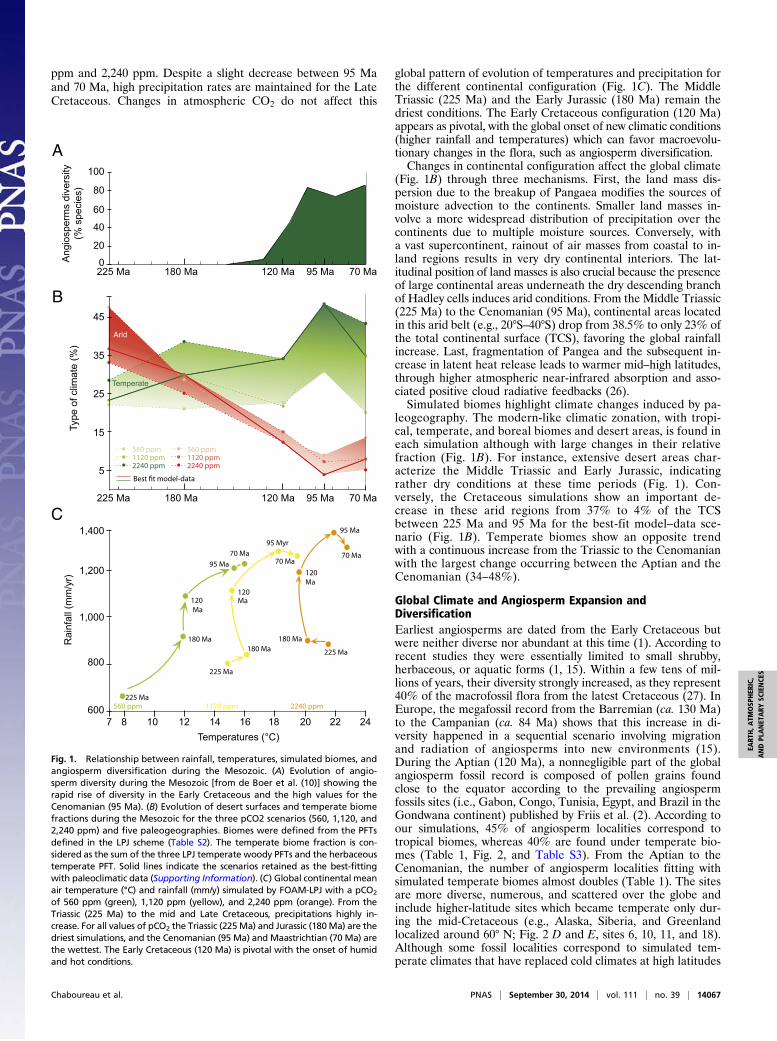
ppm and 2,240 ppm. Despite a slight decrease between 95 Maand 70 Ma, high precipitation rates are maintained for the LateCretaceous. Changes in atmospheric CO2 do not affect this
global pattern of evolution of temperatures and precipitation forthe different continental configuration (Fig. 1C). The MiddleTriassic (225 Ma) and the Early Jurassic (180 Ma) remain thedriest conditions. The Early Cretaceous configuration (120 Ma)appears as pivotal, with the global onset of new climatic conditions(higher rainfall and temperatures) which can favor macroevolu-tionary changes in the flora, such as angiosperm diversification.Changes in continental configuration affect the global climate
(Fig. 1B) through three mechanisms. First, the land mass dis-persion due to the breakup of Pangaea modifies the sources ofmoisture advection to the continents. Smaller land masses in-volve a more widespread distribution of precipitation over thecontinents due to multiple moisture sources. Conversely, witha vast supercontinent, rainout of air masses from coastal to in-land regions results in very dry continental interiors. The lat-itudinal position of land masses is also crucial because the presenceof large continental areas underneath the dry descending branchof Hadley cells induces arid conditions. From the Middle Triassic(225 Ma) to the Cenomanian (95 Ma), continental areas locatedin this arid belt (e.g., 20°S–40°S) drop from 38.5% to only 23% ofthe total continental surface (TCS), favoring the global rainfallincrease. Last, fragmentation of Pangea and the subsequent in-crease in latent heat release leads to warmer mid–high latitudes,through higher atmospheric near-infrared absorption and asso-ciated positive cloud radiative feedbacks (26).Simulated biomes highlight climate changes induced by pa-
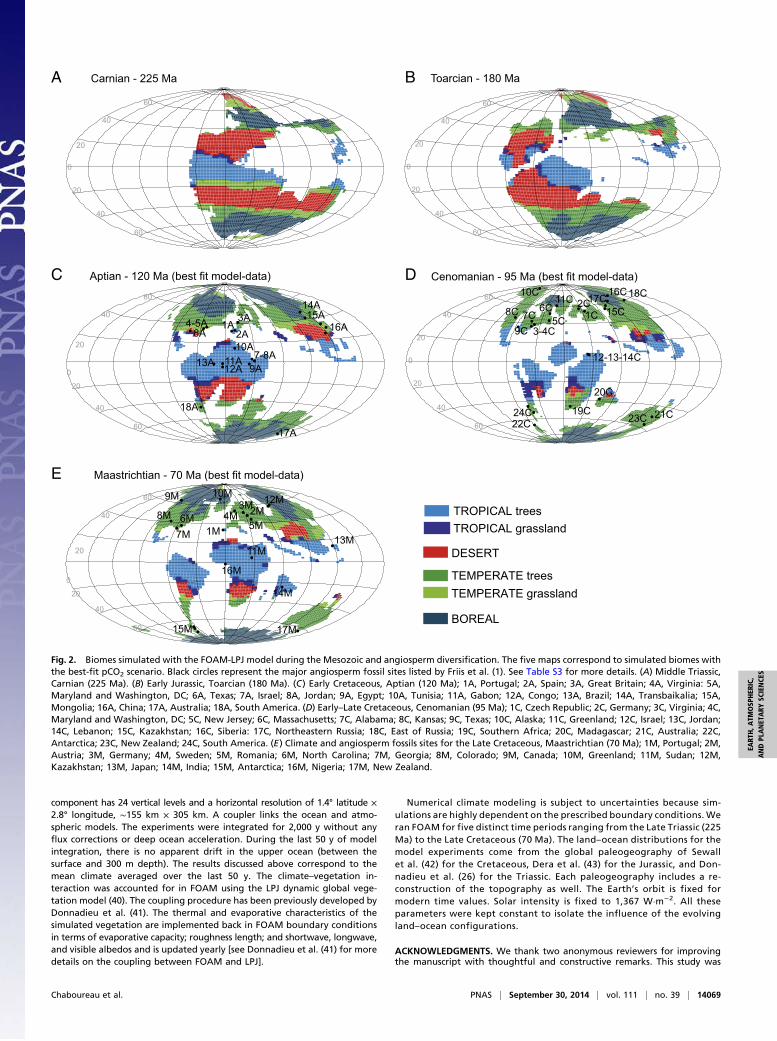
leogeography. The modern-like climatic zonation, with tropi-cal, temperate, and boreal biomes and desert areas, is found ineach simulation although with large changes in their relativefraction (Fig. 1B). For instance, extensive desert areas char-acterize the Middle Triassic and Early Jurassic, indicatingrather dry conditions at these time periods (Fig. 1). Con-versely, the Cretaceous simulations show an important de-crease in these arid regions from 37% to 4% of the TCSbetween 225 Ma and 95 Ma for the best-fit model–data sce-nario (Fig. 1B). Temperate biomes show an opposite trendwith a continuous increase from the Triassic to the Cenomanianwith the largest change occurring between the Aptian and theCenomanian (34–48%).
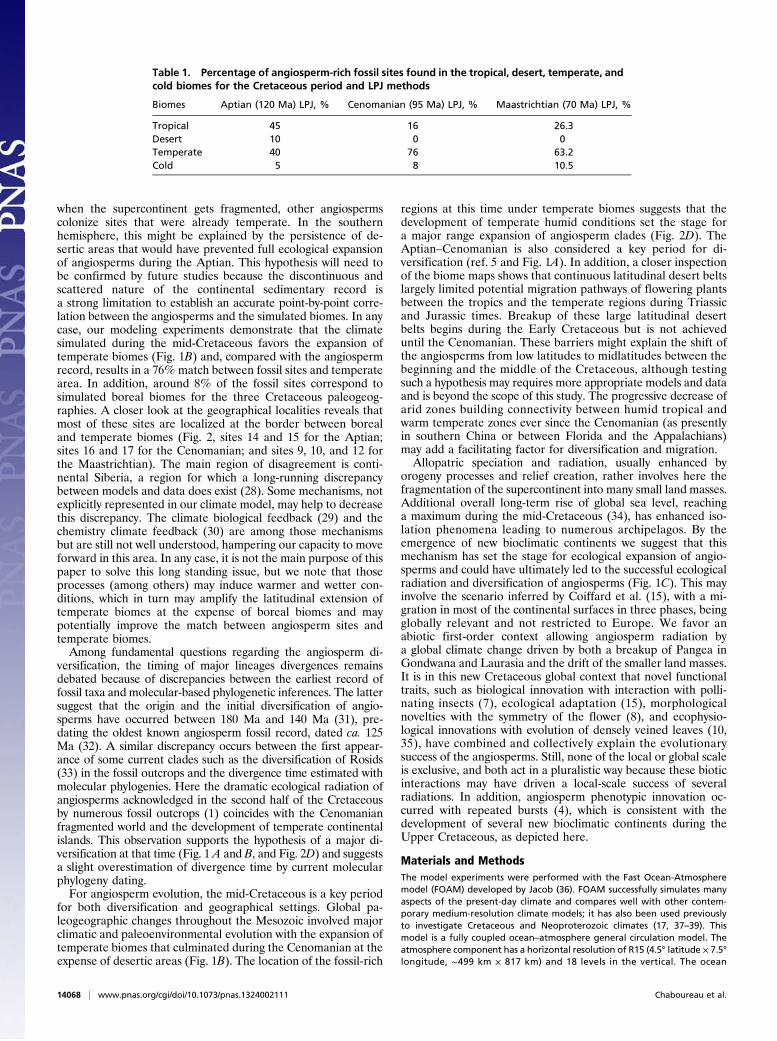
Global Climate and Angiosperm Expansion andDiversificationEarliest angiosperms are dated from the Early Cretaceous butwere neither diverse nor abundant at this time (1). According torecent studies they were essentially limited to small shrubby,herbaceous, or aquatic forms (1, 15). Within a few tens of mil-lions of years, their diversity strongly increased, as they represent40% of the macrofossil flora from the latest Cretaceous (27). InEurope, the megafossil record from the Barremian (ca. 130 Ma)to the Campanian (ca. 84 Ma) shows that this increase in di-versity happened in a sequential scenario involving migrationand radiation of angiosperms into new environments (15).During the Aptian (120 Ma), a nonnegligible part of the globalangiosperm fossil record is composed of pollen grains foundclose to the equator according to the prevailing angiospermfossils sites (i.e., Gabon, Congo, Tunisia, Egypt, and Brazil in theGondwana continent) published by Friis et al. (2). According toour simulations, 45% of angiosperm localities correspond totropical biomes, whereas 40% are found under temperate bio-mes (Table 1, Fig. 2, and Table S3). From the Aptian to theCenomanian, the number of angiosperm localities fitting withsimulated temperate biomes almost doubles (Table 1). The sitesare more diverse, numerous, and scattered over the globe andinclude higher-latitude sites which became temperate only dur-ing the mid-Cretaceous (e.g., Alaska, Siberia, and Greenlandlocalized around 60° N; Fig. 2 D and E, sites 6, 10, 11, and 18).Although some fossil localities correspond to simulated tem-perate climates that have replaced cold climates at high latitudes
Arid
560 ppm1120 ppm2240 ppm
Best fit model-data
560 ppm1120 ppm2240 ppm
Type
of c
limat
e (%
)R
ainf
all (
mm
/yr)
Temperatures (°C)
5
15
25
35
45
Ang
iosp
erm
s di
vers
ity
(% s
peci
es)
20
0
40
60
80
100
Temperate
A
B
C225 Ma 180 Ma 120 Ma 95 Ma 70 Ma
225 Ma 180 Ma 120 Ma 95 Ma 70 Ma
121087
800
600
1,000
1,200
1,400
14 16 18 20 22 24
120 Ma
95 Myr
70 Ma
225 Ma
180 Ma
225 Ma560 ppm 1120 ppm 2240 ppm
120 Ma
95 Ma70 Ma
180 Ma
95 Ma
70 Ma
120 Ma
180 Ma
225 Ma
Fig. 1. Relationship between rainfall, temperatures, simulated biomes, andangiosperm diversification during the Mesozoic. (A) Evolution of angio-sperm diversity during the Mesozoic [from de Boer et al. (10)] showing therapid rise of diversity in the Early Cretaceous and the high values for theCenomanian (95 Ma). (B) Evolution of desert surfaces and temperate biomefractions during the Mesozoic for the three pCO2 scenarios (560, 1,120, and2,240 ppm) and five paleogeographies. Biomes were defined from the PFTsdefined in the LPJ scheme (Table S2). The temperate biome fraction is con-sidered as the sum of the three LPJ temperate woody PFTs and the herbaceoustemperate PFT. Solid lines indicate the scenarios retained as the best-fittingwith paleoclimatic data (Supporting Information). (C) Global continental meanair temperature (°C) and rainfall (mm/y) simulated by FOAM-LPJ with a pCO2
of 560 ppm (green), 1,120 ppm (yellow), and 2,240 ppm (orange). From theTriassic (225 Ma) to the mid and Late Cretaceous, precipitations highly in-crease. For all values of pCO2 the Triassic (225Ma) and Jurassic (180Ma) are thedriest simulations, and the Cenomanian (95 Ma) and Maastrichtian (70 Ma) arethe wettest. The Early Cretaceous (120 Ma) is pivotal with the onset of humidand hot conditions.
Chaboureau et al. PNAS | September 30, 2014 | vol. 111 | no. 39 | 14067
EART
H,A
TMOSP
HER
IC,
ANDPL
ANET
ARY
SCIENCE
S
when the supercontinent gets fragmented, other angiospermscolonize sites that were already temperate. In the southernhemisphere, this might be explained by the persistence of de-sertic areas that would have prevented full ecological expansionof angiosperms during the Aptian. This hypothesis will need tobe confirmed by future studies because the discontinuous andscattered nature of the continental sedimentary record isa strong limitation to establish an accurate point-by-point corre-lation between the angiosperms and the simulated biomes. In anycase, our modeling experiments demonstrate that the climatesimulated during the mid-Cretaceous favors the expansion oftemperate biomes (Fig. 1B) and, compared with the angiospermrecord, results in a 76% match between fossil sites and temperatearea. In addition, around 8% of the fossil sites correspond tosimulated boreal biomes for the three Cretaceous paleogeog-raphies. A closer look at the geographical localities reveals thatmost of these sites are localized at the border between borealand temperate biomes (Fig. 2, sites 14 and 15 for the Aptian;sites 16 and 17 for the Cenomanian; and sites 9, 10, and 12 forthe Maastrichtian). The main region of disagreement is conti-nental Siberia, a region for which a long-running discrepancybetween models and data does exist (28). Some mechanisms, notexplicitly represented in our climate model, may help to decreasethis discrepancy. The climate biological feedback (29) and thechemistry climate feedback (30) are among those mechanismsbut are still not well understood, hampering our capacity to moveforward in this area. In any case, it is not the main purpose of thispaper to solve this long standing issue, but we note that thoseprocesses (among others) may induce warmer and wetter con-ditions, which in turn may amplify the latitudinal extension oftemperate biomes at the expense of boreal biomes and maypotentially improve the match between angiosperm sites andtemperate biomes.Among fundamental questions regarding the angiosperm di-
versification, the timing of major lineages divergences remainsdebated because of discrepancies between the earliest record offossil taxa and molecular-based phylogenetic inferences. The lattersuggest that the origin and the initial diversification of angio-sperms have occurred between 180 Ma and 140 Ma (31), pre-dating the oldest known angiosperm fossil record, dated ca. 125Ma (32). A similar discrepancy occurs between the first appear-ance of some current clades such as the diversification of Rosids(33) in the fossil outcrops and the divergence time estimated withmolecular phylogenies. Here the dramatic ecological radiation ofangiosperms acknowledged in the second half of the Cretaceousby numerous fossil outcrops (1) coincides with the Cenomanianfragmented world and the development of temperate continentalislands. This observation supports the hypothesis of a major di-versification at that time (Fig. 1 A and B, and Fig. 2D) and suggestsa slight overestimation of divergence time by current molecularphylogeny dating.For angiosperm evolution, the mid-Cretaceous is a key period
for both diversification and geographical settings. Global pa-leogeographic changes throughout the Mesozoic involved majorclimatic and paleoenvironmental evolution with the expansion oftemperate biomes that culminated during the Cenomanian at theexpense of desertic areas (Fig. 1B). The location of the fossil-rich
regions at this time under temperate biomes suggests that thedevelopment of temperate humid conditions set the stage fora major range expansion of angiosperm clades (Fig. 2D). TheAptian–Cenomanian is also considered a key period for di-versification (ref. 5 and Fig. 1A). In addition, a closer inspectionof the biome maps shows that continuous latitudinal desert beltslargely limited potential migration pathways of flowering plantsbetween the tropics and the temperate regions during Triassicand Jurassic times. Breakup of these large latitudinal desertbelts begins during the Early Cretaceous but is not achieveduntil the Cenomanian. These barriers might explain the shift ofthe angiosperms from low latitudes to midlatitudes between thebeginning and the middle of the Cretaceous, although testingsuch a hypothesis may requires more appropriate models and dataand is beyond the scope of this study. The progressive decrease ofarid zones building connectivity between humid tropical andwarm temperate zones ever since the Cenomanian (as presentlyin southern China or between Florida and the Appalachians)may add a facilitating factor for diversification and migration.Allopatric speciation and radiation, usually enhanced by
orogeny processes and relief creation, rather involves here thefragmentation of the supercontinent into many small land masses.Additional overall long-term rise of global sea level, reachinga maximum during the mid-Cretaceous (34), has enhanced iso-lation phenomena leading to numerous archipelagos. By theemergence of new bioclimatic continents we suggest that thismechanism has set the stage for ecological expansion of angio-sperms and could have ultimately led to the successful ecologicalradiation and diversification of angiosperms (Fig. 1C). This mayinvolve the scenario inferred by Coiffard et al. (15), with a mi-gration in most of the continental surfaces in three phases, beingglobally relevant and not restricted to Europe. We favor anabiotic first-order context allowing angiosperm radiation bya global climate change driven by both a breakup of Pangea inGondwana and Laurasia and the drift of the smaller land masses.It is in this new Cretaceous global context that novel functionaltraits, such as biological innovation with interaction with polli-nating insects (7), ecological adaptation (15), morphologicalnovelties with the symmetry of the flower (8), and ecophysio-logical innovations with evolution of densely veined leaves (10,35), have combined and collectively explain the evolutionarysuccess of the angiosperms. Still, none of the local or global scaleis exclusive, and both act in a pluralistic way because these bioticinteractions may have driven a local-scale success of severalradiations. In addition, angiosperm phenotypic innovation oc-curred with repeated bursts (4), which is consistent with thedevelopment of several new bioclimatic continents during theUpper Cretaceous, as depicted here.
Materials and MethodsThe model experiments were performed with the Fast Ocean-Atmospheremodel (FOAM) developed by Jacob (36). FOAM successfully simulates manyaspects of the present-day climate and compares well with other contem-porary medium-resolution climate models; it has also been used previouslyto investigate Cretaceous and Neoproterozoic climates (17, 37–39). Thismodel is a fully coupled ocean–atmosphere general circulation model. Theatmosphere component has a horizontal resolution of R15 (4.5° latitude × 7.5°longitude, ∼499 km × 817 km) and 18 levels in the vertical. The ocean
Table 1. Percentage of angiosperm-rich fossil sites found in the tropical, desert, temperate, andcold biomes for the Cretaceous period and LPJ methods
Biomes Aptian (120 Ma) LPJ, % Cenomanian (95 Ma) LPJ, % Maastrichtian (70 Ma) LPJ, %
Tropical 45 16 26.3Desert 10 0 0Temperate 40 76 63.2Cold 5 8 10.5
14068 | www.pnas.org/cgi/doi/10.1073/pnas.1324002111 Chaboureau et al.
component has 24 vertical levels and a horizontal resolution of 1.4° latitude ×2.8° longitude, ∼155 km × 305 km. A coupler links the ocean and atmo-spheric models. The experiments were integrated for 2,000 y without anyflux corrections or deep ocean acceleration. During the last 50 y of modelintegration, there is no apparent drift in the upper ocean (between thesurface and 300 m depth). The results discussed above correspond to themean climate averaged over the last 50 y. The climate–vegetation in-teraction was accounted for in FOAM using the LPJ dynamic global vege-tation model (40). The coupling procedure has been previously developed byDonnadieu et al. (41). The thermal and evaporative characteristics of thesimulated vegetation are implemented back in FOAM boundary conditionsin terms of evaporative capacity; roughness length; and shortwave, longwave,and visible albedos and is updated yearly [see Donnadieu et al. (41) for moredetails on the coupling between FOAM and LPJ].
Numerical climate modeling is subject to uncertainties because sim-ulations are highly dependent on the prescribed boundary conditions. Weran FOAM for five distinct time periods ranging from the Late Triassic (225Ma) to the Late Cretaceous (70 Ma). The land–ocean distributions for themodel experiments come from the global paleogeography of Sewallet al. (42) for the Cretaceous, Dera et al. (43) for the Jurassic, and Don-nadieu et al. (26) for the Triassic. Each paleogeography includes a re-construction of the topography as well. The Earth’s orbit is fixed formodern time values. Solar intensity is fixed to 1,367 W·m−2. All theseparameters were kept constant to isolate the influence of the evolvingland–ocean configurations.
ACKNOWLEDGMENTS. We thank two anonymous reviewers for improvingthe manuscript with thoughtful and constructive remarks. This study was
20
0
20
40
40
60
60
20
0
20
40
40
60
60
20
0
20
40
40
60
60
4-5A 1A2A
11A12A
3A
13A
6A
7-8A9A
10A
16A15A
14A
18A
17A
8C
9C
19C
1C
12-13-14C
2C15C
17C
5C6C
11C7C
3-4C
20C
22C24C 21C23C
16C18C10C
20
0
20
40
40
60
60
15M 17M
16M
1M
11M
3M4M6M
10M
7M
14M
12M2M5M
13M
9M
8M
20
0
20
40
40
60
60
TROPICAL treesTROPICAL grassland
TEMPERATE treesTEMPERATE grassland
DESERT
BOREAL
Carnian - 225 Ma
Aptian - 120 Ma (best fit model-data) Cenomanian - 95 Ma (best fit model-data)
Maastrichtian - 70 Ma (best fit model-data)
Toarcian - 180 Ma A B
C D
E
Fig. 2. Biomes simulated with the FOAM-LPJ model during the Mesozoic and angiosperm diversification. The five maps correspond to simulated biomes withthe best-fit pCO2 scenario. Black circles represent the major angiosperm fossil sites listed by Friis et al. (1). See Table S3 for more details. (A) Middle Triassic,Carnian (225 Ma). (B) Early Jurassic, Toarcian (180 Ma). (C) Early Cretaceous, Aptian (120 Ma); 1A, Portugal; 2A, Spain; 3A, Great Britain; 4A, Virginia: 5A,Maryland and Washington, DC; 6A, Texas; 7A, Israel; 8A, Jordan; 9A, Egypt; 10A, Tunisia; 11A, Gabon; 12A, Congo; 13A, Brazil; 14A, Transbaikalia; 15A,Mongolia; 16A, China; 17A, Australia; 18A, South America. (D) Early–Late Cretaceous, Cenomanian (95 Ma); 1C, Czech Republic; 2C, Germany; 3C, Virginia; 4C,Maryland and Washington, DC; 5C, New Jersey; 6C, Massachusetts; 7C, Alabama; 8C, Kansas; 9C, Texas; 10C, Alaska; 11C, Greenland; 12C, Israel; 13C, Jordan;14C, Lebanon; 15C, Kazakhstan; 16C, Siberia: 17C, Northeastern Russia; 18C, East of Russia; 19C, Southern Africa; 20C, Madagascar; 21C, Australia; 22C,Antarctica; 23C, New Zealand; 24C, South America. (E) Climate and angiosperm fossils sites for the Late Cretaceous, Maastrichtian (70 Ma); 1M, Portugal; 2M,Austria; 3M, Germany; 4M, Sweden; 5M, Romania; 6M, North Carolina; 7M, Georgia; 8M, Colorado; 9M, Canada; 10M, Greenland; 11M, Sudan; 12M,Kazakhstan; 13M, Japan; 14M, India; 15M, Antarctica; 16M, Nigeria; 17M, New Zealand.
Chaboureau et al. PNAS | September 30, 2014 | vol. 111 | no. 39 | 14069
EART
H,A
TMOSP
HER
IC,
ANDPL
ANET
ARY
SCIENCE
S
supported by the Agence Nationale pour la Recherche (ANR) as part ofPhyloSpace Project ANR 2009 PEXT 002 and has also received the support ofLabex Centre d’Etudes de la Biodiversité Amazonienne (ANR-10-LABX-2501).
This work was granted access to the High Performance Computing resourcesof Très Grand Centre de Calcul du CEA under the allocation 2014-012212made by Grand Equipement National de Calcul Intensif.
1. Friis EM, Crane PR, Pedersen KR (2011) Early Flowers and Angiosperm Evolution(Cambridge Univ Press, Cambridge, UK).
2. Magallón S, Castillo A (2009) Angiosperm diversification through time. Am J Bot96(1):349–365.
3. Darwin F, Seward AC (1903) More Letters of Charles Darwin. A Record of His Work ina Series of Hitherto Unpublished Letters (John Murray, London), Vols 1 and 2.
4. Lupia R, Crane PR, Lidgard S (2000) Biotic Response to Global Change: The Last 145Million Years, eds Culver SJ, Rawson PF (Cambridge Univ Press, Cambridge, UK), pp223–243.
5. Crepet WL, Niklas KJ (2009) Darwin’s second ‘abominable mystery’: Why are there somany angiosperm species? Am J Bot 96(1):366–381.
6. Grimaldi D (1999) The co-radiations of pollinating insects and angiosperms in theCretaceous. Ann Mo Bot Gard 86(2):373–406.
7. Farrell BD (1998) “Inordinate fondness” explained: Why are there so many beetles?Science 281(5376):555–559.
8. Busch A, Zachgo S (2009) Flower symmetry evolution: Towards understanding theabominable mystery of angiosperm radiation. BioEssays 31(11):1181–1190.
9. Boyce CK, Lee JE (2010) An exceptional role for flowering plant physiology in theexpansion of tropical rainforests and biodiversity. Proc Biol Sci 277(1699):3437–3443.
10. de Boer HJ, Eppinga MB, Wassen MJ, Dekker SC (2012) A critical transition in leafevolution facilitated the Cretaceous angiosperm revolution. Nat Commun 3(1221):1221.
11. Feild TS, et al. (2011) Fossil evidence for Cretaceous escalation in angiosperm leaf veinevolution. Proc Natl Acad Sci USA 108(20):8363–8366.
12. Davies TJ, et al. (2004) Darwin’s abominable mystery: Insights from a supertree of theangiosperms. Proc Natl Acad Sci USA 101(7):1904–1909.
13. McElwain JC, Willis K, Lupia R (2005) A History of Atmospheric CO2 and Its Effects onPlants, Animals, and Ecosystems, eds Baldwin IT, et al. (Springer, New York), pp133–165.
14. Coiffard C, Gómez B (2012) Influence of latitude and climate on spread, radiation andrise to dominance of early angiosperms during the Cretaceous in the NorthernHemisphere. Geol Acta 10(2):181–188.
15. Coiffard C, Gomez B, Daviero-Gomez V, Dilcher DL (2012) Rise to dominance of an-giosperm pioneers in European Cretaceous environments. Proc Natl Acad Sci USA109(51):20955–20959.
16. Pucéat E, Lécuyer C, Sheppard SMF, Dromart G, Reboulet S, Grandjean P (2003)Thermal evolution of Cretaceous Tethyan marine waters inferred from oxygen iso-tope composition of fish tooth enamels. Paleoceanography 18(2):7-1–7-12.
17. Price GD, Passey BH (2013) Dynamic polar climates in a greenhouse world: Evidencefrom clumped isotope thermometry of early Cretaceous belemnites. Geology 41(8):923–926.
18. Littler K, Robinson SA, Bown PR, Nederbragt AJ, Pancost RD (2011) High sea-surfacetemperatures during the Early Cretaceous Epoch. Nat Geosci 4(3):169–172.
19. Sinninghe Damsté JS, van Bentum ZC, Reichart G-J, Pross J, Schouten S (2010) A CO2decrease-driven cooling and increased latitudinal temperature gradient during themid-Cretaceous Oceanic Anoxic Event 2. Earth Planet Sci Lett 248(1-2):426–437.
20. Mutterlose J, Malkoc M, Schouten S, Sinninghe Damsté JS, Forste A (2010) TEX86 andstable δ18O paleothermometry of early Cretaceous sediments: Implications for bel-emnite ecology and paleotemperature proxy application. Earth Planet Sci Lett298(3-4):286–298.
21. Pucéat E, et al. (2010) Revised phosphate-water fractionation equation reassessingpaleotemperatures derived from biogenic apatite. Earth Planet Sci Lett 298(1-2):135–142.
22. Pucéat E, et al. (2007) Fish tooth δ18 O revising Late Cretaceous meridional upperocean water temperature gradients. Geology 35(2):107–110.
23. Steuber T, Rauch M, Masse J-P, Graaf J, Malkoc M (2005) Low-latitude seasonality ofCretaceous temperatures in warm and cold episodes. Nature 437(7063):1341–1344.
24. Bice KL, Norris RD (2002) Possible atmospheric CO2 extremes of the Middle Creta-ceous (late Albian-Turonian). Paleoceanography 17(4):22-1–22-17.
25. Pearson PN, et al. (2001) Warm tropical sea surface temperatures in the Late Creta-ceous and Eocene epochs. Nature 413(6855):481–487.
26. Donnadieu Y, Goddéris Y, Pierrehumbert R, Fluteau F, Dromart G (2006) Modellingthe primary control of paleogeography on Cretaceous climate. Geochem GeophysGeosyst 7(11):Q11019.
27. Lidgard S, Crane PR (1990) Angiosperm diversification and Cretaceous floristic trends:a comparison of palynofloras and leaf macrofloras. Paleobiology 16(1):77–93.
28. Spicer RA, et al. (2008) The Late Cretaceous continental interior of Siberia: A chal-lenge for climate models. Earth Planet Sci Lett 267(1-2):228–235.
29. Kump LR, Pollard D (2008) Amplification of Cretaceous warmth by biological cloudfeedbacks. Science 320(5873):195.
30. Beerling DJ, Fox A, Stevenson DS, Valdes PJ (2011) Enhanced chemistry-climatefeedbacks in past greenhouse worlds. Proc Natl Acad Sci USA 108(24):9770–9775.
31. Wikström N, Savolainen V, Chase MW (2001) Evolution of the angiosperms: cali-brating the family tree. Proc Biol Sci 268(1482):2211–2220.
32. Zhou Z, Barrett PM, Hilton J (2003) An exceptionally preserved Lower Cretaceousecosystem. Nature 421(6925):807–814.
33. Wang H, et al. (2009) Rosid radiation and the rapid rise of angiosperm-dominatedforests. Proc Natl Acad Sci USA 106(10):3853–3858.
34. Miller KG, Mountain GS, Wright JD, Browning JVA (2011) 180-million-year record ofsea level and ice volume variations from continental margin and deep-sea isotopicrecords. Oceanography 24(2):40–53.
35. Boyce CK, Brodribb TJ, Feild TS, Zwieniecki MA (2009) Angiosperm leaf vein evolutionwas physiologically and environmentally transformative. Proc Biol Sci 276(1663):1771–1776.
36. Jacob RL (1997) Low frequency variability in a simulated atmosphere ocean system.Thesis (Univ of Wisconsin, Madison).
37. Poulsen CJ, Pierrehumbert RT, Jacob RL (2001) Impact of ocean dynamics onthe simulation of the Neoproterozoic “snowball Earth”. Geophys Res Lett 28(8):1575–1578.
38. Poulsen CJ, Jacob RL, Pierrehumbert RT, Huynh TT (2002) Testing paleogeographiccontrols on a Neoproterozoic snowball Earth. Geophys Res Lett 29(11):10-1–10-4.
39. Poulsen CJ (2003) Absence of a runaway ice-albedo feedback in the Neoproterozoic.Geology 31(6):473–476.
40. Sitch S, et al. (2003) Evaluation of ecosystem dynamics, plant geography and terres-trial carbon cycling in the LPJ dynamic global vegetation model. Global Change Biol9(2):161–185.
41. Donnadieu Y, Goddéris Y, Bouttes N (2009) Exploring the climatic impact of thecontinental vegetation on the Mezosoic atmospheric CO2 and climate history. ClimPast 5(1):85–96.
42. Sewall JO, Wal RSW, van de Zwan CJ, van der Oosterhout C, Dijkstra HA, Scotese CR(2007) Climate model boundary conditions for four Cretaceous time slices. Clim Past3(4):647–657.
43. Dera G, Donnadieu Y (2012) Modeling evidences for global warming, Arctic seawaterfreshening, and sluggish oceanic circulation during the Early Toarcian anoxic event.Paleoceanography 27(2):PA2211.
14070 | www.pnas.org/cgi/doi/10.1073/pnas.1324002111 Chaboureau et al.


![[Agile Testing Day] Test Driven Development (TDD)](https://img.pdfslide.fr/doc/110x75/58ee50361a28ab75228b456f/agile-testing-day-test-driven-development-tdd.jpg)