Embed Size (px)
Citation preview
Use of acoustic emission to identify damage modes in glass fibrereinforced polyester
S. Hugueta, N. Godina,*, R. Gaertnera, L. Salmonb, D. Villardb
aGroupe d’Etudes de Metallurgie Physique et de Physique des Materiaux, INSA de Lyon, 20 Av. A. Einstein, 69621 Villeurbanne Cedex, FrancebEDF—Direction des Etudes et Recherches, Site des Renardieres, Route de Sens, Ecuelles, 77818 Moret-sur-Loing Cedex, France
Received 2 October 2001; accepted 16 May 2002
Abstract
The purpose of this work is the use of acoustic emission signal parameters to identify and characterise the various damagemechanisms in stressed glass fibre reinforced polymer composite. Data from acoustic emission are used as inputs in a Kohonen self-
organising map which automatically separate the acoustic emission signals, enabling a correlation with the failure mode. Theseresults open perspectives for real-time damage recognition in complex composite materials.# 2002 Elsevier Science Ltd. All rights reserved.
Keywords: A. Polymer-matrix composites (PMCs); B. Fracture; D. Acoustic emission; Kohonen map
1. Introduction
Acoustic emission (AE) technique has been developedover the last two decades as a non destructive evalua-tion technique and as an useful tool for materialresearch [1]. AE is an efficient method to monitor, inreal time, damage growth in both structural compo-nents and laboratory specimens. In loaded materials,the strain-energy release due to microstructural changesresults in stress-wave propagation. In the case of com-posite materials, many mechanisms have been con-firmed as AE sources including matrix cracking, fibre–matrix interface debonding, fibre fracture and delami-nation [2]. AE deals with the detection of such waves atthe materials surface. Therefore, this technique poten-tially allows not only the location of the source of theemission, but also the determination of its nature.Nevertheless, the use of such techniques needs a clearunderstanding of relationships between the recordedsignal and the damage process. However the stresswaves resulting from the microstructural changesdepend on the propagation conditions includingattenuation, damping and boundary surface interactions
in a heterogeneous medium. So the signal delivered bythe sensor is a strongly modified representation of theoriginal source. Nevertheless, it is realistic to considerthat this signal contains some features representation ofthe source in such a manner that direct correlation existsbetween the damage mechanisms and the magnitude ofthe various AE parameters. Consequently, each signalcan be considered as the acoustic signature of the dif-ferent damage modes.Many authors have already worked in this field. Barre
and Benzeggagh [3], testing glass fibre reinforced poly-propylene samples, reported that the acoustic signalamplitude varies with the corresponding damage mode:AE amplitude range from 40 to 55 dB corresponds tomatrix cracking, 60–65 dB to debonding, 65–85 dB topull-out and 85–95 dB to fibre fracture. Ely and Hill [2]showed that when fibre breaks and longitudinal splittingoccurs at the same location in unidirectional graphite/epoxy specimen, the stronger signals (high amplitude,energy, counts and long duration) resulted from fibrebreakage and the weaker ones (low amplitude, energy,counts and short duration) resulted from longitudinalsplit. Suziki et al. [4] observed the following correlationbetween failure mechanisms and AE frequency in glass/polyester composite : matrix cracking (30–150 kHz),fibre debonding and pull-out (180–290 kHz), fibre break-ing (300–400 kHz). Uenoya [5] proposed a rising-slope
0266-3538/02/$ - see front matter # 2002 Elsevier Science Ltd. All rights reserved.
PI I : S0266-3538(02 )00087-8
Composites Science and Technology 62 (2002) 1433–1444
www.elsevier.com/locate/compscitech
* Corresponding author. Tel.: +33-4-7243-8073; fax: +33-4-7243-
8830.
E-mail address: [email protected] (N. Godin).
criterion to discriminate AE source mechanisms inlaminated composites (glass-fibre-fabric/epoxy). Barnesand Ramirez [6], testing carbon fibre reinforced pipes,used correlation plots of event amplitude and durationtime to characterise the different modes of failure. Theyreported that high duration-low/intermediate amplitude(45–70 dB) events are associated with delamination anddebonding while high amplitude-high duration eventsare associated with fibre fracture.However, a single damage mechanism such as matrix
cracking can produce a wide range of AE signal para-meters [7]. For the various mechanisms, overlap of theAE parameters distributions results from signalattenuation, closely occurring emissions from differentsources, equipment setting and large data sets. Thus,multiparameter analysis using many AE waveformparameters should be necessary to improve the identifi-cation of damage modes. Pattern recognition has beenproposed as a suitable multivariable technique for theclassification of AE events [8]. If supervised patternrecognition is used, the number of damage mechanismsmust be known in advance. The term unsupervised pat-tern recognition is used to describe the complete meth-odology consisting of procedures for descriptorsselection, cluster analysis and cluster validity. Ono andHuang [9] proposed a distinction between severaldamage mechanisms with waveform-based analysesassociated to advanced pattern recognition techniques.They identified six different types of damage in carbonfibre and glass fibre composites subjected to tensileloading in different configurations.Anyway, the experimental evidence of assigning any
kind of damage mechanism to a peculiar signal cluster israther difficult when many damage mechanisms takeplace in the same composite material. Besides, the abovereferenced authors do not proceed to such an evidenceafter they classified the AE signals. Therefore, our pur-pose is to use a methodology with the aim of identifyingthe acoustic signatures of the damage mechanisms. Forthat purpose, tensile stresses have been applied on sam-ples of pure resin and of composite under different con-ditions that were expected to produce preferentialdamage mechanisms. As the goal of our study was todeal with the the risks of tightness loss feared in com-posite pipe structures, the considered damage modes tobe identified are mainly matrix fracture and fibre/matrixdecohesion. AE was first studied via the parameters andwaveforms of the signals. Two main types of signalswere identified, originating from the two expecteddamage mechanisms. But the difficulty to separatestrictly two clusters within a large quantity of signalsleads us to use pattern recognition techniques. Neuralnetworks have demonstrated their capability in func-tionally modelling processes involving many variables[10–12]. Clustering algorithms attempt to organise fea-ture vectors into clusters such that points within a
cluster are more similar to each others than vectorsbelonging to different clusters. Yan et al. [13] show thesignificant potential for AE signal classification by theself-organization neural network technique.In this paper, we investigate the development of
Kohonen’s self-organising map [14] for AE data and theuse of the non-linear projection of self-organising maptechnique (NP-SOM), developed by Mao and Jain [15],to identify classes of signals on the Kohonen map.Kohonen network is a neural network based on thetopological properties of the human brain also knownas self-organising feature map. Based on a network ofneural units, Kohonen’s self-organising map belongs tothe category of unsupervised neural networks. The maincharacteristic of the Kohonen algorithm is its ability todevelop feature maps corresponding to the distributionsof vectors in the input set and to organise such maps ina topologically coherent manner. Thus, given a set ofdata, the Kohonen algorithm would be expected toorganise the output layer as a map on which similarshapes are detected by clusters of neurones close to eachother. The combination of AE multiparameter analysisand neural networks, in the form of a Kohonen self-organising map, was successfully employed to dis-criminate signals originating from different damagetypes.
2. Experimental procedure
2.1. Materials and specimens
The experimental work was carried out on unidirec-tional glass/polyester composite materials. The densityof the glass fibre is 2.6 g/cm3 and tensile strength andmodulus are 3200 MPa and 76 GPa respectively. Rec-tangular plates were obtained by hand lay up technique.This method consists of applying successively into amould surface, a release agent (Mold-Wiz F57 NC), alayer of resin (Scott Bader, Crystic R 115 PA with Per-oximon K1 hardener), a layer of reinforcement (glassfibre E 300g/m2) and to impregnate the reinforcementby hand with the aid of a roller. The stacking sequenceconsisted of 12 layers. Polymerisation was achieved atroom temperature during approximately 12 h under apressure.All the samples for tensile tests were cut from 2.5 mm
thickness plates, using a diamond wheel saw. This pro-cess was found to give a suitably smooth surface finishwith the minimum sub-surface damage. The tensile spe-cimens were 10�100�2.5 mm3. A tensile load appliedon pure resin specimens gives rise to an uniform uni-directional stress state. On the contrary, thanks to theheterogeneity, it gives rise to complicated three dimen-sional stress states in composite materials. Three typesof samples were used in this study: pure resin, 45 and
1434 S. Huguet et al. / Composites Science and Technology 62 (2002) 1433–1444
90� off-axis unidirectional samples. Each of these typeswas expected to generate preferentially certain damagemodes during tests: matrix fracture for resin samples,mainly matrix fracture with some decohesions for 90�
off-axis, mainly decohesions with some matrix fracturefor 45� off-axis. 90� tensile test permits to compare theAE signals to those obtained with the pure resin.
2.2. Mechanical testing
All monotonic tensile tests were performed at roomtemperature using an Instron machine. Ten samples ofeach type were tested. The rate of movement of themachine cross-head was 0.1 mm/min. The load andstrain were also recorded. Portions of the specimen gagelength were cut and polished. Ex-situ optical and scan-ning microscopy techniques as well as X-ray tomo-graphy were used to study the evolution of the damagein the specimens.
2.3. Acoustic emission
Acoustic emission was continuously monitored duringthe tensile tests by using a Mistras 2001 data acquisitionsystem of Physical Acoustics Corporation (PAC), with asampling rate of 8 MHz and a 40 dB pre-amplification.The total amplification of the recording system was 80dB. Ambient noise was filtered using a threshold of32 dB. AE measurements were achieved by using tworesonant micro-80 PAC sensors which have a largerange of resonance (200 kHz–1 MHz), coupled on thefaces of the samples with silicon grease. The sensorswere held in place with a mechanical device. Theamplitude distribution covers the range 0–100 dB (0 dBcorresponds to 1 mV at the transducer output). Thenominal distance between the sensors was 70 mm. Afterthe installation of the transducers, a pencil lead break[16] procedure was used to simulate AE signals in thecalibration of each test. In this test, a repeatable acous-tic wave can be generated. When the lead breaks, thereis a sudden release of stress on the surface of the samplecausing an acoustic wave. Preliminary measurementsallowed us to set up the acquisition parameters for ourmaterials (peak definition time=40 ms; hit definitiontime=80 ms; Hit lock time=300 ms) and to measure themean wave speed for each sample to achieve the linear
localisation of AE sources. The difference in arrivaltimes between the two sensors was deduced from thefirst peaks detected. This velocity determination proce-dure was repeated several times and at different posi-tions between the sensors to ensure the accuracy of themeasured wave speed. The velocity was found to beequal to 2100 m/s for the pure resin, 2650 m/s for the90� sample and 3050 m/s for 45� sample. Attenuation ofAE waves was measured using a pencil lead break pro-cedure. It was small enough to dispense from doing anycorrection of the measured amplitudes owing to thesmall length of the samples. We recorded six parameterson each signal, calculated from the waveforms (risetime, counts, energy, duration, amplitude, counts topeak). These parameters are collected as the compo-nents of a vector associated with the signal they derivefrom. Furthermore each waveform was digitised andstored. After storage and before processing the signalswere subjected to a linear location procedure to deter-mine the location of AE signal source. In the analysis ofAE results, only events located between the sensors wereused.
3. Kohonen’s self organizing neural network
3.1. Neural network architecture and learning phase
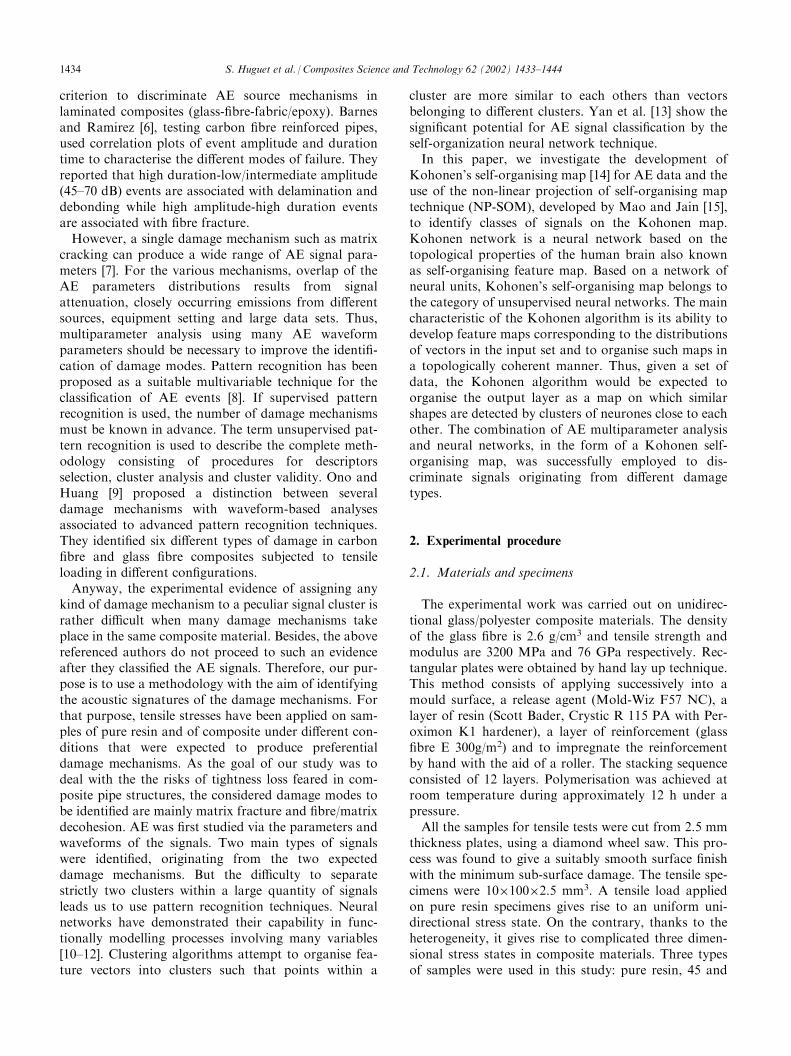
A Kohonen self-organising map was used as a statis-tical tool in order to separate numerically the differentclasses of signals. Kohonen’s self-organising map is anetwork of simple processing units called neurones[17,18]. The network architecture is shown in Fig. 1 (a).It basically consists of a two-dimensional array of32�32 units. Kohonen’s neural network associates eachof the input vectors to a representative output i.e. aneurone. An artificial neurone j in its simplest form isshown in Fig. 1 (b). Here the wij are the weight vectorWj components, connecting the inputs to output node j;the xi are the input vector X components. The output ofthe neurone is the quadratic distance dj between thesetwo vectors. Before use, the weights of the neurones areadapted during a learning stage as though near-featuresignals stimulate relatively near neurones. The resultafter the learning phase is a map representing topologicallythe different classes of input signals.
Fig. 1. Schematic representation of the Kohonen map (a), the base neurone (b).
S. Huguet et al. / Composites Science and Technology 62 (2002) 1433–1444 1435
Kohonen’s network is trained using an iterativealgorithm. We summarise the learning algorithm forKohonen’s self-organising map as follows:
(1) Initialise all the weights to a random valuebetween 0 and 1.
(2) Randomly select an input vector X; present it tothe all neurones of the network and evaluate thecorresponding quadratic distance output djaccording to the relation 1.
dj ¼ X�Wj
�� ��2¼Xn
i¼1
wij � xi
� �2; ð1Þ
where n is the number of input vector components.
(3) Select the neurone with the minimum output djas the winning neurone i.e. the nearest vector tothe input vector. Let j* denote the index of thewinner, the minimun output writes
dj� ¼ minj2 1::::m½
X�Wj
�� ��2; ð2Þ
where m is the number of neurones.
(4) Update the weight of the winning neuroneaccording as follows
wij� kþ 1ð Þ ¼ wij� kð Þ þ � kð Þ xi kð Þ � wij� kð Þ� �
; ð3Þ
where k is the learning iteration count and � thegain term. The learning gain was chosen to startwith the value 1, decreasing by a factor of 0.0001after each learning input pass.
(5) The neighbours of that neurone, defined by theneighbourhood function N(j*), are also updatedon the following manner.
wij kþ 1ð Þ ¼ wij kð Þ þ � kð Þ xi kð Þ � wij kð Þ� �
if j 2 neighbourhood of j�;N j�ð Þ
wij kþ 1ð Þ ¼ wij kð Þ
if j 62 neighbourhood of j�ð5Þ
This neighbourhood function N(j*) defines how manyneurones, in the neighbourhood of the winning one, areupdated for each learning input. This parameter is ofhigh importance, being the basis of the map’s topologyforming. A convenient initial neighbouring ‘‘radius’’was found to be of 13, decreasing with k. As trainingprocess is going on, the size of the neighbourhood is
decreased and at the end of the training only winningunit is adjusted. In this work we used a linear function[14]. The nodes at the edges of the map are treated withcare. A node at a map edge has neighbours at otherextremity map. Thus our map is a flattened version of asphere.
(6) Repeat steps 2–5 until all the input vectors Xhave been used at least one time.
3.2. A non-linear projection based on Kohonen’sself-organising map
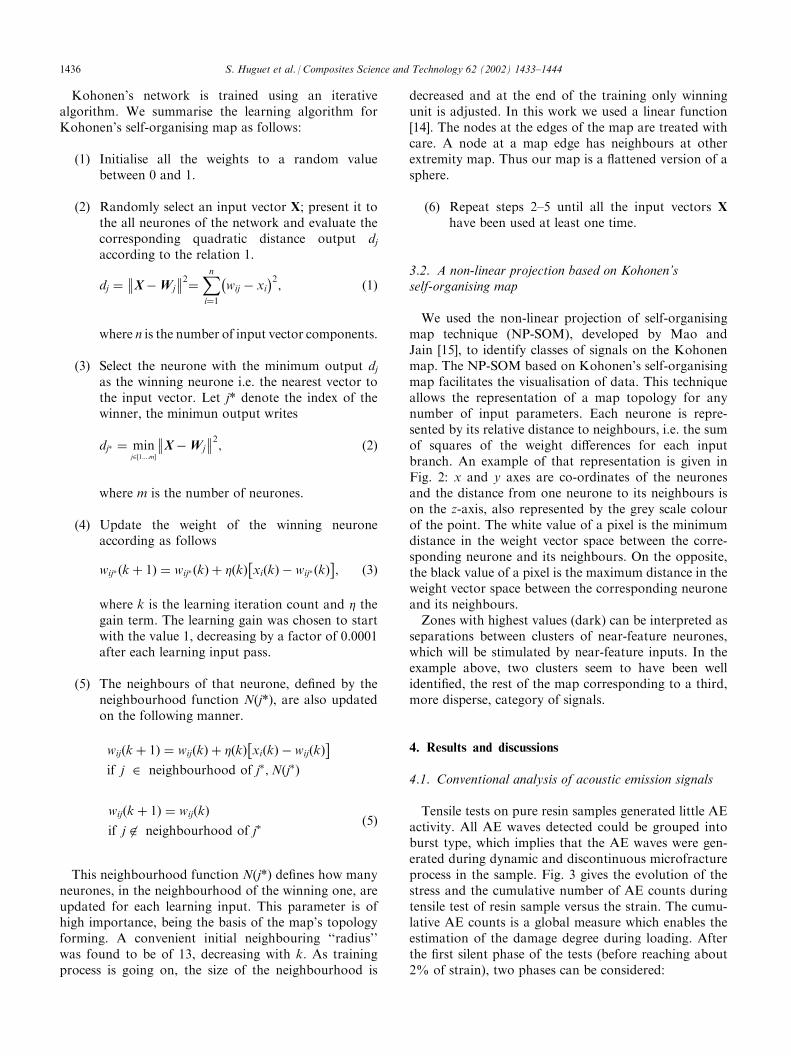
We used the non-linear projection of self-organisingmap technique (NP-SOM), developed by Mao andJain [15], to identify classes of signals on the Kohonenmap. The NP-SOM based on Kohonen’s self-organisingmap facilitates the visualisation of data. This techniqueallows the representation of a map topology for anynumber of input parameters. Each neurone is repre-sented by its relative distance to neighbours, i.e. the sumof squares of the weight differences for each inputbranch. An example of that representation is given inFig. 2: x and y axes are co-ordinates of the neuronesand the distance from one neurone to its neighbours ison the z-axis, also represented by the grey scale colourof the point. The white value of a pixel is the minimumdistance in the weight vector space between the corre-sponding neurone and its neighbours. On the opposite,the black value of a pixel is the maximum distance in theweight vector space between the corresponding neuroneand its neighbours.Zones with highest values (dark) can be interpreted as
separations between clusters of near-feature neurones,which will be stimulated by near-feature inputs. In theexample above, two clusters seem to have been wellidentified, the rest of the map corresponding to a third,more disperse, category of signals.
4. Results and discussions
4.1. Conventional analysis of acoustic emission signals
Tensile tests on pure resin samples generated little AEactivity. All AE waves detected could be grouped intoburst type, which implies that the AE waves were gen-erated during dynamic and discontinuous microfractureprocess in the sample. Fig. 3 gives the evolution of thestress and the cumulative number of AE counts duringtensile test of resin sample versus the strain. The cumu-lative AE counts is a global measure which enables theestimation of the damage degree during loading. Afterthe first silent phase of the tests (before reaching about2% of strain), two phases can be considered:
1436 S. Huguet et al. / Composites Science and Technology 62 (2002) 1433–1444
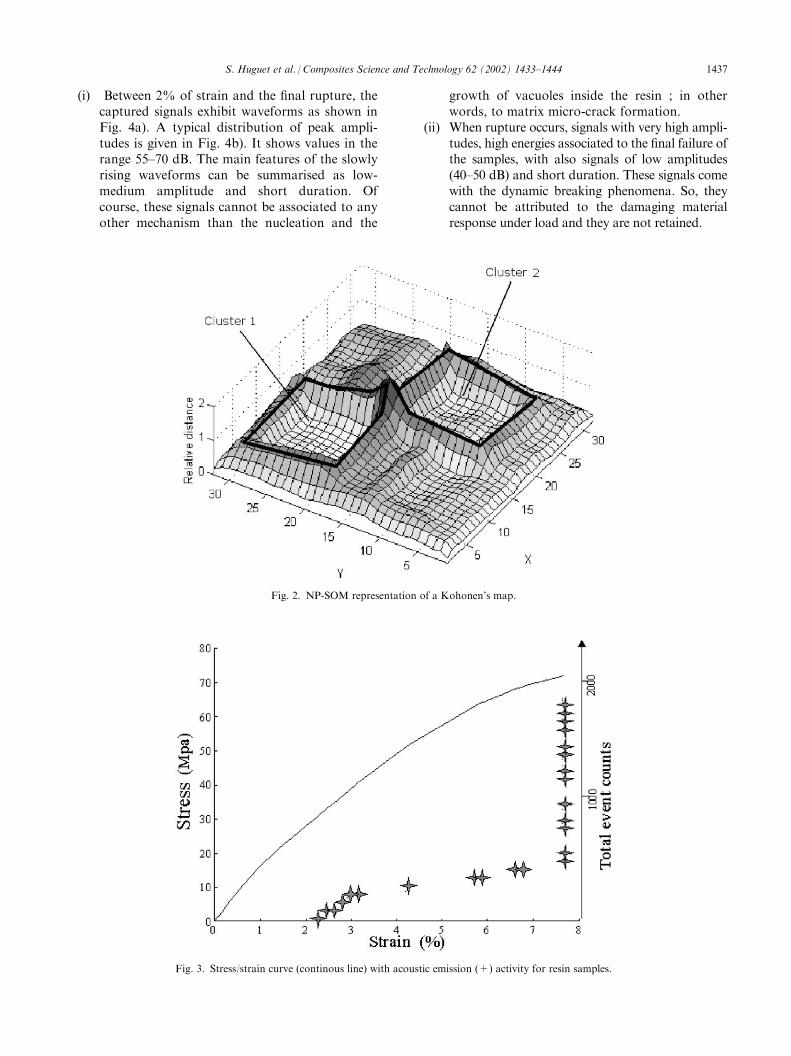
(i) Between 2% of strain and the final rupture, thecaptured signals exhibit waveforms as shown inFig. 4a). A typical distribution of peak ampli-tudes is given in Fig. 4b). It shows values in therange 55–70 dB. The main features of the slowlyrising waveforms can be summarised as low-medium amplitude and short duration. Ofcourse, these signals cannot be associated to anyother mechanism than the nucleation and the
growth of vacuoles inside the resin ; in otherwords, to matrix micro-crack formation.
(ii) When rupture occurs, signals with very high ampli-tudes, high energies associated to the final failure ofthe samples, with also signals of low amplitudes(40–50 dB) and short duration. These signals comewith the dynamic breaking phenomena. So, theycannot be attributed to the damaging materialresponse under load and they are not retained.
Fig. 3. Stress/strain curve (continous line) with acoustic emission (+) activity for resin samples.
Fig. 2. NP-SOM representation of a Kohonen’s map.
S. Huguet et al. / Composites Science and Technology 62 (2002) 1433–1444 1437
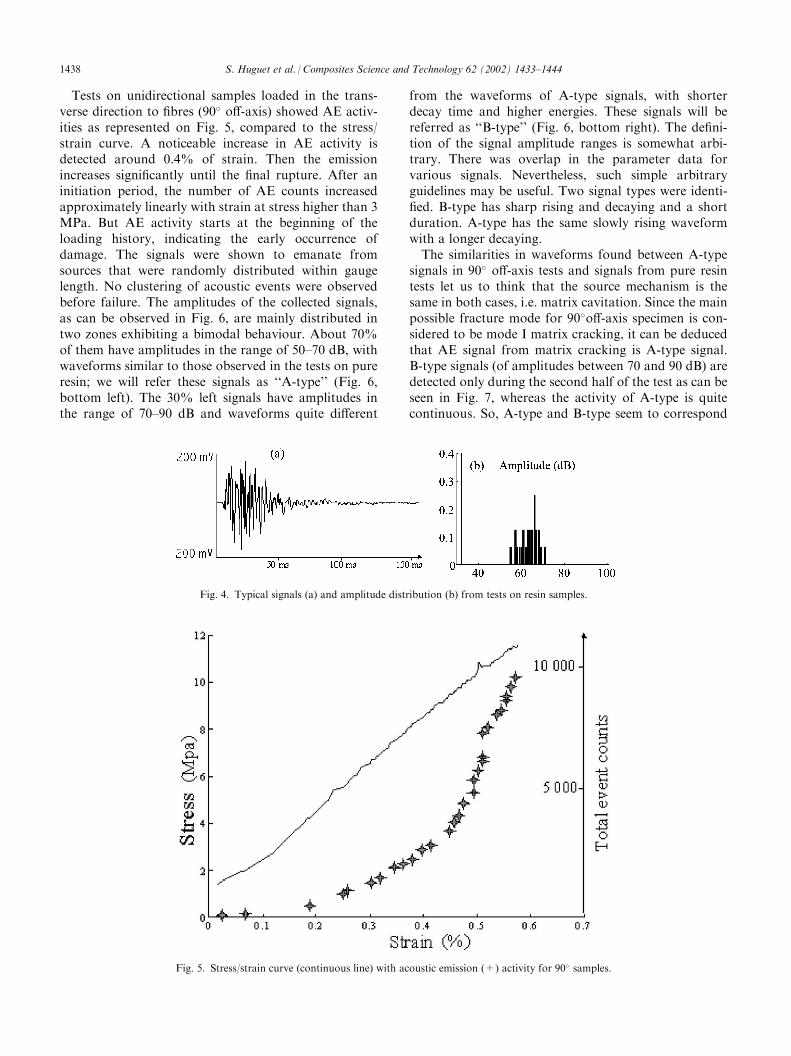
Tests on unidirectional samples loaded in the trans-verse direction to fibres (90� off-axis) showed AE activ-ities as represented on Fig. 5, compared to the stress/strain curve. A noticeable increase in AE activity isdetected around 0.4% of strain. Then the emissionincreases significantly until the final rupture. After aninitiation period, the number of AE counts increasedapproximately linearly with strain at stress higher than 3MPa. But AE activity starts at the beginning of theloading history, indicating the early occurrence ofdamage. The signals were shown to emanate fromsources that were randomly distributed within gaugelength. No clustering of acoustic events were observedbefore failure. The amplitudes of the collected signals,as can be observed in Fig. 6, are mainly distributed intwo zones exhibiting a bimodal behaviour. About 70%of them have amplitudes in the range of 50–70 dB, withwaveforms similar to those observed in the tests on pureresin; we will refer these signals as ‘‘A-type’’ (Fig. 6,bottom left). The 30% left signals have amplitudes inthe range of 70–90 dB and waveforms quite different
from the waveforms of A-type signals, with shorterdecay time and higher energies. These signals will bereferred as ‘‘B-type’’ (Fig. 6, bottom right). The defini-tion of the signal amplitude ranges is somewhat arbi-trary. There was overlap in the parameter data forvarious signals. Nevertheless, such simple arbitraryguidelines may be useful. Two signal types were identi-fied. B-type has sharp rising and decaying and a shortduration. A-type has the same slowly rising waveformwith a longer decaying.The similarities in waveforms found between A-type
signals in 90� off-axis tests and signals from pure resintests let us to think that the source mechanism is thesame in both cases, i.e. matrix cavitation. Since the mainpossible fracture mode for 90�off-axis specimen is con-sidered to be mode I matrix cracking, it can be deducedthat AE signal from matrix cracking is A-type signal.B-type signals (of amplitudes between 70 and 90 dB) aredetected only during the second half of the test as can beseen in Fig. 7, whereas the activity of A-type is quitecontinuous. So, A-type and B-type seem to correspond
Fig. 4. Typical signals (a) and amplitude distribution (b) from tests on resin samples.
Fig. 5. Stress/strain curve (continuous line) with acoustic emission (+) activity for 90� samples.
1438 S. Huguet et al. / Composites Science and Technology 62 (2002) 1433–1444
to different mechanisms inside the material. It is thoughtthat B-type must have another mechanical origin,occurring after certain matrix damage level has beenattained.Fig. 8 represents the stress/strain curve, with AE
activity, for the tests on 45� off-axis. As for the 90� off-axis specimen, AE starts at a relatively low load. The
corresponding amplitude distribution and typical wave-forms are represented in Fig. 9. A-type and B-type sig-nals can be observed in the same amplitude zones aspreviously and with very close parameters and wave-forms. However, B-type signals are found much morenumerous (80%) than A-type in these tests (20%). Themain expected damage mode in these types of tests,
Fig. 7. Amplitude distribution evolution during tensile test for 90� samples.
Fig. 6. Amplitude distribution and typical signals from tensile tests on 90� samples.
S. Huguet et al. / Composites Science and Technology 62 (2002) 1433–1444 1439
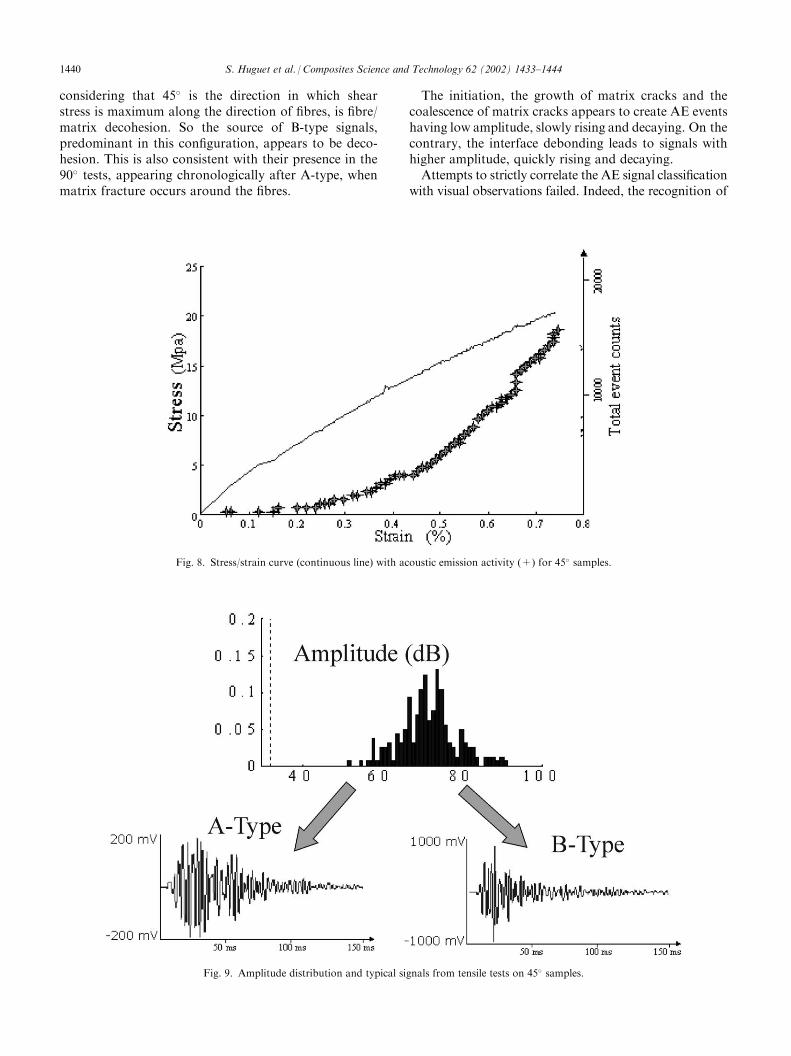
considering that 45� is the direction in which shearstress is maximum along the direction of fibres, is fibre/matrix decohesion. So the source of B-type signals,predominant in this configuration, appears to be deco-hesion. This is also consistent with their presence in the90� tests, appearing chronologically after A-type, whenmatrix fracture occurs around the fibres.
The initiation, the growth of matrix cracks and thecoalescence of matrix cracks appears to create AE eventshaving low amplitude, slowly rising and decaying. On thecontrary, the interface debonding leads to signals withhigher amplitude, quickly rising and decaying.Attempts to strictly correlate the AE signal classification
with visual observations failed. Indeed, the recognition of
Fig. 8. Stress/strain curve (continuous line) with acoustic emission activity (+) for 45� samples.
Fig. 9. Amplitude distribution and typical signals from tensile tests on 45� samples.
1440 S. Huguet et al. / Composites Science and Technology 62 (2002) 1433–1444
damages at their nucleation step is very uncertain onmicrographies and the submicronic size of the damagesis too small to be detected by the available X-raytomography device.
4.2. Statistical analysis
4.2.1. Kohonen’s self-organising map : learning phase
4.2.1.1. Pertinent AE parameters. Reliable parametersare needed for multiparameter statistical analysis. So,the features of the input vectors were calculated duringa post processing analysis. MISTRAS system uses afixed threshold to detect a signal arrival time, but also todetect the end of the signal. Parameters like duration,energy, counts are very dependent on this threshold. Infact these parameters are not only characteristic of thesource but also of sensor characteristics. So we used adifferent threshold to find the duration of the signals,calculated by a percentage of its total amplitude (10%).In Table 1, some of the AE parameters given by theacquisition system are compared to those obtained afterpost-processing with a so defined threshold. Six com-ponents of an input vector are determined on each AEsignal as the following independent parameters : rise time,counts, energy, duration, amplitude and counts to peak.
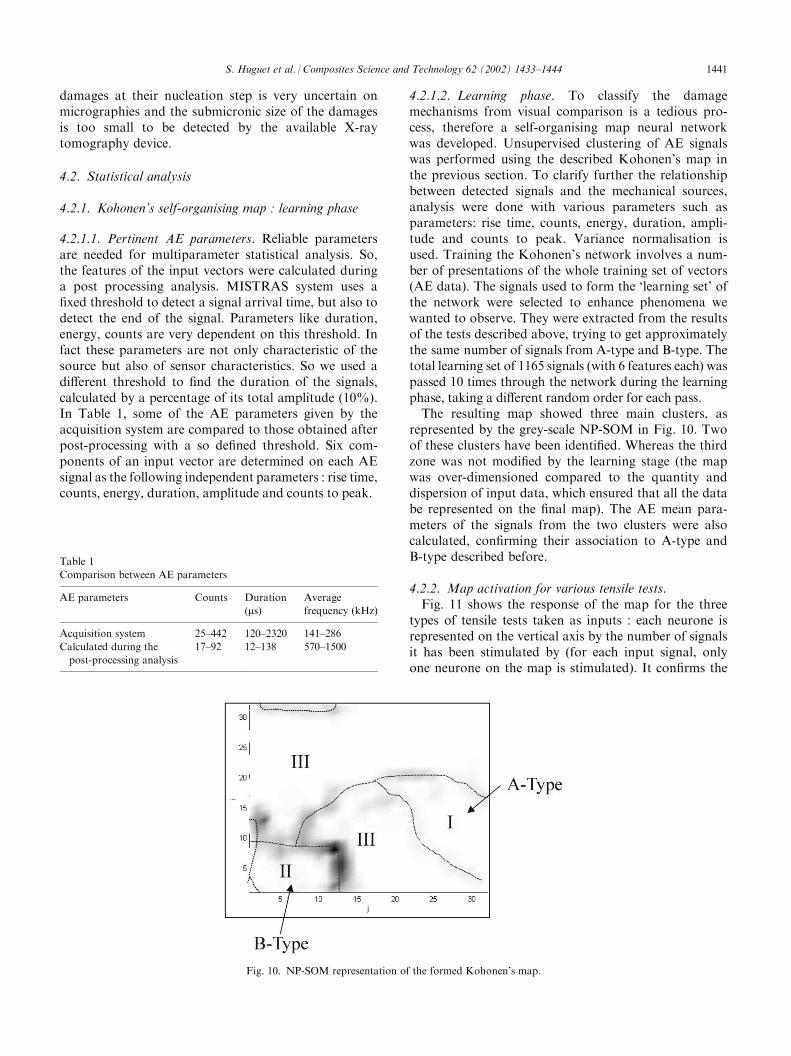
4.2.1.2. Learning phase. To classify the damagemechanisms from visual comparison is a tedious pro-cess, therefore a self-organising map neural networkwas developed. Unsupervised clustering of AE signalswas performed using the described Kohonen’s map inthe previous section. To clarify further the relationshipbetween detected signals and the mechanical sources,analysis were done with various parameters such asparameters: rise time, counts, energy, duration, ampli-tude and counts to peak. Variance normalisation isused. Training the Kohonen’s network involves a num-ber of presentations of the whole training set of vectors(AE data). The signals used to form the ‘learning set’ ofthe network were selected to enhance phenomena wewanted to observe. They were extracted from the resultsof the tests described above, trying to get approximatelythe same number of signals from A-type and B-type. Thetotal learning set of 1165 signals (with 6 features each) waspassed 10 times through the network during the learningphase, taking a different random order for each pass.The resulting map showed three main clusters, as
represented by the grey-scale NP-SOM in Fig. 10. Twoof these clusters have been identified. Whereas the thirdzone was not modified by the learning stage (the mapwas over-dimensioned compared to the quantity anddispersion of input data, which ensured that all the databe represented on the final map). The AE mean para-meters of the signals from the two clusters were alsocalculated, confirming their association to A-type andB-type described before.
4.2.2. Map activation for various tensile tests.Fig. 11 shows the response of the map for the three
types of tensile tests taken as inputs : each neurone isrepresented on the vertical axis by the number of signalsit has been stimulated by (for each input signal, onlyone neurone on the map is stimulated). It confirms the
Table 1
Comparison between AE parameters
AE parameters Counts Duration
(ms)Average
frequency (kHz)
Acquisition system 25–442 120–2320 141–286
Calculated during the
post-processing analysis
17–92 12–138 570–1500
Fig. 10. NP-SOM representation of the formed Kohonen’s map.
S. Huguet et al. / Composites Science and Technology 62 (2002) 1433–1444 1441
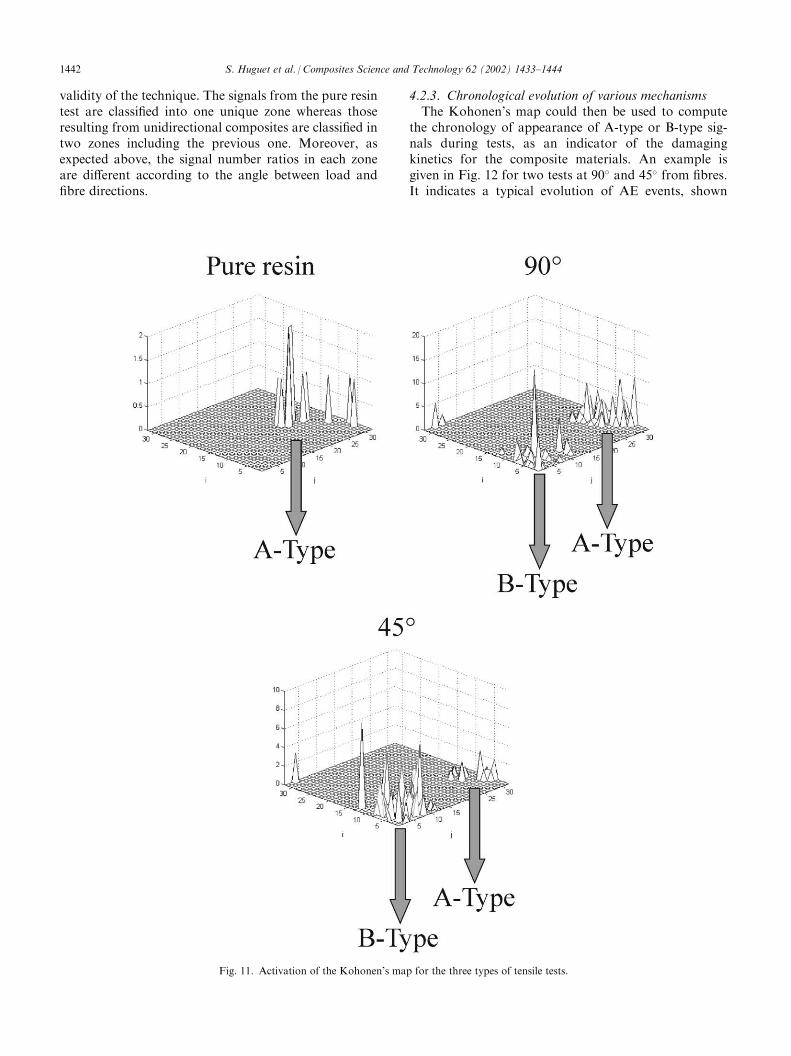
validity of the technique. The signals from the pure resintest are classified into one unique zone whereas thoseresulting from unidirectional composites are classified intwo zones including the previous one. Moreover, asexpected above, the signal number ratios in each zoneare different according to the angle between load andfibre directions.
4.2.3. Chronological evolution of various mechanismsThe Kohonen’s map could then be used to compute
the chronology of appearance of A-type or B-type sig-nals during tests, as an indicator of the damagingkinetics for the composite materials. An example isgiven in Fig. 12 for two tests at 90� and 45� from fibres.It indicates a typical evolution of AE events, shown
Fig. 11. Activation of the Kohonen’s map for the three types of tensile tests.
1442 S. Huguet et al. / Composites Science and Technology 62 (2002) 1433–1444
with discriminated source mechanisms. For the 90�
sample, it is observed that the two classes exhibit similaractivity trends. The fraction of A-type signals for 90�
sample evolved more prominently than for the 45�
sample, from the beginning to the end of deformation.On the opposite, a larger fraction of B-type was detec-ted for 45� than for 90� in agreement with the fact thatdecohesion is the dominant mechanism. We note thatthe number of B-type signals, i.e. decohesion, greatlyincreases at the end of tests, causing the final failure ofthe material.
5. Conclusion
Statistical analysis has been used in parallel withmaterial characterisation to identify the AE signaturesof the two precursory failure modes in GFRP pipes:matrix fracture and fibre-matrix decohesion. We identi-fied the signals from the first of those sources with ten-sile tests on resin and we were able to detect a secondtype of acoustic emission during off-axis tensile tests,due to fibre/matrix decohesion. Signals issued from AEsources due to matrix cracking and decohesion had dif-ferent peak amplitude, signal duration and energy dis-tributions. The Kohonen’s map was used as a statisticaltool to separate numerically the associated signals viasix parameters calculated from the waveforms. Thismethod showed good results for the clustering of AEsignals from different mechanical sources. With the aimof identification of signals originating from fibre failure,still using neural network approach, complementarystudies are in progress. On a macroscopic level, thecumulative plot of the events of each class versus timeclearly indicates damage initiation and progression of
each failure mechanism. This work can lead to perspec-tives like real-time detection of damage in complexGFRP pipes structures, by analysing the evolution ofAE activity originating from the ‘most dangerous’damage modes.
Acknowledgements
We gratefully acknowledge Dominique Choqueuse,Peter Davies and Henri Loaec, from the IFREMERcentre of Brest (France), for the elaboration of the glass/polyester composite samples.
References
[1] Beattie AG. Acoustic emission, principles and instrumentation.
Journal of Acoustic Emission 1983;2(1/2):95–128.
[2] Ely TM, Hill EK. Longitudinal splitting and fibre breakage
characterisation in graphite/epoxy using acoustic emission data.
Materials Evaluation 1995:288–94.
[3] Barre S, Benzeggagh M-L. On the use of acoustic emission to
investigate damage mechanisms in glass-fibre-reinforced poly-
propylene. Comp Sci Technol 1994;52:369–76.
[4] Suziki M, Nakanishi H, Iwamoto M, Jinen E. Application of
static fracture mechanisms to fatigue fracture behaviour of class
A-SMC composite. Proc 4th Japan-US Conf on composite
materials 1988:297–306.
[5] Uenoya T. Acoustic emission analysis on interfacial fracture of
laminated fabric polymer matrix composite. Journal of Acoustic
Emission 1995;13:S95–0S102.
[6] Barnes AC, Ramirez G. Acoustic emission testing of carbon fiber
composite offshore drilling risers. AECM-6 (Conference pro-
ceedings), San Antonio, Texas; 1998. pp. 13–22.
[7] Prosser WH, Jackson KE, Kellas S, Smith BT, MacKeon J, Fried-
man A. Advanced waveform-based acoustic emission detection of
matrix cracking in composites. Materials evaluation 1995:1052–8.
Fig. 12. Micro failure evolution estimated by the AE source mechanism recognition analysis with a Kohonen’s map.
S. Huguet et al. / Composites Science and Technology 62 (2002) 1433–1444 1443
[8] Yuki HK, Homma K. Analysis of artificial acoustic emission
waveform using a neural network. Journal of Acoustic Emission
1992;10(3/4):35–41.
[9] Ono K, Huang Q. Pattern recognition analysis of acoustic emis-
sion signals. Progress. in Acoustic Emission VII, The Japanese
Society for NDI; 1994. pp. 69–78.
[10] Philippidis TP, Nikolaidis VN. Anastassopoulos, unsupervised
pattern recognition techniques for the prediction of composite
failure. Journal of acoustic emission 69;17(1/2)–81.
[11] Philippidis TP, Nikolaidis VN, Anastassopoulos AA. Damage
characterization of carbon/carbon laminates using neural networks
techniques onAE signals. NDT&E International 1998;31(5):329–40.
[12] Fisher ME, Hill EK. Neural network burst prediction in fiber-
glass epoxy pressure vessels using acoustic emission. Materials
Evaluation 1998:1395–998.
[13] Yan T, Holford K, Carter D, Brandon J. Classification of
acoustic emission signatures using a self-organization neural net-
work. Journal of acoustic emission 1999;17(1/2):49–59.
[14] Kohonen T. Self-organized network. Proc IEEE 1990;(43):59–
69.
[15] Mao J, Jain AK. Artificial neural networks for feature extraction
and multivariate data projection. IEEE Trans on Neural Net-
works 1995;6:296–317.
[16] Nielsen A. Acoustic emission source based on pencil lead break-
ing. The Danish Welding Institute Publication 1980;80:15.
[17] Lippmann RP. An introduction to computing with neural nets.
IEEE ASSP Magazine 1987:4–22.
[18] Zuzan H, Holbrook JA, Kim PT, Harauz G. Coordinate-
free self-organising feature maps. Ultramicroscopy 1997;68:
201–14.
1444 S. Huguet et al. / Composites Science and Technology 62 (2002) 1433–1444


![read.pudn.comread.pudn.com/downloads64/ebook/224270/TMS320 DSPBIOS.pdf · iv Related Documentation From Texas Instruments Square brackets ( [ and ] ) identify an optional parameter](https://img.pdfslide.fr/doc/110x75/5ebef7d4c6aa2e02be2bde77/readpudn-dspbiospdf-iv-related-documentation-from-texas-instruments-square.jpg)