Embed Size (px)
Citation preview
Vibrational Spectra of Triiodomesitylene: Combination of DFT Calculations andExperimental Studies. Effects of the Environment
Jean J. Meinnel,*,† Ali Boudjada,§ Abdou Boucekkine,† Fahima Boudjada,§ Alain Moreac,‡ andStewart F. Parker|
Laboratoire Sciences Chimiques de Rennes, UMR CNRS 6226 and Laboratoire Matière Condensée etMatériaux, UMR CNRS 6226, UniVersite de Rennes 1, 35042 Rennes, France, Laboratoire de cristallographie,Faculte des Sciences, UniVersite de Constantine, Constantine, Algerie, and Rutherford Appleton Laboratory,ISIS Facility, Didcot OX11 0QX, U.K.
ReceiVed: February 10, 2008; ReVised Manuscript ReceiVed: June 22, 2008
A study of the internal vibrations of triiodomesitylene (TIM) is presented. It is known from X-rays diffraction at293 K that the molecule has nearly D3h symmetry because of the large delocalization of the methyl protons. Byusing Raman and infrared spectra recorded at room temperature, a first assignment is done by comparing TIMvibrations with those of 1,3,5-triiodo- and 1,3,5-trimethyl-benzene. This assignment is supported by DFT calculationsby using the MPW1PW91 functional with the LanL2DZ(d,p) basis set and assuming C3h symmetry. The agreementbetween the calculated and experimental frequencies is very good: always better than 97% for the observed skeletalvibrations. The calculations overestimate the methyl frequencies by 7%, and experiment shows only broad featuresfor these excitations. Because a neutron diffraction study had established that the TIM conformation at 14 K is notexactly trigonal, new theoretical calculations were done with Cs symmetry. This shows that all previous E′ and E″modes of vibration are split by 2-12 cm-1. This is confirmed by infrared, Raman, and inelastic neutron scatteringspectra recorded below 10 K. Apart from two frequencies, all the TIM skeleton vibrations have been detected andassigned by using Cs symmetry. For the methyl vibrations, experiment has confirmed the splitting of the previouslydegenerate modes; only some small discrepancies remain in the assignment. This is partly due to the difference ofthe model conformation used in the calculations and the crystallographic one. All these results confirm that eachof the three methyl groups has not only its own tunnel splitting but also a different specific spectroscopic behaviorfor all the molecular modes.
1. Introduction
Quantum mechanical calculations (QMC) are able to veryaccurately find molecular conformations and then to calculatethe frequencies and the intensities of the normal modes ofvibration. Already in 1992, from systematic comparisonsbetween DFT calculations with Hartree-Fock (HF) andMøller-Plesset (MP2) treatments, several groups had concludedthat for the calculation of small molecule’s vibrational frequen-cies, DFT gave better agreement with the experiments, even iffor a given basis set, the geometries and dipole moments wereslightly worse.1,2 Progressively larger systems were studied, andwork on trifluorobenzene and hexafluorobenzene had demon-strated the potential of DFT:3 the agreement between inelasticneutron scattering (INS) and computed values corresponds toan rms of less than 20 cm-1. The agreement was slightly worsewhen light atoms, and in particular hydrogen, are involved;therefore, workers proposed the use of one and even severalscaling factors in order to obtain better agreement withexperiment.4-11 Progressively, by using larger basis sets, betteragreement has been obtained, but in the case of hydrogenouscompounds, discrepancies remain, mainly due to the fact thatthe harmonic approximation has been used. A demonstrationof the influence of this approximation is given in recent work
on naphthalene using B3LYP/6-311G**;12 this work shows thatthe introduction of anharmonic corrections noticeably improvesthe agreement with experiment, in particular for the C-Hstretches with a decrease from the harmonic values by about150 cm-1, thus improving the agreement with experimentalvalues by 5%.
Our group is particularly interested in the study of substitutedbenzenes,11-28 especially when the substitution is the same onboth sides of a methyl group (Me): in this case, the Me is aweakly hindered rotor with a large tunnel splitting and lowenergy torsional modes.14-17,21-23 In the case of molecules withmethyl groups surrounded by heavy atom substituents (Cl, Br,or I), a specific difficulty appears in the assignment of the Metorsional frequencies because they appear in the same frequencyrange as the lattice vibrations and some internal modes.15,18,23,24
Furthermore, for weakly hindered Me rotors, the Me protonsare largely spread around the carbon atom;18,19,24,25 in conse-quence, the validity and accuracy of the theoretical calculationswhich are based on the harmonic approximation are subject tocaution for all the motions implying Me groups. Second, in thesolid state, Me conformation changes may happen because ofthe crystal field,19 and this will modify the Me torsion spectrum.In consequence, the frequencies of the torsion modes would beindicative of the Me conformation and simultaneously of itshindering potential. Furthermore, because the torsion modesoccur at low frequencies (below 200 cm-1), their coupling withother vibrations must also be investigated.22-25
This work is a part of a systematic study of the 1,3,5-trihalogeno-2,4,6-trimethyl-benzenes (trihalogeno-mesitylenes or
* Corresponding author.† Sciences Chimiques, Universite de Rennes 1.§ Laboratoire de cristallographie, Universite de Constantine.‡ Laboratoire Matiere Condensee et Materiaux, Universite de Rennes 1.| Rutherford Appleton Laboratory.
J. Phys. Chem. A 2008, 112, 11124–1114111124
10.1021/jp802621w CCC: $40.75 2008 American Chemical SocietyPublished on Web 10/09/2008
THM) model aromatic molecules with a 3-fold symmetry. Bysingle crystal neutron diffraction at 15 K, very accuratestructures for hydrogeneous tribromo-(TBM)18 and triiodo-mesitylenes (TIM)19 have been obtained. Because of a phasechange at 146 K, trichloro-mesitylene (TCM)26 has been studiedas a deuterated powder. For the three materials, below 140 K,the stable crystalline phase is triclinic, space group P1j,multiplicity Z ) 2. As expected, DFT calculations have foundthat the lowest energy conformation for isolated THM moleculesmaintains the 3-fold symmetry, C3h. Nevertheless, in the crystalstate, tunneling neutron spectroscopy has shown that the threemethyl groups of a THM molecule are tunneling at differentfrequencies;13,14,16,17 this fact indicates that their hinderingpotentials are different because they are located at nonequivalentpoints in the triclinic cell. The following question arises: howhas the molecular conformation been modified by the intermo-lecular interactions? A first answer is given by comparisonbetween the conformation computed for an isolated moleculeand that obtained by neutron diffraction at a sufficiently lowtemperature, say below 15 K. Reasonable agreement has beenobtained for the perhydrogenated TBM18 and the perdeuteratedTCM,26 and several differences were found in the case of theperhydrogenated TIM.19 The appropriateness of using theconformation computed for an isolated molecule for calculationsof the spectroscopic properties in the crystal state has to beestablished. Low frequencies must be particularly examined withthe possibilities to calculate Me torsion frequencies and tun-neling splitting. In a recent paper relevant to these materials,27
quantum chemistry calculations using the periodic DFT codesimplemented in CASTEP and VASP were used to analyze theTHM tunneling results. The agreement found by comparing thecalculated tunneling splittings and the experiment values wasnot fully satisfactory. It appears that the main origin of thisfailure is that the geometry relaxation of the molecule duringthe methyl rotation is not taken into account in the periodiccodes used, leading to too high hindering potentials. Moreover,in the same calculations, it is necessary to impose the experi-mental cell constants because the calculations give an unphysicalexpansion because of the absence of dispersive interactions inthe DFT-GGA approximation.
In this paper, we present a study of TIM internal modes,comparing the results of spectroscopic experiments done byusing crystals (infrared, Raman, and INS) and DFT studies ofisolated molecules. Among the three THM, TIM has beenchosen for two reasons: first, the methyl tunneling splittings(14, 25, and 89 µeV at 4.2 K) are larger than those of TBM orTCM,13,14 indicating lower hindering potentials, and second, inthis material, the methyl conformations are highly perturbed inthe crystal state.19 Therefore, this material is a good probe fortesting the accuracy of models and calculations used for theinterpretation of spectroscopic properties measured with singlecrystals. For an initial comparison, the normal modes ofvibration of benzene (Bz), 1,3,5-triiodobenzene (TIBz), andmesitylene (Mes or 1,3,5-trimethylbenzene) have been computedat the same level of precision. This gives confidence in thefunctional and basis set used in the DFT study of the differentpossible conformations of TIM molecule to be compared withthe experimental one19,27,28,31 and then to ratify the comparisonbetween computed and observed vibration spectra.
2. Reasons for our Choice of the MPW1PW91 Functionaland LanL2DZ(d,p) Basis Set
2.1. About Previous Quantum Mechanical Calculations(QMC) of the Conformation and Spectroscopic Properties
of Aromatic Molecules. Already in the seventies, QMC wereable to describe the geometry of benzene accurately, givingresults differing by only about 1% from those found by neutrondiffraction, for example, distances C-C ) 1.393 Å and C-H) 1.086 Å. Because QMC methods now give a still betterdescription of the molecular geometries, they also may be usedwith confidence for the calculation of the dynamical propertiesof the molecules. In the first step of such calculations, it isassumed that all the motions are described within the harmonicapproximation. Undoubtedly this is much more questionable formotions involving bonds with light atoms such as C-H in amethyl group than for those involving carbon-halogen bonds.In consequence, for a valid comparison between the computedfrequencies and the experimental ones, one difficulty is theevaluation of the effects due to the variation of the environ-mental parameters. In gases, all the internal modes of vibrationare characterized by a broadband with a fine structure due tothe fast motions of the molecular frame onto which issuperimposed the rotation of lighter tops such as methyl groups.In liquids and solids, the lines are broadened and even displacedby the intermolecular interactions. To show and then to minimizethe broadening effects, we have taken spectra at 293 K and alsoat very low temperatures, generally 4 K (except one infraredspectrum).
Already at the beginning of the 80s, the best ab initio forcefields derived from HF calculations (by using, for example, the4-21 basis set) were able to give good geometrical parameters,for example, C-C ) 1.3845 Å and C-H ) 1.0721 Å forbenzene,29 but the computed frequencies were systematicallylarger than the experimental ones, often by more than 15%. Thisled scientists4-11 and in particular Pulay’s group to proposescaling factors adapted to different types of motion, forexample,9
Diagonal constants (mdyn/Å): C-H stretching, 0.863 C-C;stretching, 0.919In-plane deformations (mdyn/rad): C-H wagging, 0.739Coupling constants (mdyn ·Å/rad2): C-C-C-C torsion, 0.690;ring torsion, 0.768
From this, they concluded that “this is partly due to limitationsin the HF method itself, i.e., the neglect of electron correlationsand basis set truncations and, to a lesser extent, to anharmo-nicity.” These limitations led to the use of DFT methods whichtake into account electron correlation effects. In 1996, Scottand Radom,10 by comparing the computed harmonic vibrationfrequencies for a set of 122 small molecules, concluded thatseveral hybrid HF-DFT functionals were capable of providingresults of a quality similar to that of results of high-level abinitio methods more easily and in a cheaper way. B3LYP andB3-PW91 often give the best overall agreement between theoryand experiment, the scaling factors necessary for the agreementwith experiments ranging from 0.90 to 1.05. We will discussthe choice of the force-field scaling factors relative to differenttypes of molecular deformations in particular for bonds involv-ing the heavy atom iodine in TIM.
2.2. Benzene Spectrum: Comparison of the ExperimentalFrequencies and Those Computed by Using MPW1PW91with the LanL2DZ(d,p) Basis Set. We have used theMPW1PW91 functional which is a modified Perdew-Wangone, because it is well suited for non-bonded interactions andtransition-state studies and leads to results which are as reliableas B3LYP’s regarding ground-state properties. Our group hasfound18,19 that this latter functional gives more precisecarbon-bromine and carbon-iodine bond lengths than B3LYP.The use of the LanL2DZ(d,p) basis set, which is a polarized
Vibrational Spectra of Triiodomesitylene J. Phys. Chem. A, Vol. 112, No. 44, 2008 11125
double-� one (in this basis set, heavy-atom core electrons aredescribed by means of an effective core potential), was necessaryin the case of iodine atom; it is the reason why we compare theresults it gives for light atoms in benzene with those obtainedby using more extended basis sets. We started our theoreticalstudy by consideration of the vibrational spectrum of benzene,in order to check the accuracy of the theoretical model that willbe applied later to TIM. Three polarized basis sets have beenused: first, the LanL2DZ(d,p), which is the simplest, then, the6-311++G(d,p), including diffuse functions, and finally, theaugCC-PVTZ, which is the most extended one. We haveemployed the Gaussian 98 package30 for all our calculations.
The computed geometry obtained by using the MPW1-PW91functional is in very good agreement with experiment, even withthe smallest basis set. We have obtained 1.3977, 1.3900, and1.3872 Å for the C-C bond length by using the double-�, thetriple-�, and the extended basis set, respectively, and 1.0862,1.0838, and 1.0819 Å for the C-H bond length. The extensionof the basis set induces a small decrease of the bond lengths,and for the largest bonds, it gives values shorter than theexperimental ones. We have computed the frequencies of thenormal modes by using Gaussian 9830 in the harmonic ap-proximation. The results were compared to the experimentaldata. It is apparent that increasing the size of the basis does notimprove significantly the calculation of the frequencies: themean calculated values are roughly 2.8% larger than theexperimental ones, whereas the rms decreases only slightly from16.7 to 15.0 cm-1 when going from LanL2DZ(d,p) to aug-ccPVTZ. This small decrease is due to better calculation of theC-H stretching modes while the other modes are not improved.To conclude, the smallest basis set gives results as good as thoseof the largest for benzene; it is sufficient for an assignment ofthe modes even without scaling the valence force constants.Furthermore, we will show that scaling frequencies involvingthe iodine atoms is not justified, because in this case, the motionis quasi-harmonic in contrast to that of the C-H bonds. Thedetails of these calculations are given in the Appendix. [Note.In the appendix Table A, the following information is givenfor the 20 modes of benzene: type of symmetry, column A;type of motion, the experimental results, columns C, D, E. Acomparison is done with the results of our ab initio calculationsusing the MPW1PW91 functional and three different basis sets.]
3. Conformation of Triiodomesitylene: Comparison ofthe X-ray and Neutron Diffraction Determinations19,28
with the Results of the DFT Calculations
3.1. At 293 K, X-ray Diffraction Finds Nearly D3h Sym-metry for TIM, Whereas Neutron Diffraction Has Found aCs Conformation at 14 K. X-ray28,30 and neutron diffraction18,19
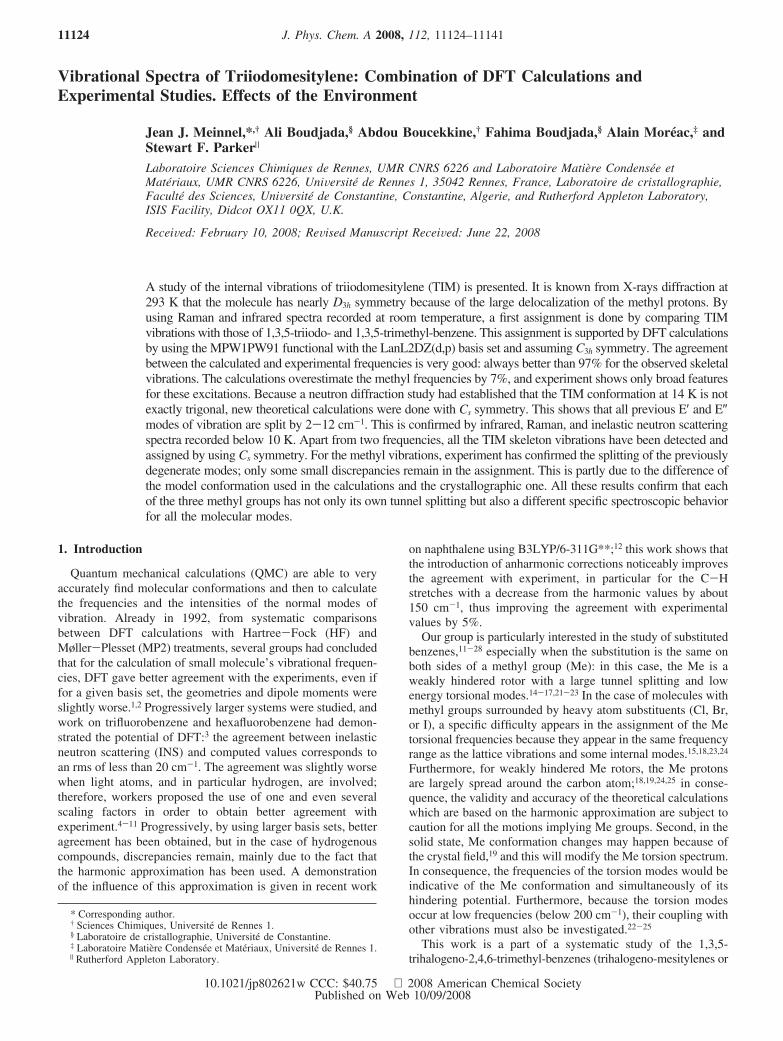
have found that the unit cells of TBM and TIM remain triclinicover the temperature range 293-14 K. In the case of TBM at14 K, the conformation established by neutron diffraction andthat calculated by DFT retain the C3h symmetry. It was thoughtthat this may also be true for TIM. In fact, at 293 K, whentaking into account the experimental uncertainties, the TIMskeleton given by X-ray diffraction has almost D3h symmetry(Figure 1), the intraring angles facing iodine and methylsubstitutions are equal to 123.8 ( 0.2° and 116.2 ( 0.2°,respectively, whereas the six C-Cm-C angles are close, allfound in the small range 121.7 ( 0.4°. From the X-raydetermination, the electronic density around the hydrogens, ineach Me group, is spreaded in a kind of torus with a radius ofnearly 1 Å. Furthermore, neutron diffraction has established thatthe proton density probability has four very broad maximadistributed symmetrically around the methyl carbon atom onthe X-ray torus; this is the result of low potentials hinderingthe methyl rotations plus a high thermal motion. Therefore, nearroom temperature, D3h symmetry will be retained for thecalculation of the frequencies of the TIM molecular vibrationsand for the selection rules governing the infrared and Ramanspectra. We will see that using such symmetry is problematicfor modeling the Me groups by ab initio methods.
By using single crystal neutron diffraction, our group hadalready done an extensive study of TIM conformation at 14,60, and 293 K.17 As for TBM,16 the proton probability densityshape inside the methyl groups changes progressively with
Figure 1. TIM conformation from single crystal X-rays diffraction,at 293 K.26 Note that all extracyclic angles on both sides of the C-Mebond are nearly equal in the range 121.7 ( 0.4°.
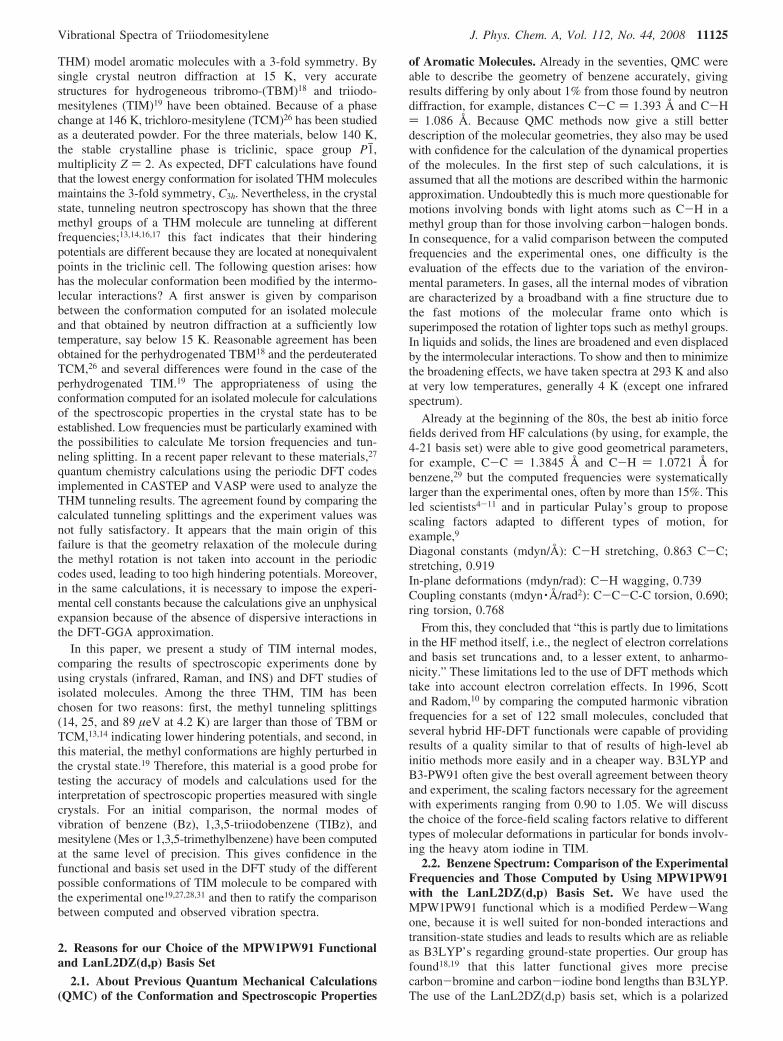
Figure 2. TIM conformation from single crystal neutron diffractionat 14 K.19 A plane of symmetry through I1C1C4C4m is visible; themolecule has a Cs rather C3h symmetry.
11126 J. Phys. Chem. A, Vol. 112, No. 44, 2008 Meinnel et al.
temperature, adding complexity to a comparison with the DFTcalculations. The position of the atomic nuclei at 14 K is givenin Figure 2; carbon and iodine are well localized, and they havesmall thermal motion. The proton probability density of the Megroups is widely spread; this is due to the fact that Me quantumrotors experience small hindering potentials. Then, an unex-pected result appeared: the trigonal symmetry is not retained.The methyl groups Me2 and Me6 have a C-H bond located inthe ring plane, but Me2 has to be rotated by 180° around theC2-Cm2 bond to occupy a position similar to that of Me6;furthermore, the C1-C2-Cm2 angle has diminished from theexpected value 123.1° to 120.4°. The third methyl group, Me4,has a medium orientation with a C-H bond pointing almostperpendicularly to the ring plane, whereas the C-C4-C4m valueshave intermediate values of 121.4(1)° and 122.0(1)°. The resultis a planar molecule with two moieties related by a mirror planeperpendicular to the hexagonal ring and containing the atomsI1, C1, C4, and C4m. It is why we have undertaken DFTcalculations using different relative orientations of the methylgroups in the initial molecular conformation before attemptingthe interpretation of the structural and spectroscopic data.
3.2. DFT Calculations Find that a Cs Conformation isNearly Isoenergetic with that of the C3h Conformation foran Isolated TIM Molecule. In a study of TBM,16 it has beenfound that the MPW1PW91 functional gives results similar tothose of B3LYP for geometry and a slightly more accurate value
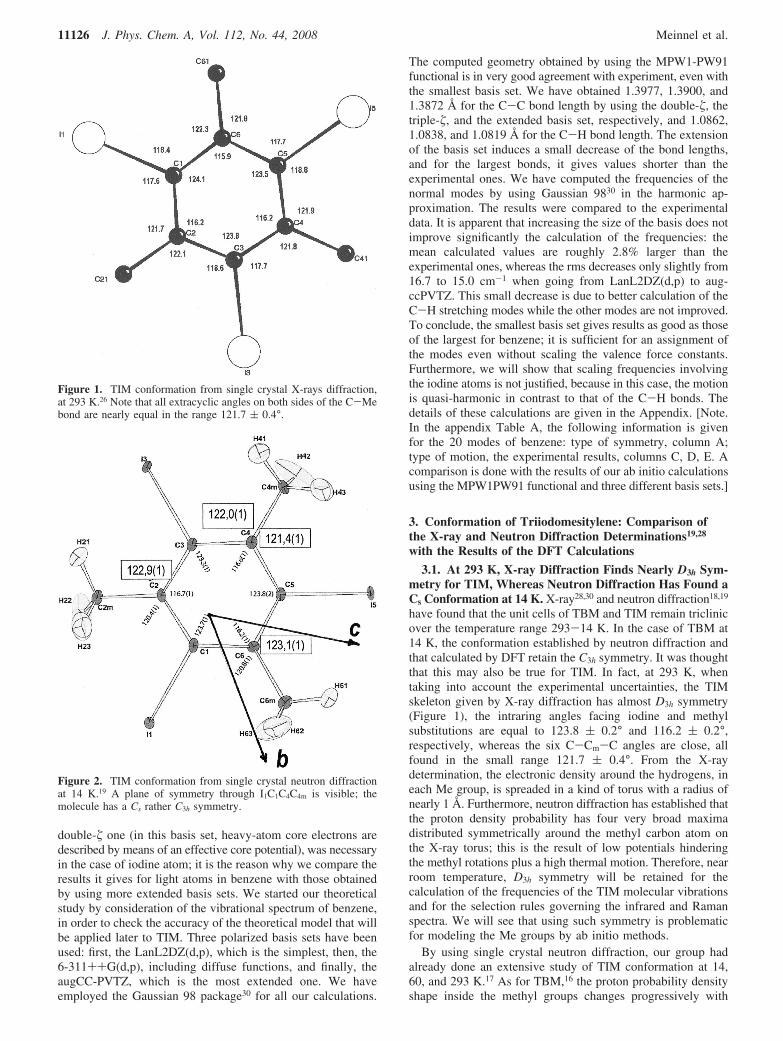
for the C-Br bond length, whatever basis set was used. Thestructural studies had confirmed for this material that thesymmetry of the isolated TBM molecule is not significantlydisturbed in the crystal. Therefore, it was decided to use alsoMPW1PW91 with the LanL2DZ(d,p) basis set, with the goalto understand the deviation from C3h symmetry found experi-mentally and also to examine the possible consequences on themolecular vibration spectra. A first calculation was done witha starting model not far from C3h symmetry including the methylgroups. The result of the refinement was a molecule with aperfect trigonal symmetry and where the three bonds C-H23,C-H43, and C-H63 remain in the ring plane at 120° from eachother and with two kinds of C-Cm-C angles, 120.39° and123.11°, Figure 3a. The molecular energy of formation (elec-tronic plus nuclear attraction and repulsion energies) is-83 960 743 cm-1, adding the zero-point vibration energy of+33 575 cm-1 giving a total of -83 927 168 cm-1. This resultpresents a problem for the comparison of theory and experiment,because it is not possible to impose D3h symmetry on the DFTcomputations with the hydrogens of the methyl groups occupy-ing specific positions. We will use the model computed withC3h symmetry for the calculation of the internal modes at 293K because it retains the approximate trigonal symmetry shownin Figure 1 even if the computed C-C-Cm angles differ byapproximately (1.4° from the mean experimental values.
Then, because the experimental studies of TIM conformationdone in the temperature range 4-300 K confirm a progressivedeformation of the C-Cm-C angles as the temperature islowered, computations with other initial orientations of the Megroups were undertaken. One of them was successful: it usedan initial model where Me2 of Figure 3a was rotated by 180°around its C-Me bond, hence lowering the symmetry to Cs
(Figure 3b). Surprisingly, the total molecular energy of formationfound was -83 927 165 cm-1 differing only by 3 cm-1 fromthe value calculated for C3h symmetry. Furthermore, thecalculation finds 123.44° for C5C6Cm6 angle and 123.16° forC3C2Cm2 angle, in very good agreement with the experimentalvalues of 123.1° and 122.9°. These two calculations explainwhy it is not surprising that intermolecular interactions in thecrystal may lead to the stabilization of a structure with nearlyCs symmetry when the thermal vibrations are minimized below20 K. On rising the temperature, the out-of-plane motions,corresponding to the majority of the low-frequency modes, leadthe methyl protons to explore more and more the spaceoutside the ring plane. This explains why the extra cyclic angles
Figure 3. TIM conformation from DFT calculations using the MPW1PW91 functional and LanL2DZ(d,p) basis set. (a) Starting model havingnearly C3h symmetry; the calculations converge to perfect C3h symmetry. (b) If the starting model has Cs symmetry, there is another stable conformationwith the same energy of formation. To achieve total agreement with Figure 2, a problem remains, the orientation of Me4.
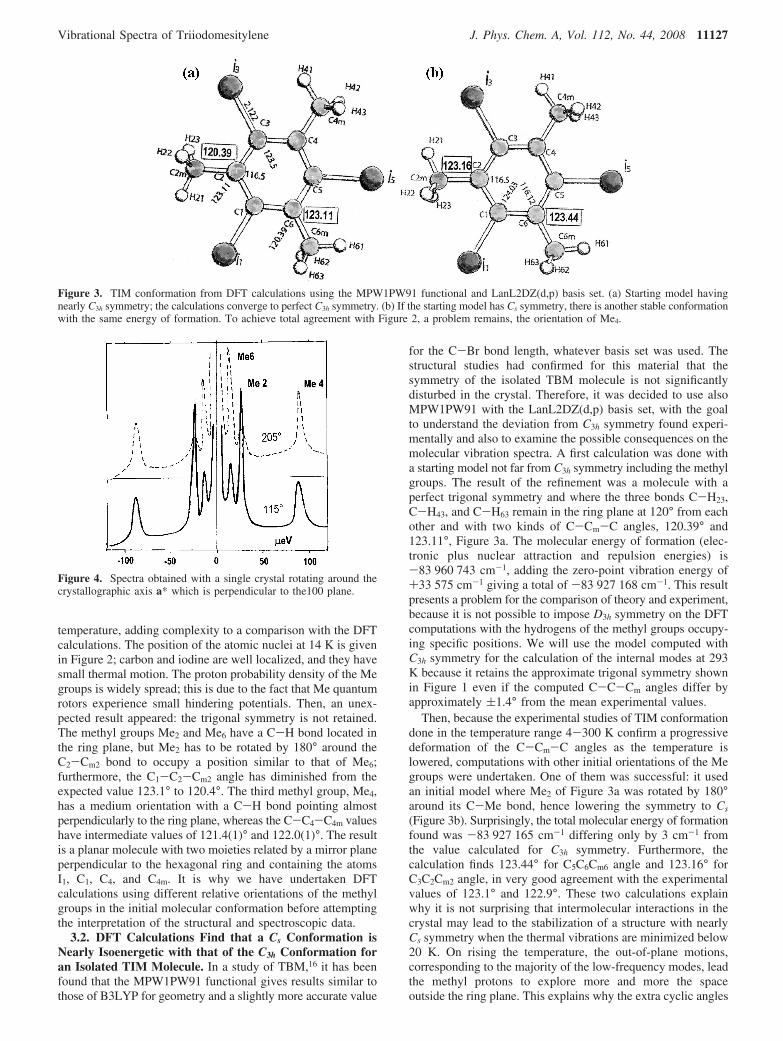
Figure 4. Spectra obtained with a single crystal rotating around thecrystallographic axis a* which is perpendicular to the100 plane.
Vibrational Spectra of Triiodomesitylene J. Phys. Chem. A, Vol. 112, No. 44, 2008 11127
around the C-Cm bond tend to the mean value 122.0(2)° (Figure1). All these results prove the absolute necessity to do structuralstudies in the same temperature range as that of the spectroscopic
measurements, even if the space group remains the same,because significant changes in the molecular conformation mayhappen between 4 and 300 K. The stable Cs structure found by
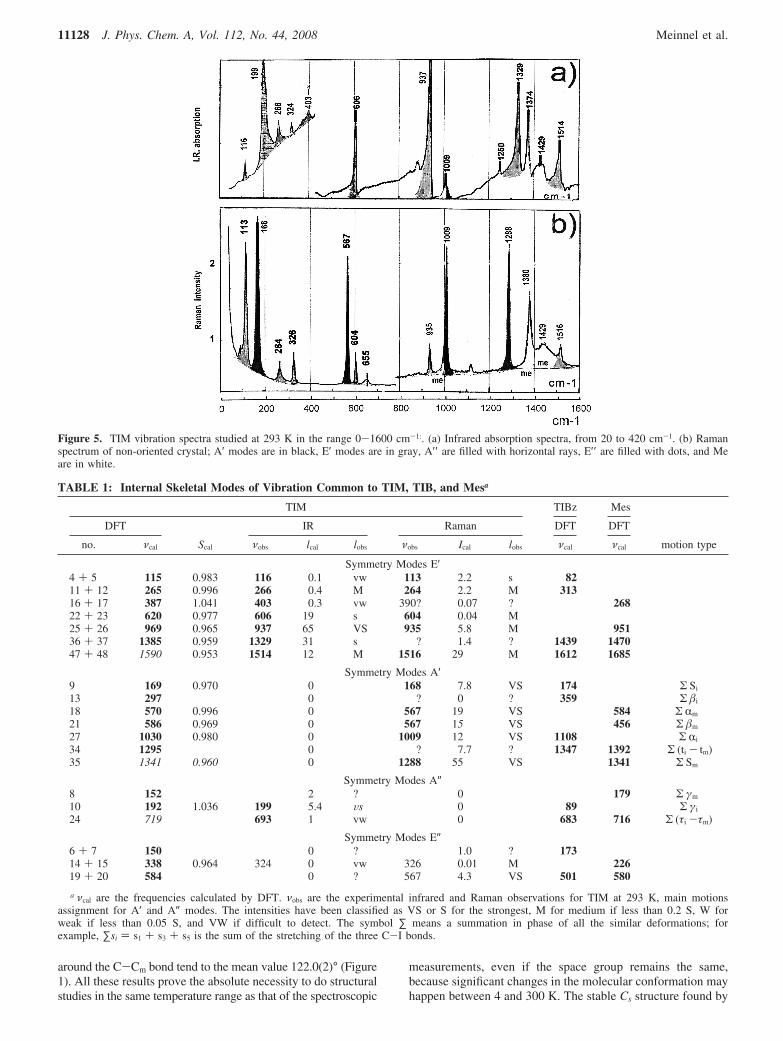
Figure 5. TIM vibration spectra studied at 293 K in the range 0-1600 cm-1:. (a) Infrared absorption spectra, from 20 to 420 cm-1. (b) Ramanspectrum of non-oriented crystal; A′ modes are in black, E′ modes are in gray, A′′ are filled with horizontal rays, E′′ are filled with dots, and Meare in white.
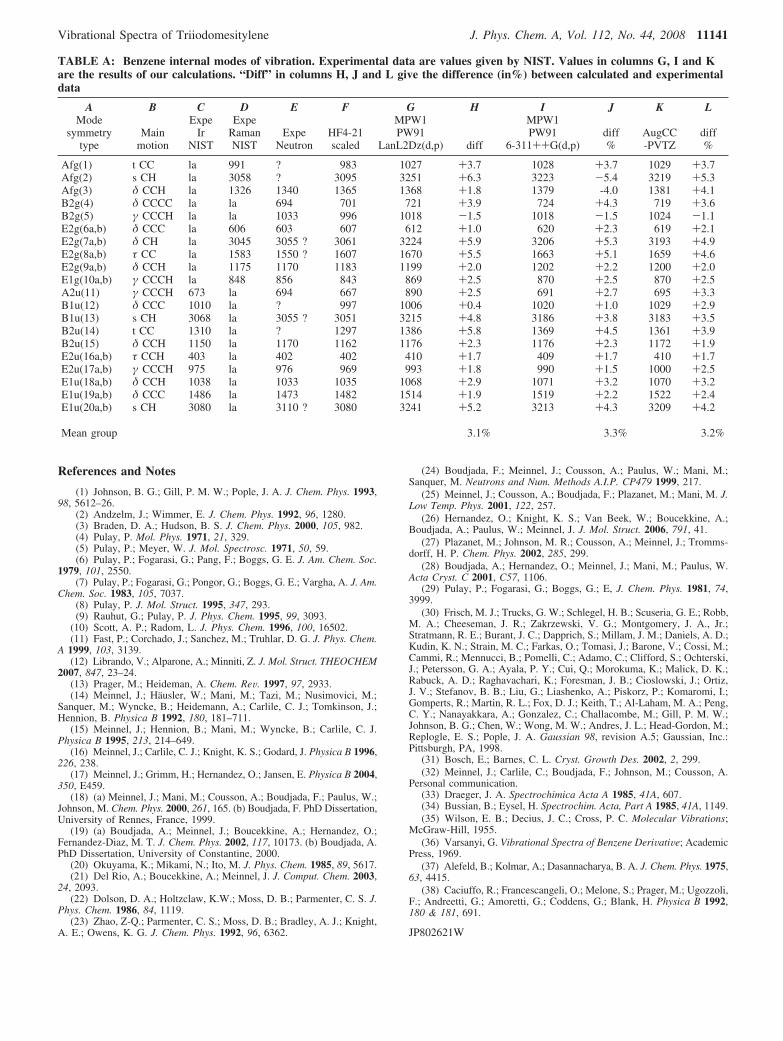
TABLE 1: Internal Skeletal Modes of Vibration Common to TIM, TIB, and Mesa
TIM TIBz Mes
DFT IR Raman DFT DFT
no. νcal Scal νobs lcal lobs νobs Ical lobs νcal νcal motion type
Symmetry Modes E′4 + 5 115 0.983 116 0.1 vw 113 2.2 s 8211 + 12 265 0.996 266 0.4 M 264 2.2 M 31316 + 17 387 1.041 403 0.3 vw 390? 0.07 ? 26822 + 23 620 0.977 606 19 s 604 0.04 M25 + 26 969 0.965 937 65 VS 935 5.8 M 95136 + 37 1385 0.959 1329 31 s ? 1.4 ? 1439 147047 + 48 1590 0.953 1514 12 M 1516 29 M 1612 1685
Symmetry Modes A′9 169 0.970 0 168 7.8 VS 174 Σ Si
13 297 0 ? 0 ? 359 Σ �i
18 570 0.996 0 567 19 VS 584 Σ Rm
21 586 0.969 0 567 15 VS 456 Σ �m
27 1030 0.980 0 1009 12 VS 1108 Σ Ri
34 1295 0 ? 7.7 ? 1347 1392 Σ (ti - tm)35 1341 0.960 0 1288 55 VS 1341 Σ Sm
Symmetry Modes A″8 152 2 ? 0 179 Σ γm
10 192 1.036 199 5.4 Vs 0 89 Σ γi
24 719 693 1 vw 0 683 716 Σ (τi -τm)
Symmetry Modes E″6 + 7 150 0 ? 1.0 ? 17314 + 15 338 0.964 324 0 vw 326 0.01 M 22619 + 20 584 0 ? 567 4.3 VS 501 580
a νcal are the frequencies calculated by DFT. νobs are the experimental infrared and Raman observations for TIM at 293 K, main motionsassignment for A′ and A″ modes. The intensities have been classified as VS or S for the strongest, M for medium if less than 0.2 S, W forweak if less than 0.05 S, and VW if difficult to detect. The symbol ∑ means a summation in phase of all the similar deformations; forexample, ∑si ) s1 + s3 + s5 is the sum of the stretching of the three C-I bonds.
11128 J. Phys. Chem. A, Vol. 112, No. 44, 2008 Meinnel et al.
DFT is very close to that found for Me2 and Me6 by neutrondiffraction. A small discrepancy remains for the conformationof Me6, and we shall have to take account of this when studyingthe spectra observed in the range 4-14 K.
3.3. Comparison of the Barrier Heights Hindering theRotation Calculated by DFT for One Methyl Group in anIsolated TIM Molecule and Those Compatible with theTunneling Energies Found by INS in the Crystal. By usingthe MPW1PW91 functional with LANL2DZ(d,p) basis set, wehave calculated the variation in formation energy for a moleculewith C3h symmetry when Me2 for example is rotated 180°around the C2-Cm2 bond, by steps of 10°.21 From this, thepotential hindering one Me group rotation may be written as
V'h )V'3 cos 3θ+V'6 cos 6θ (1)
where
V'3 ) 48 cm-1 and V'6 ) 27 cm-1 (2)
In case of Cs symmetry, the potential V″h relative to the Me4
has practically 6-fold symmetry, with components
V″3 ) 6 cm-1 and V″6 ) 48 cm-1 (3)
whereas the potentials remains equal to V″h for Me2 and Me6.Therefore, the DFT calculations on isolated molecules have
established that the potentials hindering the Me groups rotationsare very small, although each methyl group is located betweentwo big iodine atoms. Now, it is easy to calculate the tunnelsplitting obtained with such potentials by using the Schrodingerequation (eq 4):
{-B(δ2 ⁄ δθ2)+Vh(θ)}ψn,k(θ))En,kψn,k(θ)
with B ≈ 5.3 cm-1 (4)
It is found to be: 339 µeV (2.7 cm-1) for V′h and 622 µeV (5.0cm-1) for V′′h. These gaps calculated for an isolated molecule aremuch larger than those measured by INS12 in the TIM crystal. Byusing a powder of tiny crystals, it was found that the three methylgroups in the crystal give three different pairs of tunnelingexcitations of equal intensity at 15, 24, and 89 µeV (or 0.12, 0.19,and 0.72 cm-1) indicating medium hindering potentials. The factthat the three different Me groups have different tunneling gaps
demonstrates that differences in local environment in the tricliniccell induce not only differences in the rotation hindering potentialsbut also in the Me conformations (Figure 2). By using a singlecrystal on the backscattering spectrometer IRIS at RAL, it waspossible to assign each excitation to a specific methyl group withinthe crystal,32 as already done for TBM16 and TCM.30 Figure 4shows two spectra obtained with a single crystal rotating aroundthe crystallographic axis a* which is perpendicular to the100 plane(bc plane in Figure 2). The wave vectors k and k′ of the incomingand scattered neutrons were roughly in the bc plane, as themomentum transfer Q ) k - k′. By analyzing the intensity ofscattered neutron on a single detector corresponding to neutronswith Q ≈ 1 Å, it was found for Me2 that tunneling intensity ismaximum when Q was in the plane containing H21, H22, and H23
(reference 115°), and it was minimum at 90° from this orientation(reference 205°). Me4 and Me6 have the same behavior but afterrotations of 60 and 120°, respectively. Such experiments coupledwith the determination of the crystal structure by neutron diffractionestablish that there is no statistic disorder in the orientation of theMe groups in a single crystal below 293 K. Figure 2 describesunambiguously the conformation and the position of Me2, Me4,and Me6 in a single crystal. Knowing these results, we decided toexamine the consequences on other spectroscopic properties, thefact that TIM molecules change from a nearly D3h to a Cs
conformation, as the temperature varies from 293 to 4 K. In Section5, we will show that in the case of Me4, for example, by usinginfrared, Raman, and INS data and assignment of internal, lattice,and excited Me librational modes, the barrier in the crystal couldbe estimated to be V′h ) (140 cos 3θ + 94 cos(6θ - 150°)) cm-1;it is about three times larger than the barrier calculated for anisolated molecule. This shows the importance of the Van der Waalsinteractions in the crystal for a precise description of the conforma-tion of a specific Me group in relation with its environment. Is italso important for all other molecular vibrations?
4. Experimental Conditions Used for Recording TIMSpectra
4.1. Experiments Done at 293 K. In the range 20-3500cm-1, a nonoriented crystal Raman spectrum was recorded byusing a triple grating spectrometer; the source was the greenline from an argon laser, resolution 1.5 cm-1. FTIR spectra were
TABLE 2: Assignment of the Methyl Modes of Vibration in TIM and Mes: Comparison of the DFT Calculations with Ramanand Infrared Observations
TIM Mes
DFT IR Raman DFT Exp
sym no. νcal νobs Ical Iobs νobs Ical Iobs νcal νobs main motion type
A″ 1 46lattice
0.04 ?lattice
0 - 40.0 ?φ″
E″ 2 + 3 45 0 - 1.0 ? 40.6 ?A′ 33 1055 1009? 0
W
1009 0,7
M
1035 998 F′E′ 28-29 1043 1009 10 1009 0,8 1036 998A″ 30 1044 1009 5 1009? 0 1063 1048 F″E″ 31 + 32 1051 1009? 0 1009 1.2 1060 1039A′ 40 1424 1374? 0
S1380 26
M1427 1380 θ′
E′ 39-38 1420 1374 54 1380 20 1415 1380A′ 43 1486 1429? 0 - 1429 3,3
B
1499 - η′E′ 41-42 1481 1429 84 B 1429 14 1527 1480A″ 46 1487 1429 34 W 1429? 0 1490 1448 η″E″ 44 + 45 1487 1429? 0 - 1429 20 1491 1447A′ 51 3090 2907? 0
W2914 453
VS3076 2913
sS′hE′ 49-50 3089 2907 18 2914 40 3075 2920A″ 54 3163 2942 11
S? 0 ? 3150 2949
sS″hE″ 52 + 53 3163 2942 0 ? 162 ? 3150 2949A′ 55 3212 2997? 0
S3015 39
VW3175 3000
aS′hE′ 57-56 3213 2297 18 - 40 3175 2951
Vibrational Spectra of Triiodomesitylene J. Phys. Chem. A, Vol. 112, No. 44, 2008 11129
recorded from 10 to 450 cm-1 with a Bruker 980 at 2 cm-1
resolution, by using a 2 mm thick TIM compressed powderpellet, and at 3 cm-1 resolution for the 500-4000 cm-1 range.In the range 420-3500 cm-1, a pellet containing 20 mg TIMin KBr was used.
4.2. Experimental Conditions at 4 or 6 K. In the far-infrared range 10-450 cm-1, the samples studied were twoplatelets of pressed powder, thickness 1 and 2.5 mm. A gratingspectrometer with a globar source was used, and its resolutionwas 3-5 cm-1. To obtain the Raman spectra, the red line of atitanium sapphire laser, λ ) 747.77 nm, was used with a triplegrating spectrometer, and the resolution was 2.4 cm-1. Twosingle crystals were used: crystal 1 was cut with faces parallelto the crystallographic bc plane, oriented in such a manner thatthe incident light comes normally to one of these crystal faces,the polarization vector of the light lying nearly in the molecularplane and so exciting the ip vibrations, and crystal 2 was orientedwith a natural face perpendicular to the bc plane, the polarizationvector pointing roughly in the a* direction and then excitingpreferentially the op vibrations. The incident light comes alwaysnormally to a crystal face and the spectrometer analyzed thelight backscattered at 180°. The INS spectra were recorded atISIS on the TFXA spectrometer (now superseded by TOSCA)by using first powdered samples and then a single crystal of 12× 4 × 3 mm3 rotated about the a* direction. The samples wererefrigerated by a flow of cold helium in an orange cryostat. Theapparatus line width may be estimated as 3% of the frequencymeasured; it is poorer than for the Raman and infrared spectra,in particular above 600 cm-1. It would be illusory to think todetect a splitting with neutrons for frequencies above 300 cm-1.Even though the amount of sample was much smaller with thesingle crystal, the spectra below 200 cm-1 were better resolvedthan with the powder sample.
5. Assignment of the Vibrational Spectra of TIM at 293K by Assuming C3h Symmetry: Comparison with TIBzand Mes
5.1. Position of This Work Relative to the PresentKnowledge on Polysubstituted Benzenes. A tremendousamount of works has been devoted to the spectroscopy ofpolysubstituted benzenes; among them, we will mention twoextensive papers published in 1985: one comparing spectro-scopic results on 12 polymethyl-benzenes33 and one studyingsix chloromethylbenzenes HClMB.34 In these studies, the
experimental spectra were assigned by using normal coordinatecalculations in order to determine a 46-parameter modifiedvalence force field. A similar treatment was carried out in ourlaboratory for tribromo and triiodomesitylene,19,24 but it hasshown a poorer accuracy than that obtained with quantumchemistry programs. A more recent paper on sym-C6F3H3 andC6F6
3 has presented DFT calculations with five different basissets and Raman, infrared, and INS spectra; the overall rmscalculation/experiment is close to 30 cm-1 and better than 20cm-1 for frequencies below 1200 cm-1, demonstrating the highquality of the theoretical predictions for aromatic molecules.As presented in Section 2, we have found a similar accuracywhen using the MPW1PW91 functional with the LanL2DZ(d,p)basis set in our DFT isolated molecules calculations of benzene;in consequence, we have used the same functional in order toassign the TIM spectra. In parallel, we have done the same kindof calculations for two other molecules with trigonal symmetry:triiodobenzene (TIBz) and mesitylene (Mes), the skeletons ofwhich are the same as that of TIM. The computations were doneby imposing D3h symmetry for TIBz and C3h symmetry for Mesor TIM. For a cyclic C6(X3,Y3) system, where X and Y areatoms (or bulk entities such as CH3), there are 30 excitations,that is, 20 modes: 7A′ + 3A″ + 7E′ + 3E″ (the latter tworepresentations are doubly degenerate). Below 150 cm-1, 6Nlattice modes are predicted, N being the number of moleculesin the unit cell. In this frequency range, caution is required todistinguish between lattice and internal modes. In TIM, themethyl group modes may be regarded as localized and affectvery few of the skeleton vibrations; 27 additional excitationsare created by the nine hydrogen atoms of the methyl groups.Of these, 24 are located above 900 cm-1: 5A′ + 3A″ + 5E′ +3E″ modes. The remaining modes (1A″ and 1E″) correspondto the torsions of the methyl groups that are always locatedbelow 200 cm-1. As a conclusion of the assignment of theHCIMBz spectra,34 the authors had noticed that “the internalstretching, bending and rocking modes of the methyl groupsshow an extraordinary stability through the series,” and it wasadded that “methyl C-H bonds are stretching around 2900cm-1, asymmetric bending appears near 1445 cm-1 and sym-metric ones near 1379 cm-1, rocking motions have a frequencynear 1064 cm-1 for in plane modes and near 1000 cm-1 for outof plane modes.” This will also be verified for C6I3(CH3)3.
5.2. Assignment of the TIM Modes Involving the Frameand Heavy Atoms Carbon and Iodine: Comparison with
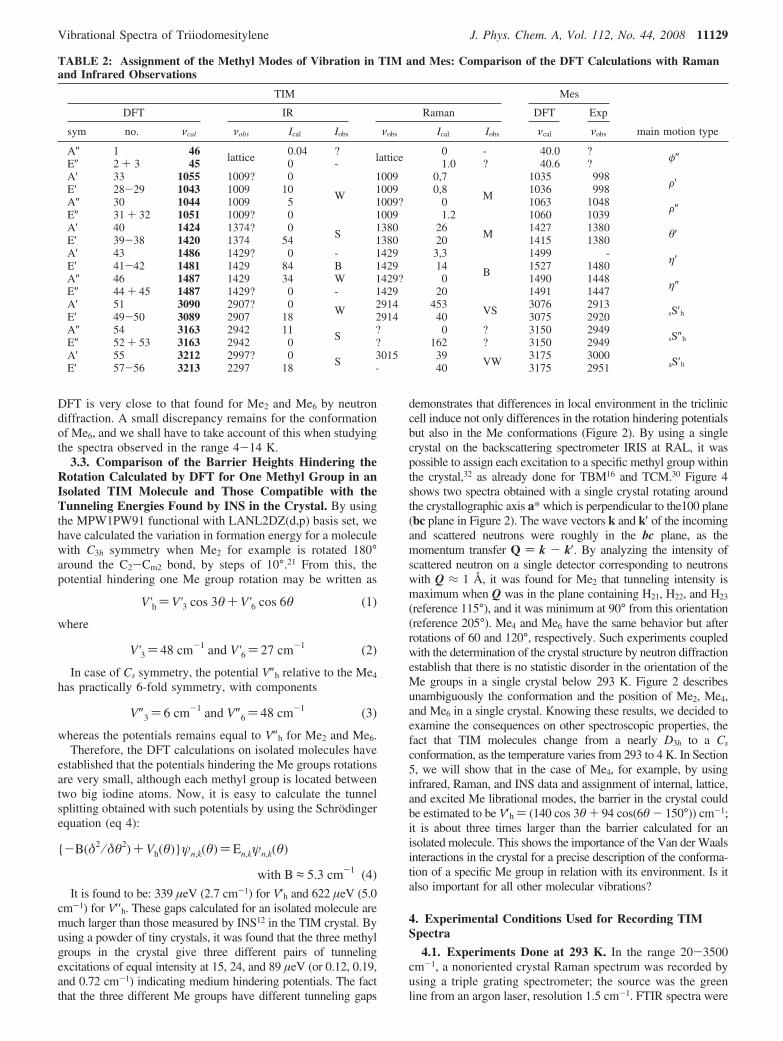
Figure 6. Stretching modes of TIM methyl groups at 293 K. (a) Transmission infrared spectrum. (b) Raman spectrum.
11130 J. Phys. Chem. A, Vol. 112, No. 44, 2008 Meinnel et al.
TIBz and Mes. Figure 5 presents the infrared and Ramanspectra recorded at 293 K and listed in Table 1. As expectedfor methyl groups, broad excitations are observed in the tworanges 1000-1050 and 1350-1450 cm-1; it is the reason whywe will present separately the 27 modes of the methyl groupsafter the study of the 30 skeleton modes in order to examinemore easily the ranges where several kinds of excitation overlap.The modes involving deformations of the frame, that is, motionsof the ring and its heavy substituent (iodine atoms and carbonmethyl groups), all have frequencies below 1800 cm-1. For amolecule with C3h symmetry, A′ modes are only Raman activeand polarized, E′ modes are infrared and Raman (depolarizedlines) active, A″ modes are only infrared active, and E″ modesare only Raman active (depolarized lines).
5.3.1. In-Plane Vibrations: Assignment of Modes A′ andE′. A first comparison of the spectra in Figure 5a,b allows theassignment as E′ modes of five strong excitations visible atalmost the same frequency in the infrared and Raman spectra.They are located at 113, 264, 604, 935, and 1516 cm-1 (Raman)and at 116, 266, 606, 937, and 1514 cm-1 (infrared). Theconcordance is quasi-perfect when taking into account the
uncertainty in peak location and in calibration of the instruments.As for the two other E′ modes, the strong infrared absorptionline observed at 1329 cm-1 has all the characteristics for beingthe excitation computed at 1385 cm-1 as intense in the infraredspectrum but weak in the Raman spectrum. The seventh E′ modecalculated at 395 cm-1 is probably the broad and weak infraredabsorption seen around 403 cm-1. For these seven vibrations,the sequence of predicted infrared and Raman frequencies andintensities is well respected, and the calculated scaling factor(ratio νo/νc) lies between 0.95 and 1.04, giving confidence inthe calculations. The Raman spectrum shows four other intenseexcitations at 168, 567, 1009, and 1288 cm-1. These excitationsare compatible with intense A′ modes computed respectivelyat 169, 570 (and jointly 586), 1030, and 1341 cm-1. The A′excitation calculated at 297 cm-1 as very weak has not beendetected, and an ambiguity remains for the seventh A′ modecalculated at 1295 cm-1 in the Raman spectrum. Spectrarecorded at lower temperature will give more confidence in thisassignment because broad lines (such as that pointed at 567cm-1) should become much narrower and split into severalcomponents. Table 1 presents a comparison of the calculatedand observed frequencies for equivalent motions in TIB andMes; this allows a tentative assignment of the main skeletalmotions.
5.3.2. Comparison of the Atomic Displacements for theTIM A′ Modes with Those Observed for TIB and Mes. Todescribe the atomic displacements, we have used internalcoordinates similar to those defined by Wilson35 and Varsanyi36
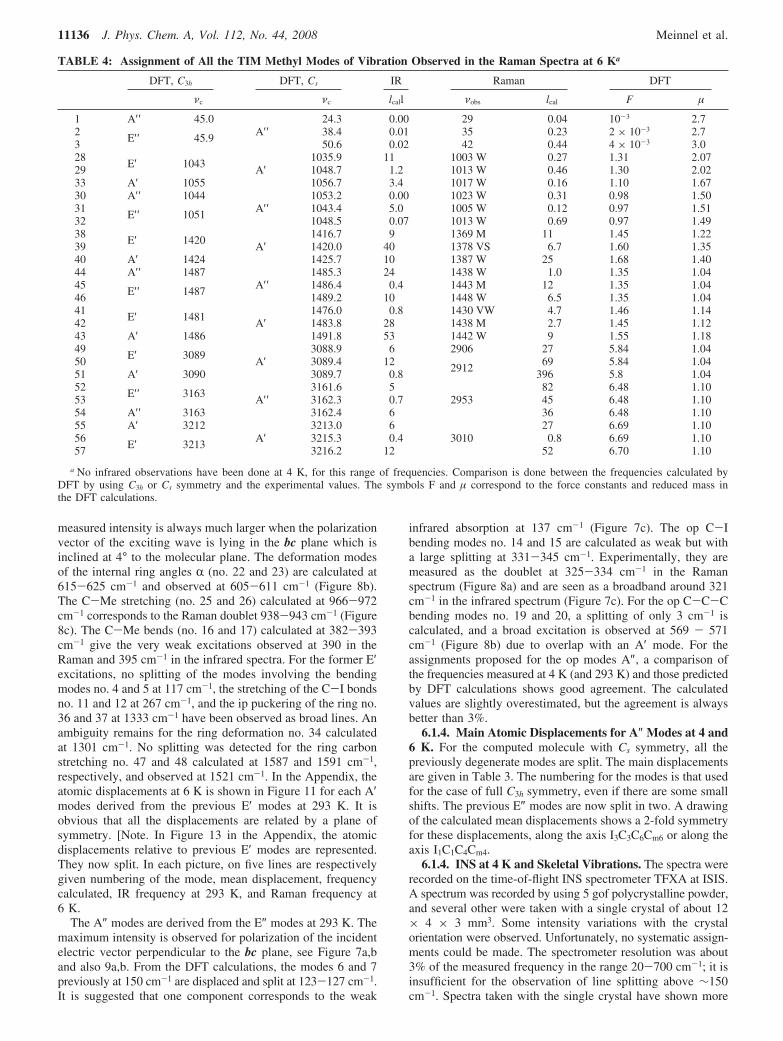
in their studies of benzene and its substituted derivatives. Bondstretches are denoted si, sm, and st for the C-I, C-CH3, andring C-C stretches, respectively. The increase of the anglebetween valence bonds are RI and Rm for the C-C-C anglesfacing an iodine or a methyl group. For the bending of the C-Iand C-CH3 bonds, we used the modified coordinates of Wilson,�i and �m, which are the difference between the two extra-ringangles on the right and left sides of the bond. For the A′ modes,for similar types of motion, the computed (and observed)frequencies of TIM and TIB (or Mes depending on the motion)are very close and characteristic of specific main distortions.Stretching modes are located near 170 cm-1 for C-I in TIMas in TIB and at 1341 cm-1 for C-CH3 in TIM as in Mes; theKekule deformation of the ring due to alternate motions of theC-C bonds are in the range 1300-1400 cm-1, and the ringbreathing is around 570 cm-1 for the intraring angle facing amethyl group and between 1000-1100 cm-1 if facing an iodine.The bending modes are found around 300-350 cm-1 for C-Ibonds and between 450-600 cm-1 for C-CH3. Becausearomatic C-H bonds are not present in TIM, we do notcomment on similar correlations for these bonds in TIB andMes. The assignments of Table 1 are motions in C3h symmetry;this symmetry will be very slightly disturbed when the molecularconformation is modified because of changes in the relativeorientation of the Me groups at 4 K (Figure 2). This will bediscussed in Section 6 in particular for E′ modes. [Note. InFigure 11, in the Appendix, are represented the atomic displace-ments relative to similar A′ modes in TIM, TIB, and Mes. Ineach picture, five lines are respectively given: numbering ofthe mode, mean displacement, frequency calculated, Ramanfrequency at 293 K, and Raman frequency at 6 K. Such adrawing will be done for E′ modes in Figure 13, after discussionof low-temperature data in Section 6.
5.3.3. Out-of-Plane Vibrations: Assignment of A″ and E″Modes, Main Atomic Displacements Involved. The part ofthe potential energy corresponding to the out-of-plane (o.p.)
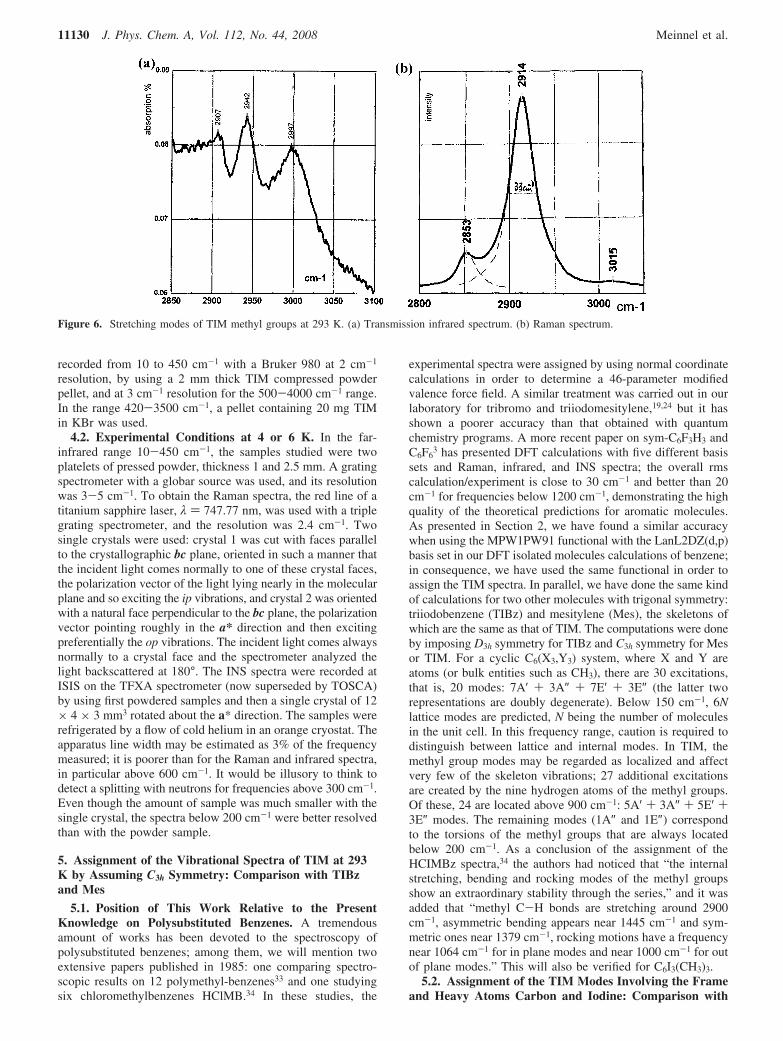
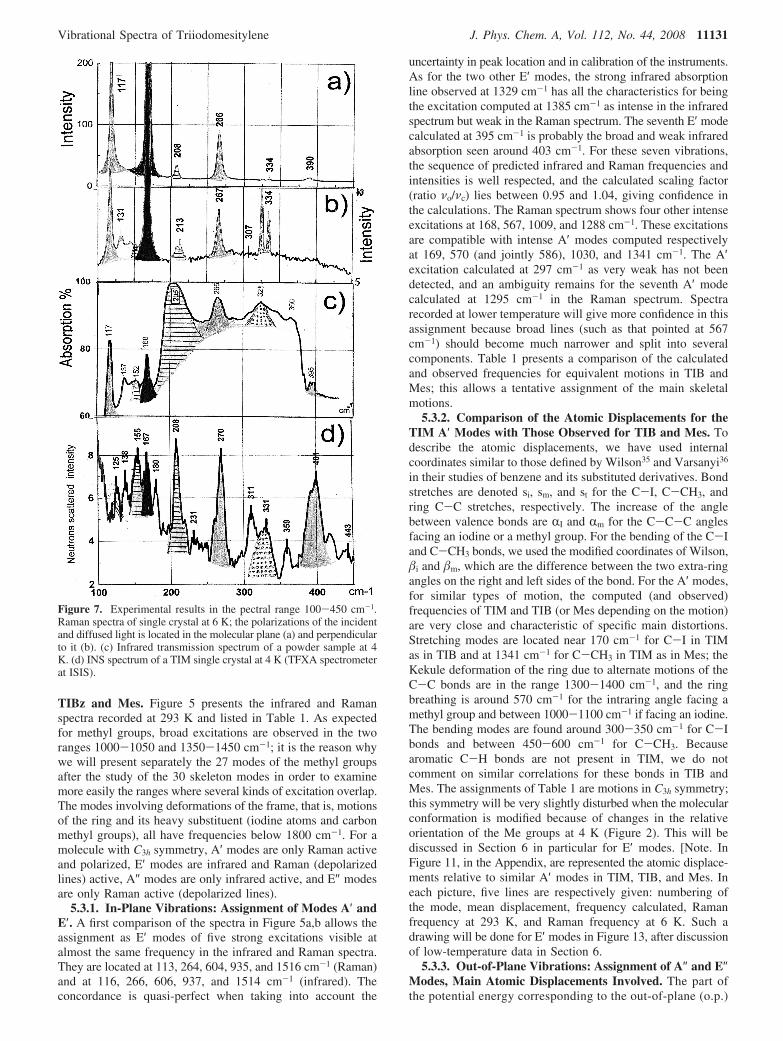
Figure 7. Experimental results in the pectral range 100-450 cm-1.Raman spectra of single crystal at 6 K; the polarizations of the incidentand diffused light is located in the molecular plane (a) and perpendicularto it (b). (c) Infrared transmission spectrum of a powder sample at 4K. (d) INS spectrum of a TIM single crystal at 4 K (TFXA spectrometerat ISIS).
Vibrational Spectra of Triiodomesitylene J. Phys. Chem. A, Vol. 112, No. 44, 2008 11131
framework motions may be associated with three types ofangular coordinates: γI for C-C-Ci o.p. bending, γm forC-C-Cm o.p. bending, and τc for C-C-C-C ring puckering;these give rise to three A″ and three E″ modes. For the threedifferent molecules involved in this study, in the case ofperfect C3h molecular symmetry, the A″ modes are predictedas only infrared active, whereas E″ modes are Raman activeand depolarized. Examination of the results of our DFTcalculations in Table 1 reveals the difficulty in assigning the293 K spectroscopic data. Many modes are predicted to beof low intensity or inactive; therefore, they are very difficultto detect because of line broadening. In the spectra of Figure5, there are only three features among the six expected forwhich we may propose an assignment compatible with thecalculations. The broad and very intense absorption linelocated around 200 cm-1 in the infrared spectrum is assignedto the A″ mode calculated to be intense at 192 cm-1. TheRaman line at 326 cm-1 corresponds to an E″ mode calculatedat 338 cm-1; unexpectedly, it is also weakly active in the
infrared spectrum, probably because the molecule does nothave the perfect C3h symmetry used in the calculations.Lastly, by inspecting the intensities computed for the E″modes, a new ambiguity arises: an intense Raman line iscalculated at 584 cm-1 not far from the broad line seen at567 cm-1 and which may also correspond to two A′excitations calculated at 570 and 586 cm-1. The A″ modesno. 8 and 24 and the degenerate E″ no. 6 and 7 calculated at152, 719, and 150 cm-1, respectively, have not been observed.[Note. In Figure 12, in the Appendix, are represented theatomic displacements relative to similar A″ modes in TIM,TIBz, and Mes.
To summarize, for the in-plane vibrations, all seven E′excitations expected have been detected and assigned. Only fourA′ excitations have been detected unambiguously among theseven calculated. It is the comparison with TIBz and Mes spectrathat has allowed to propose likely assignments. As for the out-of-plane vibrations, only three out of six have been detected;
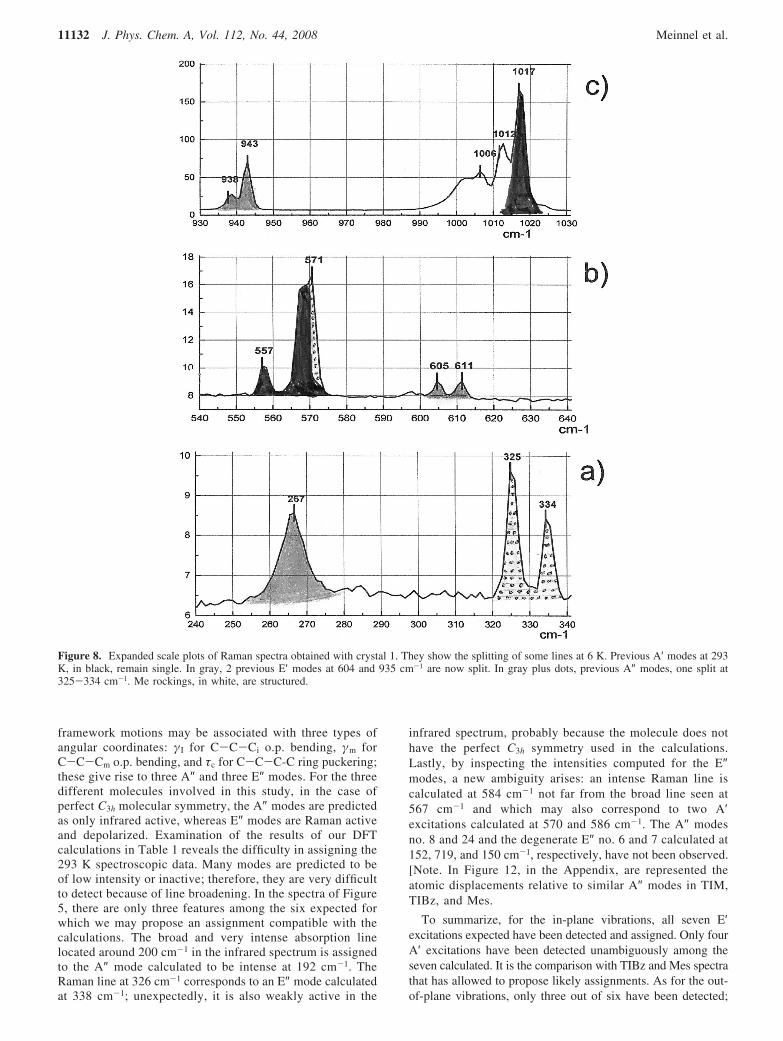
Figure 8. Expanded scale plots of Raman spectra obtained with crystal 1. They show the splitting of some lines at 6 K. Previous A′ modes at 293K, in black, remain single. In gray, 2 previous E′ modes at 604 and 935 cm-1 are now split. In gray plus dots, previous A″ modes, one split at325-334 cm-1. Me rockings, in white, are structured.
11132 J. Phys. Chem. A, Vol. 112, No. 44, 2008 Meinnel et al.
therefore, by counting each degenerate mode as one, only 14of the 20 excitations present have been observed unambiguously.
5.4. Assignment of the Stretching, Bending, Rocking, andTorsional Modes of the TIM Me at 293 K. To characterizeeach type of Me motion, it is necessary to give the definitionof the principal force constants. The motions are classified asip or op depending on whether the carbon atoms of the Megroups are moving in the plane of the ring or perpendicular tothe plane of the ring.Asymmetrical Cm-H stretching: ip, aS′h.Symmetrical Cm-H stretching: ip, sS′h; op, sS″h.Asymmetrical Ca-Cm-H methyl bending: ip, η′; op, η″.Symmetrical H-Cm-H methyl bending: ip, θ′.Ca-Cm-H mehtyl rocking: ip, F′; op, F″.Me rotation around Ca-Cm: op, φ″.
The frequencies of the 27 excitations calculated as specificto the TIM and Mes methyl groups (5 A′, 4 A″, 5 E′, and 4 E″
modes) are gathered in Table 2 together with the experimentalobservations. It can be seen immediately that for similar Memotions in TIM and Mes, the frequencies are nearly the same;therefore, we will comment only on the TIM spectra. In thefrequency range below 100 cm-1, the calculations predict forthe torsional modes two very weak excitations: one A″ at 46cm-1 and one E″ at 45 cm-1. As several lattice modes are alsoexpected in the same frequency range, we will defer assigningthe modes until the low-temperature data is discussed. Themethyl rocking modes are expected in the range 980-1050cm-1. In the spectra of Figure 5, there is a broad excitationaround 1009 cm-1. Its assignment is compatible with the iprocking no. 28-29 (E′) and no. 33 (A′) but also to the op modesno. 30 (A″) and no. 31+ 32 (E″), not withstanding the intenseskeletal mode A′ no. 27. The symmetric ip methyl bendingmodes calculated at 1424 (A′ no. 40) and 1420 cm-1 (E′ no. 38+ 39) may be assigned to the intense broad excitations seen at
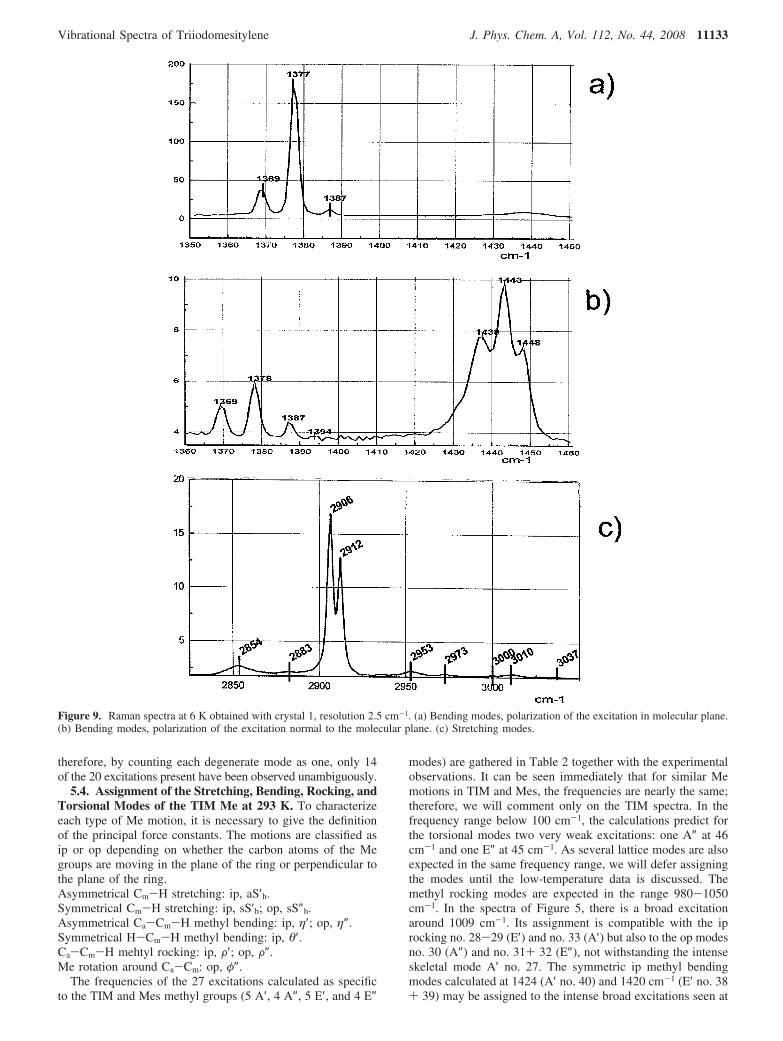
Figure 9. Raman spectra at 6 K obtained with crystal 1, resolution 2.5 cm-1. (a) Bending modes, polarization of the excitation in molecular plane.(b) Bending modes, polarization of the excitation normal to the molecular plane. (c) Stretching modes.
Vibrational Spectra of Triiodomesitylene J. Phys. Chem. A, Vol. 112, No. 44, 2008 11133
1374 cm-1 in the infrared and at 1380 cm-1 in Raman data.The asymmetric ip methyl bending modes (three ip and threeop) are calculated in the range 1481-1486 cm-1. Theycorrespond to the broad experimental features located around1429 cm-1. Nine methyl C-H stretching modes remain. Thespectra are shown in Figure 6a,b. The A′ symmetrical stretchingip no. 51 predicted at 3090 cm-1 as the most intense Ramanexcitation is seen as the Raman intense broad line (∆ν ) 33cm-1) at 2914 cm-1. The A″ symmetrical stretching op no. 54infrared active is observed at 2942 cm-1 (calculated at 3163cm-1). The asymmetric stretching modes computed at 3213cm-1 are assigned to an intense infrared absorption at 2997 cm-1
and perhaps to the weak Raman line seen around 3015 cm-1.In summary, except for the rotational modes, it is possible toassign excitations in specific parts of the spectra to each familyof methyl excitations, but at 293 K, the features are broad orweak, sometimes overlapping with framework modes. It is onlyafter examining the Raman spectra at 6 K that it will be possibleto distinguish different frequencies and to assign them tocharacteristic atomic displacements for the methyl groupsmotions.
6. Assignment of the TIM Molecular Modes by UsingSpectra Obtained at 4 or 6 K, Consequences of theMolecular Deformation Excluding C3h Symmetry
6.1.1. Study of the Modifications in Frequency and BandShape of the Framework Modes Due to the Cs Symmetry at6 K. At 293 K, the molecular conformation found by X-raydiffraction has a nearly perfect C3h symmetry. At 14 K (and byextension at 4 or 6 K), neutron diffraction has found that when
the conformation of the methyl groups is taken into account,the only symmetry element present is a plane of symmetryperpendicular to the aromatic ring, Figure 2. In the DFTcalculations, it is easy to take into account the loss of a strictC3h symmetry by a 180° rotation of the methyl Me2 around itsC-C axis (Figure 3b); the conformation found at the energyminimum cannot reproduce the experimental orientation of Me4.To obtain a stable conformation, one C-H bond in Me4 muststay in the plane of the ring and not perpendicular to this plane.Nevertheless, even if the model of Figure 3b is imperfect, itsCs symmetry gives a very good representation of the relativepositions of Me2 and Me6 and the loss of C3h symmetry. Thishas the consequence that the degenerate E′ and E″ modes (inthe C3h symmetry) now split. Figures 7, 8, and 9 showspectacularly how all Raman excitations are much narrower at6 K, being generally of the order of the instrument resolution.Several components are now well separated in what were broadpackets at room temperature. In particular, around 326, 567,606, 935, 1009, 1380, and 1429 cm-1, a splitting may beidentified for several previous E′ and E″ modes. This is incomplete agreement with the loss of symmetry detected byneutron diffraction. The intensity of the excitations in theinfrared spectrum and in the INS spectrum add strength to theassignment from the Raman data. Comparison of the Ramanspectra in the range 100-450 cm-1, Figure 7a,b, shows thatseveral in plane excitations calculated as intense have a muchhigher intensity when the polarization vector E of the excitingline stays approximately in the molecular plane (near the b cellaxis) rather than along the normal to this plane (a* crystal cellaxis): for example, 170 and 4 counts per second, respectively,
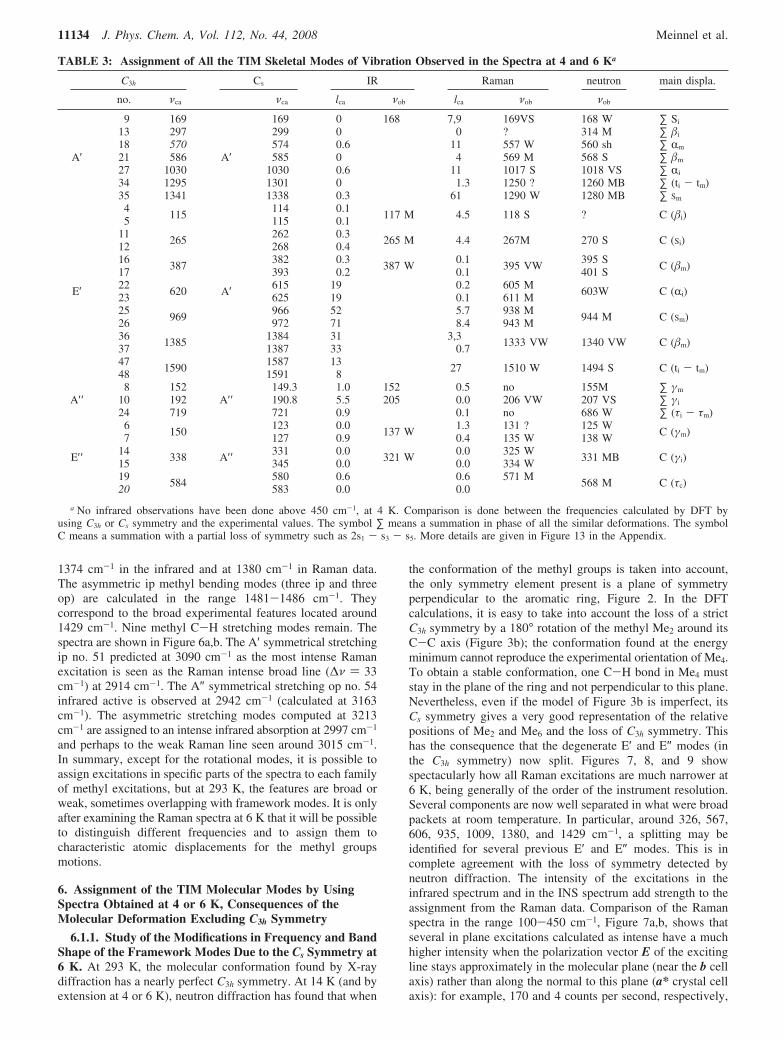
TABLE 3: Assignment of All the TIM Skeletal Modes of Vibration Observed in the Spectra at 4 and 6 Ka
C3h Cs IR Raman neutron main displa.
no. νca νca lca νob lca νob νob
A′
9 169
A′
169 0 168 7,9 169VS 168 W ∑ Si
13 297 299 0 0 ? 314 M ∑ �i
18 570 574 0.6 11 557 W 560 sh ∑ Rm
21 586 585 0 4 569 M 568 S ∑ �m
27 1030 1030 0.6 11 1017 S 1018 VS ∑ Ri
34 1295 1301 0 1.3 1250 ? 1260 MB ∑ (ti - tm)35 1341 1338 0.3 61 1290 W 1280 MB ∑ Sm
E′
4115
A′
114 0.1117 M 4.5 118 S ? C (�i)5 115 0.1
11265
262 0.3265 M 4.4 267M 270 S C (Si)12 268 0.4
16387
382 0.3387 W
0.1395 VW
395 SC (�m)
17 393 0.2 0.1 401 S22
620615 19 0.2 605 M
603W C (Ri)23 625 19 0.1 611 M25
969966 52 5.7 938 M
944 M C (Sm)26 972 71 8.4 943 M36
13851384 31 3,3
1333 VW 1340 VW C (�m)37 1387 33 0.747
15901587 13
27 1510 W 1494 S C (ti - tm)48 1591 8
A′′8 152
A′′149.3 1.0 152 0.5 no 155M ∑ γm
10 192 190.8 5.5 205 0.0 206 VW 207 VS ∑ γi
24 719 721 0.9 0.1 no 686 W ∑ (τi - τm)
E′′
6150
A′′
123 0.0137 W
1.3 131 ? 125 WC (γm)
7 127 0.9 0.4 135 W 138 W14
338331 0.0
321 W0.0 325 W
331 MB C (γi)15 345 0.0 0.0 334 W19
584580 0.6 0.6 571 M
568 M C (τc)20 583 0.0 0.0
a No infrared observations have been done above 450 cm-1, at 4 K. Comparison is done between the frequencies calculated by DFT byusing C3h or Cs symmetry and the experimental values. The symbol ∑ means a summation in phase of all the similar deformations. The symbolC means a summation with a partial loss of symmetry such as 2s1 - s3 - s5. More details are given in Figure 13 in the Appendix.
11134 J. Phys. Chem. A, Vol. 112, No. 44, 2008 Meinnel et al.
for the excitation no. 9 at 169 cm-1, in agreement with itsassignment as an ip stretching of the C-I bonds. It is theopposite for the out-of-plane vibrations which are generallycalculated as very weak in intensity and are better seen whenE is along a*, the normal to the bc plane, Figure 7b. In theinfrared spectrum, the vibration no. 10 at 205 cm-1 isparticularly intense; it is assigned to an op motion of the threeC-I bonds that gives a large change of the molecular dipolemoment. This mode is calculated as a very weak band in theRaman spectrum. It was perhaps observed as a broad and weakfeature around 210 cm-1. In the INS spectra, the most intensefeatures are observed for motions involving the protons of themethyl groups, that is, around 1020, 1380, and 1440 cm-1, butthe experimental excitations are too broad for a preciseassignment and are not given here. As for motions of the Megroups, relatively, they are be examined in Section 5.3.1.
6.1.2. Evolution of the Modes Assigned as A′ and A″ at293 K in the Spectra Recorded at 4 or 6 K. Table 3 showsthat the changes in the calculated frequencies for the A′ andA″ modes are very small when the symmetry is changed fromC3h to Cs. No changes larger than 4 cm-1 were observed whengoing from 293 to 4 K. Concerning A′ modes, instead of a single
broad signal at 567 cm-1, it is now possible to distinguish threemodes. Two of them, those at 557 and 569 cm-1, are assignedto the A′ modes no. 18 and 21, in agreement with the calculatedenergy difference of 11 cm-1. They are accompanied by an E″line at 571 cm-1, Figure 8b. By taking into account theintensities calculated for frequencies previously seen as anunresolved feature centered around 1009 cm-1 at 293 K, themost intense Raman line located at 1017 cm-1 is assigned tothe A′ mode no. 30 calculated at 1030 cm-1, Figure 8c. All theother bands around 1000 cm-1 may be assigned to Me rockingmodes. No convincing experimental candidates have beendetected for A′ modes no. 13 and 34 calculated at 297 and 1297cm-1, respectively. For the other A″ modes in the far-infrared,a weak absorption at 152 cm-1 may be assigned to mode no. 8calculated at 149 cm-1. The op bending of the C-I bonds givesan intense infrared absorption around 205 cm-1. The ippuckering of the ring, mode no. 24, calculated as weak at 721cm-1, has not been detected.
6.1.3. Shifting and Splitting of the E′ and E″ Modes at293 K and Now Assigned as Modes A′ and A″ at 4 K.Expanded scale plots of the Raman spectra, for three frequencyranges, are given in Figure 8. For the former E′ excitations, the
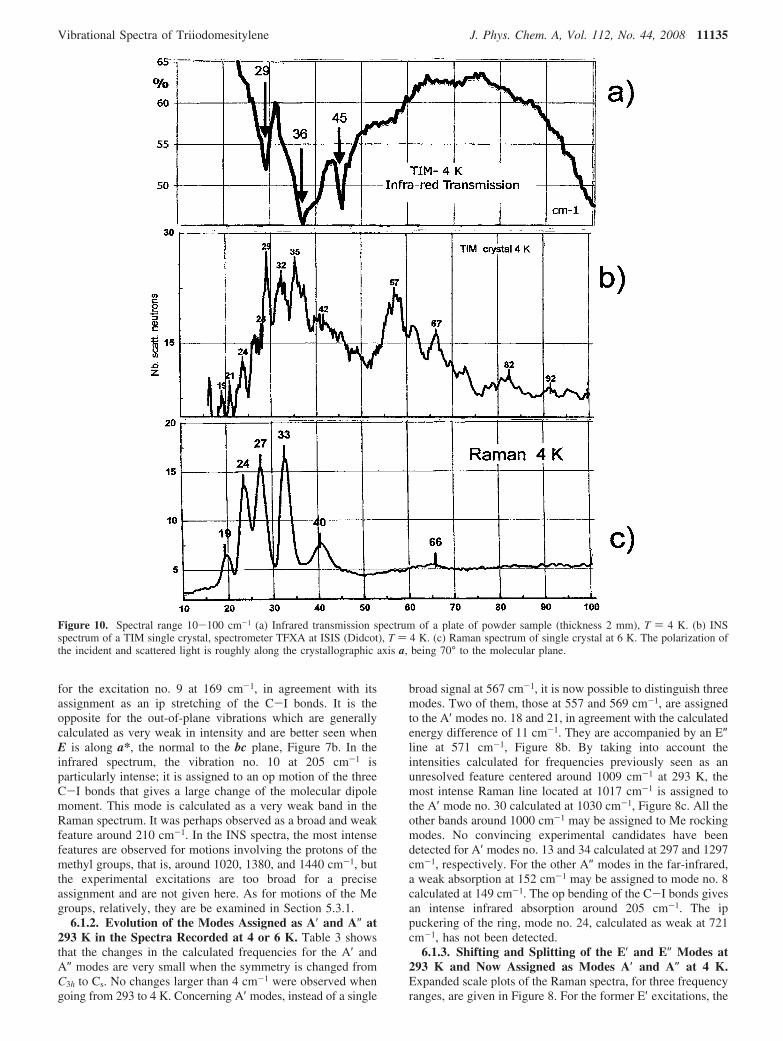
Figure 10. Spectral range 10-100 cm-1 (a) Infrared transmission spectrum of a plate of powder sample (thickness 2 mm), T ) 4 K. (b) INSspectrum of a TIM single crystal, spectrometer TFXA at ISIS (Didcot), T ) 4 K. (c) Raman spectrum of single crystal at 6 K. The polarization ofthe incident and scattered light is roughly along the crystallographic axis a, being 70° to the molecular plane.
Vibrational Spectra of Triiodomesitylene J. Phys. Chem. A, Vol. 112, No. 44, 2008 11135
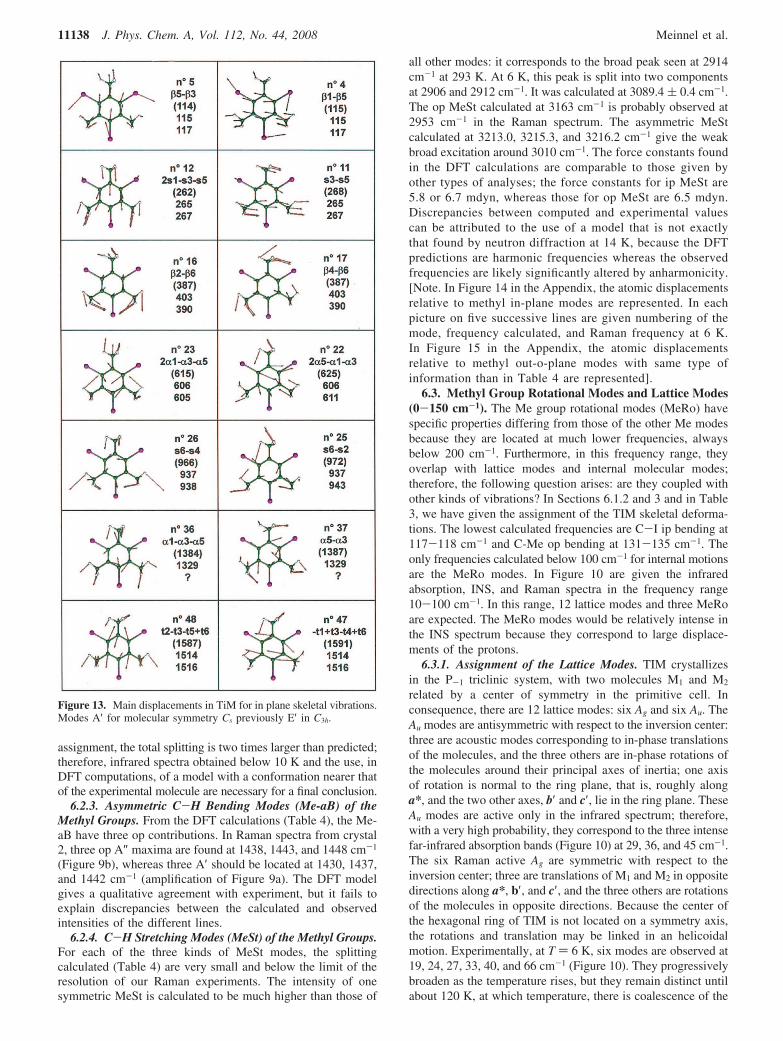
measured intensity is always much larger when the polarizationvector of the exciting wave is lying in the bc plane which isinclined at 4° to the molecular plane. The deformation modesof the internal ring angles R (no. 22 and 23) are calculated at615-625 cm-1 and observed at 605-611 cm-1 (Figure 8b).The C-Me stretching (no. 25 and 26) calculated at 966-972cm-1 corresponds to the Raman doublet 938-943 cm-1 (Figure8c). The C-Me bends (no. 16 and 17) calculated at 382-393cm-1 give the very weak excitations observed at 390 in theRaman and 395 cm-1 in the infrared spectra. For the former E′excitations, no splitting of the modes involving the bendingmodes no. 4 and 5 at 117 cm-1, the stretching of the C-I bondsno. 11 and 12 at 267 cm-1, and the ip puckering of the ring no.36 and 37 at 1333 cm-1 have been observed as broad lines. Anambiguity remains for the ring deformation no. 34 calculatedat 1301 cm-1. No splitting was detected for the ring carbonstretching no. 47 and 48 calculated at 1587 and 1591 cm-1,respectively, and observed at 1521 cm-1. In the Appendix, theatomic displacements at 6 K is shown in Figure 11 for each A′modes derived from the previous E′ modes at 293 K. It isobvious that all the displacements are related by a plane ofsymmetry. [Note. In Figure 13 in the Appendix, the atomicdisplacements relative to previous E′ modes are represented.They now split. In each picture, on five lines are respectivelygiven numbering of the mode, mean displacement, frequencycalculated, IR frequency at 293 K, and Raman frequency at6 K.
The A″ modes are derived from the E″ modes at 293 K. Themaximum intensity is observed for polarization of the incidentelectric vector perpendicular to the bc plane, see Figure 7a,band also 9a,b. From the DFT calculations, the modes 6 and 7previously at 150 cm-1 are displaced and split at 123-127 cm-1.It is suggested that one component corresponds to the weak
infrared absorption at 137 cm-1 (Figure 7c). The op C-Ibending modes no. 14 and 15 are calculated as weak but witha large splitting at 331-345 cm-1. Experimentally, they aremeasured as the doublet at 325-334 cm-1 in the Ramanspectrum (Figure 8a) and are seen as a broadband around 321cm-1 in the infrared spectrum (Figure 7c). For the op C-C-Cbending modes no. 19 and 20, a splitting of only 3 cm-1 iscalculated, and a broad excitation is observed at 569 - 571cm-1 (Figure 8b) due to overlap with an A′ mode. For theassignments proposed for the op modes A″, a comparison ofthe frequencies measured at 4 K (and 293 K) and those predictedby DFT calculations shows good agreement. The calculatedvalues are slightly overestimated, but the agreement is alwaysbetter than 3%.
6.1.4. Main Atomic Displacements for A″ Modes at 4 and6 K. For the computed molecule with Cs symmetry, all thepreviously degenerate modes are split. The main displacementsare given in Table 3. The numbering for the modes is that usedfor the case of full C3h symmetry, even if there are some smallshifts. The previous E″ modes are now split in two. A drawingof the calculated mean displacements shows a 2-fold symmetryfor these displacements, along the axis I3C3C6Cm6 or along theaxis I1C1C4Cm4.
6.1.4. INS at 4 K and Skeletal Vibrations. The spectra wererecorded on the time-of-flight INS spectrometer TFXA at ISIS.A spectrum was recorded by using 5 gof polycrystalline powder,and several other were taken with a single crystal of about 12× 4 × 3 mm3. Some intensity variations with the crystalorientation were observed. Unfortunately, no systematic assign-ments could be made. The spectrometer resolution was about3% of the measured frequency in the range 20-700 cm-1; it isinsufficient for the observation of line splitting above ∼150cm-1. Spectra taken with the single crystal have shown more
TABLE 4: Assignment of All the TIM Methyl Modes of Vibration Observed in the Raman Spectra at 6 Ka
DFT, C3h DFT, Cs IR Raman DFT
νc νc lcall νobs lcal F µ
1 A′′ 45.0A′′
24.3 0.00 29 0.04 10-3 2.72
E′′ 45.938.4 0.01 35 0.23 2 × 10⁻³ 2.7
3 50.6 0.02 42 0.44 4 × 10⁻³ 3.028
E′ 1043A′
1035.9 11 1003 W 0.27 1.31 2.0729 1048.7 1.2 1013 W 0.46 1.30 2.0233 A′ 1055 1056.7 3.4 1017 W 0.16 1.10 1.6730 A′′ 1044
A′′1053.2 0.00 1023 W 0.31 0.98 1.50
31E′′ 1051
1043.4 5.0 1005 W 0.12 0.97 1.5132 1048.5 0.07 1013 W 0.69 0.97 1.4938
E′ 1420A′
1416.7 9 1369 M 11 1.45 1.2239 1420.0 40 1378 VS 6.7 1.60 1.3540 A′ 1424 1425.7 10 1387 W 25 1.68 1.4044 A′′ 1487
A′′1485.3 24 1438 W 1.0 1.35 1.04
45E′′ 1487
1486.4 0.4 1443 M 12 1.35 1.0446 1489.2 10 1448 W 6.5 1.35 1.0441
E′ 1481A′
1476.0 0.8 1430 VW 4.7 1.46 1.1442 1483.8 28 1438 M 2.7 1.45 1.1243 A′ 1486 1491.8 53 1442 W 9 1.55 1.1849
E′ 3089A′
3088.9 6 2906 27 5.84 1.0450 3089.4 12
291269 5.84 1.04
51 A′ 3090 3089.7 0.8 396 5.8 1.0452
E′′ 3163A′′
3161.6 52953
82 6.48 1.1053 3162.3 0.7 45 6.48 1.1054 A′′ 3163 3162.4 6 36 6.48 1.1055 A′ 3212
A′3213.0 6
301027 6.69 1.10
56E′ 3213
3215.3 0.4 0.8 6.69 1.1057 3216.2 12 52 6.70 1.10
a No infrared observations have been done at 4 K, for this range of frequencies. Comparison is done between the frequencies calculated byDFT by using C3h or Cs symmetry and the experimental values. The symbols F and µ correspond to the force constants and reduced mass inthe DFT calculations.
11136 J. Phys. Chem. A, Vol. 112, No. 44, 2008 Meinnel et al.
details than those taken with the powder sample, Figures 7dand 10. There is a good agreement with the optical observationsat 6 K (Tables 3 and 4), and this provides confirmation of otherassignments. For example, the ip C-Cm bending observed butvery weak in the infrared and Raman spectra gives intensefeatures at 399 and 568 cm-1, the ip C-I stretching are clearlyseen at 167 and 270 cm-1, and the op A″ methyl bending maycorrespond to excitations at 125, 138, and 155 cm-1. Theassignment of excitations below 100 cm-1 will be done inSection 6.3 in parallel with the assignment of the lattice modes.
6.2. Methyl Rocking, Bending, and Stretching Modesbelow 6 K. At 4 or 6 K, it is apparent from the Raman spectrashown in Figures 8 and 9 that instead of the broad excitationsseen at 293 K in Figure 5, now, the zones of specific Me modesare structured. This is in agreement with the calculations donewith the molecular model of Figure 3b, which takes into accountthe loss of the trigonal symmetry shown by neutron diffractionat 14 K. At 6 K, for each type of Me excitation, three slightlydifferent spectroscopic frequencies are seen. From the DFT-calculated frequencies and those observed in the Raman spectra,Table 4 presents a tentative assignment of the 15 ip A′ and 12
op A″ Me modes. An experimental resolution of 1 cm-1 wouldbe necessary to better distinguish the components, in particularfor the stretching modes.
6.2.1. Rocking Modes (MeR) of the Methyl Groups. FromTable 4, the calculations show that six MeR modes (three ipand three op, MeR) coexist in a range of 20 cm-1, between1036 and 1057 cm-1. In the same range, there is also the bendingmode of the angles Ri, mode no. 27, already assigned at 1017cm-1. Experimentally, these modes correspond to the structuredfeature observed in the range 995-1020 cm-1, Figure 8c. Totry to discriminate between the ip and op MeR, we have selectedfor the ip modes the three most intense peaks seen with crystal1: 1003, 1012, and 1017 cm-1. With crystal 2, three peaks wereobserved at 1006, 1013, and 1023 cm-1; they are assigned torocking op modes. A better resolution is necessary to confirmthis.
6.2.2. Symmetric C-H Bending Modes (MeSB) of theMethyl Groups. The MeSB or umbrella modes are only activeas ip modes. They give an intense Raman band at 1378 cm-1
with crystal 1, Figure 9a,b and Table 4. This must correspondto mode no. 40. The other two no. 38 and39 might be locatedat 1369 and 1387 cm-1, respectively. Nevertheless, in this
Figure 11. Comparison of the atomic displacements in TiM for inplane skeletal modes of vibration with those of TiB or Mes. Modes A′for molecular symmetry C3h.
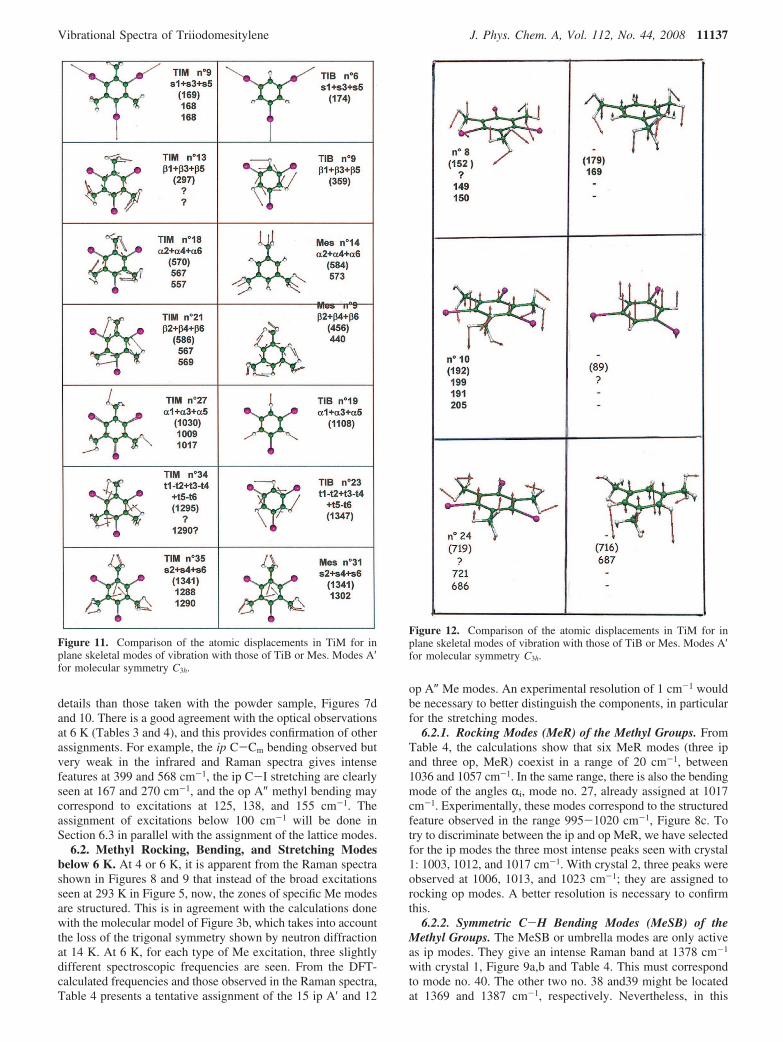
Figure 12. Comparison of the atomic displacements in TiM for inplane skeletal modes of vibration with those of TiB or Mes. Modes A′for molecular symmetry C3h.
Vibrational Spectra of Triiodomesitylene J. Phys. Chem. A, Vol. 112, No. 44, 2008 11137
assignment, the total splitting is two times larger than predicted;therefore, infrared spectra obtained below 10 K and the use, inDFT computations, of a model with a conformation nearer thatof the experimental molecule are necessary for a final conclusion.
6.2.3. Asymmetric C-H Bending Modes (Me-aB) of theMethyl Groups. From the DFT calculations (Table 4), the Me-aB have three op contributions. In Raman spectra from crystal2, three op A″ maxima are found at 1438, 1443, and 1448 cm-1
(Figure 9b), whereas three A′ should be located at 1430, 1437,and 1442 cm-1 (amplification of Figure 9a). The DFT modelgives a qualitative agreement with experiment, but it fails toexplain discrepancies between the calculated and observedintensities of the different lines.
6.2.4. C-H Stretching Modes (MeSt) of the Methyl Groups.For each of the three kinds of MeSt modes, the splittingcalculated (Table 4) are very small and below the limit of theresolution of our Raman experiments. The intensity of onesymmetric MeSt is calculated to be much higher than those of
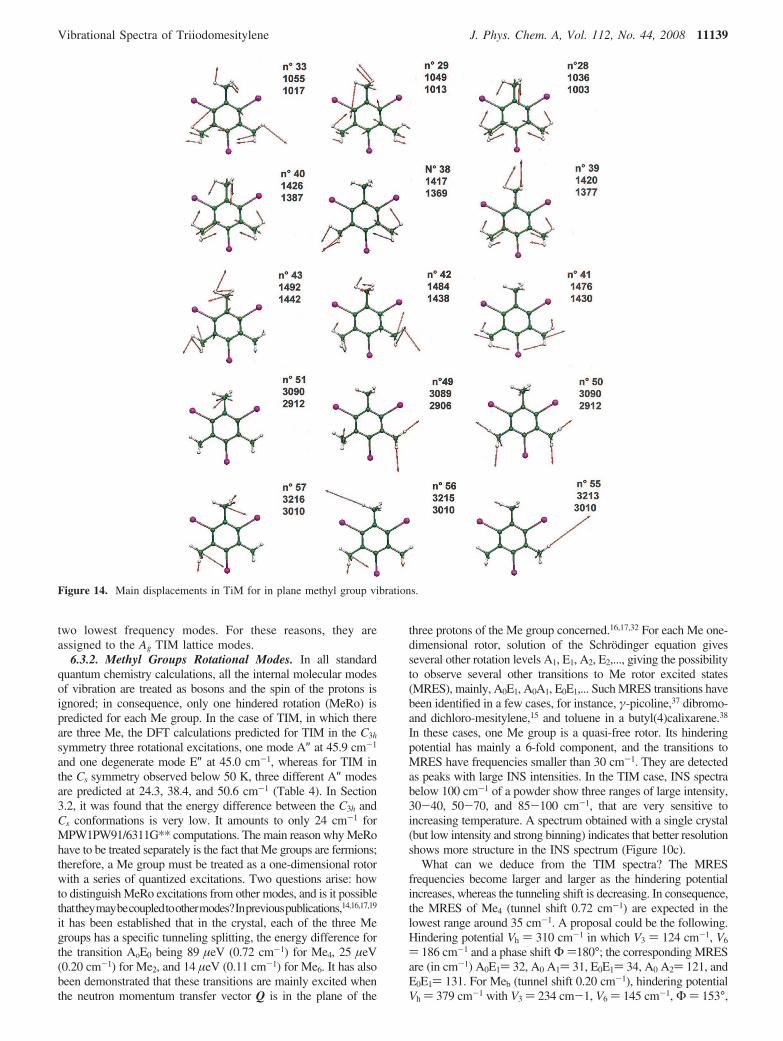
all other modes: it corresponds to the broad peak seen at 2914cm-1 at 293 K. At 6 K, this peak is split into two componentsat 2906 and 2912 cm-1. It was calculated at 3089.4 ( 0.4 cm-1.The op MeSt calculated at 3163 cm-1 is probably observed at2953 cm-1 in the Raman spectrum. The asymmetric MeStcalculated at 3213.0, 3215.3, and 3216.2 cm-1 give the weakbroad excitation around 3010 cm-1. The force constants foundin the DFT calculations are comparable to those given byother types of analyses; the force constants for ip MeSt are5.8 or 6.7 mdyn, whereas those for op MeSt are 6.5 mdyn.Discrepancies between computed and experimental valuescan be attributed to the use of a model that is not exactlythat found by neutron diffraction at 14 K, because the DFTpredictions are harmonic frequencies whereas the observedfrequencies are likely significantly altered by anharmonicity.[Note. In Figure 14 in the Appendix, the atomic displacementsrelative to methyl in-plane modes are represented. In eachpicture on five successive lines are given numbering of themode, frequency calculated, and Raman frequency at 6 K.In Figure 15 in the Appendix, the atomic displacementsrelative to methyl out-o-plane modes with same type ofinformation than in Table 4 are represented].
6.3. Methyl Group Rotational Modes and Lattice Modes(0-150 cm-1). The Me group rotational modes (MeRo) havespecific properties differing from those of the other Me modesbecause they are located at much lower frequencies, alwaysbelow 200 cm-1. Furthermore, in this frequency range, theyoverlap with lattice modes and internal molecular modes;therefore, the following question arises: are they coupled withother kinds of vibrations? In Sections 6.1.2 and 3 and in Table3, we have given the assignment of the TIM skeletal deforma-tions. The lowest calculated frequencies are C-I ip bending at117-118 cm-1 and C-Me op bending at 131-135 cm-1. Theonly frequencies calculated below 100 cm-1 for internal motionsare the MeRo modes. In Figure 10 are given the infraredabsorption, INS, and Raman spectra in the frequency range10-100 cm-1. In this range, 12 lattice modes and three MeRoare expected. The MeRo modes would be relatively intense inthe INS spectrum because they correspond to large displace-ments of the protons.
6.3.1. Assignment of the Lattice Modes. TIM crystallizesin the P-1 triclinic system, with two molecules M1 and M2
related by a center of symmetry in the primitive cell. Inconsequence, there are 12 lattice modes: six Ag and six Au. TheAu modes are antisymmetric with respect to the inversion center:three are acoustic modes corresponding to in-phase translationsof the molecules, and the three others are in-phase rotations ofthe molecules around their principal axes of inertia; one axisof rotation is normal to the ring plane, that is, roughly alonga*, and the two other axes, b′ and c′, lie in the ring plane. TheseAu modes are active only in the infrared spectrum; therefore,with a very high probability, they correspond to the three intensefar-infrared absorption bands (Figure 10) at 29, 36, and 45 cm-1.The six Raman active Ag are symmetric with respect to theinversion center; three are translations of M1 and M2 in oppositedirections along a*, b′, and c′, and the three others are rotationsof the molecules in opposite directions. Because the center ofthe hexagonal ring of TIM is not located on a symmetry axis,the rotations and translation may be linked in an helicoidalmotion. Experimentally, at T ) 6 K, six modes are observed at19, 24, 27, 33, 40, and 66 cm-1 (Figure 10). They progressivelybroaden as the temperature rises, but they remain distinct untilabout 120 K, at which temperature, there is coalescence of the
Figure 13. Main displacements in TiM for in plane skeletal vibrations.Modes A′ for molecular symmetry Cs previously E′ in C3h.
11138 J. Phys. Chem. A, Vol. 112, No. 44, 2008 Meinnel et al.
two lowest frequency modes. For these reasons, they areassigned to the Ag TIM lattice modes.
6.3.2. Methyl Groups Rotational Modes. In all standardquantum chemistry calculations, all the internal molecular modesof vibration are treated as bosons and the spin of the protons isignored; in consequence, only one hindered rotation (MeRo) ispredicted for each Me group. In the case of TIM, in which thereare three Me, the DFT calculations predicted for TIM in the C3h
symmetry three rotational excitations, one mode A″ at 45.9 cm-1
and one degenerate mode E″ at 45.0 cm-1, whereas for TIM inthe Cs symmetry observed below 50 K, three different A″ modesare predicted at 24.3, 38.4, and 50.6 cm-1 (Table 4). In Section3.2, it was found that the energy difference between the C3h andCs conformations is very low. It amounts to only 24 cm-1 forMPW1PW91/6311G** computations. The main reason why MeRohave to be treated separately is the fact that Me groups are fermions;therefore, a Me group must be treated as a one-dimensional rotorwith a series of quantized excitations. Two questions arise: howto distinguish MeRo excitations from other modes, and is it possiblethattheymaybecoupledtoothermodes?Inpreviouspublications,14,16,17,19
it has been established that in the crystal, each of the three Megroups has a specific tunneling splitting, the energy difference forthe transition AoE0 being 89 µeV (0.72 cm-1) for Me4, 25 µeV(0.20 cm-1) for Me2, and 14 µeV (0.11 cm-1) for Me6. It has alsobeen demonstrated that these transitions are mainly excited whenthe neutron momentum transfer vector Q is in the plane of the
three protons of the Me group concerned.16,17,32 For each Me one-dimensional rotor, solution of the Schrodinger equation givesseveral other rotation levels A1, E1, A2, E2,..., giving the possibilityto observe several other transitions to Me rotor excited states(MRES), mainly, A0E1, A0A1, E0E1,... Such MRES transitions havebeen identified in a few cases, for instance, γ-picoline,37 dibromo-and dichloro-mesitylene,15 and toluene in a butyl(4)calixarene.38
In these cases, one Me group is a quasi-free rotor. Its hinderingpotential has mainly a 6-fold component, and the transitions toMRES have frequencies smaller than 30 cm-1. They are detectedas peaks with large INS intensities. In the TIM case, INS spectrabelow 100 cm-1 of a powder show three ranges of large intensity,30-40, 50-70, and 85-100 cm-1, that are very sensitive toincreasing temperature. A spectrum obtained with a single crystal(but low intensity and strong binning) indicates that better resolutionshows more structure in the INS spectrum (Figure 10c).
What can we deduce from the TIM spectra? The MRESfrequencies become larger and larger as the hindering potentialincreases, whereas the tunneling shift is decreasing. In consequence,the MRES of Me4 (tunnel shift 0.72 cm-1) are expected in thelowest range around 35 cm-1. A proposal could be the following.Hindering potential Vh ) 310 cm-1 in which V3 ) 124 cm-1, V6
) 186 cm-1 and a phase shift Φ )180°; the corresponding MRESare (in cm-1) A0E1) 32, A0 A1) 31, E0E1) 34, A0 A2) 121, andE0E1) 131. For Meb (tunnel shift 0.20 cm-1), hindering potentialVh ) 379 cm-1 with V3 ) 234 cm-1, V6 ) 145 cm-1, Φ ) 153°,
Figure 14. Main displacements in TiM for in plane methyl group vibrations.
Vibrational Spectra of Triiodomesitylene J. Phys. Chem. A, Vol. 112, No. 44, 2008 11139
and corresponding MRES A0E1) 57, A0 A1) 56, E0E1) 55, A0
A2) 138, and E0E1) 145. For Mec (tunnel shift 0.11 cm-1),hindering potential Vh ) 363 cm-1 with V3 ) 274 cm-1, V6 ) 89cm-1, Φ ) 190°, and corresponding MRES A0E1) 70, A0 A1)69, E0E1) 69, A0 A2) 153, and E0E1) 160. These solutions arenot the only possible ones. The values are given with largeuncertainties amounting to perhaps more than 10% but give a goodbasis for more precise measurements with single crystals.
Conclusions
A study of the internal vibrations of triiodomesitylene (TIM) basedon precise determinations of the molecular conformation by usingX-rays diffraction at 293 K and neutron diffraction at 14 K has beenpresented. At 293 K, X-ray had established that the molecule has nearlyD3h symmetry in the crystal, because of delocalization of the protonsof the methyl groups, mainly due to thermal motion. On another hand,neutron diffraction study had established that the TIM conformationis not exactly trigonal at 14 K; the proton probability density in eachof the three Me groups has a different orientation relative to thearomatic ring. The consequences for the spectroscopic properties havebeen studied. By using Raman and infrared spectra recorded at roomtemperature, a first assignment has been made, by comparing TIMvibrations with those in 1,3,5-triiodo- and 1,3,5-trimethyl-benzene. Theassignment is completed by a comparison with the results of DFTcalculationsbyusingtheMPW1PW91functionalwiththeLANL2DZ(d,p)basis set and assuming C3h symmetry. The agreement between theoryand experiment is better than 97% for the observed skeletal vibrations.The DFT calculations overestimate specific methyl frequencies by 8%,and experiment shows only broad features for these vibrations. In orderto reduce the huge thermal broadening of spectroscopic observationsaround 293 K, new Raman, infrared, and INS spectra were recordedaround 4 K. In parallel, new ab initio calculations were done for a
molecule adopting a geometry close to that seen in the neutrondiffraction measurements and with Cs symmetry. The calculationsshow that all degenerate E′ and E″ modes would be split by between2 and 12 cm-1. This has been confirmed by the experiments, inparticular by Raman scattering measurements at 2.5 cm-1 resolution.Apart from two frequencies, all the TIM skeletal vibrations have beendetected and unambiguously assigned by using Cs symmetry. Fur-thermore, at 4 K, the sharpening of the features, in particular in theRaman spectra, has enabled the observation of almost all the differentip and op components of the methyl specific vibrations. In the range10-100 cm-1, an assignment of the lattice vibrations has beenproposed. A tentative assignment of the methyl rotation hinderingpotentials has been proposed by taking into account the ranges of largeINS intensity compatible with the tunneling shifts already measured.It is the fact to have at our disposal accurate X-ray and neutronstructural determinations that has allowed to understand the modifica-tions in spectra when going from 293 K until 6 K.
Acknowledgment. We gratefully acknowledge the peoplewho have helped us during different experiments: Structuraldeterminations by X-rays diffraction, O. Hernandez; Neutrondiffraction, A. Cousson, M. Mani, and M-T. Fernandez-Diaz;Infrared spectroscopy, Y. LeGall, B. Wyncke, and P. Roy;Raman scattering, M. Plazanet; Inelastic neutron scattering, C. J.Carlile and J. Tomkinson; Appendix graphs, K. Boudjada andfor many useful discussions, F. Fernandez-Alonso, A. Huller,M. Johnson, M. Prager., A. Inaba and H. P. Trommsdorff.
Appendix
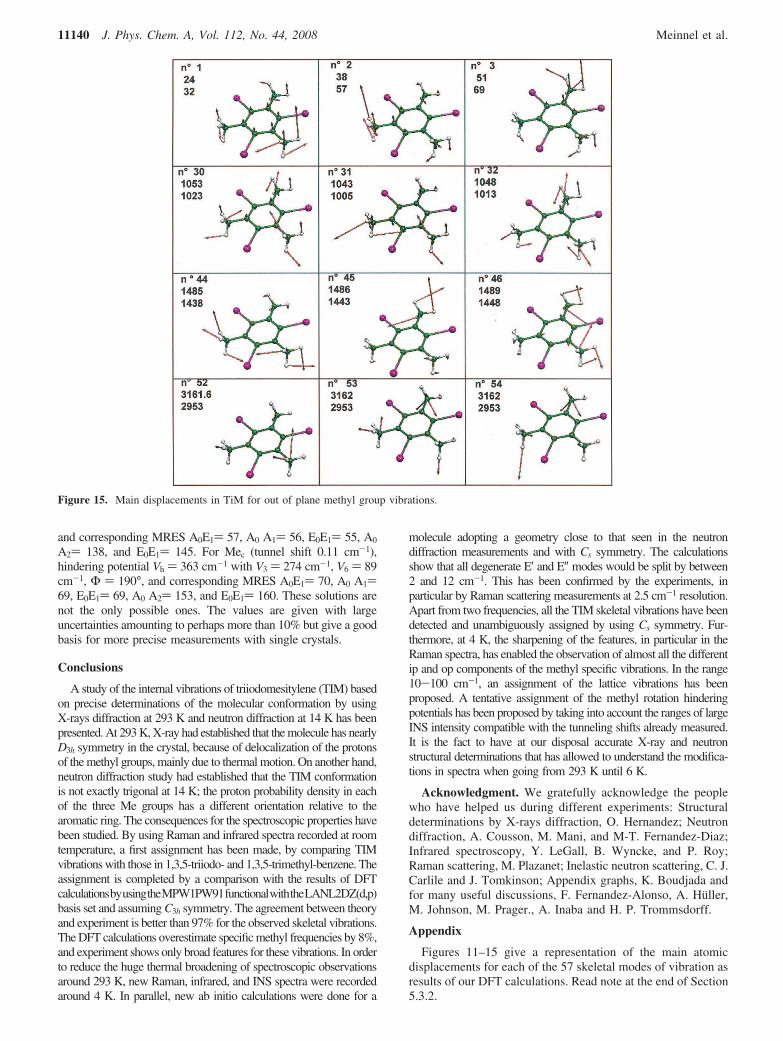
Figures 11–15 give a representation of the main atomicdisplacements for each of the 57 skeletal modes of vibration asresults of our DFT calculations. Read note at the end of Section5.3.2.
Figure 15. Main displacements in TiM for out of plane methyl group vibrations.
11140 J. Phys. Chem. A, Vol. 112, No. 44, 2008 Meinnel et al.
References and Notes
(1) Johnson, B. G.; Gill, P. M. W.; Pople, J. A. J. Chem. Phys. 1993,98, 5612–26.
(2) Andzelm, J.; Wimmer, E. J. Chem. Phys. 1992, 96, 1280.(3) Braden, D. A.; Hudson, B. S. J. Chem. Phys. 2000, 105, 982.(4) Pulay, P. Mol. Phys. 1971, 21, 329.(5) Pulay, P.; Meyer, W. J. Mol. Spectrosc. 1971, 50, 59.(6) Pulay, P.; Fogarasi, G.; Pang, F.; Boggs, G. E. J. Am. Chem. Soc.
1979, 101, 2550.(7) Pulay, P.; Fogarasi, G.; Pongor, G.; Boggs, G. E.; Vargha, A. J. Am.
Chem. Soc. 1983, 105, 7037.(8) Pulay, P. J. Mol. Struct. 1995, 347, 293.(9) Rauhut, G.; Pulay, P. J. Phys. Chem. 1995, 99, 3093.
(10) Scott, A. P.; Radom, L. J. Phys. Chem. 1996, 100, 16502.(11) Fast, P.; Corchado, J.; Sanchez, M.; Truhlar, D. G. J. Phys. Chem.
A 1999, 103, 3139.(12) Librando, V.; Alparone, A.; Minniti, Z. J. Mol. Struct. THEOCHEM
2007, 847, 23–24.(13) Prager, M.; Heideman, A. Chem. ReV. 1997, 97, 2933.(14) Meinnel, J.; Hausler, W.; Mani, M.; Tazi, M.; Nusimovici, M.;
Sanquer, M.; Wyncke, B.; Heidemann, A.; Carlile, C. J.; Tomkinson, J.;Hennion, B. Physica B 1992, 180, 181–711.
(15) Meinnel, J.; Hennion, B.; Mani, M.; Wyncke, B.; Carlile, C. J.Physica B 1995, 213, 214–649.
(16) Meinnel, J.; Carlile, C. J.; Knight, K. S.; Godard, J. Physica B 1996,226, 238.
(17) Meinnel, J.; Grimm, H.; Hernandez, O.; Jansen, E. Physica B 2004,350, E459.
(18) (a) Meinnel, J.; Mani, M.; Cousson, A.; Boudjada, F.; Paulus, W.;Johnson, M. Chem. Phys. 2000, 261, 165. (b) Boudjada, F. PhD Dissertation,University of Rennes, France, 1999.
(19) (a) Boudjada, A.; Meinnel, J.; Boucekkine, A.; Hernandez, O.;Fernandez-Diaz, M. T. J. Chem. Phys. 2002, 117, 10173. (b) Boudjada, A.PhD Dissertation, University of Constantine, 2000.
(20) Okuyama, K.; Mikami, N.; Ito, M. J. Phys. Chem. 1985, 89, 5617.(21) Del Rio, A.; Boucekkine, A.; Meinnel, J. J. Comput. Chem. 2003,
24, 2093.(22) Dolson, D. A.; Holtzclaw, K.W.; Moss, D. B.; Parmenter, C. S. J.
Phys. Chem. 1986, 84, 1119.(23) Zhao, Z-Q.; Parmenter, C. S.; Moss, D. B.; Bradley, A. J.; Knight,
A. E.; Owens, K. G. J. Chem. Phys. 1992, 96, 6362.
(24) Boudjada, F.; Meinnel, J.; Cousson, A.; Paulus, W.; Mani, M.;Sanquer, M. Neutrons and Num. Methods A.I.P. CP479 1999, 217.
(25) Meinnel, J.; Cousson, A.; Boudjada, F.; Plazanet, M.; Mani, M. J.Low Temp. Phys. 2001, 122, 257.
(26) Hernandez, O.; Knight, K. S.; Van Beek, W.; Boucekkine, A.;Boudjada, A.; Paulus, W.; Meinnel, J. J. Mol. Struct. 2006, 791, 41.
(27) Plazanet, M.; Johnson, M. R.; Cousson, A.; Meinnel, J.; Tromms-dorff, H. P. Chem. Phys. 2002, 285, 299.
(28) Boudjada, A.; Hernandez, O.; Meinnel, J.; Mani, M.; Paulus, W.Acta Cryst. C 2001, C57, 1106.
(29) Pulay, P.; Fogarasi, G.; Boggs, G.; E, J. Chem. Phys. 1981, 74,3999.
(30) Frisch, M. J.; Trucks, G. W.; Schlegel, H. B.; Scuseria, G. E.; Robb,M. A.; Cheeseman, J. R.; Zakrzewski, V. G.; Montgomery, J. A., Jr.;Stratmann, R. E.; Burant, J. C.; Dapprich, S.; Millam, J. M.; Daniels, A. D.;Kudin, K. N.; Strain, M. C.; Farkas, O.; Tomasi, J.; Barone, V.; Cossi, M.;Cammi, R.; Mennucci, B.; Pomelli, C.; Adamo, C.; Clifford, S.; Ochterski,J.; Petersson, G. A.; Ayala, P. Y.; Cui, Q.; Morokuma, K.; Malick, D. K.;Rabuck, A. D.; Raghavachari, K.; Foresman, J. B.; Cioslowski, J.; Ortiz,J. V.; Stefanov, B. B.; Liu, G.; Liashenko, A.; Piskorz, P.; Komaromi, I.;Gomperts, R.; Martin, R. L.; Fox, D. J.; Keith, T.; Al-Laham, M. A.; Peng,C. Y.; Nanayakkara, A.; Gonzalez, C.; Challacombe, M.; Gill, P. M. W.;Johnson, B. G.; Chen, W.; Wong, M. W.; Andres, J. L.; Head-Gordon, M.;Replogle, E. S.; Pople, J. A. Gaussian 98, revision A.5; Gaussian, Inc.:Pittsburgh, PA, 1998.
(31) Bosch, E.; Barnes, C. L. Cryst. Growth Des. 2002, 2, 299.(32) Meinnel, J.; Carlile, C.; Boudjada, F.; Johnson, M.; Cousson, A.
Personal communication.(33) Draeger, J. A. Spectrochimica Acta A 1985, 41A, 607.(34) Bussian, B.; Eysel, H. Spectrochim. Acta, Part A 1985, 41A, 1149.(35) Wilson, E. B.; Decius, J. C.; Cross, P. C. Molecular Vibrations;
McGraw-Hill, 1955.(36) Varsanyi, G. Vibrational Spectra of Benzene DeriVatiVe; Academic
Press, 1969.(37) Alefeld, B.; Kolmar, A.; Dasannacharya, B. A. J. Chem. Phys. 1975,
63, 4415.(38) Caciuffo, R.; Francescangeli, O.; Melone, S.; Prager, M.; Ugozzoli,
F.; Andreetti, G.; Amoretti, G.; Coddens, G.; Blank, H. Physica B 1992,180 & 181, 691.
JP802621W
TABLE A: Benzene internal modes of vibration. Experimental data are values given by NIST. Values in columns G, I and Kare the results of our calculations. “Diff” in columns H, J and L give the difference (in%) between calculated and experimentaldata
A B C D E F G H I J K LMode
symmetrytype
Mainmotion
ExpeIr
NIST
ExpeRamanNIST
ExpeNeutron
HF4-21scaled
MPW1PW91
LanL2Dz(d,p) diff
MPW1PW91
6-311++G(d,p)diff%
AugCC-PVTZ
diff%
Afg(1) t CC la 991 ? 983 1027 +3.7 1028 +3.7 1029 +3.7Afg(2) s CH la 3058 ? 3095 3251 +6.3 3223 -5.4 3219 +5.3Afg(3) δ CCH la 1326 1340 1365 1368 +1.8 1379 -4.0 1381 +4.1B2g(4) δ CCCC la la 694 701 721 +3.9 724 +4.3 719 +3.6B2g(5) γ CCCH la la 1033 996 1018 -1.5 1018 -1.5 1024 -1.1E2g(6a,b) δ CCC la 606 603 607 612 +1.0 620 +2.3 619 +2.1E2g(7a,b) δ CH la 3045 3055 ? 3061 3224 +5.9 3206 +5.3 3193 +4.9E2g(8a,b) τ CC la 1583 1550 ? 1607 1670 +5.5 1663 +5.1 1659 +4.6E2g(9a,b) δ CCH la 1175 1170 1183 1199 +2.0 1202 +2.2 1200 +2.0E1g(10a,b) γ CCCH la 848 856 843 869 +2.5 870 +2.5 870 +2.5A2u(11) γ CCCH 673 la 694 667 890 +2.5 691 +2.7 695 +3.3B1u(12) δ CCC 1010 la ? 997 1006 +0.4 1020 +1.0 1029 +2.9B1u(13) s CH 3068 la 3055 ? 3051 3215 +4.8 3186 +3.8 3183 +3.5B2u(14) t CC 1310 la ? 1297 1386 +5.8 1369 +4.5 1361 +3.9B2u(15) δ CCH 1150 la 1170 1162 1176 +2.3 1176 +2.3 1172 +1.9E2u(16a,b) τ CCH 403 la 402 402 410 +1.7 409 +1.7 410 +1.7E2u(17a,b) γ CCCH 975 la 976 969 993 +1.8 990 +1.5 1000 +2.5E1u(18a,b) δ CCH 1038 la 1033 1035 1068 +2.9 1071 +3.2 1070 +3.2E1u(19a,b) δ CCC 1486 la 1473 1482 1514 +1.9 1519 +2.2 1522 +2.4E1u(20a,b) s CH 3080 la 3110 ? 3080 3241 +5.2 3213 +4.3 3209 +4.2
Mean group 3.1% 3.3% 3.2%
Vibrational Spectra of Triiodomesitylene J. Phys. Chem. A, Vol. 112, No. 44, 2008 11141
![NATURAL GAS DEHYDRATION UNIT - ProSim · 2020. 2. 10. · The model for the activity coefficient calculations is UNIQUAC [ABR75], [AND78]. The binaries interaction parameters have](https://img.pdfslide.fr/doc/110x75/60aed9623de35124d17ed4e6/natural-gas-dehydration-unit-prosim-2020-2-10-the-model-for-the-activity.jpg)

![Turkey Point Plant Units 3 and 4, License Amendment ...< 28% 2.125 3.2-3 (2) Augmented Surveillance (MIDS) If [FQ]n, as predicted by approved physics calculations, exceeds [FnQL tfen](https://img.pdfslide.fr/doc/110x75/5f0decda7e708231d43cc21f/turkey-point-plant-units-3-and-4-license-amendment-28-2125-32-3-2.jpg)