Embed Size (px)
Citation preview
Journal of Physics and Chemistry of Solids 67 (2006) 2395–2399
Visible luminescence of Al2O3 nanoparticles embeddedin silica glass host matrix
L. El Mira,�, A. Amlouka, C. Barthoub
aLaboratoire de Physique des Materiaux et des Nanomateriaux Appliquee a l’Environnement, Faculte des Sciences de Gabes,
Cite Erriadh Manara Zrig, 6072 Gabes, TunisiebInstitut des NanoSciences de Paris (INSP), UMR CNRS 7588, Universites Pierre et Marie Curie (Paris 6) et Denis Diderot (Paris 7),
Campus Boucicaut, 140 rue de Lourmel, F-75015 Paris, France
Received 28 February 2006; received in revised form 31 March 2006; accepted 25 May 2006
Abstract
This paper deals with the sol–gel elaboration and defects photoluminescence (PL) examination of Al2O3 nanocrystallites (size �30 nm)
confined in glass based on silica aerogel. Aluminium oxide aerogels were synthesized using esterification reaction for hydrolysis of the
precursor and supercritical conditions of ethyl alcohol for drying. The obtained nanopowder was incorporated in SiO2 host matrix. After
heating under natural atmosphere at 1150 1C for 2 h, the composite Al2O3/SiO2 (AS) exhibited a strong PL bands at 400–600 and
700–900 nm in 78–300K temperature range. PL excitation (PLE) measurements show different origins of the emission. It was suggested
that OH-related radiative centres and non-bridging oxygen hole centres (NBOHCs) were responsible for the bands at 400–600 and
700–900 nm, respectively.
r 2006 Elsevier Ltd. All rights reserved.
Keywords: A. Nanostrutures; A. Optical materials; A. Interfaces; B. Crystal growth; B. Sol–gel growth
1. Introduction
Recently, considerable attention has been paid to theeffect of the surface species on the PL of nanoparticles [1–6]and mesoporous silicas (MSs) [7–13]. Because thesenanoscale materials are characterized by a large value ofthe surface/volume ratio, their surfaces are expected to becovered by chemisorbed OH groups on top of which H2Ois physisorbed from the ambient air. Yoldas [14,15]investigated the sol–gel process of Al2O3 powders fromaluminium alkoxides and reported the effects of processingparameters on the properties of hydroxide sols and gels.Alumina powders are intensively used as precursor forpreparation of various optical materials [16] and can beused as filler in fire-resistant epoxy resin compound forcovering of building materials [17,18] and catalysts inpetrol chemical industry [19,20].
Nanoscaled aluminium oxide particles were used for thepreparation of the UV curable hard coating by the sol–geltechnique in order to improve the wear resistance oforganic polymers [21,22]. Several groups studied thefluorescence of silica and metal oxides materials anddiscussed the existence and the effect of the non-bridgingoxygen hole centres (NBOHCs) and the OH-relatedradiative centres on the photoluminescent properties[23–27]. However, the origin of some PL in Al2O3/SiO2
(AS) nanocomposite has not yet completely clarified.In this paper we show that the OH-related species on the
surface of alumina and silica emit light in the green spectralrange. The radiative electronic transitions in these PLcentres involve the Si–OH binding vibrations, giving rise toa distinct progression in the PL spectra spaced about960 cm�1. However, bulk and surface NBOHCs of the twooxides, Al2O3 and SiO2, emit light in the red spectral range.The two bands are observed for the first time at ourknowledge in the AS composite.The main goals of the present study were (i) the
elaboration of Al2O3 nanoparticles with the size about
ARTICLE IN PRESS
www.elsevier.com/locate/jpcs
0022-3697/$ - see front matter r 2006 Elsevier Ltd. All rights reserved.
doi:10.1016/j.jpcs.2006.05.059
�Corresponding author. Tel.: +216 97 40 87 56; fax: +216 75 39 24 21.
E-mail address: [email protected] (L.E. Mir).
30 nm, (ii) the incorporation of these nanoparticles in SiO2
aerogel glass matrix and (iii) the description of the visiblePL of this composite.
2. Experiment
2.1. Sample preparation
Colloid suspension of Al2O3 aerogel nanoparticles insilicate host matrix, with a Al:Si molar ratio 1:3, were firstprepared by dissolving 5 g of aluminium tri-sec-butoxide([CH3(CH2)30]3Al, 97%, Sigma Aldrich) in ethyl alcohol(EtOH, 99,9%, Chemi-Pharma) under magnetic stirringfor 2 h. Aerogels nanoparticles were synthesized by super-critical drying in EtOH and the obtained powder washeated in a furnace under natural atmosphere for 2 h at700 1C. Secondly, 50mg of Al2O3 nanopowder was mixedwith 0.5ml of tetraethoxysilane (TEOS, 98%, SigmaAldrich) dissolved in EtOH and hydrolysed for 30minwith 0.44ml of water under constant magnetic stirring atroom temperature. The sols were transferred to tubes inultrasonic bath where 100 ml of fluoride acid (HF, 50%,Carbo erba) was added. The wet gel formed in few seconds.Monolithic aerogel was obtained by supercritical drying inEtOH. Finally, silica glasses containing nanoparticles wereobtained after thermal treatment under natural atmospherefor 2 h at 1150 1C.
2.2. Characterization techniques
The crystallinity of the alumina powder before incor-poration into silica host matrix and the final compositewere analysed by X-ray diffraction (XRD; Bruker D8Advince; 40 kV, 30mA) using ‘‘X’Pert HighScore plus’’ aspeak fitting programme. Powder morphology and size weredetermined by transmission electron microscope (TEM;Tecnai G2-200 kV) and atomic force microscope (AFM;TopoMetrix). The sample preparation for TEM observa-tion was as follow: the powder was firstly put in EtOH, andthe ultrasonic dispersed solution was dropped on a Cu net.For AFM observation the powders have been pressed intopellets. For PL measurements, the 337.1 nm laser line of aLaser Photonics LN 100 nitrogen laser was used as anexcitation source. The emitted light from the sample,collected by an optical fiber on the same side as theexcitation, was analysed with a Jobin-Yvon SpectrometerHR460 and a multichannel CCD detector (2000 pixels).The PLE measurements were performed on a Jobin-YvonFluorolog 3-2 spectrometer and a 450W Xenon lamp as theexcitation source. The emission spectra were corrected forthe spectral response of the excitation source. The decayswere analysed by a PM Hamamatsu R928 and a scopeNicolet 400 with a time constant of the order of 25 ns.Thelow temperature experiments were carried out in a JanisVPF-600 Dewar with a variable temperature controlledbetween 78 and 350K.
3. Results and discussion
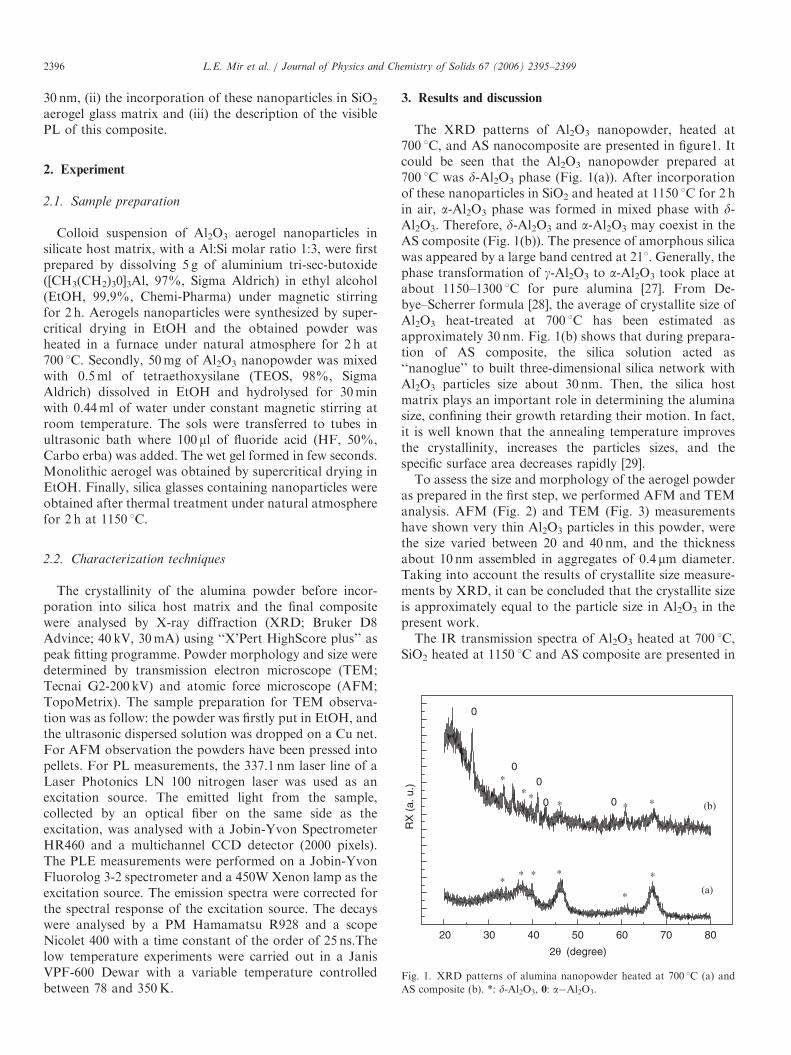
The XRD patterns of Al2O3 nanopowder, heated at700 1C, and AS nanocomposite are presented in figure1. Itcould be seen that the Al2O3 nanopowder prepared at700 1C was d-Al2O3 phase (Fig. 1(a)). After incorporationof these nanoparticles in SiO2 and heated at 1150 1C for 2 hin air, a-Al2O3 phase was formed in mixed phase with d-Al2O3. Therefore, d-Al2O3 and a-Al2O3 may coexist in theAS composite (Fig. 1(b)). The presence of amorphous silicawas appeared by a large band centred at 211. Generally, thephase transformation of g-Al2O3 to a-Al2O3 took place atabout 1150–1300 1C for pure alumina [27]. From De-bye–Scherrer formula [28], the average of crystallite size ofAl2O3 heat-treated at 700 1C has been estimated asapproximately 30 nm. Fig. 1(b) shows that during prepara-tion of AS composite, the silica solution acted as‘‘nanoglue’’ to built three-dimensional silica network withAl2O3 particles size about 30 nm. Then, the silica hostmatrix plays an important role in determining the aluminasize, confining their growth retarding their motion. In fact,it is well known that the annealing temperature improvesthe crystallinity, increases the particles sizes, and thespecific surface area decreases rapidly [29].To assess the size and morphology of the aerogel powder
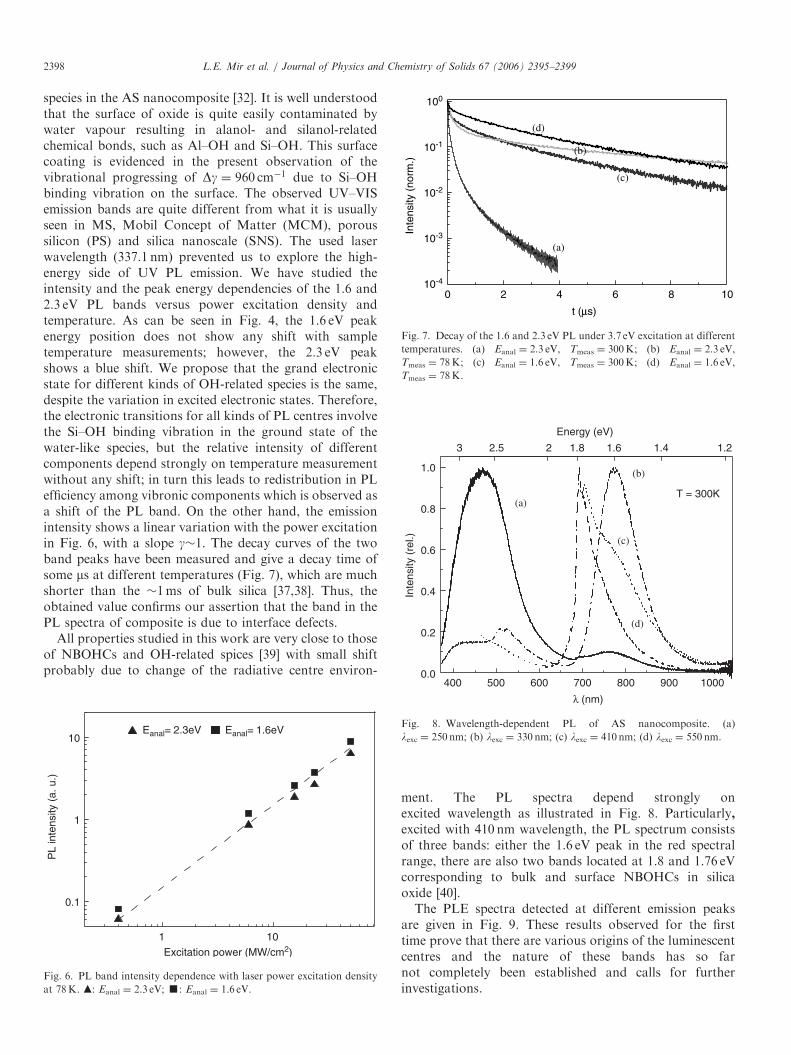
as prepared in the first step, we performed AFM and TEManalysis. AFM (Fig. 2) and TEM (Fig. 3) measurementshave shown very thin Al2O3 particles in this powder, werethe size varied between 20 and 40 nm, and the thicknessabout 10 nm assembled in aggregates of 0.4 mm diameter.Taking into account the results of crystallite size measure-ments by XRD, it can be concluded that the crystallite sizeis approximately equal to the particle size in Al2O3 in thepresent work.The IR transmission spectra of Al2O3 heated at 700 1C,
SiO2 heated at 1150 1C and AS composite are presented in
ARTICLE IN PRESS
20 30 40 50 60 70 80
0∗
∗
∗ ∗
0
00
0
∗
∗∗∗
∗∗∗
∗ (b)
(a)
RX
(a.
u.)
2θ (degree)
Fig. 1. XRD patterns of alumina nanopowder heated at 700 1C (a) and
AS composite (b). *: d-Al2O3, 0: a�Al2O3.
L.E. Mir et al. / Journal of Physics and Chemistry of Solids 67 (2006) 2395–23992396
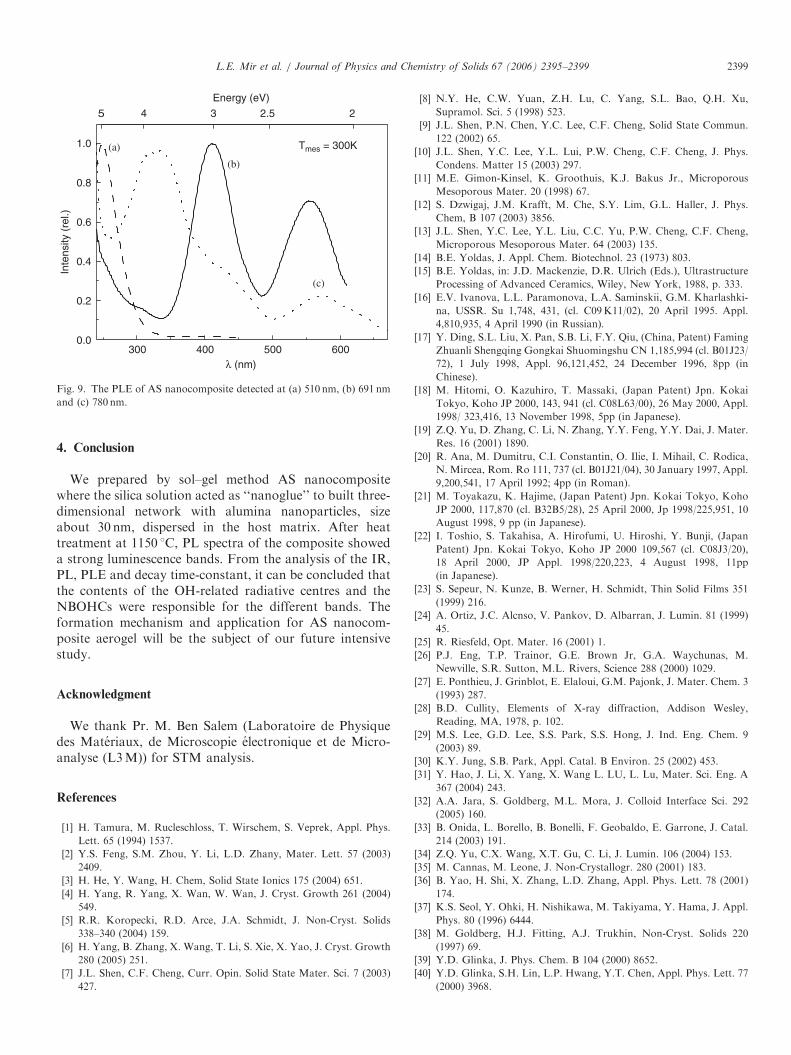
Fig. 4. The bands around 3440 and 1650 cm�1 are due tothe stretching vibration of the OH group and molecularH2O, respectively. The peaks at 470, 800, 1110 cm�1 aredue to the Si–O–Si bending modes, symmetric Si–O–Sistretching vibration and asymmetric Si–O–Si stretchingvibration, respectively [30]. Additionally, in the spectrumof Al2O3, the wide band in the range of 400–900 cm�1
assigned to Al–OH and AlOOH vibrations [31]. The mostimportant feature of the IR spectra is the absence of anyband at 2176 and 1050 cm�1 which are widely accepted as
characteristic vibrations due to the formation of Si(OH)Aland Si–O–Al, respectively [32,33].Fig. 5 shows the PL spectra in the UV–VIS–NIR range
for AS nanocomposite, measured at different temperatureswith excitation wavelength at 337.1 nm. Overall, the PLspectra consist of two bands located in the red and greenspectral ranges. The red band peaked at E1.6 eV resultsfrom the NBOHC in alumina (AL�O:) [34]. Cannas andYao [35,36] have shown the similar results where bothemission band centred at E1.9 eV and absorption band at4.8 eV in synthetic silica can be ascribed to transitionslocalized on the NBOHC in silica (SiO:). The green band atE2.3 eV has been attributed to alanol and silanol-related
ARTICLE IN PRESS
Fig. 2. A characteristic AFM image of Al2O3 aerogel as prepared.
Fig. 3. TEM picture of Al2O3 aerogel as prepared.
4000 3000 2000 1000 0
470800
11101650
3440
Al2O3/SiO2
SiO2
Al2O3
Tra
nsm
ittan
ce (
a. u
.)
Wavenumbers (cm-1)
Fig. 4. IR spectra of Al2O3 nanopowder heated at 700 1C, SiO2 heated at
1150 1C and AS composite.
400 500 600 700 800 900 10000
20
40
60
Energy (eV)
2.5 1.8 1.6 1.4
λexc = 337.1nm
∆γ = 960cm-1
Emax = 2.3eV
Emax = 1.56eV 78K
100K
130K
160K
200K
250K
300K
350K
PL
inte
nsity
(a.
u.)
λ (nm)
1.222
Fig. 5. PL spectra of AS nanocomposite at different temperature
measurements. The lines observed below 400 nm are due to the dispersion
of the plasma of the nitrogen laser.
L.E. Mir et al. / Journal of Physics and Chemistry of Solids 67 (2006) 2395–2399 2397
species in the AS nanocomposite [32]. It is well understoodthat the surface of oxide is quite easily contaminated bywater vapour resulting in alanol- and silanol-relatedchemical bonds, such as Al–OH and Si–OH. This surfacecoating is evidenced in the present observation of thevibrational progressing of Dg ¼ 960 cm�1 due to Si–OHbinding vibration on the surface. The observed UV–VISemission bands are quite different from what it is usuallyseen in MS, Mobil Concept of Matter (MCM), poroussilicon (PS) and silica nanoscale (SNS). The used laserwavelength (337.1 nm) prevented us to explore the high-energy side of UV PL emission. We have studied theintensity and the peak energy dependencies of the 1.6 and2.3 eV PL bands versus power excitation density andtemperature. As can be seen in Fig. 4, the 1.6 eV peakenergy position does not show any shift with sampletemperature measurements; however, the 2.3 eV peakshows a blue shift. We propose that the grand electronicstate for different kinds of OH-related species is the same,despite the variation in excited electronic states. Therefore,the electronic transitions for all kinds of PL centres involvethe Si–OH binding vibration in the ground state of thewater-like species, but the relative intensity of differentcomponents depend strongly on temperature measurementwithout any shift; in turn this leads to redistribution in PLefficiency among vibronic components which is observed asa shift of the PL band. On the other hand, the emissionintensity shows a linear variation with the power excitationin Fig. 6, with a slope g�1. The decay curves of the twoband peaks have been measured and give a decay time ofsome ms at different temperatures (Fig. 7), which are muchshorter than the �1ms of bulk silica [37,38]. Thus, theobtained value confirms our assertion that the band in thePL spectra of composite is due to interface defects.
All properties studied in this work are very close to thoseof NBOHCs and OH-related spices [39] with small shiftprobably due to change of the radiative centre environ-
ment. The PL spectra depend strongly onexcited wavelength as illustrated in Fig. 8. Particularly,excited with 410 nm wavelength, the PL spectrum consistsof three bands: either the 1.6 eV peak in the red spectralrange, there are also two bands located at 1.8 and 1.76 eVcorresponding to bulk and surface NBOHCs in silicaoxide [40].The PLE spectra detected at different emission peaks
are given in Fig. 9. These results observed for the firsttime prove that there are various origins of the luminescentcentres and the nature of these bands has so farnot completely been established and calls for furtherinvestigations.
ARTICLE IN PRESS
1 10
1
10
PL
inte
nsity
(a.
u.)
Eanal= 1.6eVEanal= 2.3eV
0.1
Excitation power (MW/cm2)
Fig. 6. PL band intensity dependence with laser power excitation density
at 78K. m: Eanal ¼ 2.3 eV; ’: Eanal ¼ 1.6 eV.
0 10
(d)
(c)
(b)
(a)
Inte
nsity
(no
rm.)
100
10-1
10-2
10-3
10-4
2 4 6 8
t (µs)
Fig. 7. Decay of the 1.6 and 2.3 eV PL under 3.7 eV excitation at different
temperatures. (a) Eanal ¼ 2.3 eV, Tmeas ¼ 300K; (b) Eanal ¼ 2.3 eV,
Tmeas ¼ 78K; (c) Eanal ¼ 1.6 eV, Tmeas ¼ 300K; (d) Eanal ¼ 1.6 eV,
Tmeas ¼ 78K.
400 500 600 700 800 900 1000
1.0
0.8
0.6
0.4
0.2
0.0
3 1.6
(d)
(c)
(b)
(a)
Inte
nsity
(re
l.)
λ (nm)
T = 300K
Energy (eV)
2.5 2 1.8 1.4 1.2
Fig. 8. Wavelength-dependent PL of AS nanocomposite. (a)
lexc ¼ 250 nm; (b) lexc ¼ 330 nm; (c) lexc ¼ 410nm; (d) lexc ¼ 550 nm.
L.E. Mir et al. / Journal of Physics and Chemistry of Solids 67 (2006) 2395–23992398
4. Conclusion
We prepared by sol–gel method AS nanocompositewhere the silica solution acted as ‘‘nanoglue’’ to built three-dimensional network with alumina nanoparticles, sizeabout 30 nm, dispersed in the host matrix. After heattreatment at 1150 1C, PL spectra of the composite showeda strong luminescence bands. From the analysis of the IR,PL, PLE and decay time-constant, it can be concluded thatthe contents of the OH-related radiative centres and theNBOHCs were responsible for the different bands. Theformation mechanism and application for AS nanocom-posite aerogel will be the subject of our future intensivestudy.
Acknowledgment
We thank Pr. M. Ben Salem (Laboratoire de Physiquedes Materiaux, de Microscopie electronique et de Micro-analyse (L3M)) for STM analysis.
References
[1] H. Tamura, M. Rucleschloss, T. Wirschem, S. Veprek, Appl. Phys.
Lett. 65 (1994) 1537.
[2] Y.S. Feng, S.M. Zhou, Y. Li, L.D. Zhany, Mater. Lett. 57 (2003)
2409.
[3] H. He, Y. Wang, H. Chem, Solid State Ionics 175 (2004) 651.
[4] H. Yang, R. Yang, X. Wan, W. Wan, J. Cryst. Growth 261 (2004)
549.
[5] R.R. Koropecki, R.D. Arce, J.A. Schmidt, J. Non-Cryst. Solids
338–340 (2004) 159.
[6] H. Yang, B. Zhang, X. Wang, T. Li, S. Xie, X. Yao, J. Cryst. Growth
280 (2005) 251.
[7] J.L. Shen, C.F. Cheng, Curr. Opin. Solid State Mater. Sci. 7 (2003)
427.
[8] N.Y. He, C.W. Yuan, Z.H. Lu, C. Yang, S.L. Bao, Q.H. Xu,
Supramol. Sci. 5 (1998) 523.
[9] J.L. Shen, P.N. Chen, Y.C. Lee, C.F. Cheng, Solid State Commun.
122 (2002) 65.
[10] J.L. Shen, Y.C. Lee, Y.L. Lui, P.W. Cheng, C.F. Cheng, J. Phys.
Condens. Matter 15 (2003) 297.
[11] M.E. Gimon-Kinsel, K. Groothuis, K.J. Bakus Jr., Microporous
Mesoporous Mater. 20 (1998) 67.
[12] S. Dzwigaj, J.M. Krafft, M. Che, S.Y. Lim, G.L. Haller, J. Phys.
Chem, B 107 (2003) 3856.
[13] J.L. Shen, Y.C. Lee, Y.L. Liu, C.C. Yu, P.W. Cheng, C.F. Cheng,
Microporous Mesoporous Mater. 64 (2003) 135.
[14] B.E. Yoldas, J. Appl. Chem. Biotechnol. 23 (1973) 803.
[15] B.E. Yoldas, in: J.D. Mackenzie, D.R. Ulrich (Eds.), Ultrastructure
Processing of Advanced Ceramics, Wiley, New York, 1988, p. 333.
[16] E.V. Ivanova, L.L. Paramonova, L.A. Saminskii, G.M. Kharlashki-
na, USSR. Su 1,748, 431, (cl. C09K11/02), 20 April 1995. Appl.
4,810,935, 4 April 1990 (in Russian).
[17] Y. Ding, S.L. Liu, X. Pan, S.B. Li, F.Y. Qiu, (China, Patent) Faming
Zhuanli Shengqing Gongkai Shuomingshu CN 1,185,994 (cl. B01J23/
72), 1 July 1998, Appl. 96,121,452, 24 December 1996, 8pp (in
Chinese).
[18] M. Hitomi, O. Kazuhiro, T. Massaki, (Japan Patent) Jpn. Kokai
Tokyo, Koho JP 2000, 143, 941 (cl. C08L63/00), 26 May 2000, Appl.
1998/ 323,416, 13 November 1998, 5pp (in Japanese).
[19] Z.Q. Yu, D. Zhang, C. Li, N. Zhang, Y.Y. Feng, Y.Y. Dai, J. Mater.
Res. 16 (2001) 1890.
[20] R. Ana, M. Dumitru, C.I. Constantin, O. Ilie, I. Mihail, C. Rodica,
N. Mircea, Rom. Ro 111, 737 (cl. B01J21/04), 30 January 1997, Appl.
9,200,541, 17 April 1992; 4pp (in Roman).
[21] M. Toyakazu, K. Hajime, (Japan Patent) Jpn. Kokai Tokyo, Koho
JP 2000, 117,870 (cl. B32B5/28), 25 April 2000, Jp 1998/225,951, 10
August 1998, 9 pp (in Japanese).
[22] I. Toshio, S. Takahisa, A. Hirofumi, U. Hiroshi, Y. Bunji, (Japan
Patent) Jpn. Kokai Tokyo, Koho JP 2000 109,567 (cl. C08J3/20),
18 April 2000, JP Appl. 1998/220,223, 4 August 1998, 11pp
(in Japanese).
[23] S. Sepeur, N. Kunze, B. Werner, H. Schmidt, Thin Solid Films 351
(1999) 216.
[24] A. Ortiz, J.C. Alcnso, V. Pankov, D. Albarran, J. Lumin. 81 (1999)
45.
[25] R. Riesfeld, Opt. Mater. 16 (2001) 1.
[26] P.J. Eng, T.P. Trainor, G.E. Brown Jr, G.A. Waychunas, M.
Newville, S.R. Sutton, M.L. Rivers, Science 288 (2000) 1029.
[27] E. Ponthieu, J. Grinblot, E. Elaloui, G.M. Pajonk, J. Mater. Chem. 3
(1993) 287.
[28] B.D. Cullity, Elements of X-ray diffraction, Addison Wesley,
Reading, MA, 1978, p. 102.
[29] M.S. Lee, G.D. Lee, S.S. Park, S.S. Hong, J. Ind. Eng. Chem. 9
(2003) 89.
[30] K.Y. Jung, S.B. Park, Appl. Catal. B Environ. 25 (2002) 453.
[31] Y. Hao, J. Li, X. Yang, X. Wang L. LU, L. Lu, Mater. Sci. Eng. A
367 (2004) 243.
[32] A.A. Jara, S. Goldberg, M.L. Mora, J. Colloid Interface Sci. 292
(2005) 160.
[33] B. Onida, L. Borello, B. Bonelli, F. Geobaldo, E. Garrone, J. Catal.
214 (2003) 191.
[34] Z.Q. Yu, C.X. Wang, X.T. Gu, C. Li, J. Lumin. 106 (2004) 153.
[35] M. Cannas, M. Leone, J. Non-Crystallogr. 280 (2001) 183.
[36] B. Yao, H. Shi, X. Zhang, L.D. Zhang, Appl. Phys. Lett. 78 (2001)
174.
[37] K.S. Seol, Y. Ohki, H. Nishikawa, M. Takiyama, Y. Hama, J. Appl.
Phys. 80 (1996) 6444.
[38] M. Goldberg, H.J. Fitting, A.J. Trukhin, Non-Cryst. Solids 220
(1997) 69.
[39] Y.D. Glinka, J. Phys. Chem. B 104 (2000) 8652.
[40] Y.D. Glinka, S.H. Lin, L.P. Hwang, Y.T. Chen, Appl. Phys. Lett. 77
(2000) 3968.
ARTICLE IN PRESS
300 400 500 600
0.2
0.0
0.4
0.8
0.6
1.0
5
(c)
(b)
(a) Tmes = 300K
Inte
nsity
(re
l.)
λ (nm)
4 3 2.5 2
Energy (eV)
Fig. 9. The PLE of AS nanocomposite detected at (a) 510 nm, (b) 691 nm
and (c) 780 nm.
L.E. Mir et al. / Journal of Physics and Chemistry of Solids 67 (2006) 2395–2399 2399
![Exocyst Subunit EXO70H4 Has a Speci cRoleinCallose · Exocyst Subunit EXO70H4 Has a SpecificRoleinCallose Synthase Secretion and Silica Accumulation1[OPEN] Ivan Kulich,a,2,3 Zdeňka](https://img.pdfslide.fr/doc/110x75/5ebab63458adf26e4e7dd9bb/exocyst-subunit-exo70h4-has-a-speci-exocyst-subunit-exo70h4-has-a-speciicroleincallose.jpg)