A Framework for Context-Aware Service Recommendation for Mobile Users: A Focus on Mobility in Smart Cities
Une plateforme de recommandation contextuelle de services pourdes utilisateurs mobiles : le cas de la mobilité dans la villeintelligente
Nicolas Gutowski1,2, Tassadit Amghar2, Olivier Camp1, Slimane Hammoudi1
1 ESEO-TECH, {nicolas.gutowski,olivier.camp,slimane.hammoudi}@eseo.fr
2 LERIA, Université d’Angers (UBL), {amghar,gutowski}@info.univ-angers.fr
RÉSUMÉ. Depuis longtemps, les systèmes de recommandation aident les utilisateurs à choisir parmi de grands en-sembles de services. Dans l’environnement de la ville intelligente, pour gagner en précision, de tels systèmes de re-commandation doivent également tenir compte du contexte de l’utilisateur. Qu’est ce que le contexte d’un utilisateur et comment peut il être capturé ? Ce sont les deux questions auxquelles nous répondons dans cet article. Après avoir spé-cifié ce que nous entendons par le terme contexte nous montrons comment l’analyse de la mobilité urbaine permet de déduire des informations contextuelles riches. Le principal objectif de notre projet sera à terme de recommander des services en fonction du parcours estimé d’un usager dans la ville intelligente.ABSTRACT. Recommendations have long been a means of helping users select services. In a smart city environment, recommendation algorithms should take into account the user’s context to gain in accuracy. What is the context of a smart city user and how can it be captured ? These are the two questions we answer in this paper. After specifying what we understand by context information, we show how the city’s mobility pattern can be used to infer rich contextual information. The main objective of our project will be finally to recommend services according to an estimated trajectory of a user in the smart city.MOTS-CLÉS. Ville Intelligente, Mobilité Urbaine, Système de Recommandation, Contexte, Profil.KEYWORDS. Smart City, MCSC, Urban Mobility, Recommendation system, Context, Profile.
1. Introduction
Advances in sensors, IoT (Internet of Things), wireless communication, and information infrastruc-tures such as GPS, Wi-Fi, and mobile phone technology expose users to an enormous amount of mobileservices available anytime and anywhere (Georgakopoulos and Jayaraman, 2016). Nevertheless, consi-dering the large number of services, it is very difficult for a user to find, among them, those that are themost adapted to her current situation. Even worse, the user could, in a given situation, be unable to find arelevant service. To overcome these limitations, the smart city, through its communication infrastructureand information system, has the capacity of recommending to the user the most appropriate services ata given moment by considering people, services, providers, and locations together. In the same way asrecommendation systems have been used in various fields to pick the most adapted service according toa user’s previous behaviors and actions, it seems natural to develop mobile recommendation systems tosuggest the right services or informations to the right mobile users at a given time and place.
c© 2017 ISTE OpenScience – Published by ISTE Ltd. London, UK – openscience.fr Page | 1
Considering such possibilities, the smart city would thus become a real-time Information System sta-ging users, contexts and services and hence contributing to its users’ decision making process. As such,the smart city tends to reduce the gap between the physical and digital worlds. According to the SmartCity Council, a smart city can be considered as a city that uses information and communication tech-nologies to enhance its livability, workability, and sustainability. Mobile Crowd Sensing and Computing(MCSC) (Haderer, 2014; Guo et al., 2015) is a recent paradigm that encompasses the major smart cityissues for cross-space and large-scale sensing. It has resulted in the development of various sensing andcomputing applications in the field of smart cities (e.g., transportation, health-care, environment, urbanmobility, e-service provisioning).
A consequence of the recent development of smart city applications is a growing research activity inseveral topics such as : mobile contextual recommendation systems (Levandoski et al., 2012; Bao et al.,2015), urban mobility (Musa and Eriksson, 2012), context-aware modeling (Bouidghaghen et al., 2009)or Big (geo) Data processing and analytics (Cranshaw et al., 2012). These works use various methodsincluding reinforcement learning, filtering and clustering or Hidden Markov Model, to partly meet therequirements of smart cities. Moreover, those methods are enhanced by the rise of Big Data, whichconstitutes a new approach considered as the 4th scientific paradigm known as the “Big e-science” (Gray,2009). It seems important to take Big Data into account as smart city projects are generally in line withthe first 3 Vs of Big Data : Volume, Velocity, and Variety of data.
In the context of smart cities, personalization is a real challenge that focuses on bringing the servicesof a city closer to its citizens. The aim of our project is to design and implement a context-aware servicerecommendation system for mobile users in a smart city. Our system should be able to deliver the mostappropriate service to a given user according to her geolocation and surrounding environment at a giveninstant. Considering the fact that the choice of the right service is a time consuming operation, it maybe relevant in some cases to predict where the user will be in a near future in order to deliver a servicedepending on her future location and environing context. Thus, an important aspect of our work is topredict the location of mobile users in the smart city (Musa and Eriksson, 2012). In addition to real-timeprocessing and its required scalability (Wanigasekara et al., 2016), we will need to take into considerationother known issues such as : the cold start problem (Nguyen et al., 2014), the short life-span of services(Wei et al., 2017), and context-awareness (Galichet, 2015).
The contributions of this paper are threefold:
1. Context modeling and sensing, which should allow us to capture and model information that charac-terizes the situation of users (Hammoudi et al., 2015). Actually, the context-model is a centerpiecefor the design of a context-aware service recommendation system in mobile environments (Li et al.,2010; del Carmen Rodríguez-Hernández and Ilarri, 2016; Hermoso et al., 2015).
2. Study and prediction of urban mobility (Musa and Eriksson, 2012; Gambs et al., 2012) : The geo-location of the system’s users is, of course, a key element in the recommendation of geolocatedservices. The study of urban mobility patterns in the city should allow us to define a realistic mo-bility model capable of providing the necessary elements for the prediction of user routes and thus,their future geolocation.
3. Implementation of a prototype : In our case study, we evaluate our approach through the implemen-tation of a proof of concept framework that uses Wifilib, a citywide free Wi-Fi network deployed inAngers (France). We have developed a prototype (Ur-MoVe : Urban Mobility and Visualizer) that
c© 2017 ISTE OpenScience – Published by ISTE Ltd. London, UK – openscience.fr Page | 2
used Wifilib connection traces to allow the visualization and prediction of urban geolocation in acity. In this paper we discuss and focus on mobility data in the city of Angers (France).
Thus, the purpose of our article is to describe the MCSC framework we plan to build for our smart city.Moreover, our objective will be also to focus on the first results we have obtained concerning the Ur-Moveapplication, and what it can provide in terms of context data suitable for analysing urban dynamics.
The paper is organized as follows. Section 2 presents the related works concerning research on mobilecrowd sensing and computing (MCSC) applications and focuses more specifically on two aspects : re-commendation systems and human mobility analysis. Section 3 describes our proposed framework alongtwo dimensions : context and context-aware services, and context-aware recommendation systems. InSection 4 we go in depth into the analysis of urban mobility by presenting Ur-MoVe, the application wehave developed and its results about mobility and prediction. Finally, Section 5 presents our conclusionand perspectives.
2. Related Works on MCSC
Mobile Crowd Sensing and Computing (MCSC) is a new promising paradigm for cross-space and large scale sensing (Guo et al., 2015). MCSC is also useful from a computing point of view for recommen-dation systems. This paradigm encompasses a wide range of applications in very different domains : urban traffic monitoring, environment monitoring, transportation and traffic planning, urban dynamics sensing, location services, mobile recommendation, health care, public safety... Our work focuses on mobile context-aware recommendation and relies on urban dynamics sensing for context capture. It thus focuses on the two following main fields of research:
– Service recommendation: The main aim of our framework is to recommend services to users in a smart city using their profiles and surrounding environment according to their predicted location.
– Human urban mobility/behavior patterns: A user’s context is closely linked to her mobility and to the global mobility in her surrounding. Therefore, in order to define the context precisely, it seems important to analyze and study the city’s urban dynamics in order to extract mobility patterns. For this reason, our framework provides an urban mobility visualization tool. This tool also aims to estimate the next location of a given user. This estimated location of users will serve to enrich their context.
Service/activity recommendation is a wide field of research aimed at providing personalized sug-gestions of adaptive services and activities to mobile users. For example (Levandoski et al., 2012) proposeLARS, a Location-Aware Recommender System using location-based ratings to produce recommenda-tions, which are computed using a global item-based collaborative filtering (CF) method. Other workstend to use combined inputs for their recommendation system — e.g., (Zhang et al., 2013) propose aunified recommendation model for offline social events group recommendations. They consider loca-tion features, social features, and implicit patterns simultaneously. CF is considered as the most popularapproach used for recommendation systems (Wei et al., 2017). A parallel field of research focuses onlearning methods such as reinforcement learning or deep learning. It tends to advocate the use of hybridmethods in recommendation systems. For instance, (Wei et al., 2017) propose a hybrid method usingcollaborative filtering and deep neural network to find a solution to the cold start problem of newly ad-ded items to a preexisting pool of available items. Another approach is to use a reinforcement learning
c© 2017 ISTE OpenScience – Published by ISTE Ltd. London, UK – openscience.fr Page | 3
method to solve the historical multi-armed bandit problem coined by (Robbins, 1952). For example, thisis used for online or mobile user recommendation systems such as those described in (Bouneffouf, 2014).It uses different algorithms such as ε-Greedy, UCB (Auer, 2002) or contextual bandit problem solvingalgorithms such as LinUCB (Li et al., 2010), OFUL or CL-BESA (Galichet, 2015). The use of thosemethods allows the system to learn from the users and their interests from a pool of information. Theyrapidly allow the selection of a strategy that discriminates the non-relevant items and selects the itemswhich best match the users. After a sufficient number of rounds, this method tends to the best hidden pro-bability convergence of matches between users and the service that is recommended. Such methods havehigh computation needs and must perform numerous rounds to reach an acceptable level of precision. Forthis reason they seem relevant to be used in a context such as smart cities in which large amounts of dataproduced by a large number of mobile users provide a sufficient quantity of information in a short time.
Human mobility is the subject of many works which study the mobility and behavioral patternsin urban areas. Different methods are investigated and used to carry out such studies. For instance(Noulas et al., 2012) highlights mobility patterns using the check-in histories of Location Based So-cial Networks (LBSN) users. An LBSN is defined as : “a type of social networking in which geographicservices and capabilities such as geocoding and geotagging are used to enable additional social dyna-mics” (Bao et al., 2015). For instance, some studies use LBSNs for the recommendation of social events(Quercia et al., 2010), to discover user trajectories (Zheng and Zhou, 2011) or discover community-basedneighborhoods in a city (Cranshaw et al., 2012). However, these methods are only efficient and useful inthe case of very active social networks and a large amount of data is required to draw precise and repre-sentative conclusions. Other methods have been used to track smartphones and estimate their trajectoriesin a city using Wi-Fi. For example, (Musa and Eriksson, 2012) shows how Markov chains can be used toestimate trajectories using Wi-Fi connection traces.
In our case, LBSNs contain too little information concerning the city of Angers (France) for them tobe considered. Conversely, the existence of a city-wide free public Wi-Fi network with an infrastructureof 250 access points mainly in the city center, makes the Wi-Fi connection traces a very rich source ofdata from which location of users can be studied using methods such as Markov chains.
In the next section we describe our framework, which proposes solutions to several of the issues pre-sented above: data collection and sensing, data visualization and analysis, and implementation of a recommendation system for providing personalized services to mobile users in the smart city.
3. Our Proposed Framework
In the previous section, we have introduced the main research works in the field of Mobile CrowdSensing and Computing, some illustrated by Citizen Centered Smart City applications. These works tendto highlight the importance of concepts such as context and context-awareness, and recommendationsystems using artificial intelligence methods.
In this section we describe our proposed context-aware recommendation framework. First we willdefine the notions of context and what we understand by context-aware services. We then present themethod we use for the context-aware recommendation of services to mobile users.
c© 2017 ISTE OpenScience – Published by ISTE Ltd. London, UK – openscience.fr Page | 4
3.1. Context and Context-aware Services
The notion of context is the centerpiece of adaptability and personalization. Context-aware servicesconstitute a mobile computing paradigm in which applications implemented as combinations of servicescapture and take advantage of contextual information to deliver the relevant service to the right personat the right time. This contextual information might be e.g., the user’s location, date and time of day,neighboring users and devices, the user’s activity. The definition of context has been the subject of manyworks (Chen et al., 2004; Broll et al., 2007). According to the literature, the most popular definitionof the notion of context is given by (Dey, 2001) : “Context is any information that can be used tocharacterize the situation of an entity. An entity is a person, place, or object that is considered relevantto the interaction between a user and an application, including the user and applications themselves”.
(Hammoudi et al., 2015) have synthesized different definitions and approaches for the notion of contextand aimed to propose a generic context model which should satisfy the following three requirements :
– be sufficiently general to be used by different user centered mobile applications,
– be sufficiently specific to cover the main contextual entities proposed in the state of the art of context-aware mobile applications,
– be sufficiently flexible to allow an extension and to take into account new entities specific to a givenapplication domain.
Taking these three requirements into account, we are in line with Dey’s definition. However, we canspecify the context more precisely in particular for mobile crowd sensing and computing (Guo et al.,2015). Therefore, the two following remarks are considered in our approach :
1. A user should not need to interact explicitly with the application to receive recommendations.Pushed recommendations could be very relevant for mobile users and the system could decide torecommend a user a given service because of her current context.
2. The notion of context is defined in a very general manner and would benefit from being moreprecise. We argue that the profile and the environment are two main components of the context, andshould be defined precisely, specifically for mobile context-aware services.
Figure 1 illustrates our generic context model involving its main components. The figure also shows howour proposed framework interacts with the context model.
With respect to context-aware computing, our model focuses on the who, the where, the when andthe what (that is, what activities are occurring) of entities and uses this information to determine whya situation is occurring (Krumm, 2009). Among these 5 “w”, the why should thus be deduced from theother four “w” (who, where, when, what) which can be captured : user, location, time and activity.
– User: A person that has a state and a profile. A user evolves in an environment and uses computa-tional devices to invoke or receive services. The state of a user can be mobile or static.
– Profile: A profile is strongly attached to the user and contains the information that describes her. A user can have a dynamic and/or a static profile. The static profile gathers information that describes the user and that does not change over time (or very rarely). It can be the date of birth, name or gender. On the contrary, the user’s dynamic profile contains properties that can change over time and reflect her present situation — e.g., the user’s goals, preferences, intentions, desires, constraints. For
c© 2017 ISTE OpenScience – Published by ISTE Ltd. London, UK – openscience.fr Page | 5
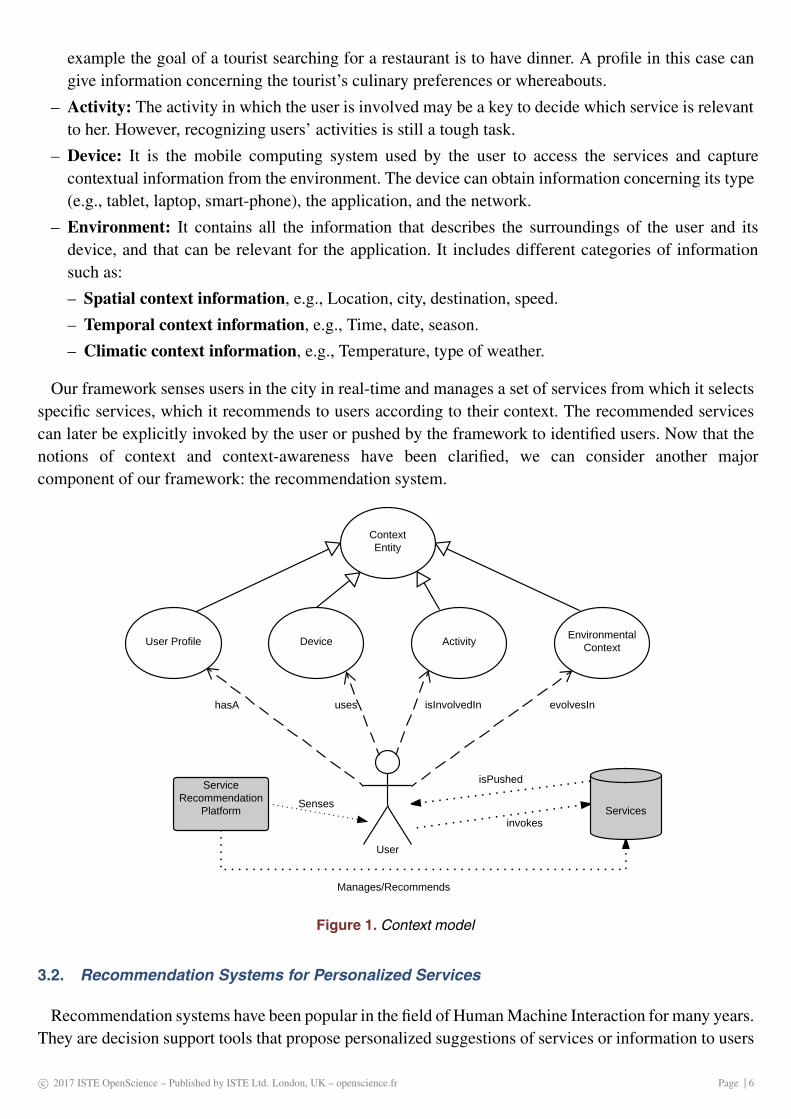
example the goal of a tourist searching for a restaurant is to have dinner. A profile in this case cangive information concerning the tourist’s culinary preferences or whereabouts.
– Activity: The activity in which the user is involved may be a key to decide which service is relevant to her. However, recognizing users’ activities is still a tough task.
– Device: It is the mobile computing system used by the user to access the services and capture contextual information from the environment. The device can obtain information concerning its type (e.g., tablet, laptop, smart-phone), the application, and the network.
– Environment: It contains all the information that describes the surroundings of the user and its device, and that can be relevant for the application. It includes different categories of information such as:
– Spatial context information, e.g., Location, city, destination, speed.
– Temporal context information, e.g., Time, date, season.
– Climatic context information, e.g., Temperature, type of weather.
Our framework senses users in the city in real-time and manages a set of services from which it selects specific services, which it recommends to users according to their context. The recommended services can later be explicitly invoked by the user or pushed by the framework to identified users. Now that the notions of context and context-awareness have been clarified, we can consider another major component of our framework: the recommendation system.
Figure 1. Context model
3.2. Recommendation Systems for Personalized Services
Recommendation systems have been popular in the field of Human Machine Interaction for many years.They are decision support tools that propose personalized suggestions of services or information to users
c© 2017 ISTE OpenScience – Published by ISTE Ltd. London, UK – openscience.fr Page | 6
according to who they are, what they like or what there habits are. Because of the growing quantityof available data, information recommendation systems have become very popular on the Internet torecommend products to customers of e-commerce websites, music or movies to users, or to providepersonalized travel information to tourists.
In the case of smart cities, the recommendation system should take in consideration the user’s contextand be a context-aware recommendation system. Just like Internet vendors combine the user profile withbrowsing or buying habits to recommend websites to visit, goods to buy or destination to visit here,our aim is to also consider data reflecting th actual life in the city and thus make the city a part of ourInformation System. The main challenge for the recommendation system is thus to fit the contextualinformation into traditional mathematical and systematic recommendation algorithms. Moreover, in thecase of Smart Cities, it is necessary to recommend a wide variety of services. Thus, we propose touse a service selection strategy that maximizes both the quality of recommendations and the diversityof recommended services. To solve these issues, we propose to consider our problem as a contextualmulti-armed bandit (CMAB) problem and use a reinforcement learning algorithm (LinUCB) to solve it.
According to the literature, LinUCB (Li et al., 2010), which is an “Upper Confidence Bounds algo-rithm”, has appeared to be the most effective and appropriate algorithm to be tested in our case study.Nevertheless, we will need to ensure the scalability of our method and ensure that it can cope with thelarge numbers of users and services present in the smart city.
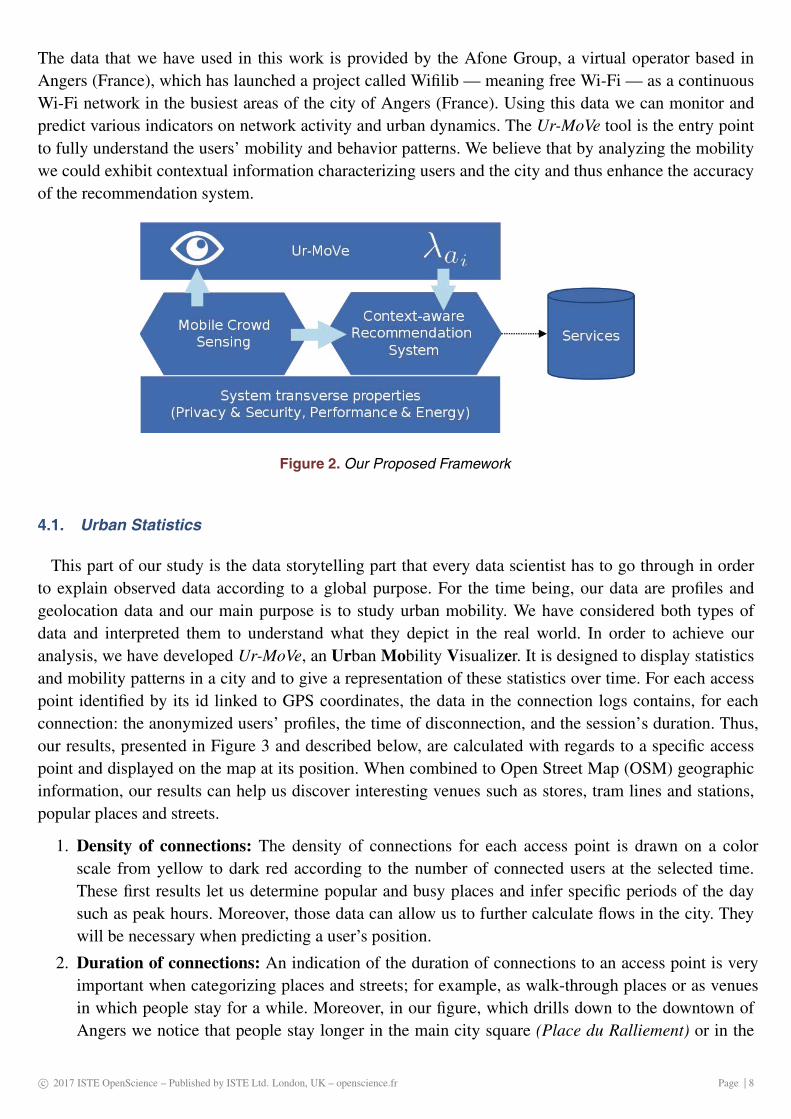
According to the descriptions given in subsection 3.1. and 3.2., we have designed a global framework, synthesized in Figure 2:
– The Mobile Crowd Sensing component senses data related to our mobile users in the smart city
– The Context-aware Recommendation System is the “Artificial Intelligence” component and allowsthe recommendation of services to mobile users.
– The Ur-MoVe component we have developed for studying the human mobility/activity and predictingthe geolocation of users in the city.
– Transverse issues such as security, privacy, performance, and energy consumption, will need to beconsidered in our future works and will be handled by a dedicated component.
3.3. Main Components of our Framework
More precisely, data sensed by the Mobile Crowd Sensing component is used as input by both Ur-MoVe, to carry out its predictions, and by the Context-aware Recommendation System, to be used ascontext data. Moreover, the prediction results obtained by Ur-MoVe (referred to as λai in the figure) arealso integrated in user contexts and considered by the Recommendation System.
4. Urban Mobility and Prediction with Ur-MoVe
The global description of our framework has introduced key concepts such as context, context-awarenessand recommendation systems. In this section, we will concentrate on a critical part of our framework: the Ur-MoVe prediction and visualization tool that we have developed. Ur-MoVe is able to visualize and predict the mobility of users through the analysis of their connection traces to a citywide Wi-Fi network.
c© 2017 ISTE OpenScience – Published by ISTE Ltd. London, UK – openscience.fr Page | 7
The data that we have used in this work is provided by the Afone Group, a virtual operator based inAngers (France), which has launched a project called Wifilib — meaning free Wi-Fi — as a continuousWi-Fi network in the busiest areas of the city of Angers (France). Using this data we can monitor andpredict various indicators on network activity and urban dynamics. The Ur-MoVe tool is the entry pointto fully understand the users’ mobility and behavior patterns. We believe that by analyzing the mobilitywe could exhibit contextual information characterizing users and the city and thus enhance the accuracyof the recommendation system.
Figure 2. Our Proposed Framework
4.1. Urban Statistics
This part of our study is the data storytelling part that every data scientist has to go through in order to explain observed data according to a global purpose. For the time being, our data are profiles and geolocation data and our main purpose is to study urban mobility. We have considered both types of data and interpreted them to understand what they depict in the real world. In order to achieve our analysis, we have developed Ur-MoVe, an Urban Mobility Visualizer. It is designed to display statistics and mobility patterns in a city and to give a representation of these statistics over time. For each access point identified by its id linked to GPS coordinates, the data in the connection logs contains, for each connection: the anonymized users’ profiles, the time of disconnection, and the session’s duration. Thus, our results, presented in Figure 3 and described below, are calculated with regards to a specific access point and displayed on the map at its position. When combined to Open Street Map (OSM) geographic information, our results can help us discover interesting venues such as stores, tram lines and stations, popular places and streets.
1. Density of connections: The density of connections for each access point is drawn on a color scale from yellow to dark red according to the number of connected users at the selected time. These first results let us determine popular and busy places and infer specific periods of the day such as peak hours. Moreover, those data can allow us to further calculate flows in the city. They will be necessary when predicting a user’s position.
2. Duration of connections: An indication of the duration of connections to an access point is very important when categorizing places and streets; for example, as walk-through places or as venues in which people stay for a while. Moreover, in our figure, which drills down to the downtown of Angers we notice that people stay longer in the main city square (Place du Ralliement) or in the
c© 2017 ISTE OpenScience – Published by ISTE Ltd. London, UK – openscience.fr Page | 8
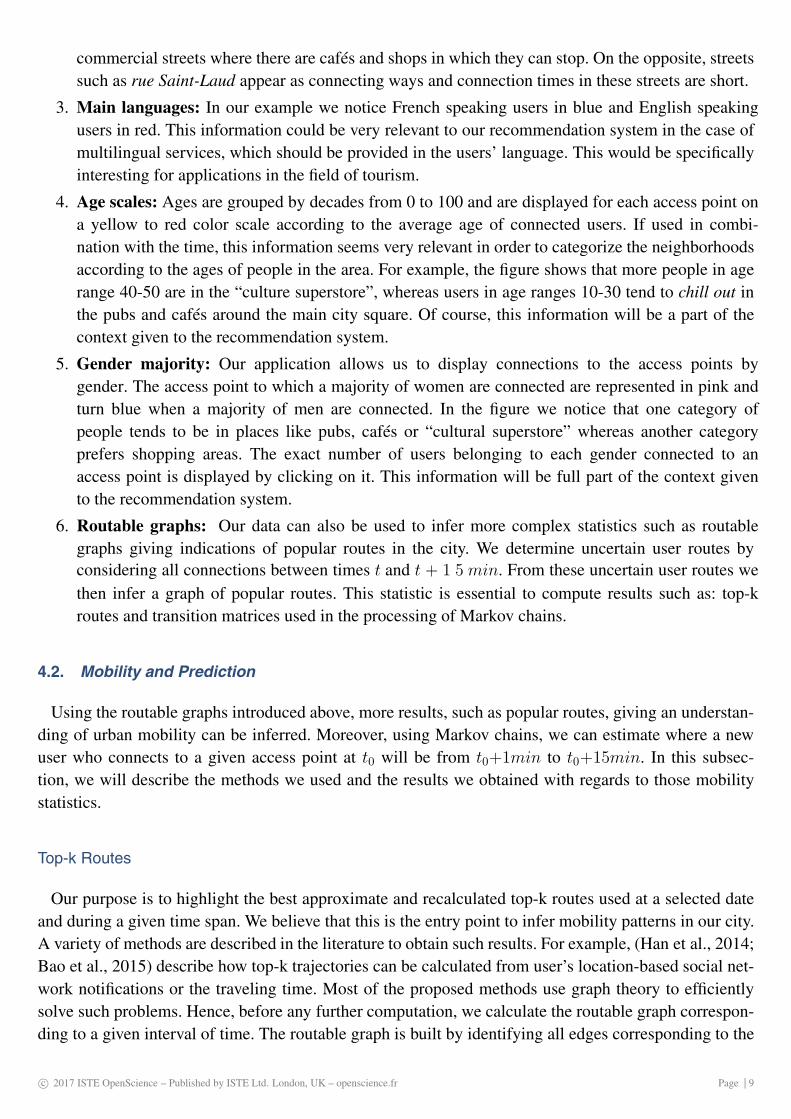
commercial streets where there are cafés and shops in which they can stop. On the opposite, streetssuch as rue Saint-Laud appear as connecting ways and connection times in these streets are short.
3. Main languages: In our example we notice French speaking users in blue and English speaking users in red. This information could be very relevant to our recommendation system in the case of multilingual services, which should be provided in the users’ language. This would be specifically interesting for applications in the field of tourism.
4. Age scales: Ages are grouped by decades from 0 to 100 and are displayed for each access point on a yellow to red color scale according to the average age of connected users. If used in combi-nation with the time, this information seems very relevant in order to categorize the neighborhoods according to the ages of people in the area. For example, the figure shows that more people in age range 40-50 are in the “culture superstore”, whereas users in age ranges 10-30 tend to chill out in the pubs and cafés around the main city square. Of course, this information will be a part of the context given to the recommendation system.
5. Gender majority: Our application allows us to display connections to the access points by gender. The access point to which a majority of women are connected are represented in pink and turn blue when a majority of men are connected. In the figure we notice that one category of people tends to be in places like pubs, cafés or “cultural superstore” whereas another category prefers shopping areas. The exact number of users belonging to each gender connected to an access point is displayed by clicking on it. This information will be full part of the context given to the recommendation system.
6. Routable graphs: Our data can also be used to infer more complex statistics such as routable graphs giving indications of popular routes in the city. We determine uncertain user routes by considering all connections between times t and t + 1 5min. From these uncertain user routes we then infer a graph of popular routes. This statistic is essential to compute results such as: top-k routes and transition matrices used in the processing of Markov chains.
4.2. Mobility and Prediction
Using the routable graphs introduced above, more results, such as popular routes, giving an understan-ding of urban mobility can be inferred. Moreover, using Markov chains, we can estimate where a newuser who connects to a given access point at t0 will be from t0+1min to t0+15min. In this subsec-tion, we will describe the methods we used and the results we obtained with regards to those mobilitystatistics.
Top-k Routes
Our purpose is to highlight the best approximate and recalculated top-k routes used at a selected dateand during a given time span. We believe that this is the entry point to infer mobility patterns in our city.A variety of methods are described in the literature to obtain such results. For example, (Han et al., 2014;Bao et al., 2015) describe how top-k trajectories can be calculated from user’s location-based social net-work notifications or the traveling time. Most of the proposed methods use graph theory to efficientlysolve such problems. Hence, before any further computation, we calculate the routable graph correspon-ding to a given interval of time. The routable graph is built by identifying all edges corresponding to the
c© 2017 ISTE OpenScience – Published by ISTE Ltd. London, UK – openscience.fr Page | 9
transition between a disconnection from an access point followed by a connection to another one, over a given time period. The weight of each edge is initialized with the value of 1. It is then incremented each time a transition between the two same access points is observed. The resulting routable graph is the star-ting point of all route-related calculations. For example, the top-routes in a given interval are calculated as follows:
1. For each user u ∈ U , compute the list Lu of all her routes l ∈ Lu that occurred in the last 15minutes. We consider a user’s route l as being a set of at most five of her connections cu,i;∀i ∈[1, 5] to different access points ai ordered by timestamp over the interval T = [t, t + 15min]. LetL =
⋃
∀u∈ULu be the set of all 4-segment routes fu,j; j ∈ [1, 4] for all the users.
2. Sum each segment flows fj of all routes l ∈ L. This corresponds to the user flows between eachpair of access points between t and t + 15min. This enables us to highlight the best segments foran approximate and recalculated route l.
3. Compute the top-1 recalculated route by selecting argmaxfj∈l∑5
j=1 fj
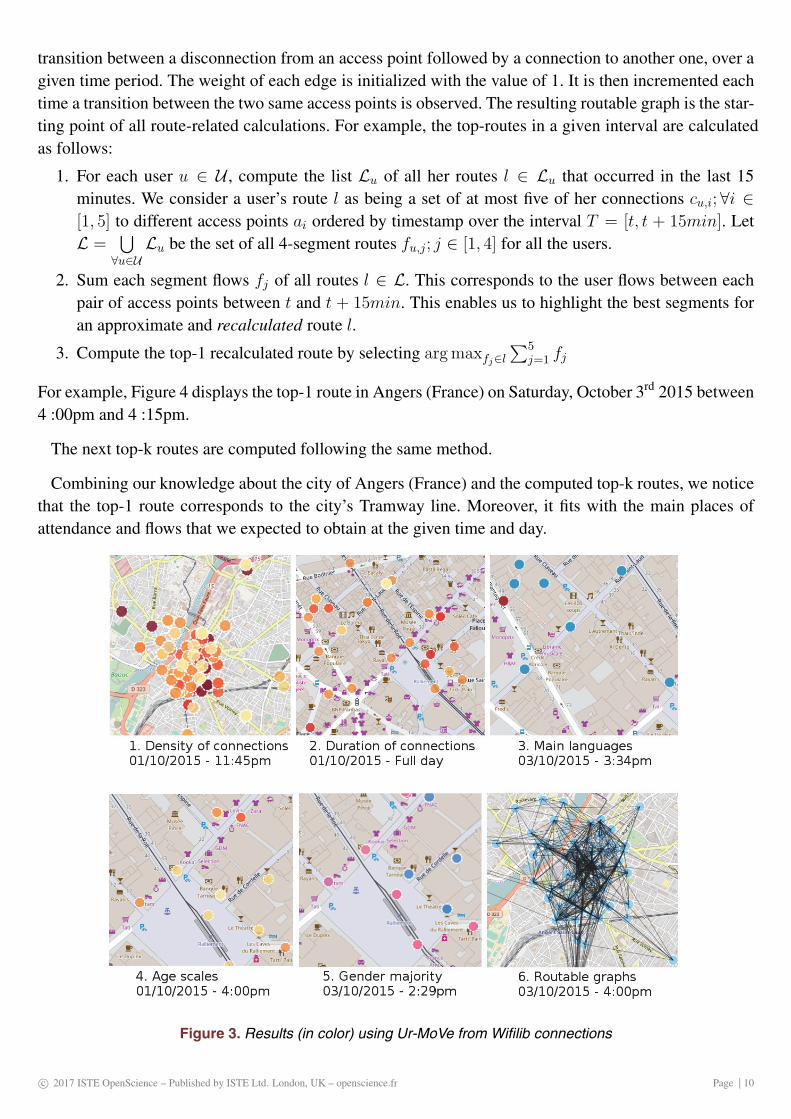
For example, Figure 4 displays the top-1 route in Angers (France) on Saturday, October 3rd 2015 between4 :00pm and 4 :15pm.
The next top-k routes are computed following the same method.
Combining our knowledge about the city of Angers (France) and the computed top-k routes, we noticethat the top-1 route corresponds to the city’s Tramway line. Moreover, it fits with the main places ofattendance and flows that we expected to obtain at the given time and day.
Figure 3. Results (in color) using Ur-MoVe from Wifilib connections
c© 2017 ISTE OpenScience – Published by ISTE Ltd. London, UK – openscience.fr Page | 10
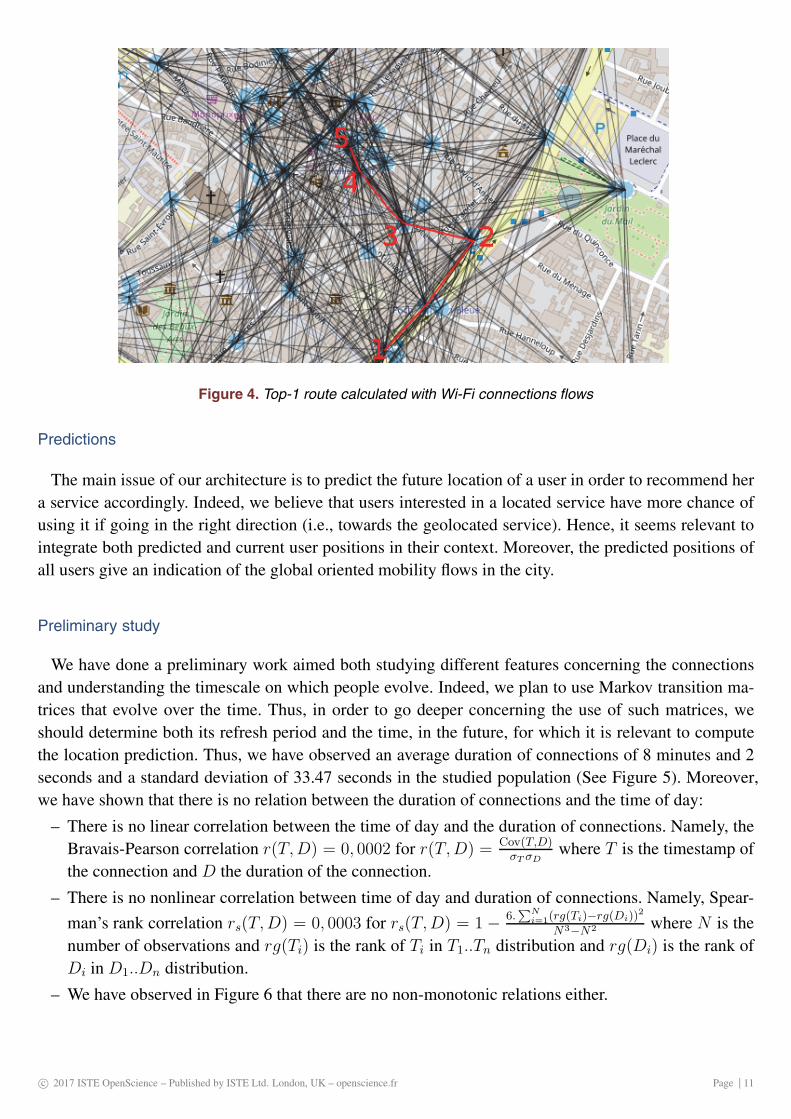
Figure 4. Top-1 route calculated with Wi-Fi connections flows
Predictions
The main issue of our architecture is to predict the future location of a user in order to recommend hera service accordingly. Indeed, we believe that users interested in a located service have more chance ofusing it if going in the right direction (i.e., towards the geolocated service). Hence, it seems relevant tointegrate both predicted and current user positions in their context. Moreover, the predicted positions ofall users give an indication of the global oriented mobility flows in the city.
Preliminary study
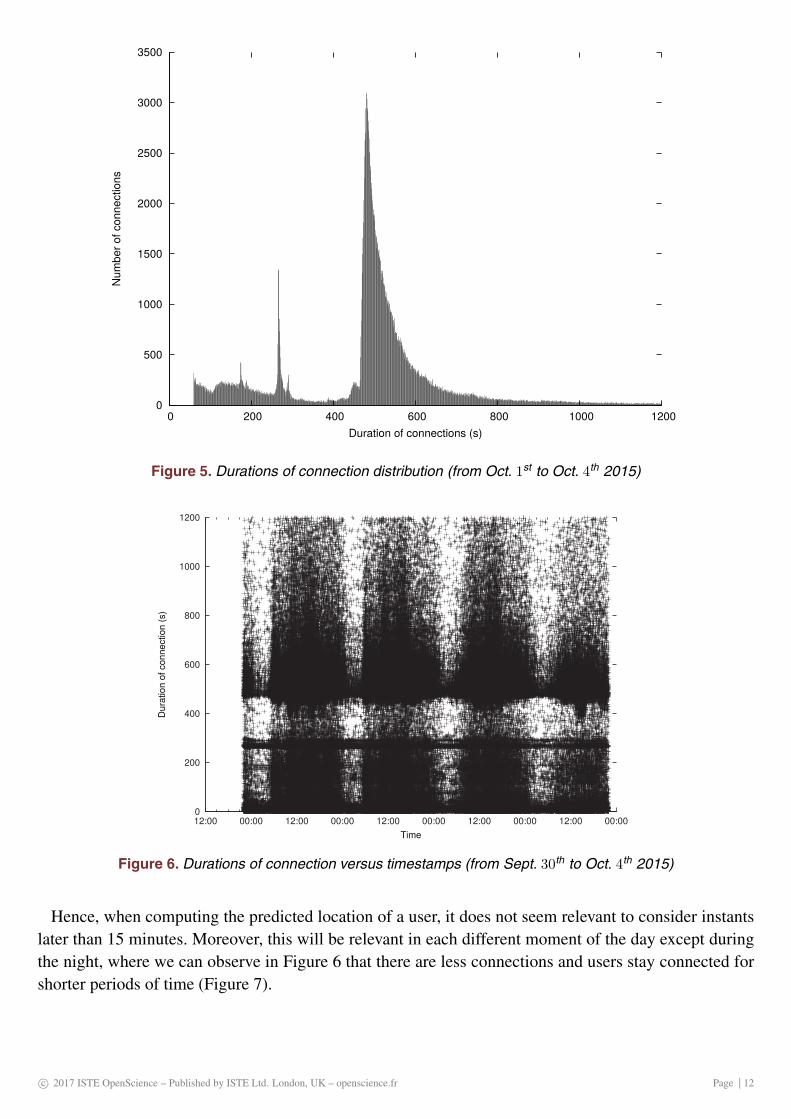
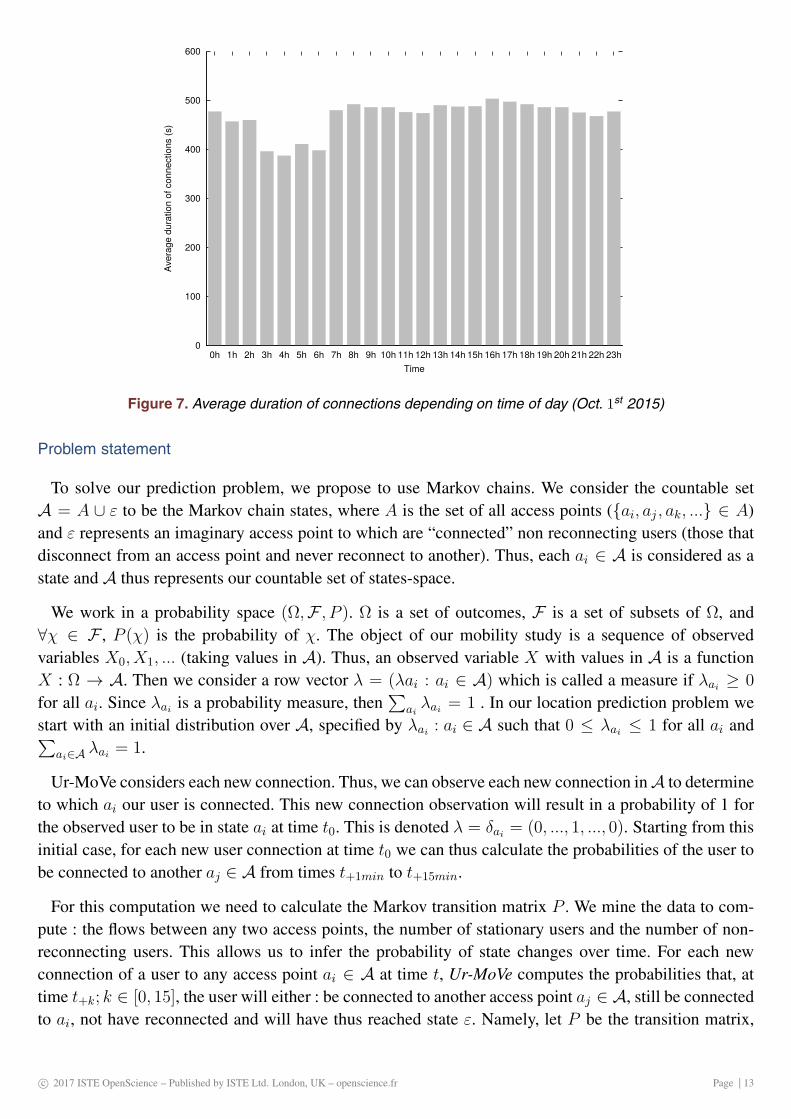
We have done a preliminary work aimed both studying different features concerning the connections and understanding the timescale on which people evolve. Indeed, we plan to use Markov transition ma-trices that evolve over the time. Thus, in order to go deeper concerning the use of such matrices, we should determine both its refresh period and the time, in the future, for which it is relevant to compute the location prediction. Thus, we have observed an average duration of connections of 8 minutes and 2 seconds and a standard deviation of 33.47 seconds in the studied population (See Figure 5). Moreover, we have shown that there is no relation between the duration of connections and the time of day:
– There is no linear correlation between the time of day and the duration of connections. Namely, theBravais-Pearson correlation r(T,D) = 0, 0002 for r(T,D) = Cov(T,D)
σT σDwhere T is the timestamp of
the connection and D the duration of the connection.
– There is no nonlinear correlation between time of day and duration of connections. Namely, Spear-
man’s rank correlation rs(T,D) = 0, 0003 for rs(T,D) = 1 − 6.∑N
i=1(rg(Ti)−rg(Di))2
N3−N2 where N is thenumber of observations and rg(Ti) is the rank of Ti in T1..Tn distribution and rg(Di) is the rank ofDi in D1..Dn distribution.
– We have observed in Figure 6 that there are no non-monotonic relations either.
c© 2017 ISTE OpenScience – Published by ISTE Ltd. London, UK – openscience.fr Page | 11
0
500
1000
1500
2000
2500
3000
3500
0 200 400 600 800 1000 1200
Nu
mb
er
of
co
nn
ectio
ns
Duration of connections (s)
Figure 5. Durations of connection distribution (from Oct. 1st to Oct. 4th 2015)
0
200
400
600
800
1000
1200
12:00 00:00 12:00 00:00 12:00 00:00 12:00 00:00 12:00 00:00
Dur
atio
n of
con
nect
ion
(s)
Time
Figure 6. Durations of connection versus timestamps (from Sept. 30th to Oct. 4th 2015)
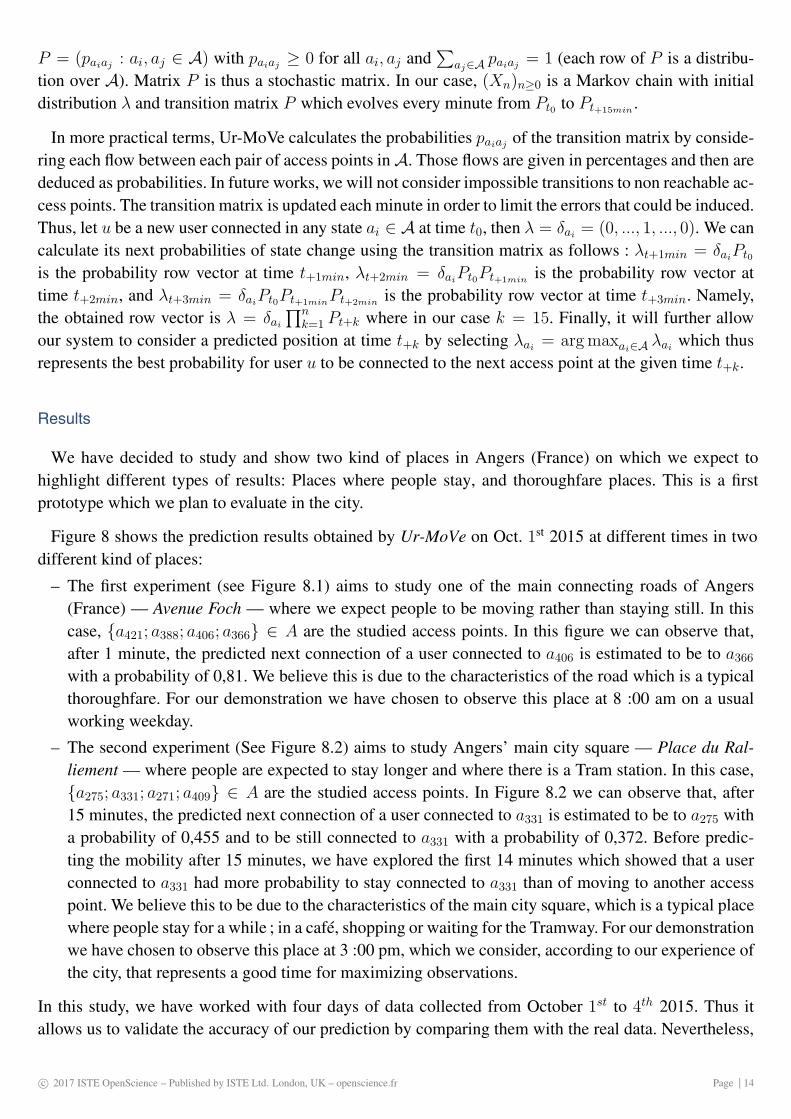
Hence, when computing the predicted location of a user, it does not seem relevant to consider instantslater than 15 minutes. Moreover, this will be relevant in each different moment of the day except duringthe night, where we can observe in Figure 6 that there are less connections and users stay connected forshorter periods of time (Figure 7).
c© 2017 ISTE OpenScience – Published by ISTE Ltd. London, UK – openscience.fr Page | 12
0
100
200
300
400
500
600
0h 1h 2h 3h 4h 5h 6h 7h 8h 9h 10h 11h 12h 13h 14h 15h 16h 17h 18h 19h 20h 21h 22h 23h
Ave
rag
e d
ura
tio
n o
f co
nn
ectio
ns (
s)
Time
Figure 7. Average duration of connections depending on time of day (Oct. 1st 2015)
Problem statement
To solve our prediction problem, we propose to use Markov chains. We consider the countable setA = A ∪ ε to be the Markov chain states, where A is the set of all access points ({ai, aj , ak, ...} ∈ A)and ε represents an imaginary access point to which are “connected” non reconnecting users (those thatdisconnect from an access point and never reconnect to another). Thus, each ai ∈ A is considered as astate and A thus represents our countable set of states-space.
We work in a probability space (Ω,F , P ). Ω is a set of outcomes, F is a set of subsets of Ω, and∀χ ∈ F , P (χ) is the probability of χ. The object of our mobility study is a sequence of observedvariables X0, X1, ... (taking values in A). Thus, an observed variable X with values in A is a functionX : Ω → A. Then we consider a row vector λ = (λai : ai ∈ A) which is called a measure if λai ≥ 0
for all ai. Since λai is a probability measure, then∑
aiλai = 1 . In our location prediction problem we
start with an initial distribution over A, specified by λai : ai ∈ A such that 0 ≤ λai ≤ 1 for all ai and∑
ai∈A λai = 1.
Ur-MoVe considers each new connection. Thus, we can observe each new connection in A to determineto which ai our user is connected. This new connection observation will result in a probability of 1 forthe observed user to be in state ai at time t0. This is denoted λ = δai = (0, ..., 1, ..., 0). Starting from thisinitial case, for each new user connection at time t0 we can thus calculate the probabilities of the user tobe connected to another aj ∈ A from times t+1min to t+15min.
For this computation we need to calculate the Markov transition matrix P . We mine the data to com-pute : the flows between any two access points, the number of stationary users and the number of non-reconnecting users. This allows us to infer the probability of state changes over time. For each newconnection of a user to any access point ai ∈ A at time t, Ur-MoVe computes the probabilities that, attime t+k; k ∈ [0, 15], the user will either : be connected to another access point aj ∈ A, still be connectedto ai, not have reconnected and will have thus reached state ε. Namely, let P be the transition matrix,
c© 2017 ISTE OpenScience – Published by ISTE Ltd. London, UK – openscience.fr Page | 13
P = (paiaj : ai, aj ∈ A) with paiaj ≥ 0 for all ai, aj and∑
aj∈A paiaj = 1 (each row of P is a distribu-tion over A). Matrix P is thus a stochastic matrix. In our case, (Xn)n≥0 is a Markov chain with initialdistribution λ and transition matrix P which evolves every minute from Pt0 to Pt+15min .
In more practical terms, Ur-MoVe calculates the probabilities paiaj of the transition matrix by conside-ring each flow between each pair of access points in A. Those flows are given in percentages and then arededuced as probabilities. In future works, we will not consider impossible transitions to non reachable ac-cess points. The transition matrix is updated each minute in order to limit the errors that could be induced.Thus, let u be a new user connected in any state ai ∈ A at time t0, then λ = δai = (0, ..., 1, ..., 0). We cancalculate its next probabilities of state change using the transition matrix as follows : λt+1min = δaiPt0
is the probability row vector at time t+1min, λt+2min = δaiPt0Pt+1min is the probability row vector attime t+2min, and λt+3min = δaiPt0Pt+1minPt+2min is the probability row vector at time t+3min. Namely,the obtained row vector is λ = δai
∏nk=1 Pt+k where in our case k = 15. Finally, it will further allow
our system to consider a predicted position at time t+k by selecting λai = argmaxai∈A λai which thusrepresents the best probability for user u to be connected to the next access point at the given time t+k.
Results
We have decided to study and show two kind of places in Angers (France) on which we expect to highlight different types of results: Places where people stay, and thoroughfare places. This is a first prototype which we plan to evaluate in the city.
Figure 8 shows the prediction results obtained by Ur-MoVe on Oct. 1st 2015 at different times in two different kind of places:
– The first experiment (see Figure 8.1) aims to study one of the main connecting roads of Angers(France) — Avenue Foch — where we expect people to be moving rather than staying still. In thiscase, {a421; a388; a406; a366} ∈ A are the studied access points. In this figure we can observe that,after 1 minute, the predicted next connection of a user connected to a406 is estimated to be to a366with a probability of 0,81. We believe this is due to the characteristics of the road which is a typicalthoroughfare. For our demonstration we have chosen to observe this place at 8 :00 am on a usualworking weekday.
– The second experiment (See Figure 8.2) aims to study Angers’ main city square — Place du Ral-liement — where people are expected to stay longer and where there is a Tram station. In this case,{a275; a331; a271; a409} ∈ A are the studied access points. In Figure 8.2 we can observe that, after15 minutes, the predicted next connection of a user connected to a331 is estimated to be to a275 witha probability of 0,455 and to be still connected to a331 with a probability of 0,372. Before predic-ting the mobility after 15 minutes, we have explored the first 14 minutes which showed that a userconnected to a331 had more probability to stay connected to a331 than of moving to another accesspoint. We believe this to be due to the characteristics of the main city square, which is a typical placewhere people stay for a while ; in a café, shopping or waiting for the Tramway. For our demonstrationwe have chosen to observe this place at 3 :00 pm, which we consider, according to our experience ofthe city, that represents a good time for maximizing observations.
In this study, we have worked with four days of data collected from October 1st to 4th 2015. Thus itallows us to validate the accuracy of our prediction by comparing them with the real data. Nevertheless,
c© 2017 ISTE OpenScience – Published by ISTE Ltd. London, UK – openscience.fr Page | 14
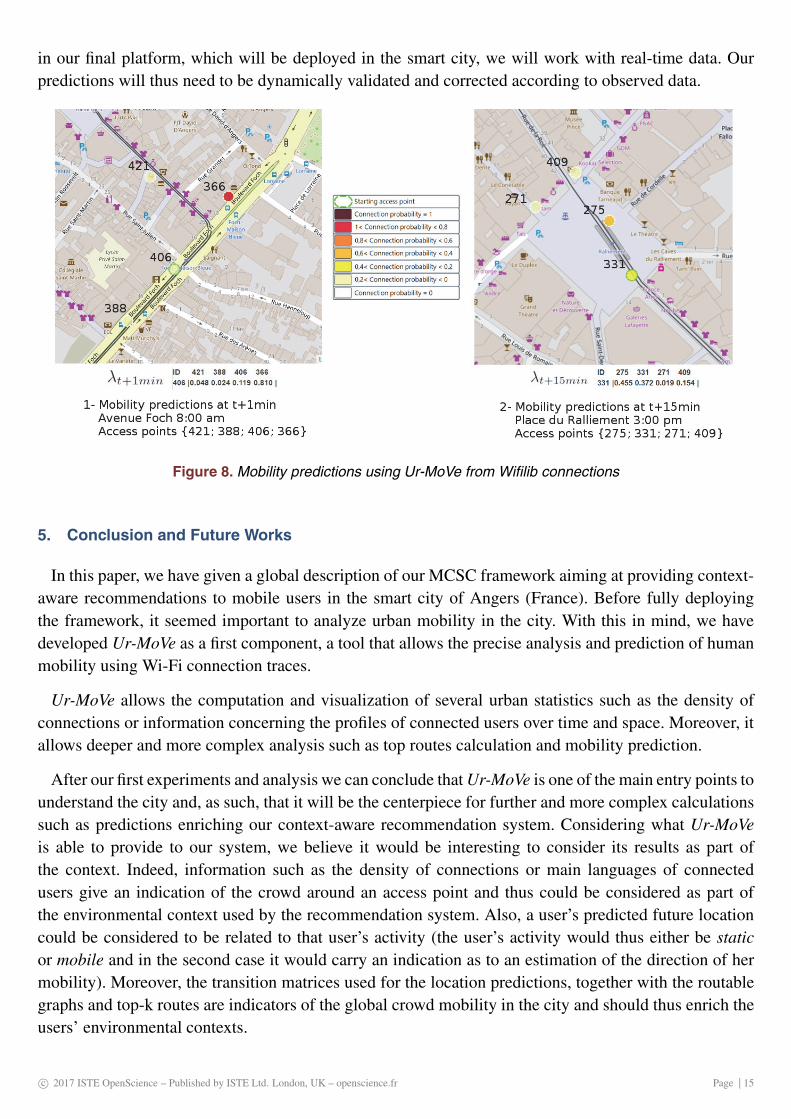
in our final platform, which will be deployed in the smart city, we will work with real-time data. Ourpredictions will thus need to be dynamically validated and corrected according to observed data.
Figure 8. Mobility predictions using Ur-MoVe from Wifilib connections
5. Conclusion and Future Works
In this paper, we have given a global description of our MCSC framework aiming at providing context-aware recommendations to mobile users in the smart city of Angers (France). Before fully deployingthe framework, it seemed important to analyze urban mobility in the city. With this in mind, we havedeveloped Ur-MoVe as a first component, a tool that allows the precise analysis and prediction of humanmobility using Wi-Fi connection traces.
Ur-MoVe allows the computation and visualization of several urban statistics such as the density ofconnections or information concerning the profiles of connected users over time and space. Moreover, itallows deeper and more complex analysis such as top routes calculation and mobility prediction.
After our first experiments and analysis we can conclude that Ur-MoVe is one of the main entry points tounderstand the city and, as such, that it will be the centerpiece for further and more complex calculationssuch as predictions enriching our context-aware recommendation system. Considering what Ur-MoVeis able to provide to our system, we believe it would be interesting to consider its results as part ofthe context. Indeed, information such as the density of connections or main languages of connectedusers give an indication of the crowd around an access point and thus could be considered as part ofthe environmental context used by the recommendation system. Also, a user’s predicted future locationcould be considered to be related to that user’s activity (the user’s activity would thus either be staticor mobile and in the second case it would carry an indication as to an estimation of the direction of hermobility). Moreover, the transition matrices used for the location predictions, together with the routablegraphs and top-k routes are indicators of the global crowd mobility in the city and should thus enrich theusers’ environmental contexts.
c© 2017 ISTE OpenScience – Published by ISTE Ltd. London, UK – openscience.fr Page | 15
To the best of our knowledge only few works using both location prediction and global urban mobilityhave been proposed in recommendation systems (Assam et al., 2016) and hence represent an interestingdirection of research to explore for our future works.
Bibliographie
R. Assam, S. Sathyanarayana, and T. Seidl. Infusing geo-recency mixture models for effective location prediction inLBSN. In Proceedings of the 2016 SIAM International Conference on Data Mining, pages 855–863. SIAM, 2016.
P. Auer. Using confidence bounds for exploitation-exploration trade-offs. Journal of Machine Learning Research, 3(Nov) :397–422, 2002.
J. Bao, Y. Zheng, D. Wilkie, and M. F. Mokbel. Recommendations in location-based social networks : a survey. Geoin-formatica, 19(3) :525–565, 2015.
O. Bouidghaghen, L. Tamine-Lechani, and M. Boughanem. Vers la définition du contexte d’un utilisateur mobile desystème de recherche d’information. In D. Menga and F. Sèdes, editors, Proceedings of the 5th Fancophone Conferenceon Mobility and Ubiquitous Computing, volume 394 of ACM International Conference Proceeding Series, pages 25–31,Lille, France, 2009. ACM.
D. Bouneffouf. Recommandation mobile, sensible au contexte de contenus évolutifs : Contextuel-e-greedy. arXiv preprintarXiv :1402.1986, 2014.
G. Broll, H. Hußmann, G. N. Prezerakos, G. Kapitsaki, and S. Salsano. Modeling context information for realizing simplemobile services. In Proceedings of the 16th IST Mobile & Wireless Communications Summit, Budapest, Hungary, July2007. IEEE.
H. Chen, F. Perich, T. Finin, and A. Joshi. SOUPA : Standard Ontology for Ubiquitous and Pervasive Applications. InInternational Conference on Mobile and Ubiquitous Systems : Networking and Services, pages 258–267, Boston, USA,2004. IEEE.
J. Cranshaw, R. Schwartz, J. I. Hong, and N. Sadeh. The Livehoods project : Utilizing social media to understand thedynamics of a city. In International AAAI Conference on Weblogs and Social Media, page 58, Dublin, Ireland, 2012. TheAAAI Press.
M. del Carmen Rodríguez-Hernández and S. Ilarri. Pull-based recommendations in mobile environments. ComputerStandards & Interfaces, 44 :185 – 204, 2016. ISSN 0920-5489.
A. K. Dey. Understanding and using context. Personal Ubiquitous Computing, 5(1) :4–7, jan 2001. ISSN 1617-4909.doi : 10.1007/s007790170019.
N. Galichet. Contributions to Multi-Armed Bandits : Risk-Awareness and Sub-Sampling for Linear Contextual Bandits.PhD thesis, Université Paris-Sud, 2015.
S. Gambs, M.-O. Killijian, and M. N. n. del Prado Cortez. Next place prediction using mobility markov chains. InProceedings of the First Workshop on Measurement, Privacy, and Mobility, MPM ’12, pages 3 :1–3 :6, New York, NY,USA, 2012. ACM. ISBN 978-1-4503-1163-2.
D. Georgakopoulos and P. P. Jayaraman. Internet of Things : from internet scale sensing to smart services. Computing, 98(10) :1041–1058, 2016.
J. Gray. Jim Gray on eScience : A transformed scientific method. The fourth paradigm : Data-intensive scientific discovery,1, 2009.
B. Guo, Z. Wang, Z. Yu, Y. Wang, N. Y. Yen, and et al. Mobile crowd sensing and computing : The review of an emerginghuman-powered sensing paradigm. ACM Computing Surveys (CSUR), 48(1), 2015.
N. Haderer. APISENSE R© : une plate-forme répartie pour la conception, le déploiement et l’exécution de campagnes decollecte de données sur des terminaux intelligents. PhD thesis, Université des Sciences et Technologie de Lille-Lille I,2014.
S. Hammoudi, V. Monfort, and O. Camp. Model driven development of user-centred context aware services. IJSSC, 5(2) :100–114, 2015.
Y. Han, L. Chang, W. Zhang, X. Lin, and L. Wang. Databases Theory and Applications, Proceedings of the 25th Australa-sian Database Conference, ADC 2014., volume 8506 of Lecture Notes in Computer Science, chapter Efficiently RetrievingTop-k Trajectories by Locations via Traveling Time., pages 122–134. Springer, Brisbane, QLD, Australia., July 14-16.2014.

R. Hermoso, S. Ilarri, R. Trillo, and M. del Carmen Rodríguez-Hernández. Push-based recommendations in mobilecomputing using a multi-layer contextual approach. In Proceedings of the 13th International Conference on Advancesin Mobile Computing and Multimedia, MoMM 2015, pages 149–158, New York, NY, USA, 2015. ACM. ISBN 978-1-4503-3493-8.
J. Krumm. A survey of computational location privacy. Personal and Ubiquitous Computing, 13(6) :391–399, 2009.
J. J. Levandoski, M. Sarwat, A. Eldawy, and M. F. Mokbel. LARS : A location-aware recommender system. In 2012 IEEE28th International Conference on Data Engineering, pages 450–461, Washington, DC, USA., 2012. IEEE.
L. Li, W. Chu, J. Langford, and R. E. Schapire. A contextual-bandit approach to personalized news article recommendation.In Proceedings of the 19th International Conference on World Wide Web, pages 661–670, Raleigh, North Carolina, USA.,2010. ACM.
A. Musa and J. Eriksson. Tracking unmodified smartphones using Wi-Fi monitors. In Proceedings of the 10th ACMconference on embedded network sensor systems, pages 281–294, Toronto, Ontario, Canada, November 06-09 2012. ACM.
H. T. Nguyen, J. Mary, and P. Preux. Cold-start problems in recommendation systems via contextual-bandit algorithms.CoRR, abs/1405.7544, 2014.
A. Noulas, S. Scellato, R. Lambiotte, M. Pontil, and C. Mascolo. A tale of many cities : universal patterns in human urbanmobility. PloS one, 7(5) :e37027, 2012.
D. Quercia, N. Lathia, F. Calabrese, G. Di Lorenzo, and J. Crowcroft. Recommending social events from mobile phonelocation data. In 2010 IEEE International Conference on Data Mining, pages 971–976, Sydney, Australia, December13-17 2010. IEEE.
H. Robbins. Some aspects of the sequential design of experiments. Bulletin of the American Mathematical Society, pages527–535, 1952.
N. Wanigasekara, J. Schmalfuss, D. Carlson, and D. S. Rosenblum. A bandit approach for intelligent IoT service compo-sition across heterogeneous smart spaces. In Proceedings of the 6th International Conference on the Internet of Things,pages 121–129, Stuttgart, Germany, November 07-09 2016. ACM.
J. Wei, J. He, K. Chen, Y. Zhou, and Z. Tang. Collaborative filtering and deep learning based recommendation system forcold start items. Expert Systems with Applications, 69 :29–39, 2017.
W. Zhang, J. Wang, and W. Feng. Combining latent factor model with location features for event-based group recommen-dation. In Proceedings of the 19th ACM SIGKDD International Conference on Knowledge Discovery and Data Mining,pages 910–918, Chicago, Illinois, USA, 2013. ACM.
Y. Zheng and X. Zhou. Computing with spatial trajectories. Springer Science & Business Media, New York City, USA.,1st edition, 2011.
c© 2017 ISTE OpenScience – Published by ISTE Ltd. London, UK – openscience.fr Page | 17
Recommended