99
Morphological evidence for a subpopulationselection effect by estrogen and antiestrogentreatments in the heterogeneous MCF-7 cellline
Jacqueline Palmaria,∗, France Walletb,Julien Berardb, Yolande Berthoisb,Pierre Marie Martinb and Christophe Dussertb
aDépartement de Physique des InteractionsPhotons-Matière, case EC1, Faculté des Sciences deSt Jérôme, 13397, Marseille Cedex 20, Franceb Laboratoire de Cancérologie Expérimentale, IFRJean Roche, Faculté de Médecine Secteur Nord,Boulevard Pierre Dramard, 13916 MarseilleCedex 20, France
Received 6 October 1999
Accepted 3 March 2000
Recently, we developed a method to quantitatively study tu-mour cell heterogeneity in terms of both nuclear size andestrogen receptor (ER) content by image cytometry. Themethod, previously used to analyse the proliferation of thebreast cancer cell line MCF-7, was applied here to analysethe growth of this cell line under estradiol (E2), hydroxyta-moxifen (OH-TAM), and both E2 and OH-TAM treatments.The method extracts characteristic parameters of single nu-clei and features that measure the global and local organisa-tion of the cells in their growing phase. Modifications of theheterogeneity of the cell line are emphasised through pheno-typic changes and modifications of the spatial organisation ofthe cells. The hormone (E2) generates a very fast growth ofcells with small nuclei that became ER negative in the longterm. The antihormone (OH-TAM) produces a gradual selec-tion of ER negative or poorly positive cells with large nuclei.These modifications are reversed when E2 and OH-TAM aresimultaneously used. Moreover, estradiol induces a permis-sive context of proliferation, whereas hydroxytamoxifen acts
* Correspondence to: Dr Jacqueline Palmari, Laboratoire de Can-cérologie Expérimentale, Faculté de Médecine Secteur Nord, Boule-vard Pierre Dramard, 13916 Marseille Cedex 20, France. Tel.: +334 91 69 88 82; Fax: +33 4 91 09 01 71; E-mail: [email protected].
only on some subpopulations. The combination of cell count,cytomorphology, and cell organisation revealed the magni-tude of the potential of structuration of hormones or antihor-mones onin vitro growing cells.
Keywords: Breast cancer cell, phenotypic alterations, imageanalysis, topographical analysis
1. Introduction
Estrogen receptor (ER) status in breast cancer isconsidered to indicate the hormonal sensitivity of can-cer cells [28,32]. Although ER is used for the selec-tion of patients with advanced disease who might ben-efit from hormono-therapy, a large number of breasttumours (40–50%) fail to respond to endocrine ther-apy, in spite of the presence of functional ER [6,17,23].Breast cancer involves a conglomeration of biologi-cally heterogeneous entities since ER-positive tumoursare made up of positive and negative cells. Positivecells are not uniformly distributed and ER expressiondiffers from one cell to another within a given tumour.Evaluation of heterogeneity is critical for analysingtumour behaviour in response to therapy [19,31] andfor explaining the lack of correlation between respon-siveness and marker levels that often arises. While theimportance of evaluating cell heterogeneity has beenrecognised, diverse strategies have evolved for its char-acterisation. Flow cytometry and immunocytochem-istry allow assessment of heterogeneity for individ-ual or multi markers [14,15]. Quantification by imageanalysisin situ of estrogen receptor immunochemistry(ERICA) provides a reproducible means of character-ising receptor heterogeneity [2,4,26,36]. In all thesestudies, labelling intensities were heterogeneous. Sub-populations have been demonstrated to exist, but spa-tial heterogeneity is never considered. Since, the po-
Analytical Cellular Pathology 20 (2000) 99–113ISSN 0921-8912 / $8.00 2000, IOS Press. All rights reserved
100 J. Palmari et al. / Subpopulations remodelling in MCF-7 cells
sition and organisation of cell subpopulations stronglydepend on the nature and the strength of the interac-tions between them, the analysis of the spatio-temporalpatterns of these cells could contribute to a better un-derstanding of these interactions [3].
We previously developed an assay that simultane-ously measures ER content and nuclear size of cells.This assay was used to study the heterogeneity ingrowing MCF-7 cells [29]. Our goal was to computenot only features of single nuclei, but also to extractfeatures containing information on the structural or-ganisation of the proliferating cells, since these fea-tures describe the relationships between cells. This lat-ter analysis gives us three kinds of information leadingto a multiscale analysis: degree of order of the cell pop-ulation, analysis of the clones formed by the cells andfinally a structural evaluation of the global evolution ofthe subpopulations. In the present study, we analysedthe proliferation of MCF-7 cells under estradiol (E2),hydroxytamoxifen (OH-TAM), and both E2 and OH-TAM treatments. The aim was (i) to compute prolifer-ation indexes extracted from cell measurements on thewhole population or on subpopulations, (ii) to do mul-tiparametric characterisation on cell nuclei from ER-ICA images (ER content and nuclear area) and fromFeulgen stained images (characteristic parameters ofthe chromatin condensation), (iii) to measure globaland local order or disorder of the cell structural or-ganisation and to correlate it to the other parameters.Modifications of the degree of heterogeneity of the cellline under treatments are evidenced through pheno-typic changes and modifications of the spatial organ-isation of the cells. Our results show that it is essen-tial to consider the MCF-7 cell line as a “plastic” cellline whose heterogeneity could be pharmacologicallymodulated and that the dynamic evolution analysis ofboth subpopulation ratios and spatial organisations is away to interpret the overall effect of drugs on the cellpopulation.
2. Materials and methods
2.1. Cell culture and treatments
MCF-7 cells were obtained from Dr M. Lippman(NIH, Bethesda, MD) [37] and maintained in 50%Dulbecco’s minimum essential medium-50% Ham’s F-12 (DMEM/F12; Gibco, Grand Island, NY) supple-mented with 16 ng/ml of insulin, 2 mM L-glutamine,0.06% HEPES buffer, and 10% heat-inactivated fetal
calf serum depleted of steroids by dextran-charcoaltreatment (FCDCS). Cells were plated in T-75 flasksand cultured at 37◦C in a 95% air / 5% CO2 at-mosphere. For the experiments, cells were plated insteroid-stripped medium in two-chamber slides (2,500cells/cm2). Control cells attained confluence after 9days of culture (50,000 cells/cm2). Four sets of ex-periments were done: with estradiol (E2) (10−9 M),with hydroxytamoxifen (OH-TAM) (10−7 M), one settreated with estradiol (10−9 M) and hydroxytamoxifen(10−7 M) (E2/OH-TAM), and one set not treated (con-trol). The treatments were initiated 2 days after platingand stopped 24 h before the immunocytochemical de-tection of ER. Estrogen receptor immunocytochemicalassay was then performedin situ, at various times afterthe plating (3–9 days).
2.2. ER enzyme immunocytochemical assay (ERICA)
The assay was done with the Abbott kit (Chicago,IL) according to the manufacturer’s instructions.Briefly, cells were seeded in two-chamber cultureslides and treated as described above. Cells were fixedin paraformaldehyde at different times after the plating(3–9 days). Cells were rinsed with PBS, then perme-abilized in methanol-acetone at−20◦C. After washesin PBS, cells were reacted with H222 monoclonal an-tibody. This antibody was raised against human ERpurified from MCF-7 cells and reacts with an epitopenear the hormone-binding domain [16]. Cells were in-cubated with bridging goat anti-rat immunoglobulin G,and then with rat antiperoxidase complex. The reac-tion product was made visible with diaminobenzidinetetrahydrochloride and hydrogen peroxide. Cells werenot counterstained so that a low level of ER could berevealed. The monoclonal antibody was omitted in pro-cessing one set of slides from each treatment; it wasused as a negative control for evaluation of non specificbackground staining.
2.3. Feulgen staining
For the Feulgen–Rossenbech stoichiometric nuclearreaction [11], cells were fixed for 10 min in water-acetone-formaldehyde (6 : 9 : 5, V : V) containing0.02% disodium phosphate-0.1% monopotassiumphosphate, washed four times with distilled water, andair dried. Hydratation was done by immersing slidessuccessively in 95% and 75% ethanol, then 10 minin water, followed by a 1 h hydrolysis in 6 N HCl.Cells were then rinsed four times for 1 min in water,
J. Palmari et al. / Subpopulations remodelling in MCF-7 cells 101
stained for 1 h in Schiff reagent (Merck, Darmstad,Germany), washed four times for one minute in 0.05 NHCl containing 0.026 M sodium bisulfite, and thenfor 10 min in running water. They were dehydratedthrough graded ethanols and xylene and mounted inEukitt (Labonord).
2.4. Image processing
Images were recorded via the green output of acolour tri-CCD camera (JVC type) attached to an in-verted microscope (IMT2 Olympus, SCOP, Rungis,France) in a SAMBA 2005 (System for Analytical Mi-croscopy in Biological Applications) image process-ing environment (marketed by TITN, France). The15× magnification was used, and four or nine con-tiguous (512× 512) images were recorded in orderto get enough cells for statistical significance (≈1000for 3 days of culture to 5000 for 9 days of culture).The number of pixels per nucleus was about 170 andthe pixel size was 0.631µm2. Images were processedon a VAX station 4000 (Digital Equipment Corpora-tion, Nashua, NH) in the MIDAS (Munich Image DataAnalysis System) environment (European SouthernObservatory, Munich, Germany). We had developed acell segmentation technique in which we used filteringalgorithm (to increase the contrast between nuclei andbackground) and mathematical morphology (to pre-serve cell topography) [29,30]. In the case of ERICA,the last binary image of the segmented nuclei was usedwith the original density image to bring out, for eachcell, its nucleus barycenter (x,y) coordinates, nucleusarea (surface of the nucleus projection on the (x,y)plane) (A), nucleus integrated optical density (IOD).For the Feulgen-stained nuclei, 14 parameters char-acterising the condensation of chromatin were calcu-lated: 6 parameters extracted from the optical densityhistogram, nucleus area (A), nucleus integrated opticaldensity (IOD), mean optical density (MOD), skewness(SKE), standard deviation (SD), and kurtosis (KUR);3 textural features calculated from the grey-level co-occurence matrix proposed by Haralick et al. [18], lo-cal mean (LM), inertia (IN), and energy (EN); and5 calculated from the run-length section matrix pro-posed by Galloway [12], short-run length emphasis(SRE), long-run length emphasis (LRE), grey-leveldistribution (GLD), run-length distribution (RLD) andrun length percentage (RLP).
2.5. Global pattern analysis: order diagram
Cell differentiation processes and cell-cell interac-tions give tissues a non random organisation. For thehistopathologist the architecture expresses more or lessdifferentiated structures. Similarly, inin vitro models,the patterns of cell proliferation are modelled by thedegree of cellular interactions. Topographical analysisis able to quantitate order and disorder in biologicalstructure in tissues [22,27] as well as inin vitro mod-els [29]. Our approach [8–10] is based on the MinimalSpanning Tree graph (MST) constructed on the set ofpoints representing the position of cells. The choice ofthe MST is supported by the comparison of differentmethods used to compute spatial point pattern charac-teristics [39]. The MST was constructed by Rohlf’s al-gorithm [9,34] as described in detail [9,10]. We usedthe coordinates of the nuclei barycenters as nodes andthe Euclidian distance as edge weight. The averagemand the standard deviationσ of the edge-length his-togram are characteristics for the corresponding repar-tition [9]. To compare distributions regardless of theparticle density and the sampling window, the valuesof m andσ must be normalised. We used the processdescribed by Hoffman and Jain [20]. A diagram ofmandσ enabled us to determine the degree of order ofany distribution by taking a simple reading in the (m,σ) plane on which well characterised distributions hadbeen located (see Fig. 2 in [29]). A dynamic analysis ofthe patterns of growing culture cells leads to trajecto-ries in them, σ diagram reflecting the strength of theirinteractions [10,29,30].
2.6. Local pattern analysis: cluster detection
The proliferation of cells in culture can result fromradial development from cells initially randomly plateduntil confluence. Another way for cells to proliferateis for them to detach from the plate and to form newcolonies in various areas of the culture until conflu-ence. These two proliferation patterns could be asso-ciated. The MST can describe the distribution of cellclones in culture [29,40]. We analysed the number andthe size (mean value of the number of cells) of theclones by cutting the edges larger than a given thresh-old d in the MST built on a set of cells. The graph be-comes constituted of connected components represent-ing the so called “clusters” (see Fig. 3a in [29]). Byvarying the level of the thresholdd, one can discrimi-nate the proliferation processes.
102 J. Palmari et al. / Subpopulations remodelling in MCF-7 cells
2.7. Local pattern analysis: degree of relativecompactness
The MCF-7 cell line contains subpopulations moreor less intermixed. To measure the intermix, we definethe degree of relative compactness [29,40] by countingthe number of MST edges joining cells in each subpop-ulation and dividing by one less than the total numberof MST edges. This parameter approximates the ratioof boundary to interior cells (an interior cell of a sub-population of cells is one which is not in the vicinityof cells of the other subpopulations; a relative bound-ary cell is one which is in the immediate neighbour-hood of some cell of the other subpopulations). Wetake the total number of edges minus one because theMST have at least one edge between dissimilar cells,and we want relative compactness to be 100 percent forseparate subpopulations (see Fig. 3b in [29]).
2.8. Distributions analysis
The distributions were split into Gaussian curves.We used the Newton Raphson technique of curve fit-ting [13]. The Gaussians describe subpopulations ofcell nuclei, and the thresholds between the subpopu-lations were chosen at the intersections of the Gaus-sians [29].
2.9. Statistical analysis
All data shown are representative of four separateexperiments. Linear regression was used to study thecorrelation between Integrated Optical Density IOD,and nuclear area A at the single cell level. Statisticalsignificance was determined using the Studentt-test.Multifactorial discriminant analysis was used to sepa-rate several groups of Feulgen stained nuclei [21]. Thisanalysis provides a representation on a factorial planeand give new features by linear combinations of themeasured parameters. This plane should be read rela-tive to the parameters projections and in term of dis-tance between the different groups.
3. Results
3.1. Study of MCF-7 cell proliferation
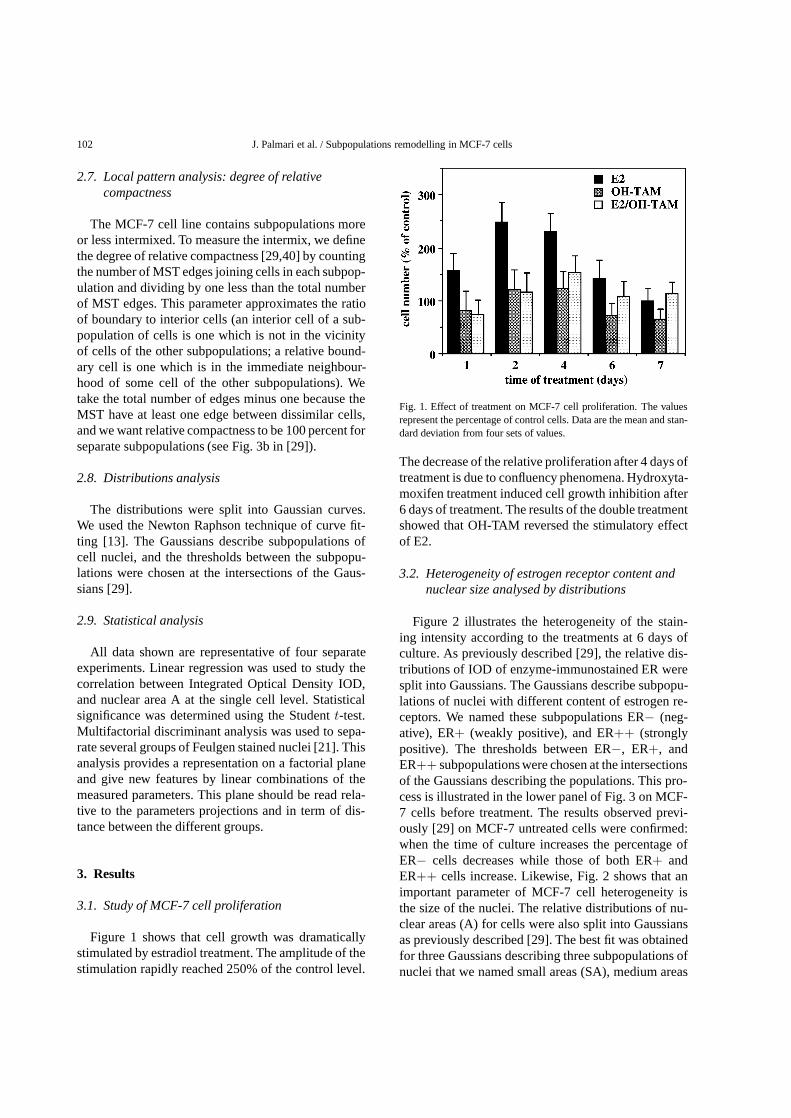
Figure 1 shows that cell growth was dramaticallystimulated by estradiol treatment. The amplitude of thestimulation rapidly reached 250% of the control level.
Fig. 1. Effect of treatment on MCF-7 cell proliferation. The valuesrepresent the percentage of control cells. Data are the mean and stan-dard deviation from four sets of values.
The decrease of the relative proliferation after 4 days oftreatment is due to confluency phenomena. Hydroxyta-moxifen treatment induced cell growth inhibition after6 days of treatment. The results of the double treatmentshowed that OH-TAM reversed the stimulatory effectof E2.
3.2. Heterogeneity of estrogen receptor content andnuclear size analysed by distributions
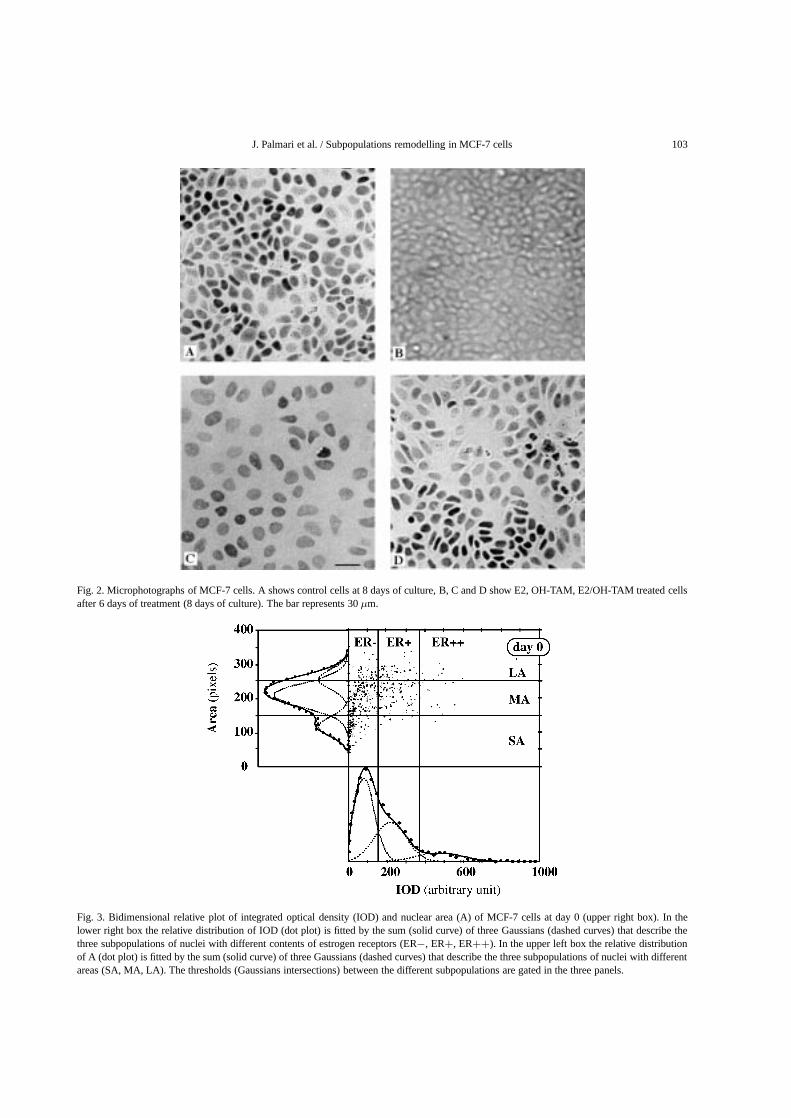
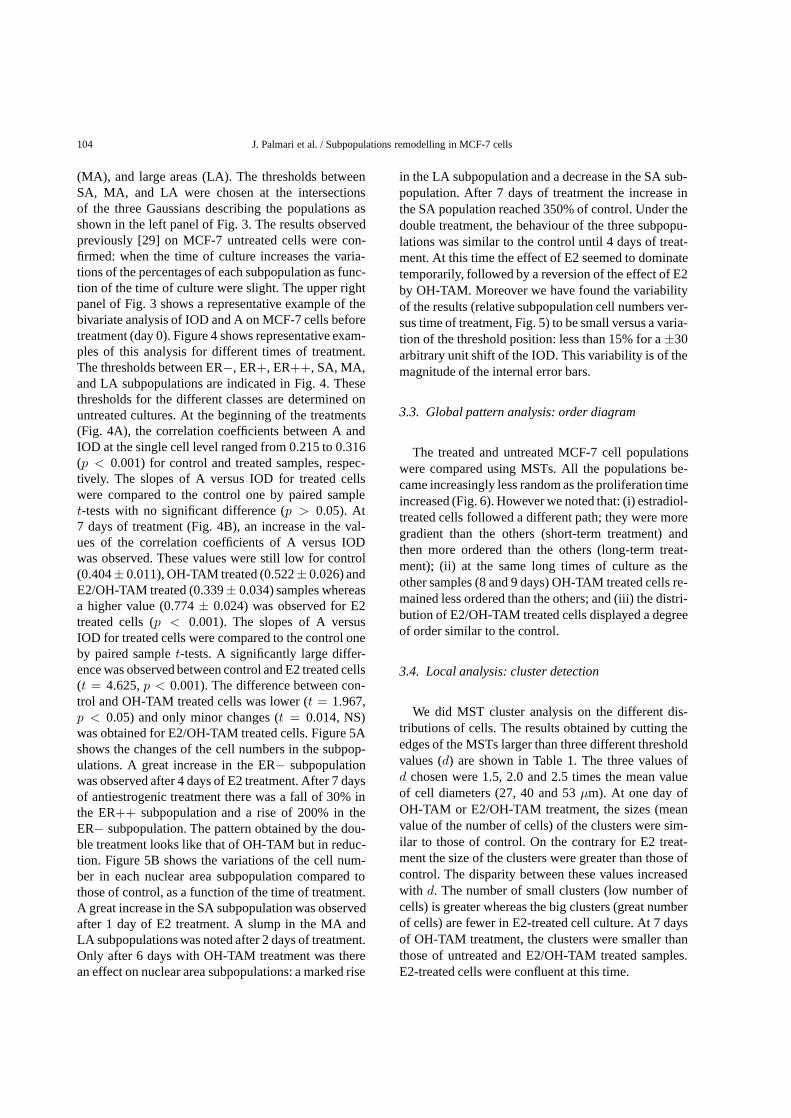
Figure 2 illustrates the heterogeneity of the stain-ing intensity according to the treatments at 6 days ofculture. As previously described [29], the relative dis-tributions of IOD of enzyme-immunostained ER weresplit into Gaussians. The Gaussians describe subpopu-lations of nuclei with different content of estrogen re-ceptors. We named these subpopulations ER− (neg-ative), ER+ (weakly positive), and ER++ (stronglypositive). The thresholds between ER−, ER+, andER++ subpopulations were chosen at the intersectionsof the Gaussians describing the populations. This pro-cess is illustrated in the lower panel of Fig. 3 on MCF-7 cells before treatment. The results observed previ-ously [29] on MCF-7 untreated cells were confirmed:when the time of culture increases the percentage ofER− cells decreases while those of both ER+ andER++ cells increase. Likewise, Fig. 2 shows that animportant parameter of MCF-7 cell heterogeneity isthe size of the nuclei. The relative distributions of nu-clear areas (A) for cells were also split into Gaussiansas previously described [29]. The best fit was obtainedfor three Gaussians describing three subpopulations ofnuclei that we named small areas (SA), medium areas
J. Palmari et al. / Subpopulations remodelling in MCF-7 cells 103
Fig. 2. Microphotographs of MCF-7 cells. A shows control cells at 8 days of culture, B, C and D show E2, OH-TAM, E2/OH-TAM treated cellsafter 6 days of treatment (8 days of culture). The bar represents 30µm.
Fig. 3. Bidimensional relative plot of integrated optical density (IOD) and nuclear area (A) of MCF-7 cells at day 0 (upper right box). In thelower right box the relative distribution of IOD (dot plot) is fitted by the sum (solid curve) of three Gaussians (dashed curves) that describe thethree subpopulations of nuclei with different contents of estrogen receptors (ER−, ER+, ER++). In the upper left box the relative distributionof A (dot plot) is fitted by the sum (solid curve) of three Gaussians (dashed curves) that describe the three subpopulations of nuclei with differentareas (SA, MA, LA). The thresholds (Gaussians intersections) between the different subpopulations are gated in the three panels.
104 J. Palmari et al. / Subpopulations remodelling in MCF-7 cells
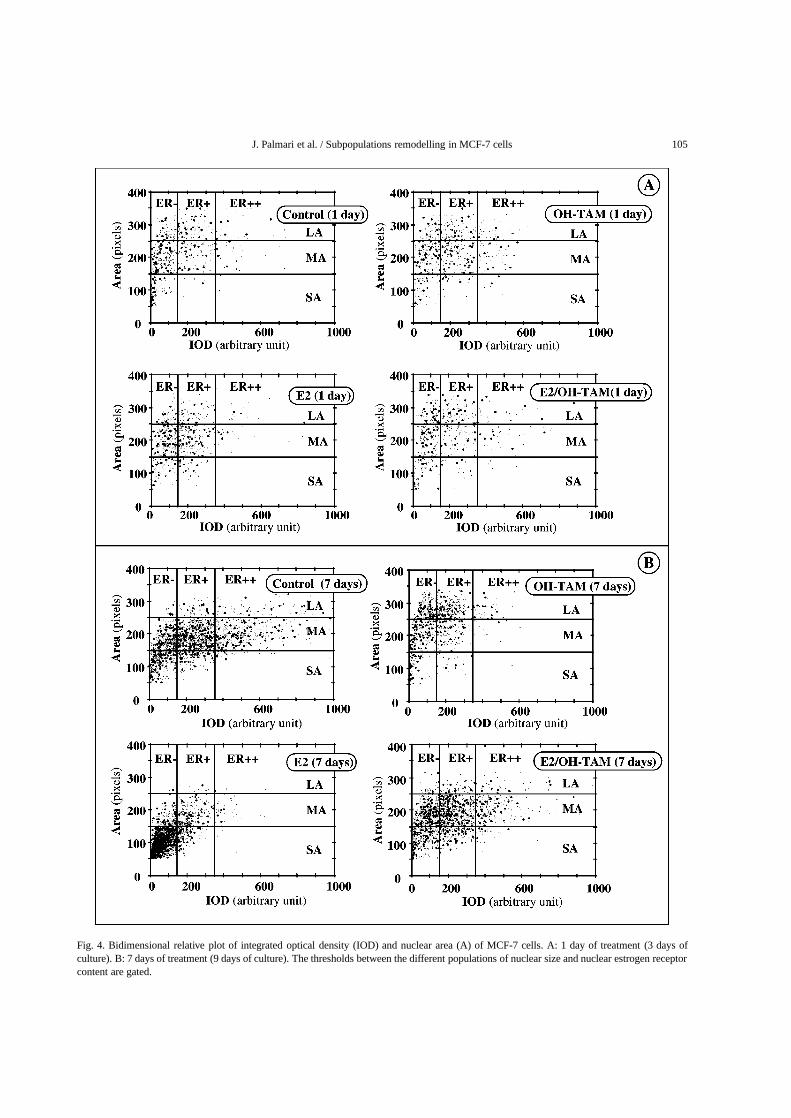
(MA), and large areas (LA). The thresholds betweenSA, MA, and LA were chosen at the intersectionsof the three Gaussians describing the populations asshown in the left panel of Fig. 3. The results observedpreviously [29] on MCF-7 untreated cells were con-firmed: when the time of culture increases the varia-tions of the percentages of each subpopulation as func-tion of the time of culture were slight. The upper rightpanel of Fig. 3 shows a representative example of thebivariate analysis of IOD and A on MCF-7 cells beforetreatment (day 0). Figure 4 shows representative exam-ples of this analysis for different times of treatment.The thresholds between ER−, ER+, ER++, SA, MA,and LA subpopulations are indicated in Fig. 4. Thesethresholds for the different classes are determined onuntreated cultures. At the beginning of the treatments(Fig. 4A), the correlation coefficients between A andIOD at the single cell level ranged from 0.215 to 0.316(p < 0.001) for control and treated samples, respec-tively. The slopes of A versus IOD for treated cellswere compared to the control one by paired samplet-tests with no significant difference (p > 0.05). At7 days of treatment (Fig. 4B), an increase in the val-ues of the correlation coefficients of A versus IODwas observed. These values were still low for control(0.404± 0.011), OH-TAM treated (0.522± 0.026) andE2/OH-TAM treated (0.339± 0.034) samples whereasa higher value (0.774± 0.024) was observed for E2treated cells (p < 0.001). The slopes of A versusIOD for treated cells were compared to the control oneby paired samplet-tests. A significantly large differ-ence was observed between control and E2 treated cells(t = 4.625,p < 0.001). The difference between con-trol and OH-TAM treated cells was lower (t = 1.967,p < 0.05) and only minor changes (t = 0.014, NS)was obtained for E2/OH-TAM treated cells. Figure 5Ashows the changes of the cell numbers in the subpop-ulations. A great increase in the ER− subpopulationwas observed after 4 days of E2 treatment. After 7 daysof antiestrogenic treatment there was a fall of 30% inthe ER++ subpopulation and a rise of 200% in theER− subpopulation. The pattern obtained by the dou-ble treatment looks like that of OH-TAM but in reduc-tion. Figure 5B shows the variations of the cell num-ber in each nuclear area subpopulation compared tothose of control, as a function of the time of treatment.A great increase in the SA subpopulation was observedafter 1 day of E2 treatment. A slump in the MA andLA subpopulations was noted after 2 days of treatment.Only after 6 days with OH-TAM treatment was therean effect on nuclear area subpopulations: a marked rise
in the LA subpopulation and a decrease in the SA sub-population. After 7 days of treatment the increase inthe SA population reached 350% of control. Under thedouble treatment, the behaviour of the three subpopu-lations was similar to the control until 4 days of treat-ment. At this time the effect of E2 seemed to dominatetemporarily, followed by a reversion of the effect of E2by OH-TAM. Moreover we have found the variabilityof the results (relative subpopulation cell numbers ver-sus time of treatment, Fig. 5) to be small versus a varia-tion of the threshold position: less than 15% for a±30arbitrary unit shift of the IOD. This variability is of themagnitude of the internal error bars.
3.3. Global pattern analysis: order diagram
The treated and untreated MCF-7 cell populationswere compared using MSTs. All the populations be-came increasingly less random as the proliferation timeincreased (Fig. 6). However we noted that: (i) estradiol-treated cells followed a different path; they were moregradient than the others (short-term treatment) andthen more ordered than the others (long-term treat-ment); (ii) at the same long times of culture as theother samples (8 and 9 days) OH-TAM treated cells re-mained less ordered than the others; and (iii) the distri-bution of E2/OH-TAM treated cells displayed a degreeof order similar to the control.
3.4. Local analysis: cluster detection
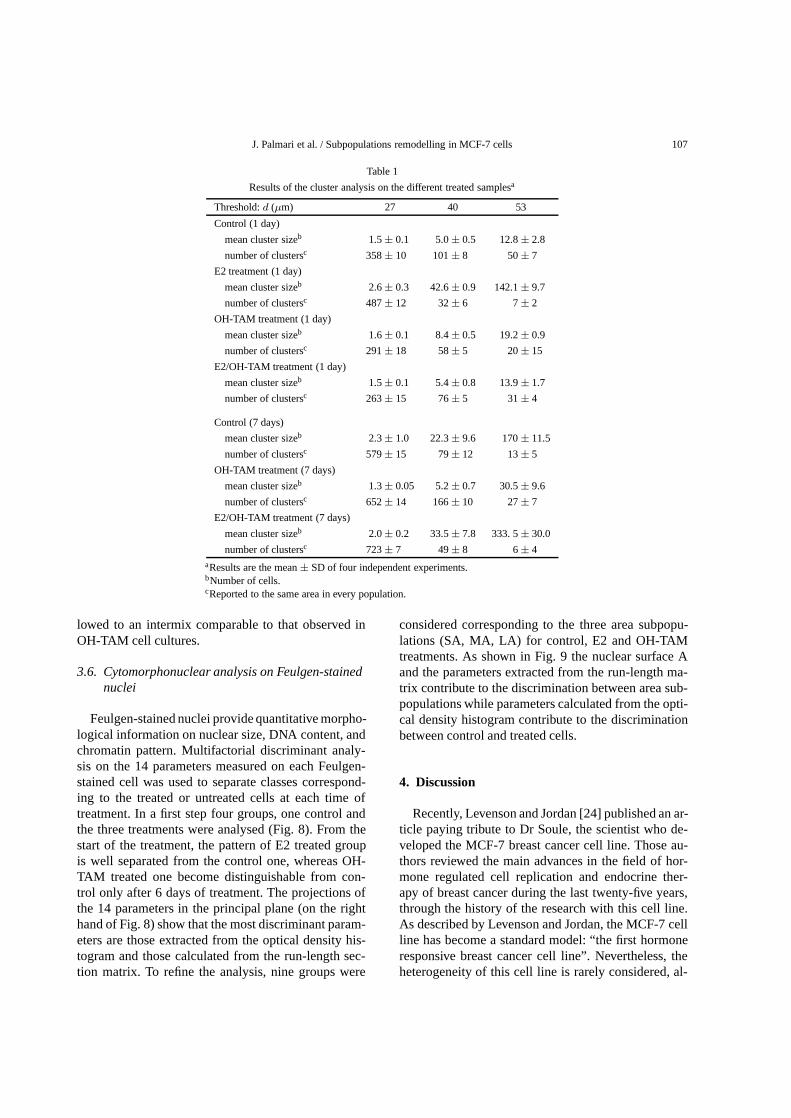
We did MST cluster analysis on the different dis-tributions of cells. The results obtained by cutting theedges of the MSTs larger than three different thresholdvalues (d) are shown in Table 1. The three values ofd chosen were 1.5, 2.0 and 2.5 times the mean valueof cell diameters (27, 40 and 53µm). At one day ofOH-TAM or E2/OH-TAM treatment, the sizes (meanvalue of the number of cells) of the clusters were sim-ilar to those of control. On the contrary for E2 treat-ment the size of the clusters were greater than those ofcontrol. The disparity between these values increasedwith d. The number of small clusters (low number ofcells) is greater whereas the big clusters (great numberof cells) are fewer in E2-treated cell culture. At 7 daysof OH-TAM treatment, the clusters were smaller thanthose of untreated and E2/OH-TAM treated samples.E2-treated cells were confluent at this time.
J. Palmari et al. / Subpopulations remodelling in MCF-7 cells 105
Fig. 4. Bidimensional relative plot of integrated optical density (IOD) and nuclear area (A) of MCF-7 cells. A: 1 day of treatment (3 days ofculture). B: 7 days of treatment (9 days of culture). The thresholds between the different populations of nuclear size and nuclear estrogen receptorcontent are gated.

106 J. Palmari et al. / Subpopulations remodelling in MCF-7 cells
Fig. 5. A: Variations of the number of the three subpopulations ER−, ER+, ER++ relative to control, versus the time of treatment. B: Variationsof the number of the three subpopulations SA, MA, LA relative to the control, versus the time of treatment. Data are the mean± SD from fourindependent experiments.
Fig. 6. The (m,σ) plane. The star (F) pertains to a perfectly randomdistribution. If the mean of the experimental results,m, is belowthat of a random distribution, this is indicative of a tendency to cellclustering. If the value of the standard deviationσ is above that ofthe random distribution there is a trend toward gradient formation.Organised distributions are characterised by small values ofσ. The(1) pertain to control cells, (", 2 and!) pertain respectively toE2, OH-TAM and E2/OH-TAM treated cells. The duration of thetreatments are indicated in the symbols.
3.5. Local analysis: degree of relative compactness
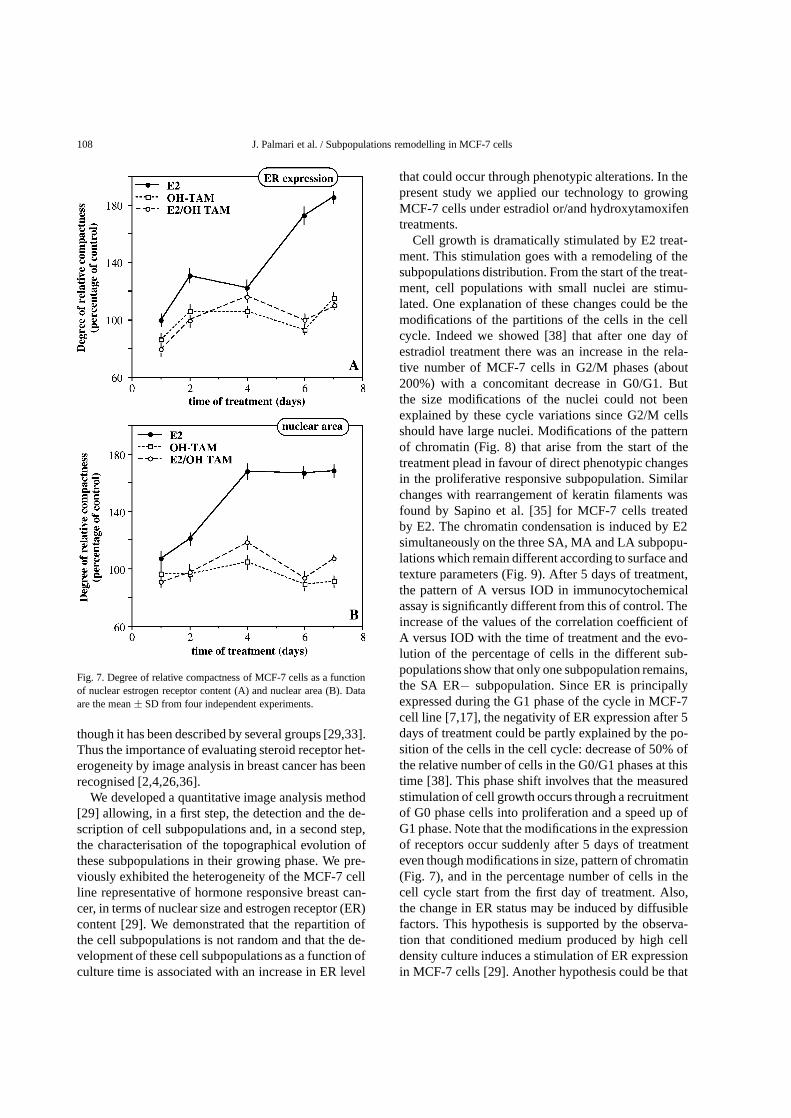
We computed the values of the relative compactnessfor the three subpopulations of estrogen receptor con-tent (ER−, ER+, ER++) and the three subpopulationsof nuclear area (SA, MA, LA). As observed previ-ously [29], the relative compactness of control cells asa function of nuclear estrogen receptor decreases at thebeginning of the proliferative process and then remainsconstant. On comparing these values to those of thetreated cells (Fig. 7A), the intermix (inverse of com-pactness) of the three ER-populations under OH-TAMor E2/OH-TAM was first slightly greater, then similar,finally slightly lower. Inversely, the intermix of the sub-populations treated by E2 was always lower than thecontrol one. As observed previously, in the case of un-treated control cells the values of the relative compact-ness for the three subpopulations of nuclear area [29]increase as a function of the culture time. On compar-ing these values to those of the treated cells (Fig. 7B),the intermix of the three classes was slightly greaterwhen the cells were treated by OH-TAM and dramat-ically lower for the E2 treatment. Short term E2/OH-TAM treatment led to values similar to that measuredfor E2-treated cells whereas long-term treatment al-
J. Palmari et al. / Subpopulations remodelling in MCF-7 cells 107
Table 1
Results of the cluster analysis on the different treated samplesa
Threshold:d (µm) 27 40 53
Control (1 day)
mean cluster sizeb 1.5± 0.1 5.0± 0.5 12.8± 2.8
number of clustersc 358± 10 101± 8 50± 7
E2 treatment (1 day)
mean cluster sizeb 2.6± 0.3 42.6± 0.9 142.1± 9.7
number of clustersc 487± 12 32± 6 7± 2
OH-TAM treatment (1 day)
mean cluster sizeb 1.6± 0.1 8.4± 0.5 19.2± 0.9
number of clustersc 291± 18 58± 5 20± 15
E2/OH-TAM treatment (1 day)
mean cluster sizeb 1.5± 0.1 5.4± 0.8 13.9± 1.7
number of clustersc 263± 15 76± 5 31± 4
Control (7 days)
mean cluster sizeb 2.3± 1.0 22.3± 9.6 170± 11.5
number of clustersc 579± 15 79± 12 13± 5
OH-TAM treatment (7 days)
mean cluster sizeb 1.3± 0.05 5.2± 0.7 30.5± 9.6
number of clustersc 652± 14 166± 10 27± 7
E2/OH-TAM treatment (7 days)
mean cluster sizeb 2.0± 0.2 33.5± 7.8 333. 5± 30.0
number of clustersc 723± 7 49± 8 6± 4aResults are the mean± SD of four independent experiments.bNumber of cells.cReported to the same area in every population.
lowed to an intermix comparable to that observed inOH-TAM cell cultures.
3.6. Cytomorphonuclear analysis on Feulgen-stainednuclei
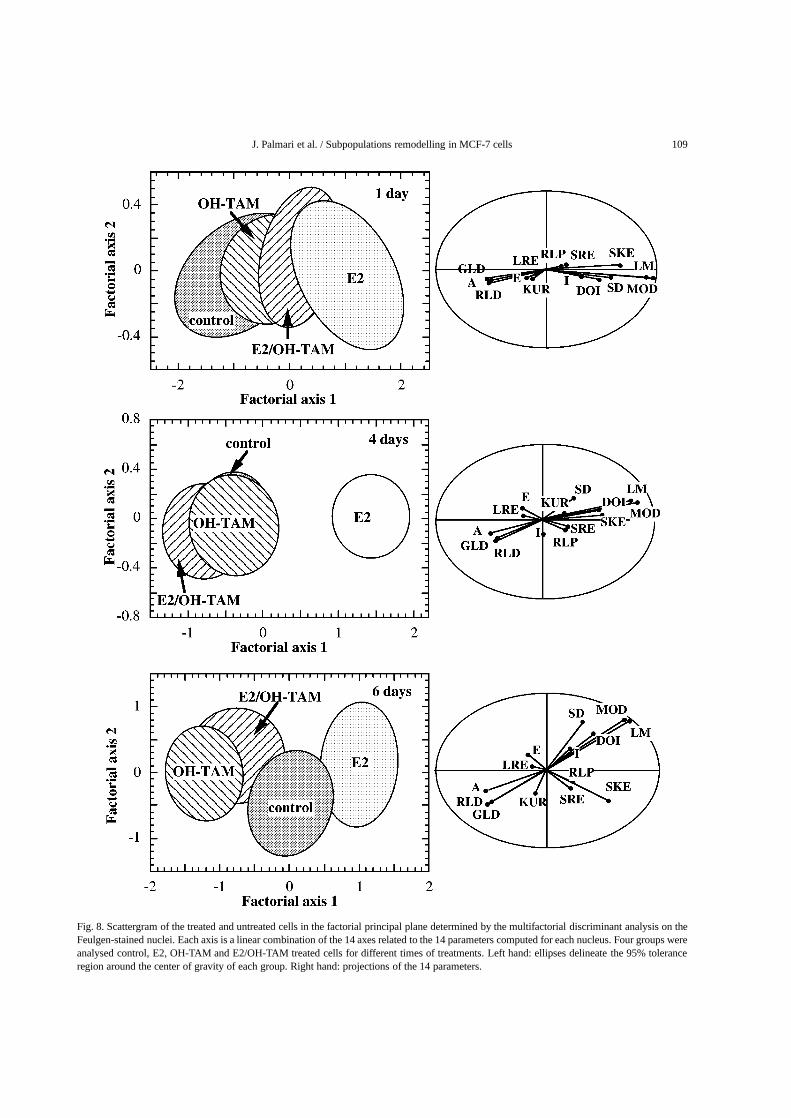
Feulgen-stained nuclei provide quantitative morpho-logical information on nuclear size, DNA content, andchromatin pattern. Multifactorial discriminant analy-sis on the 14 parameters measured on each Feulgen-stained cell was used to separate classes correspond-ing to the treated or untreated cells at each time oftreatment. In a first step four groups, one control andthe three treatments were analysed (Fig. 8). From thestart of the treatment, the pattern of E2 treated groupis well separated from the control one, whereas OH-TAM treated one become distinguishable from con-trol only after 6 days of treatment. The projections ofthe 14 parameters in the principal plane (on the righthand of Fig. 8) show that the most discriminant param-eters are those extracted from the optical density his-togram and those calculated from the run-length sec-tion matrix. To refine the analysis, nine groups were
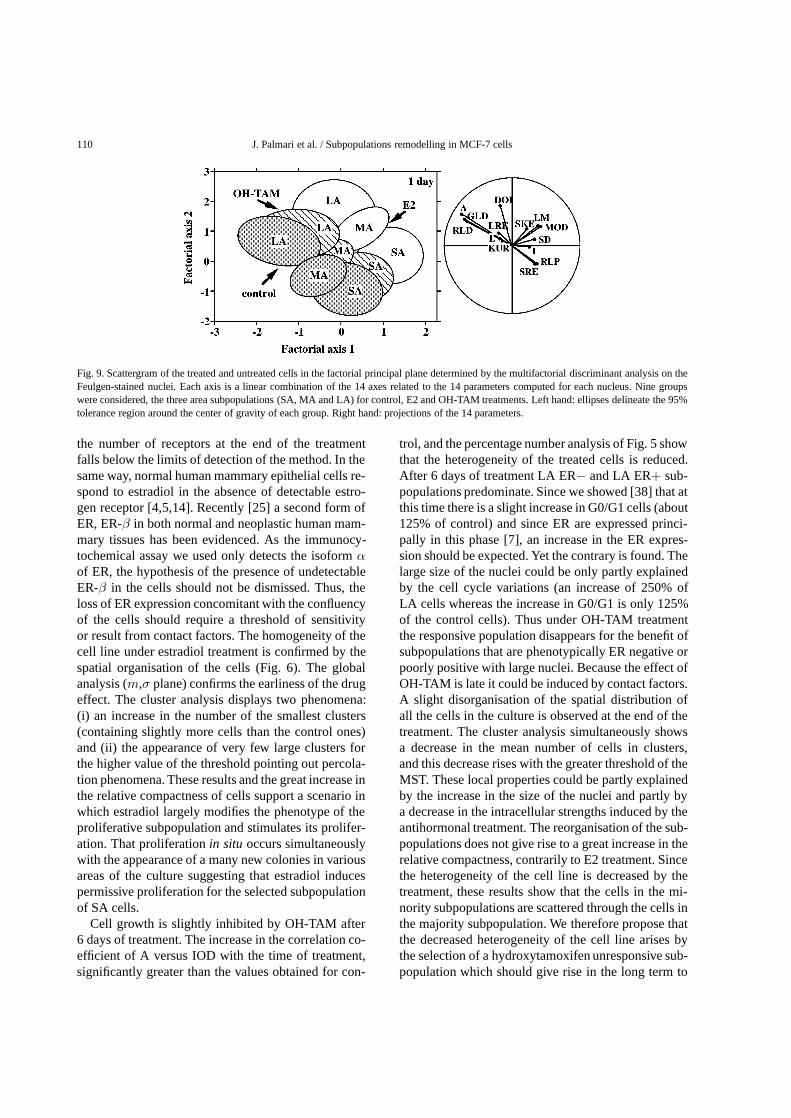
considered corresponding to the three area subpopu-lations (SA, MA, LA) for control, E2 and OH-TAMtreatments. As shown in Fig. 9 the nuclear surface Aand the parameters extracted from the run-length ma-trix contribute to the discrimination between area sub-populations while parameters calculated from the opti-cal density histogram contribute to the discriminationbetween control and treated cells.
4. Discussion
Recently, Levenson and Jordan [24] published an ar-ticle paying tribute to Dr Soule, the scientist who de-veloped the MCF-7 breast cancer cell line. Those au-thors reviewed the main advances in the field of hor-mone regulated cell replication and endocrine ther-apy of breast cancer during the last twenty-five years,through the history of the research with this cell line.As described by Levenson and Jordan, the MCF-7 cellline has become a standard model: “the first hormoneresponsive breast cancer cell line”. Nevertheless, theheterogeneity of this cell line is rarely considered, al-
108 J. Palmari et al. / Subpopulations remodelling in MCF-7 cells
Fig. 7. Degree of relative compactness of MCF-7 cells as a functionof nuclear estrogen receptor content (A) and nuclear area (B). Dataare the mean± SD from four independent experiments.
though it has been described by several groups [29,33].Thus the importance of evaluating steroid receptor het-erogeneity by image analysis in breast cancer has beenrecognised [2,4,26,36].
We developed a quantitative image analysis method[29] allowing, in a first step, the detection and the de-scription of cell subpopulations and, in a second step,the characterisation of the topographical evolution ofthese subpopulations in their growing phase. We pre-viously exhibited the heterogeneity of the MCF-7 cellline representative of hormone responsive breast can-cer, in terms of nuclear size and estrogen receptor (ER)content [29]. We demonstrated that the repartition ofthe cell subpopulations is not random and that the de-velopment of these cell subpopulations as a function ofculture time is associated with an increase in ER level
that could occur through phenotypic alterations. In thepresent study we applied our technology to growingMCF-7 cells under estradiol or/and hydroxytamoxifentreatments.
Cell growth is dramatically stimulated by E2 treat-ment. This stimulation goes with a remodeling of thesubpopulations distribution. From the start of the treat-ment, cell populations with small nuclei are stimu-lated. One explanation of these changes could be themodifications of the partitions of the cells in the cellcycle. Indeed we showed [38] that after one day ofestradiol treatment there was an increase in the rela-tive number of MCF-7 cells in G2/M phases (about200%) with a concomitant decrease in G0/G1. Butthe size modifications of the nuclei could not beenexplained by these cycle variations since G2/M cellsshould have large nuclei. Modifications of the patternof chromatin (Fig. 8) that arise from the start of thetreatment plead in favour of direct phenotypic changesin the proliferative responsive subpopulation. Similarchanges with rearrangement of keratin filaments wasfound by Sapino et al. [35] for MCF-7 cells treatedby E2. The chromatin condensation is induced by E2simultaneously on the three SA, MA and LA subpopu-lations which remain different according to surface andtexture parameters (Fig. 9). After 5 days of treatment,the pattern of A versus IOD in immunocytochemicalassay is significantly different from this of control. Theincrease of the values of the correlation coefficient ofA versus IOD with the time of treatment and the evo-lution of the percentage of cells in the different sub-populations show that only one subpopulation remains,the SA ER− subpopulation. Since ER is principallyexpressed during the G1 phase of the cycle in MCF-7cell line [7,17], the negativity of ER expression after 5days of treatment could be partly explained by the po-sition of the cells in the cell cycle: decrease of 50% ofthe relative number of cells in the G0/G1 phases at thistime [38]. This phase shift involves that the measuredstimulation of cell growth occurs through a recruitmentof G0 phase cells into proliferation and a speed up ofG1 phase. Note that the modifications in the expressionof receptors occur suddenly after 5 days of treatmenteven though modifications in size, pattern of chromatin(Fig. 7), and in the percentage number of cells in thecell cycle start from the first day of treatment. Also,the change in ER status may be induced by diffusiblefactors. This hypothesis is supported by the observa-tion that conditioned medium produced by high celldensity culture induces a stimulation of ER expressionin MCF-7 cells [29]. Another hypothesis could be that
J. Palmari et al. / Subpopulations remodelling in MCF-7 cells 109
Fig. 8. Scattergram of the treated and untreated cells in the factorial principal plane determined by the multifactorial discriminant analysis on theFeulgen-stained nuclei. Each axis is a linear combination of the 14 axes related to the 14 parameters computed for each nucleus. Four groups wereanalysed control, E2, OH-TAM and E2/OH-TAM treated cells for different times of treatments. Left hand: ellipses delineate the 95% toleranceregion around the center of gravity of each group. Right hand: projections of the 14 parameters.
110 J. Palmari et al. / Subpopulations remodelling in MCF-7 cells
Fig. 9. Scattergram of the treated and untreated cells in the factorial principal plane determined by the multifactorial discriminant analysis on theFeulgen-stained nuclei. Each axis is a linear combination of the 14 axes related to the 14 parameters computed for each nucleus. Nine groupswere considered, the three area subpopulations (SA, MA and LA) for control, E2 and OH-TAM treatments. Left hand: ellipses delineate the 95%tolerance region around the center of gravity of each group. Right hand: projections of the 14 parameters.
the number of receptors at the end of the treatmentfalls below the limits of detection of the method. In thesame way, normal human mammary epithelial cells re-spond to estradiol in the absence of detectable estro-gen receptor [4,5,14]. Recently [25] a second form ofER, ER-β in both normal and neoplastic human mam-mary tissues has been evidenced. As the immunocy-tochemical assay we used only detects the isoformαof ER, the hypothesis of the presence of undetectableER-β in the cells should not be dismissed. Thus, theloss of ER expression concomitant with the confluencyof the cells should require a threshold of sensitivityor result from contact factors. The homogeneity of thecell line under estradiol treatment is confirmed by thespatial organisation of the cells (Fig. 6). The globalanalysis (m,σ plane) confirms the earliness of the drugeffect. The cluster analysis displays two phenomena:(i) an increase in the number of the smallest clusters(containing slightly more cells than the control ones)and (ii) the appearance of very few large clusters forthe higher value of the threshold pointing out percola-tion phenomena. These results and the great increase inthe relative compactness of cells support a scenario inwhich estradiol largely modifies the phenotype of theproliferative subpopulation and stimulates its prolifer-ation. That proliferationin situ occurs simultaneouslywith the appearance of a many new colonies in variousareas of the culture suggesting that estradiol inducespermissive proliferation for the selected subpopulationof SA cells.
Cell growth is slightly inhibited by OH-TAM after6 days of treatment. The increase in the correlation co-efficient of A versus IOD with the time of treatment,significantly greater than the values obtained for con-
trol, and the percentage number analysis of Fig. 5 showthat the heterogeneity of the treated cells is reduced.After 6 days of treatment LA ER− and LA ER+ sub-populations predominate. Since we showed [38] that atthis time there is a slight increase in G0/G1 cells (about125% of control) and since ER are expressed princi-pally in this phase [7], an increase in the ER expres-sion should be expected. Yet the contrary is found. Thelarge size of the nuclei could be only partly explainedby the cell cycle variations (an increase of 250% ofLA cells whereas the increase in G0/G1 is only 125%of the control cells). Thus under OH-TAM treatmentthe responsive population disappears for the benefit ofsubpopulations that are phenotypically ER negative orpoorly positive with large nuclei. Because the effect ofOH-TAM is late it could be induced by contact factors.A slight disorganisation of the spatial distribution ofall the cells in the culture is observed at the end of thetreatment. The cluster analysis simultaneously showsa decrease in the mean number of cells in clusters,and this decrease rises with the greater threshold of theMST. These local properties could be partly explainedby the increase in the size of the nuclei and partly bya decrease in the intracellular strengths induced by theantihormonal treatment. The reorganisation of the sub-populations does not give rise to a great increase in therelative compactness, contrarily to E2 treatment. Sincethe heterogeneity of the cell line is decreased by thetreatment, these results show that the cells in the mi-nority subpopulations are scattered through the cells inthe majority subpopulation. We therefore propose thatthe decreased heterogeneity of the cell line arises bythe selection of a hydroxytamoxifen unresponsive sub-population which should give rise in the long term to
J. Palmari et al. / Subpopulations remodelling in MCF-7 cells 111
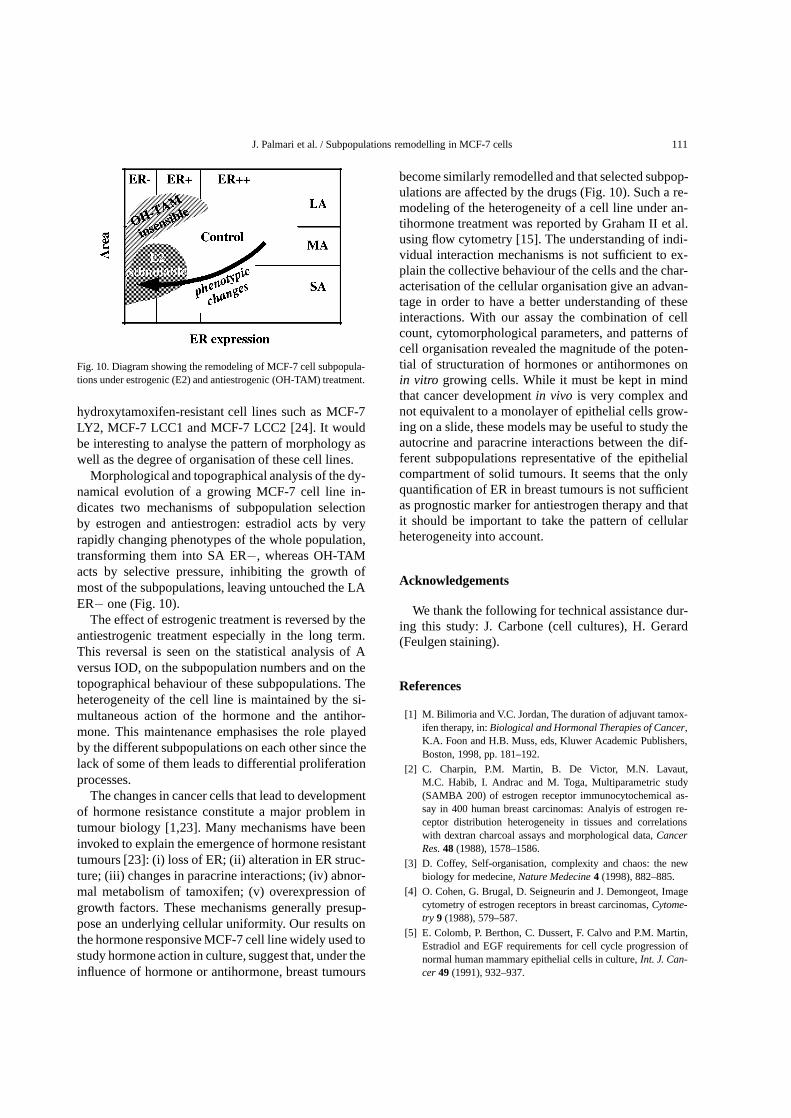
Fig. 10. Diagram showing the remodeling of MCF-7 cell subpopula-tions under estrogenic (E2) and antiestrogenic (OH-TAM) treatment.
hydroxytamoxifen-resistant cell lines such as MCF-7LY2, MCF-7 LCC1 and MCF-7 LCC2 [24]. It wouldbe interesting to analyse the pattern of morphology aswell as the degree of organisation of these cell lines.
Morphological and topographical analysis of the dy-namical evolution of a growing MCF-7 cell line in-dicates two mechanisms of subpopulation selectionby estrogen and antiestrogen: estradiol acts by veryrapidly changing phenotypes of the whole population,transforming them into SA ER−, whereas OH-TAMacts by selective pressure, inhibiting the growth ofmost of the subpopulations, leaving untouched the LAER− one (Fig. 10).
The effect of estrogenic treatment is reversed by theantiestrogenic treatment especially in the long term.This reversal is seen on the statistical analysis of Aversus IOD, on the subpopulation numbers and on thetopographical behaviour of these subpopulations. Theheterogeneity of the cell line is maintained by the si-multaneous action of the hormone and the antihor-mone. This maintenance emphasises the role playedby the different subpopulations on each other since thelack of some of them leads to differential proliferationprocesses.
The changes in cancer cells that lead to developmentof hormone resistance constitute a major problem intumour biology [1,23]. Many mechanisms have beeninvoked to explain the emergence of hormone resistanttumours [23]: (i) loss of ER; (ii) alteration in ER struc-ture; (iii) changes in paracrine interactions; (iv) abnor-mal metabolism of tamoxifen; (v) overexpression ofgrowth factors. These mechanisms generally presup-pose an underlying cellular uniformity. Our results onthe hormone responsive MCF-7 cell line widely used tostudy hormone action in culture, suggest that, under theinfluence of hormone or antihormone, breast tumours
become similarly remodelled and that selected subpop-ulations are affected by the drugs (Fig. 10). Such a re-modeling of the heterogeneity of a cell line under an-tihormone treatment was reported by Graham II et al.using flow cytometry [15]. The understanding of indi-vidual interaction mechanisms is not sufficient to ex-plain the collective behaviour of the cells and the char-acterisation of the cellular organisation give an advan-tage in order to have a better understanding of theseinteractions. With our assay the combination of cellcount, cytomorphological parameters, and patterns ofcell organisation revealed the magnitude of the poten-tial of structuration of hormones or antihormones onin vitro growing cells. While it must be kept in mindthat cancer developmentin vivo is very complex andnot equivalent to a monolayer of epithelial cells grow-ing on a slide, these models may be useful to study theautocrine and paracrine interactions between the dif-ferent subpopulations representative of the epithelialcompartment of solid tumours. It seems that the onlyquantification of ER in breast tumours is not sufficientas prognostic marker for antiestrogen therapy and thatit should be important to take the pattern of cellularheterogeneity into account.
Acknowledgements
We thank the following for technical assistance dur-ing this study: J. Carbone (cell cultures), H. Gerard(Feulgen staining).
References
[1] M. Bilimoria and V.C. Jordan, The duration of adjuvant tamox-ifen therapy, in:Biological and Hormonal Therapies of Cancer,K.A. Foon and H.B. Muss, eds, Kluwer Academic Publishers,Boston, 1998, pp. 181–192.
[2] C. Charpin, P.M. Martin, B. De Victor, M.N. Lavaut,M.C. Habib, I. Andrac and M. Toga, Multiparametric study(SAMBA 200) of estrogen receptor immunocytochemical as-say in 400 human breast carcinomas: Analyis of estrogen re-ceptor distribution heterogeneity in tissues and correlationswith dextran charcoal assays and morphological data,CancerRes.48 (1988), 1578–1586.
[3] D. Coffey, Self-organisation, complexity and chaos: the newbiology for medecine,Nature Medecine4 (1998), 882–885.
[4] O. Cohen, G. Brugal, D. Seigneurin and J. Demongeot, Imagecytometry of estrogen receptors in breast carcinomas,Cytome-try 9 (1988), 579–587.
[5] E. Colomb, P. Berthon, C. Dussert, F. Calvo and P.M. Martin,Estradiol and EGF requirements for cell cycle progression ofnormal human mammary epithelial cells in culture,Int. J. Can-cer 49 (1991), 932–937.
112 J. Palmari et al. / Subpopulations remodelling in MCF-7 cells
[6] P.D. Darbre and R.J. King, Progression to steroid insensitiv-ity can occur irrespective of the presebce of functional steroidreceptors,Cell 51 (1987), 521–528.
[7] X.F. Dong, Y. Berthois, E. Colomb and P.M. Martin, Cell cy-cle phase dependence of estrogen and epidermial growth fac-tor (EGF) receptor expression in MCF-7 cells: implications inantiestrogen and EGF cell responsivness,Endocrinology129(1991), 2719–2728.
[8] C. Dussert, F. Kopp, P. Gandilhon, N. Pourreau-Schneider, M.Rasigni, J. Palmari, G. Rasigni, P.M. Martin and A. Llebaria,Toward a new approach in tumor cell heterogeneity studies us-ing the concept of order,Anal. Cell. Pathol.1 (1989), 123–132.
[9] C. Dussert, G. Rasigni, M. Rasigni, J. Palmari and A. Llebaria,Minimal spanning tree: a new approach for studying order anddisorder,Phys. Rev.B34 (1986), 3528–3531.
[10] C. Dussert, M. Rasigni, J. Palmari, G. Rasigni, A. Llebaria andF. Marty, Minimal spanning tree analysis of biological struc-tures,J. Theor. Biol.125(1987), 317–323.
[11] R. Feulgen and H. Rossenbech, Mikrosckopich chemischernachweis einer nucleisaüre und die darauf hesuhende elektivefärbung von zelkernen in mikroskopischen prä paraten,Zschr.Physiol. Chem.135(1924), 203–248.
[12] M.M. Galloway, Texture analysis using gray level run lengths,Comput. Graph. Imag. Process.4 (1975), 172–179.
[13] P.E. Gill, W. Murray and M.H. Wright,Practical Optimization,Academic Press, London, 1981.
[14] M.L. Graham II, P.A. Bunn, P.B. Jewett, C. Gonzalez-Aller andK.B. Horwitz, Simultaneous measurment of progesterone re-ceptors and DNA indices by flow cytometry: characterizationof an assay in breast cancer cell line,Cancer Res.49 (1989),3934–3942.
[15] M.L. Graham II, J.A. Smith, P.B. Jewett and K.B. Horwitz,Heterogeneity of progesterone receptor content and remodel-ing by tamoxifen characterize subpopulations of cultured hu-man breast cancer cells: Analysis by quantitative dual parame-ter flow cytometry,Cancer Res.52 (1992), 593–602.
[16] G.L. Greene, N.B. Sobel, W.J. King and E.V. Jensen, Immuno-chemical studies of estrogen receptors,J. Steroid. Biochem.20(1984), 51–56.
[17] J.T. Hamm and J.C. Allegra, Loss of hormonal responsiveness,in: Endocrine Management of Cancer, B.A. Stoll, ed., KargerPress, Basel, 1988, pp. 61–71.
[18] R.M. Haralick, K. Shanmugan and I. Dinstein, Textural fea-ture for image classification,IEEE T. Syst. Man. Cyb.SMC-3(1973), 610–621.
[19] G.H. Heppner, Tumor heterogeneity,Cancer Res.44 (1984),2259–2265.
[20] R. Hoffman and A.K. Jain, A test of randomness based on theminimal spanning tree,Pattern Recognition Letters1 (1983),175–180.
[21] H. Hotteling, Analysis of a complex of statistical variables intoprincipal components,J. Educ. Psych.24 (1933), 417–441,498–520.
[22] K. Kayser, H. Stute and M. Tacke, Minimum spanning tree, in-tegrated optical density and lymph node metastasis in bronchialcarcinoma,Anal. Cell. Pathol.5 (1993), 225–234.
[23] G. Kimmick and H. Muss, Endocrine therapy in metastaticbreast cancer, in:Biological and Hormonal Therapies of Can-cer, K.A. Foon and H.B. Muss, eds, Kluwer Academic Pub-lishers, Boston, 1988, pp. 231–253.
[24] A.S. Levenson and V.C. Jordan, MCF-7: The first hormone-responsive breast cancer cell line,Cancer Res.57 (1997),3071–3078.
[25] E. Leygue, H. Dotzlaw, P. Watson and L. Murphy, Alteredraceptorα et β messenger RNA expression during humanbreast tumorigenesis,Cancer Res.58 (1998), 3197–3201.
[26] A. Maiorana, V. Cavallari, A. Bagni, A.F. Ussia, M.C. Maio-rana and R.A. Fano, Nuclear areas in breast cancer: relation-ship with estrogen and progesterone receptor expression,Anal.Cell. Pathol.11 (1996), 199–209.
[27] G.A. Meijer, S.G.M. Meuwissen and J.P.A. Baak, Classifica-tion of colorectal adenomas with quantitative pathology. Evalu-ation of morphometry, stereology, mitotic counts and syntacticstructure analysis,Anal. Cell. Pathol.9 (1995), 311–323.
[28] W.R. Miller, Endocrine treatment for breast cancers: Biologicalrationale and current progress,J. Steroid. Biochem. Mol. Biol.37 (1990), 167–180.
[29] J. Palmari, C. Dussert, Y. Berthois, C. Penel and P.M. Mar-tin, Distribution of estrogen receptor heterogeneity in growingMCF-7 cells measured by quantitative microscopy,Cytometry27 (1997), 26–35.
[30] J. Palmari, N. Teysseire, C. Dussert and D. Raoult, Image cy-tometry and topographical analysis of proliferation of endothe-lial cells in vitro during Bartonella (Rochalimaea) infection,Anal. Cell. Pathol.11 (1996), 13–30.
[31] L.P. Pertschuk, K.B. Eisenberg, A.C. Carter and J.G. Feldman,Heterogeneity of estrogen binding sites in breast cancer; mor-phologic demonstration of relationship to endocrine response,Breast Cancer Res. Treat.5 (1985), 137–147.
[32] J. P. Raynaud and T. Ojasoo, The design and use of sex steroidantagonists,J. Steroid Biochem.25 (1986), 811–833.
[33] M. Resnicoff, E.E. Medrano, O.I. Podhajcer, A.I. Bravo,L. Bover and L. Mordoh, Subpopulations of MCF-7 cells sepa-rated by Percoll gradient centrifugation: A model to analyse theheterogeneity of human breast cancer,Proc. Natl. Acad. Sci.USA84 (1987), 44–48.
[34] F.J. Rohlf, A probabilistic minimum spanning tree algorithm,Inf. Process. Lett.7 (1978), 44–48.
[35] A. Sapino, F. Pietribiasi, G. Bussolati and P.C. Marchisio,Estrogen- and Tamoxifen-induced rearrangement of cytoskele-tal and adhesion structures in breast cancer MCF-7 cells,Can-cer Res.46 (1986), 2526–2531.
[36] R.J. Sklarew, R. Wali, M. Auger, L.D. Kidd and R.L. Katz, Es-trogen receptor immunostaining patterns imaged in breast can-cer fine needle aspirates,Anal. Quant. Cytol. Histol.16 (1994),293–305.
[37] H.D. Soule, J. Vasquez, A. Long, S. Albert and M. Brennan,A human cell line from a pleural effusion derived from a breastcarcinoma,J. Natl. Cancer Inst.51 (1973), 1409–1416.
[38] F. Wallet, Y. Berthois, P.M. Martin, C. Dussert and J. Palmari,Apport de l’analyse topographique à la microscopie quantita-tive dans l’étude des systèmes cellulaires en culture: applica-tion à l’évaluation des traitements hormonaux,Bull. Cancer6(1997), 589–595.

J. Palmari et al. / Subpopulations remodelling in MCF-7 cells 113
[39] F. Wallet and C. Dussert, Multifactorial comparative study ofspatial point pattern analysis methods,J. Theor. Biol.3016(1997), 437–457.
[40] C.T. Zahn, Graph-theoretical methods for detecting and de-scribing gestalt clusters,IEEE Trans. Comp.c-20 (1971), 68–86.

Submit your manuscripts athttp://www.hindawi.com
Stem CellsInternational
Hindawi Publishing Corporationhttp://www.hindawi.com Volume 2014
Hindawi Publishing Corporationhttp://www.hindawi.com Volume 2014
MEDIATORSINFLAMMATION
of
Hindawi Publishing Corporationhttp://www.hindawi.com Volume 2014
Behavioural Neurology
EndocrinologyInternational Journal of
Hindawi Publishing Corporationhttp://www.hindawi.com Volume 2014
Hindawi Publishing Corporationhttp://www.hindawi.com Volume 2014
Disease Markers
Hindawi Publishing Corporationhttp://www.hindawi.com Volume 2014
BioMed Research International
OncologyJournal of
Hindawi Publishing Corporationhttp://www.hindawi.com Volume 2014
Hindawi Publishing Corporationhttp://www.hindawi.com Volume 2014
Oxidative Medicine and Cellular Longevity
Hindawi Publishing Corporationhttp://www.hindawi.com Volume 2014
PPAR Research
The Scientific World JournalHindawi Publishing Corporation http://www.hindawi.com Volume 2014
Immunology ResearchHindawi Publishing Corporationhttp://www.hindawi.com Volume 2014
Journal of
ObesityJournal of
Hindawi Publishing Corporationhttp://www.hindawi.com Volume 2014
Hindawi Publishing Corporationhttp://www.hindawi.com Volume 2014
Computational and Mathematical Methods in Medicine
OphthalmologyJournal of
Hindawi Publishing Corporationhttp://www.hindawi.com Volume 2014
Diabetes ResearchJournal of
Hindawi Publishing Corporationhttp://www.hindawi.com Volume 2014
Hindawi Publishing Corporationhttp://www.hindawi.com Volume 2014
Research and TreatmentAIDS
Hindawi Publishing Corporationhttp://www.hindawi.com Volume 2014
Gastroenterology Research and Practice
Hindawi Publishing Corporationhttp://www.hindawi.com Volume 2014
Parkinson’s Disease
Evidence-Based Complementary and Alternative Medicine
Volume 2014Hindawi Publishing Corporationhttp://www.hindawi.com
Recommended