Reconstruction of monocotelydoneousproto-chromosomes reveals faster evolutionin plants than in animalsJerome Salsea,1, Michael Abrouka, Stephanie Bolota, Nicolas Guilhota, Emmanuel Courcelleb, Thomas Farautc,Robbie Waughd, Timothy J. Closee, Joachim Messingf, and Catherine Feuilleta
aInstitut National de la Recherche Agronomique, Unite Mixte de Recherche 1095, Genetique, Diversite et Ecophysiologie des Cereales, Universite BlaisePascal, 234 Avenue du Brezet, 63100 Clermont Ferrand, France; bInstitut National de la Recherche Agronomique, Centre National de la RechercheScientifique, Unite Mixte de Recherche 441/2594, Laboratoire des Interactions Plantes-Microorganismes, 31326 Castanet Tolosan, France; cInstitut Nationalde la Recherche Agronomique Unite Mixte de Recherche 444, BP 52627, 31326 Castanet Tolosan, France; dScottish Crop Research Institute, Invergowrie,Dundee, DD2 5DA, Scotland, United Kingdom; eDepartment of Botany and Plant Sciences, 2150 Batchelor Hall, University of California, Riverside, CA92521-0124; and fThe Plant Genome Initiative at Rutgers, Waksman Institute, Piscataway, NJ 08854
Edited by Eviatar Nevo, Institute of Evolution, Haifa, Israel, and approved June 30, 2009 (received for review March 5, 2009)
Paleogenomics seeks to reconstruct ancestral genomes from thegenes of today’s species. The characterization of paleo-duplicationsrepresented by 11,737 orthologs and 4,382 paralogs identified in fivespecies belonging to three of the agronomically most importantsubfamilies of grasses, that is, Ehrhartoideae (rice) Panicoideae (sor-ghum, maize), and Pooideae (wheat, barley), permitted us to proposea model for an ancestral genome with a minimal size of 33.6 Mbstructured in five proto-chromosomes containing at least 9,138 pre-dicted proto-genes. It appears that only four major evolutionaryshuffling events (�, �, �, and �) explain the divergence of these fivecereal genomes during their evolution from a common paleo-ances-tor. Comparative analysis of ancestral gene function with rice as areference indicated that five categories of genes were preferentiallymodified during evolution. Furthermore, alignments between thefive grass proto-chromosomes and the recently identified seveneudicot proto-chromosomes indicated that additional very activeepisodes of genome rearrangements and gene mobility occurredduring angiosperm evolution. If one compares the pace of primateevolution of 90 million years (233 species) to 60 million years of thePoaceae (10,000 species), change in chromosome structure throughspeciation has accelerated significantly in plants.
grasses � paleogenomics
Paleogenomics, the study of ancestral genome structures, allowsthe identification and characterization of mechanisms (e.g.,
duplications, translocations, and inversions) that have shaped ge-nome species during their evolution and provides a framework tobetter integrate results from genetics, genomics, and comparativeanalyses. Studies of fossils and lower taxa organisms [Neanderthal(1), Echinoderms (2), Mammoth (3), Sponge (4), and Moss (5)]have yielded unprecedented information on the evolution of animalspecies and the relationships between them. When fossil DNA isnot available, paleogenomics can be performed through large-scale comparative analyses of actual species and through ancestormodeling.
In silico colinearity studies and ancestral genome reconstructionin mammals have been facilitated by a generally moderate reshuf-fling of chromosomal segments since their divergence from acommon ancestor �130 million years ago (mya) (6–9). Recently,Nakatani et al. (10) provided an integrated view of vertebratepaleogenomics with an ancestor of 10 to 13 proto-chromosomes. Incontrast to mammals, paleogenomics has been poorly investigatedin plants as angiosperm species have undergone serial wholegenome or segmental duplications, diploidization, small-scale re-arrangements (translocations, gene conversions), and gene copyingevents that make comparative studies between and within themonocotyledon (mainly grasses) and eudicot families very chal-lenging. For the eudicots, two scenarios based on comparisons
between the grape, Arabidopsis thaliana, and poplar genome se-quences have been proposed recently. In the first one, the eudicotswere proposed to descend from a paleo-hexaploid ancestor withseven proto-chromosomes (11) whereas, in the second, they orig-inated from a paleo-tetraploid ancestor with seven proto-chromosomes (12). Comparative genomics studies in the monocotsand most particularly in grasses has been the subject of intenseresearch in the past decade (13, 14). Recently, we published anoriginal and robust method for the identification of orthologousregions between genomes as well as for the detection of duplicationswithin genomes based on integrative sequence alignment criteriacombined with a statistical validation (15). This approach has beenapplied to identify paleo-duplications between the rice, wheat,sorghum, and maize genomes and to propose a common ancestorfor the grasses with five proto-chromosomes (15). However, se-quence alignments were performed only between rice and wheat,and the relationships with the maize and sorghum genomes wereestablished using lower resolution, marker-based macrocolinearitystudies. Here, we were able to use a much higher resolution todelineate synteny blocks from sequences of the maize, rice, andsorghum genomes (16, 17), as well as from large sets of geneticallymapped genes in wheat and barley. This difference in resolution wascritical to estimate the size and gene content of the grass ancestralgenome as well as identify classes of genes that were particularlyaffected by rearrangements during the evolution of these species.Finally, comparison of the five monocot proto-chromosomes withthe seven eudicot proto-chromosomes demonstrated the fasterpace of changes in chromosomal structure in the plant versus theanimal kingdom, particularly in respect to conserved gene orderand mobility.
ResultsCereal Genome Synteny and Duplication Pattern. By using alignmentparameters and statistical tests described in ref. 15 we analyzed thesyntenic relationships between the rice, maize, sorghum, wheat, andbarley genomes using various resources as described in SI Appendix.Using rice as a reference genome with 41,046 gene models, weidentified 4,454 maize orthologs (defining 30 syntenic blocks), 6,147sorghum orthologs (12 syntenic blocks), 827 wheat orthologs (13
Author contributions: J.S. designed research; J.S., M.A., and S.B. performed research; N.G.,E.C., T.F., R.W., T.J.C., and J.M. contributed new reagents/analytic tools; J.S., M.A., and S.B.analyzed data; and J.S. and C.F. wrote the paper.
The authors declare no conflict of interest.
This article is a PNAS Direct Submission.
1To whom correspondence should be addressed at: INRA/UBP UMR GDEC 1095, Domainede Crouelle, 234 Avenue du Brezet 63100 Clermont Ferrand, France. E-mail: [email protected].
This article contains supporting information online at www.pnas.org/cgi/content/full/0902350106/DCSupplemental.
14908–14913 � PNAS � September 1, 2009 � vol. 106 � no. 35 www.pnas.org�cgi�doi�10.1073�pnas.0902350106
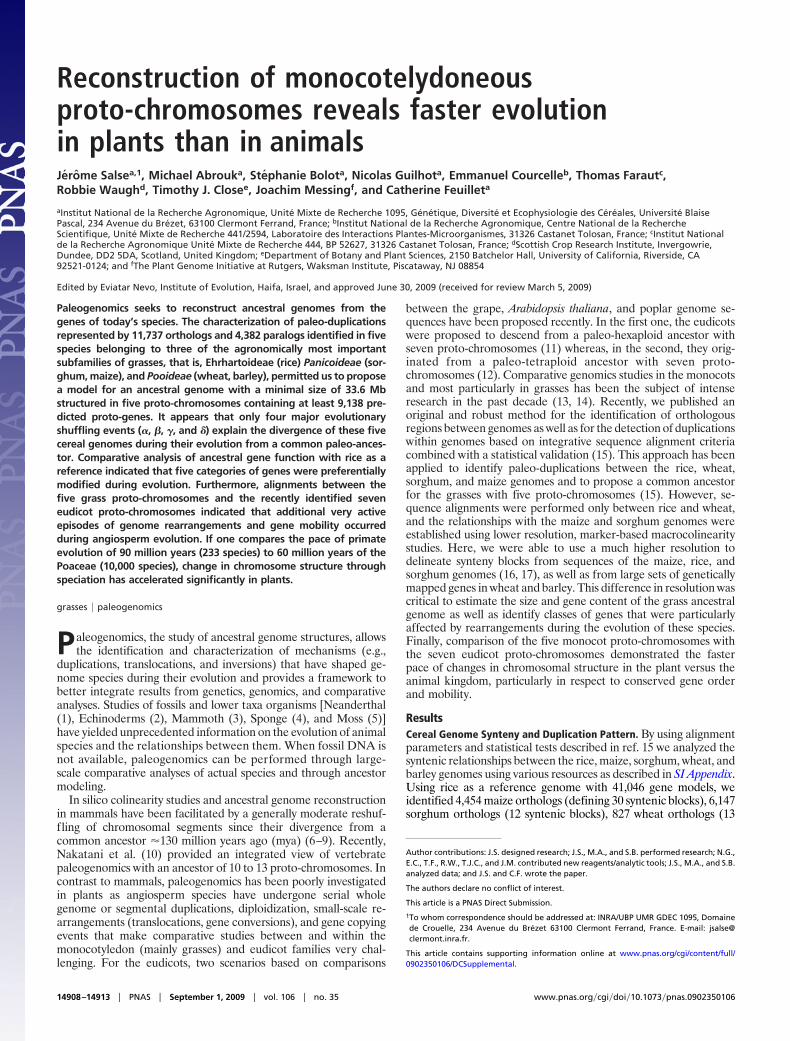
syntenic blocks), and 309 barley orthologs (13 syntenic blocks) (Fig.1A and Fig. S1 in SI Appendix). Thus, similar numbers of syntenicblocks were identified in genomes for which a complete sequenceis available and in those with limited sets of sequence data (e.g.,barley and wheat) thereby demonstrating the efficiency of themethod. In maize, the higher number of blocks reflects the recenttetraploidization of the genome. In total, 11,737 orthologous pairs(Table S1 in SI Appendix) and 68 synteny blocks that covered 99%,82%, 99%, 91%, and 84% of the rice, maize, sorghum, wheat, andbarley genomes, respectively, were observed. A recent comparisonof the sorghum genome with different numbers of gene models forrice and maize identified a set of 11,502 ancestral gene families (17),a number that is very close to ours, indicating the robustness ofsynteny alignments. This result complements and greatly refinesprevious marker-based and low resolution, sequence-based mac-rocolinearity studies [for review Salse and Feuillet (13)], therebyallowing us to better characterize the duplication patterns in thedifferent genomes.
Two methods can be used for the in silico identification andcharacterization of genome duplications. The most robust anddirect approach, called ‘‘intragenome duplication’’ (ID), consists inaligning a genome sequence against itself with stringent alignmentcriteria and statistical validation. We have used it recently to initiatepaleogenomics studies in grasses (15). The second indirect ap-proach, called ‘‘double synteny’’ (DS) or ‘‘doubly conserved syn-teny’’ (DCS), is based on the identification of chromosomal dupli-cations through the detection of regions showing a high proportionof gene matches on two different chromosomes within a genomeand corresponding to two syntenic regions in another genome (forreview, see ref. 13). In this study, we reassessed duplications in the
rice, maize, sorghum, wheat, and barley genomes through a com-bination of ID and DS approaches with the stringent alignmentparameters defined in Salse et al. (15) (SI Appendix). Ten (383paralogs), 17 (3,469 paralogs), 8 (390 paralogs), 10 (102 paralogs),and 9 (38 paralogs) intragenomic duplications were identified andcharacterized in the rice, maize, sorghum, wheat, and barley ge-nomes, respectively (Fig. 1B and Fig. S2 in SI Appendix). In total,54 interchromosomal duplications were characterized individuallyin the five cereal genomes, compared with the 31 previouslyidentified in the rice (18), sorghum (19), barley (20), maize (16), andwheat (21) genomes using the DS approach, illustrating the advan-tage of combining the two methods. They represent 76%, 83%,82%, 73%, and 75% of the rice, maize, sorghum, wheat, and barleygenomes, respectively. Thus, in total, 4,382 paralogous genes wereidentified for the five cereal genomes providing the largest set ofconserved duplicated genes in cereals to date (13, 15).
Integration of the independent analyses of the duplicationswithin and synteny between the 5 major cereal genomes [hereafterreferred to r for rice, m for maize, s for sorghum, and t for theTriticeae (wheat and barley)] allowed us to the characterize moreprecisely the seven shared duplications identified recently amongthe ancestral grass chromosomal groups (15, 22). These paleo-duplications were found on the following chromosome pair com-binations: t4-t5/r11-r12/s5-s8/m2-m4-m1-m3-m10, t1-t3/r5-r1/s9-s3/m6-m8-m3, t1-t4/r10-r3/s1/m1-m5-m9, t2-t4/r7-r3/s2-s1/m2-m7-m1-m9-m5, t2-t6/r4-r2/s6-s4/m2-m10-m4-m5, t5-t7/r9-r8/s2-s7/m2-m7-m1-m4-m10-m6, and t6-t7/r2-r6/s4-s10/m4-m5-m6-m9 (Table S1 inSI Appendix). Sequence similarity comparisons (SI Appendix) of the11,737 orthologous and 4,382 paralogous gene pairs identified in thefive species clearly confirmed the coexistence within each genome
B Wheat[10 blocks
102 paralogs]
w4
Barley[13 blocks – 309 orthologs]
Wheat[13 blocks – 827 orthologs]
Sorghum[12 blocks – 6,147 orthologs]
Maize[30 blocks – 4,454 orthologs]
r1 r2 r3 r4 r5 r6 r7 r8 r9 r10 r11 r12
b1 b2 b3 b4 b5 b6 b7 w1 w2 w3 w4 w5 w6 w7
m1 m2 m3 m4 m5 m6 m7 m8 m9m10s10s9s8s7s6s5s4s3s2s1
RicePivotal Genome
C
rice (383)
sorghum (390)
barley (38)
maize (3,469)
sorghum (6,147)barley (309)
wheat (827)
maize (4,454)
Paralo
gs
Orth
olo
gs
CIP
/CA
LP
cla
sses
Paralog number
Ortholog number
50-70 MyaWGD
Lineagespecific
Duplications
Time scale
70-75
75-80
80-85
85-90
90-95
95-100
50 100 150 200 250 300 800 1,300 1800 2,3000
Barley[9 blocks
38 paralogs]
Rice[10 blocks
383 paralogs]
Sorghum[8 blocks
390 paralogs]
Maize[17 blocks
3,469 paralogs]
w4
w1
w2
w3w5
w6
w7
b6
r1
r2
r3
r4
r5r6
r7
r8
r9
r10
r11
r12 s1
s2
s3
s4
s5s6
s7
s8
s9
s10m1
m2
m3
m4m5
m6
m7
m8
m9m10b1b7
b3
b2
b5
50 100 150 350 550 750 950 1,150 1,350
2,800
w4-w5-w7
r11-r12 WGD
A
b4
Fig. 1. Identification of 11,737 orthologs and 4,382 paralogs in five cereal genomes. (A) Schematic representation of the 11,737 orthologs identified between therice chromosomes (r1 to r12) used as a reference, and the barley (b1 to b7), wheat (w1 to w7), sorghum (s1 to s10), and maize (m1 to m10) chromosomes. Each linerepresents an orthologous gene. The five different colors used to represent the blocks reflect the origin from the five ancestral proto-chromosomes (15). (B) Schematicrepresentation of the 4,382 paralogous pairs identified within the rice (r1 to r12), barley (b1 to b7), wheat (w1 to w7), sorghum (s1 to s10), and maize (m1 to m10)genomes.Each linerepresentsaduplicatedgene.Thedifferentcolors reflect theoriginfromthefiveancestralproto-chromosomes.Black lines represent lineagespecificduplicatedparalogs. (C)Distributionof theaverageCIP/CALPvaluesobservedfor theorthologous (coloredbars)andparalogous (coloredcurves)genes in thefivecerealgenomes. The number of genes in each category (paralogous vs. orthologous) is displayed within five classes (from 70 to 100%) of average CIP/CALP values. The asterisksindicate lineage specific events that affect the distribution, that is, the w1-w5-w7 translocation in wheat, the recent r11-r12 duplication in rice and the tetraploidisation(WGD) in maize. A time scale is provided on the left side of the diagram.
Salse et al. PNAS � September 1, 2009 � vol. 106 � no. 35 � 14909
EVO
LUTI
ON
of ancestral shared duplications and recent lineage-specific dupli-cations (Fig. 1B). Analysis of the distribution of sequence similaritybetween all orthologous gene pairs (Fig. 1C, bars) showed a peakfor average CIP/CALP values of 85–80% which reflects the spe-ciation of the five genomes from a common ancestor 50–70 mya.When the distribution of sequence similarity between paralogousgenes is compared, two peaks are observed (Fig. 1C, curves). Thefirst one (average CIP/CALP value of 85–80%) overlaps with thespeciation of the 5 genomes from a common ancestor 50–70 myathereby reflecting the ancestral shared duplications whereas, thesecond peak (average CIP/CALP value of 100–95%) is a result oflineage-specific and recent duplications such as the r11-r12 dupli-cation in rice and the maize tetraploidisation (Fig. 1C).
To support the use of the comparative analyses in geneticmapping, we developed a user-friendly online Web tool called‘‘Narcisse-Cereals’’ based on the public ‘‘Narcisse’’ platform(23) that allows us to visualize the 11,737 orthologs andthe 4,382 paralogs characterized in the five cereal genomes(www.clermont.inra.fr/umr1095/narcisse�cereals) as well asgain access to the raw data (gene name, sequence, position,and alignment criteria) obtained from the analysis of thesynteny and duplication of the rice, maize, sorghum, wheat,and barley genomes.
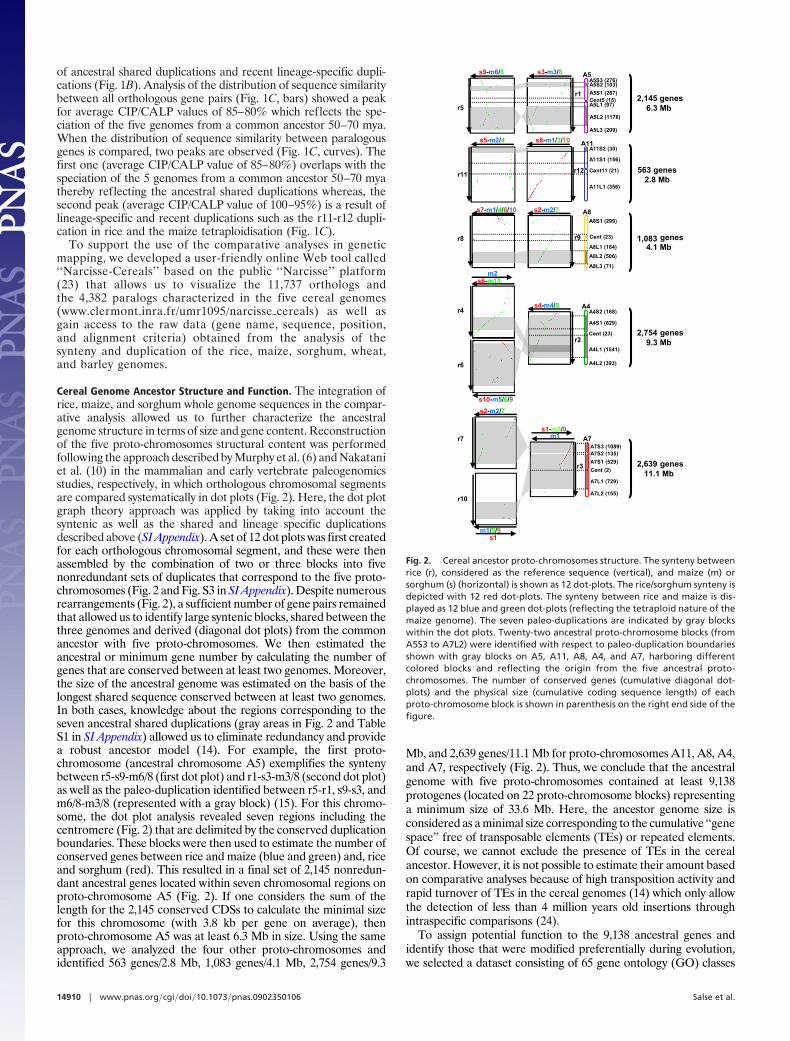
Cereal Genome Ancestor Structure and Function. The integration ofrice, maize, and sorghum whole genome sequences in the compar-ative analysis allowed us to further characterize the ancestralgenome structure in terms of size and gene content. Reconstructionof the five proto-chromosomes structural content was performedfollowing the approach described by Murphy et al. (6) and Nakataniet al. (10) in the mammalian and early vertebrate paleogenomicsstudies, respectively, in which orthologous chromosomal segmentsare compared systematically in dot plots (Fig. 2). Here, the dot plotgraph theory approach was applied by taking into account thesyntenic as well as the shared and lineage specific duplicationsdescribed above (SI Appendix). A set of 12 dot plots was first createdfor each orthologous chromosomal segment, and these were thenassembled by the combination of two or three blocks into fivenonredundant sets of duplicates that correspond to the five proto-chromosomes (Fig. 2 and Fig. S3 in SI Appendix). Despite numerousrearrangements (Fig. 2), a sufficient number of gene pairs remainedthat allowed us to identify large syntenic blocks, shared between thethree genomes and derived (diagonal dot plots) from the commonancestor with five proto-chromosomes. We then estimated theancestral or minimum gene number by calculating the number ofgenes that are conserved between at least two genomes. Moreover,the size of the ancestral genome was estimated on the basis of thelongest shared sequence conserved between at least two genomes.In both cases, knowledge about the regions corresponding to theseven ancestral shared duplications (gray areas in Fig. 2 and TableS1 in SI Appendix) allowed us to eliminate redundancy and providea robust ancestor model (14). For example, the first proto-chromosome (ancestral chromosome A5) exemplifies the syntenybetween r5-s9-m6/8 (first dot plot) and r1-s3-m3/8 (second dot plot)as well as the paleo-duplication identified between r5-r1, s9-s3, andm6/8-m3/8 (represented with a gray block) (15). For this chromo-some, the dot plot analysis revealed seven regions including thecentromere (Fig. 2) that are delimited by the conserved duplicationboundaries. These blocks were then used to estimate the number ofconserved genes between rice and maize (blue and green) and, riceand sorghum (red). This resulted in a final set of 2,145 nonredun-dant ancestral genes located within seven chromosomal regions onproto-chromosome A5 (Fig. 2). If one considers the sum of thelength for the 2,145 conserved CDSs to calculate the minimal sizefor this chromosome (with 3.8 kb per gene on average), thenproto-chromosome A5 was at least 6.3 Mb in size. Using the sameapproach, we analyzed the four other proto-chromosomes andidentified 563 genes/2.8 Mb, 1,083 genes/4.1 Mb, 2,754 genes/9.3
Mb, and 2,639 genes/11.1 Mb for proto-chromosomes A11, A8, A4,and A7, respectively (Fig. 2). Thus, we conclude that the ancestralgenome with five proto-chromosomes contained at least 9,138protogenes (located on 22 proto-chromosome blocks) representinga minimum size of 33.6 Mb. Here, the ancestor genome size isconsidered as a minimal size corresponding to the cumulative ‘‘genespace’’ free of transposable elements (TEs) or repeated elements.Of course, we cannot exclude the presence of TEs in the cerealancestor. However, it is not possible to estimate their amount basedon comparative analyses because of high transposition activity andrapid turnover of TEs in the cereal genomes (14) which only allowthe detection of less than 4 million years old insertions throughintraspecific comparisons (24).
To assign potential function to the 9,138 ancestral genes andidentify those that were modified preferentially during evolution,we selected a dataset consisting of 65 gene ontology (GO) classes
A5L1 (97)
A5S3 (276)
r5
s9-m6/8 s3-m3/8
A11
r11r12
A11L1 (356)
Cent11 (21)
s5-m2/4 s8-m1/3/10
A8
r9r8A8L1 (184)
A8S1 (299)
s7-m1/4/6/10 s2-m2/7
r2
r4
r6
A4
A4S1 (629)
s6-m10
s10-m5/6/9
s4-m4/5
m2
r3
r7
r10
A7
A7S2 (135)
s1m1/5/9
s2-m2/7
m1
Cent5 (15)
A5L3 (209)
A11S1 (156)
A11S2 (30)
Cent (23)
A8L2 (506)
A8L3 (71)
A4S2 (168)
Cent (23)
A4L1 (1541)
A4L2 (393)
A7L1 (729)
A7S1 (529)
Cent (2)
A7S3 (1089)
A7L2 (155)
2,145 genes6.3 Mb
563 genes2.8 Mb
1,083 genes4.1 Mb
2,754 genes9.3 Mb
2,639 genes11.1 Mb
s1-m5/9
A5L2 (1178)
A5S2 (103)
A5S1 (267)
A5
r1
Fig. 2. Cereal ancestor proto-chromosomes structure. The synteny betweenrice (r), considered as the reference sequence (vertical), and maize (m) orsorghum (s) (horizontal) is shown as 12 dot-plots. The rice/sorghum synteny isdepicted with 12 red dot-plots. The synteny between rice and maize is dis-played as 12 blue and green dot-plots (reflecting the tetraploid nature of themaize genome). The seven paleo-duplications are indicated by gray blockswithin the dot plots. Twenty-two ancestral proto-chromosome blocks (fromA5S3 to A7L2) were identified with respect to paleo-duplication boundariesshown with gray blocks on A5, A11, A8, A4, and A7, harboring differentcolored blocks and reflecting the origin from the five ancestral proto-chromosomes. The number of conserved genes (cumulative diagonal dot-plots) and the physical size (cumulative coding sequence length) of eachproto-chromosome block is shown in parenthesis on the right end side of thefigure.
14910 � www.pnas.org�cgi�doi�10.1073�pnas.0902350106 Salse et al.
associated with the 41,046 rice gene models (http://gnn.tigr.org/tdb/e2k1/osa1/GO.retrieval.shtml) and compared it with the relativedistribution of gene ontology in the 9,138 ancestral gene set. Atwo-sample �2 test of proportions was performed with the numberof genes observed in each of the 65 GO classes between the rice andthe ancestor gene contents. A P value �10e�5 was found for 28 GOclasses and was considered to reflect the under-representation ofthese categories between the rice and ancestor genomes. Amongthem, five classes (corresponding to transcription factor activity,transcription, biological process, DNA binding, and structuralmolecule activity) were underrepresented in the ancestor comparedwith the rice genome gene content (Fig. S4 in SI Appendix). Thissuggests that genes in these five classes were affected particularly byancestral and lineage specific rearrangements (mainly duplications)that resulted in additional copies potentially providing a selectiveadvantage during evolution and adaptation.
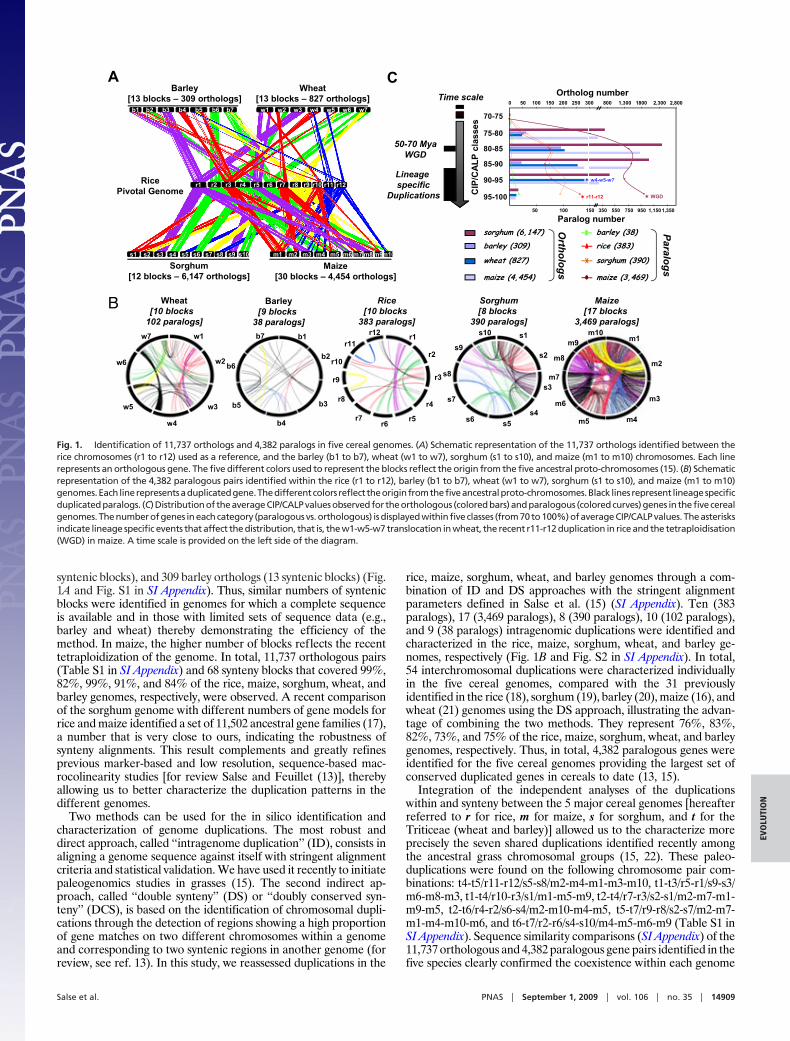
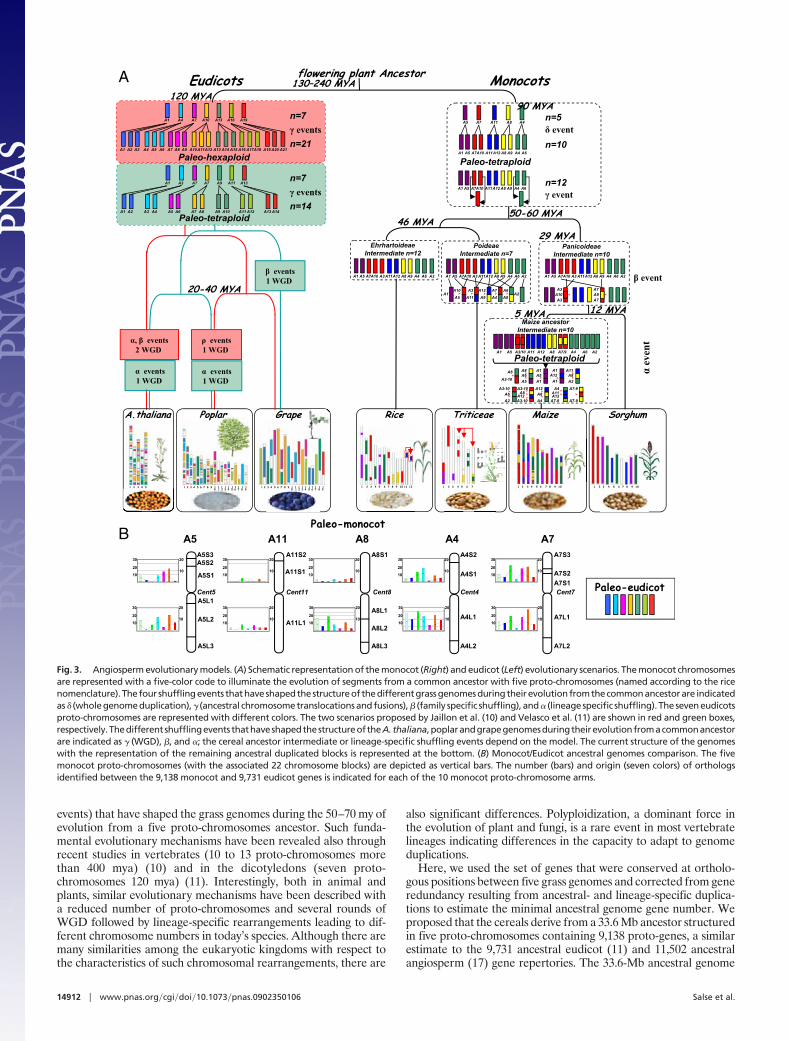
Accelerated Evolution of Flowering Plants. To reconstruct the rice,maize, sorghum, wheat, and barley genomes from the five ancestralproto-chromosomes containing 9,138 genes, we propose an evolu-tionary model that involves 4 major (�, �, �, and �) events namedafter the nomenclature defined in studies of the A. thaliana genomeevolution (25). Before the divergence of the five grass genomes, theancestor with n � 5 proto-chromosomes underwent a wholegenome duplication (WGD) that resulted in an n � 10 chromo-somes intermediate (� event, Fig. 3A). After this tetraploidization,2 interchromosomal translocations and fusions (� event) resulted intwo new chromosomes and an n � 12 intermediate ancestor (Fig.3A). The Panicoideae have evolved from this ancestral 12 chromo-somes genome after two chromosomal fusions (� event) thatresulted in an intermediate ancestor with n � 10 chromosomes (Fig.3A). Then, maize and sorghum evolved independently from thisancestor. Whereas the sorghum genome structure remained similarto the ancestral genome, maize underwent a lineage-specific wholegenome duplication (� event) that produced an intermediate withn � 20 chromosomes. Rapidly, 17 translocations and chromosomefusions led to a final number of 10 chromosomes (Fig. 3A). The �event corresponds to the tetraploidization described in previousstudies (15). In this model, the Ehrhartoideae have retained theoriginal 12 chromosomes and rice underwent lineage specificrearrangements with recent duplications between the r11 and r12chromosomes (as � events in Fig. 3A). Finally, from the interme-diate ancestral genome with 12 chromosomes, the Pooideae under-went 5 chromosomal fusions that resulted in an ancestral Triticeaegenome with n � 7 chromosomes (� event in the Fig. 3A). TheTriticeae (wheat, barley, and rye), represented as a single genomein Fig. 3A, have retained the seven chromosomes as a basicchromosome number and underwent additional minorpolyploidization events, segmental duplications, and translocations.For example, our analysis clearly established that a translocationbetween chromosomes 4 and 5 is common to wheat and barleywhereas the previously reported translocation between chromo-somes 4–7 is shared between the wheat and the rye genome only(15) (Fig. 3A).
Recent paleogenomics analyses within the eudicot family (11, 12,26) led to two models illustrated in Fig. 3A. In the first one, thegrape, Arabidopsis, and poplar genomes derive from a hexaploidancestor with seven proto-chromosomes that underwent one andtwo specific whole genome duplications in poplar and Arabidopsis,respectively, whereas the grape remained unduplicated (11, 26, 27).In the second scenario, the eudicot genomes derive from a tet-raploid ancestor with 7 proto-chromosomes that underwent specificwhole genome duplications in the poplar, grape, and Arabidopsislineages (12). Here, we wanted to exploit knowledge about theeudicots and monocots proto-chromosomes structures to seewhether we can increase our understanding of the events that ledto the divergence between these two main plant lineages. The fivemonocots proto-chromosomes (with 9,138 genes) were aligned with
the seven eudicots proto-chromosomes [with 9,731 genes; Jaillon etal. (11)] using the approach describe previously for the identifica-tion of orthologs between the five cereal genomes. The results (Fig.3B) show no orthologous chromosomal relationships between thefive monocots proto-chromosomes (or chromosome arms or evenchromosome blocks) and the seven eudicot proto-chromosomes.This indicates clearly that macrocolinearity has been largely erodedsince the two major groups of angiosperms diverged from acommon ancestor 150–300 mya and that the lack of colinearityobserved previously between the monocot and dicot genomes wasnot due to a limited dataset or statistical methods but really reflectsan active history of rearrangements during the evolution of theplant genomes.
DiscussionPaleology of the Monocot Chromosome Structural Evolution. As thenumber of sequenced genomes grows, paleogenomics is becomingan increasingly important research area that provides insights intoplant and animal genome evolution. By combining new alignmentcriteria and statistical validation that take into account the geneposition information, we improved the characterization of paralo-gous or orthologous gene pairs previously identified in cereals withless stringent methods such as orthoMCL (28), INPARANOID(29) and MCscan (26). The conserved genes constitute syntenicblocks (characterized by the distance between two genes and thenumber of genes within a block) that then can be efficiently used toinfer ancestral relationships even in the absence of completecontiguous genome sequences, such as barley and wheat. Whentaking this analysis into the perspective of parallel evolution of theplant and animal kingdoms, our data suggest that plants genomeswere affected by more rapid changes in chromosomal architectureand frequency of manifesting these changes in speciation thanmammalian genomes. We would attribute these features to theevolution of DNA replication and repair mechanisms in plants thathave to account for the immobility of plants versus animals andtheir vulnerability to environmental changes.
We show that overall, among 73% of homologous genes identi-fied between the five cereal genomes (i.e., 27% of species-specificgenes, so called orphans, or possibly artefacts of genome annota-tion), only 12.8% are still conserved at orthologous positions (i.e.,87.2% of gene transposition) after 50–70 my of evolution, demon-strating a high rate of gene translocation in these genomes. This isa much higher rate than previously reported (�50%) with smallerdatasets (30), which is likely due to the conservative approach wehave used in this study or inflated gene counts in previous wholegenome annotation projects. In any case, polyploidization (either aspart of whole genome duplications or genome hybridizations) andthe degree of gene copying events appear to be major factorsinvolved in the deterioration of syntenic relationships in plantgenomes (31). Freeling et al. (32) reported recently that up to 75%of the genes in Arabidopsis transposed after the origin of theBrassicale, compared with 87.2% estimated in the current analysis.The authors suggest that negative (i.e., purifying) selection mayremove transposed copies of members of some gene familiespreferentially, whereas positive selection favors transposition ofcopies from other gene families. Our data confirm these observa-tions and support the hypothesis that genome plasticity resultingfrom high gene transposition frequency offers the opportunity topositively select useful physical gene interaction considered selec-tively advantageous and to remove any other combinations con-sidered selectively deleterious.
The characterization of the largest number of orthologs (11,737)and paralogs (4,382) within a single analysis across five cerealgenomes and the identification of shared (seven paleo-duplications)and lineage specific duplications, allowed us to describe preciselyfour successive evolutionary events, � (whole genome duplicationevent), � (cereal ancestor shuffling events), � (cereal ancestorintermediate shuffling events), and � (lineage-specific shuffling
Salse et al. PNAS � September 1, 2009 � vol. 106 � no. 35 � 14911
EVO
LUTI
ON
events) that have shaped the grass genomes during the 50–70 my ofevolution from a five proto-chromosomes ancestor. Such funda-mental evolutionary mechanisms have been revealed also throughrecent studies in vertebrates (10 to 13 proto-chromosomes morethan 400 mya) (10) and in the dicotyledons (seven proto-chromosomes 120 mya) (11). Interestingly, both in animal andplants, similar evolutionary mechanisms have been described witha reduced number of proto-chromosomes and several rounds ofWGD followed by lineage-specific rearrangements leading to dif-ferent chromosome numbers in today’s species. Although there aremany similarities among the eukaryotic kingdoms with respect tothe characteristics of such chromosomal rearrangements, there are
also significant differences. Polyploidization, a dominant force inthe evolution of plant and fungi, is a rare event in most vertebratelineages indicating differences in the capacity to adapt to genomeduplications.
Here, we used the set of genes that were conserved at ortholo-gous positions between five grass genomes and corrected from generedundancy resulting from ancestral- and lineage-specific duplica-tions to estimate the minimal ancestral genome gene number. Weproposed that the cereals derive from a 33.6 Mb ancestor structuredin five proto-chromosomes containing 9,138 proto-genes, a similarestimate to the 9,731 ancestral eudicot (11) and 11,502 ancestralangiosperm (17) gene repertories. The 33.6-Mb ancestral genome
B A5
A5L1
A5S3A5S2
A5S1
Cent5
A5L3
A5L2
A11
A11L1
Cent11
A11S2
A8
A8L1
A8S1
Cent8
A8L2
A8L3
A4
A4S1
A4S2
Cent4
A4L2
A7
A7S2
A7L1
A7S1Cent7
A7S3
A7L2
A11S1
A4L1
Paleo-monocot
Paleo-eudicot0
2
4
6
8
2
10
20
30
10
20
10
20
30
10
20
10
20
30
10
20
10
20
30
10
20
10
20
30
10
20
10
20
30
10
20
10
20
30
10
20
10
20
30
10
20
10
20
30
10
20
10
20
30
10
20
MonocotsEudicots 130–240 MYA
50-60 MYA
EhrhartoideaeIntermediate n=12
A7A10 A11A12A3
PoideaeIntermediate n=7
PanicoideaeIntermediate n=10
A8 A9 A4 A6
46 MYA
A1 A5 A7A10 A11A12A3 A8 A9 A4 A6 A2A2
A1A5
A10
A11
A3
A9
A12
A4
A7
A8
A6A2
29 MYA
A1 A5 A7A10 A11A12A3 A8 A9 A4 A6 A2
A10A3
A7A9
12 MYAMaize ancestor
Intermediate n=10
5 MYA
A6
A3-10
A5 A7 A11 A8 A4
A1 A5 A7A10 A11A12 A8 A9 A4 A6
A1 A5 A7A10 A11A12 A8 A9 A4 A6
90 MYAn=5
n=10
n=12
δ event
γ event
β event
αev
ent
20-40 MYA
Paleo-hexaploid Paleo-tetraploid
A1 A2 A3 A4 A5 A6 A7 A8 A9 A10 A11A12 A13 A14 A15 A16 A17A18 A19 A20 A21
120 MYA
A8A6
A5
A1A5
A1
A1A12
A1
A11A8
A2
A3-10
A6
A2
A3-10A8
A12A3-10
A12
A8
A4
A4A11A12
A7-9
A7-9
A7-9
1 2 3 4 5 6 7 8 9 1 1 1 1 1 1 1 1 1 10 1 2 3 4 5 6 7 8 9
1 2 3 4 5 1 2 3 4 5 6 7 8 9 10 11 12
n=7
n=21
α, β events2 WGD
ρ events1 WGD
A1 A5
γ events
1 2 3 4 5 6 7 8 9 10
α events1 WGD
α events1 WGD
1 2 3 4 5 6 7
Paleo-tetraploidA1 A2 A3 A4 A5 A6 A7 A8 A9 A10 A11 A12 A13 A14
n=7
n=14
γ events
β events1 WGD
A flowering plant Ancestor
A1 A4 A7 A10 A13 A16 A19
1 2 3 4 5 6 7 8 9 101 2 3 4 5 6 7 8 9 1 1 1 1 1 1 1 1 1 10 1 2 3 4 5 6 7 8 9
Poplar Grape Rice SorghumTriticeae MaizeA.thaliana
A3
A7
A3/10A1 A5 A11 A12 A8 A7/9 A4 A6 A2
Paleo-tetraploid
A1 A3 A7 A7 A9 A11 A13
Fig. 3. Angiosperm evolutionary models. (A) Schematic representation of the monocot (Right) and eudicot (Left) evolutionary scenarios. The monocot chromosomesare represented with a five-color code to illuminate the evolution of segments from a common ancestor with five proto-chromosomes (named according to the ricenomenclature). Thefour shufflingevents thathaveshapedthestructureof thedifferentgrassgenomesduringtheirevolutionfromthecommonancestorare indicatedas � (whole genome duplication), � (ancestral chromosome translocations and fusions), � (family specific shuffling), and � (lineage specific shuffling). The seven eudicotsproto-chromosomes are represented with different colors. The two scenarios proposed by Jaillon et al. (10) and Velasco et al. (11) are shown in red and green boxes,respectively.Thedifferentshufflingevents thathaveshapedthestructureoftheA.thaliana,poplarandgrapegenomesduringtheirevolutionfromacommonancestorare indicated as � (WGD), �, and �; the cereal ancestor intermediate or lineage-specific shuffling events depend on the model. The current structure of the genomeswith the representation of the remaining ancestral duplicated blocks is represented at the bottom. (B) Monocot/Eudicot ancestral genomes comparison. The fivemonocot proto-chromosomes (with the associated 22 chromosome blocks) are depicted as vertical bars. The number (bars) and origin (seven colors) of orthologsidentified between the 9,138 monocot and 9,731 eudicot genes is indicated for each of the 10 monocot proto-chromosome arms.
14912 � www.pnas.org�cgi�doi�10.1073�pnas.0902350106 Salse et al.
size is also consistent with the estimate of Bennett and Leitch (33),who suggested a minimal angiosperm genome without duplicatedgene copies and repeated elements of maximum 50 Mb, based ona 1C-value of 157 Mb for A. thaliana as a reference.
The pace of gene mobility in plants becomes obvious if onedraws from chromosomal alignments of species separated by 300my of evolution between monocots and eudicots ancestors. Here,gene order has deteriorated to a degree that no synteny blockscan be identified anymore. These results shed light on previousanalyses of synteny between Arabidopsis and rice where syntenywas detected only at the micro level for a few (�100) loci(34–36). The results obtained through comparisons between theeudicot and monocot proto-chromosomes demonstrate that, incontrast to animal genomes, it is not possible to identify syntenyat the genome or chromosome levels across plant classes.
Evolutionary Fitness of the Protogene Battery. Comparison of an-cestral gene contents with those of current genomes permits theidentification of ‘‘duplication-sensitive’’ gene families (for which 1paralogous copy is lost in 1 genome compared with the others) and‘‘duplication-resistant’’ gene families (for which paralogous copiesare maintained leading to copy number amplification) (26). Fromthe established monocot ancestor structure and using the rice geneontology (GO) as a reference, analysis of the evolution of the 9,138ancestral grass genome gene set showed that 5 major GO classes areduplication-resistant as they have been subjected particularly toduplications resulting in additional copies that potentially provideda selective advantage during evolution and adaptation. Interest-ingly, these duplication-resistant genes have been conserved indifferent genomes since the ancestral whole genome duplication �event.
Our results for the monocot ancestor are consistent with theresults obtained by Paterson and colleagues for the eudicots whoshowed that duplication-resistant gene families correspond to tran-scriptional regulators that are retained more significantly afterWGD events (26, 32, 37). We recently demonstrated that within the
10 major paleo-duplications that cover 47.8% of the rice genome,only 12.6% of paralogous gene pairs are still conserved within sisterblocks, leading to the conclusion that pseudogenization (loss of onecopy) occurred for the vast majority of the paralogous pairs (87.4%)during 50–70 my of evolution (38). In contrast, genes that may notprovide a selective advantage when duplicated would be restoredrapidly to a singleton status. Thus, our data support previousfindings in the eudicots and suggest preferential retention ofduplicated genes involved in signal transduction, and transcription,in response to rapidly changing biotic and abiotic extrinsic factorscompared with genes encoding products involved in relativelystable processes.
Additional sequences from other grass (i.e., Brachypodium) andnon-cereal monocot genomes such as Musa acuminata (banana) orAnanas comosus (pineapple), along with sequences of basal eud-icots such as Eschscholzia california (california poppy) or Papaversomnifera (opium poppy) and Aquile giaformosa (columbine), andbasal angiosperms such as Amborella trichopoda will further im-prove the accuracy of the paleogenomics studies in the majorangiosperm clades and help to refine our model of plant genomeevolution.
Materials and MethodsDetailsaboutthematerialsandmethodsusedfortheanalysis regarding(i)nucleicacid sequence alignments, (ii) genome sequence databases, (iii) identification ofduplicated and syntenic regions, (iv) graphical display, and (v) ancestor genomereconstruction can be found in SI Appendix. Enlarged resolution format of thefigures is also available in SI Appendix.
ACKNOWLEDGMENTS. We thank Prasanna R. Bhat, Stefano Lonardi, YonghuiWu, Steve Wanamaker, Nils Rostoks, Luke Ramsay, Nils Stein, Jan T. Svensson,Serdar Bozdag, Matthew Moscou, Rajeev Varshney, Kazuhiro Sato, and DavidMarshall for their contributions of generating the barley resources. We alsogratefully acknowledge Olivier Jaillon and Jerome Gouzy for fruitful discussions.This work was supported by Agence Nationale de la Recherche Grant ANR-05-BLANC-0258–01 from Institut National de la Recherche Agronomique (to C.F.),theUSDABarleyCAP,U.K.-LINKAGOUEB,NationalScienceFoundationDBIGrant0321756, USDA-CSREES-NRI Grant 2006–55606-16722 (to T.J.C.), and the SelmanA. Waksman Chair in Molecular Genetics (to J.M.).
1. Green RE, et al. (2008) A complete Neandertal mitochondrial genome sequence deter-mined by high-throughput sequencing. Cell 134:416–426.
2. Bottjer DJ, et al. (2006) Paleogenomics of echinoderms. Science 314:956–960.3. Poinar HN, et al. (2006) Metagenomics to paleogenomics: Large-scale sequencing of
mammoth DNA. Science 311:392–394.4. Jackson DJ, et al. (2007) Sponge paleogenomics reveals an ancient role for carbonic
anhydrase in skeletogenesis. Science 316:1893–1895.5. Rensing SA, et al. (2008) The Physcomitrella genome reveals evolutionary insights into the
conquest of land by plants. Science 319:64–69.6. Murphy WJ, et al. (2004) Mammalian phylogenomics comes of age. Trends Genet
20:631–639.7. Ferguson-Smith MA, Trifonov V (2007) Mammalian karyotype evolution. Nat Rev
8:950–962.8. Lopez Rascol V, et al. (2007) Ancestral animal genomes reconstruction. Curr Op Immunol-
ogy 19:542–546.9. Bininda-Emonds OR, et al. (2007) The delayed rise of present-day mammals. Nature
446:507–512.10. Nakatani Y, et al. (2007) Reconstruction of the vertebrate ancestral genome reveals
dynamic genome reorganization in early vertebrates. Genome Res 17:1254–1265.11. Jaillon O, et al. (2007) The grapevine genome sequence suggests ancestral hexaploidiza-
tion in major angiosperm phyla. Nature 449:463–467.12. Velasco R, et al. (2007) A high quality draft consensus sequence of the genome of a
heterozygous grapevine variety. PLoS One 2:e1326.13. Salse J, Feuillet C (2007) In Comparative Genomics of Cereals, ed Varshney RK, Tuberosa R
(Springer, Amsterdam), pp 177–205.14. Messing J, Bennetzen J (2008) Grass genome structure and evolution. Genome Dynamics
4:41–56.15. SalseJ,etal. (2008) Identificationandcharacterizationofsharedduplicationsbetweenrice
and wheat provide new insight into grass genome evolution. Plant Cell 20:11–24.16. Wei F, et al. (2007) Physical and genetic structure of the maize genome reflects its complex
evolutionary history. PLoS Genet 3:e123.17. Paterson AH, et al. (2009) The Sorghum bicolor genome and the diversification of grasses.
Nature 457:551–556.18. Yu J, et al. (2005) The genomes of Oryza sativa: A history of duplications. PLoS Biol 3:e38.19. Paterson AH, et al. (2004) Ancient polyploidization predating divergence of the cereals,
and its consequences for comparative genomics. Proc Natl Acad Sci USA 101:9903–9908.20. Stein N, et al. (2007) A 1,000-loci transcript map of the barley genome: New anchoring
points for integrative grass genomics. Theor Appl Genet 114:823–839.21. SinghNK,etal. (2007)Single-copygenesdefineaconservedorderbetweenriceandwheat
forunderstandingdifferencescausedbyduplication,deletion,andtranspositionofgenes.Funct Integr Genomics 7:17–35.
22. Bolot S, et al. (2008) The ‘inner circle’ of the cereal genomes. Curr Opin Plant Biol12:1–7.
23. Courcelle E, et al. (2008) Narcisse: A mirror view of conserved syntenies. Nucleic Acids Res36:485–490.
24. Chantret N, et al. (2005) Molecular basis of evolutionary events that shaped the hardnesslocus in diploid and polyploid wheat species (Triticum and Aegilops). Plant Cell 17:1033–1045.
25. Blanc G, Wolfe KH (2004) Widespread paleopolyploidy in model plant species inferredfrom age distributions of duplicate genes. Plant Cell 16:1667–1678.
26. Tang H, et al. (2008) Unraveling ancient hexaploidy through multiply aligned angiospermgene maps. Genome Res 18:1944–1954.
27. Ming R, et al. (2008) The draft genome of the transgenic tropical fruit tree papaya (Caricapapaya Linnaeus). Nature 452:991–996.
28. Li L, et al. (2003) OrthoMCL: Identification of ortholog groups for eukaryotic genomes.Genome Res 13:2178–2189.
29. O’Brien KP, et al. (2005) Inparanoid: A comprehensive database of eukaryotic orthologs.Nucleic Acids Res 33:476–480.
30. Song R, et al. (2002) Mosaic organization of orthologous sequences in grass genomes.Genome Res 12:1549–1555.
31. Xu JH, Messing J (2008) Organization of the prolamin gene family provides insight into theevolution of the maize genome and gene duplications in grass species. Proc Natl Acad SciUSA 105:14330–14335.
32. Freeling M, et al. (2008) Many or most genes in Arabidopsis transposed after the origin ofthe order Brassicales. Genome Res 18):1924–1937.
33. Bennett MD, Leitch IJ (2005) Nuclear DNA amounts in angiosperms: Progress, problemsand prospects. Ann Bot 95:45–90.
34. Salse J, et al. (2002) Synteny between Arabidopsis thaliana and rice at the genome level:A tool to identify conservation in the ongoing rice genome sequencing project. NucleicAcids Res 30:2316–2328.
35. Vandepoele K, et al. (2002) The automatic detection of homologous regions (ADHoRe)and its application to microcolinearity between Arabidopsis and rice. Genome Res12:1792–1801.
36. Wang X, et al. (2006) Statistical inference of chromosomal homology based ongene colinearity and applications to Arabidopsis and rice. BMC Genomics12:447.
37. Seoighe C, Gehring C (2004) Genome duplication led to highly selective expansion of theArabidopsis thaliana proteome. Trends Genet 20:461–464.
38. Throude M, et al. (2009) Structure and expression analysis of rice paleo-duplications.Nucleic Acid Res 37:1248–1259.
Salse et al. PNAS � September 1, 2009 � vol. 106 � no. 35 � 14913
EVO
LUTI
ON
Recommended